Article

Marine Oil Spill Detection Based on the Comprehensive Use of Polarimetric SAR Data

1
Faculty of Information Technology, Beijing University of Technology, Beijing 100124, China
2
National Astronomical Observatories, Key Laboratory of Lunar and Deep-Exploration, Chinese Academy of Sciences, Beijing 100101, China
*
Author to whom correspondence should be addressed.
Sustainability 2018, 10(12), 4408; https://doi.org/10.3390/su10124408
Submission received: 19 October 2018 / Revised: 19 November 2018 / Accepted: 21 November 2018 / Published: 26 November 2018

Abstract

:
As a major marine pollution source, oil spills largely threaten the sustainability of the coastal environment. Polarimetric synthetic aperture radar remote sensing has become a promising approach for marine oil spill detection since it could effectively separate crude oil and biogenic look-alikes. However, on the sea surface, the signal to noise ratio of Synthetic Aperture Radar (SAR) backscatter is usually low, especially for cross-polarized channels. In practice, it is necessary to combine the refined detail of slick-sea boundary derived from the co-polarized channel and the highly accurate crude slick/look-alike classification result obtained based on the polarimetric information. In this paper, the architecture for oil spill detection based on polarimetric SAR is proposed and analyzed. The performance of different polarimetric SAR filters for oil spill classification are compared. Polarimetric SAR features are extracted and taken as the input of Staked Auto Encoder (SAE) to achieve high accurate classification between crude oil, biogenic slicks, and clean sea surface. A post-processing method is proposed to combine the classification result derived from SAE and the refined boundary derived from VV channel power image based on special density thresholding (SDT). Experiments were conducted on spaceborne fully polarimetric SAR images where both crude oil and biogenic slicks were presented on the sea surface.

1. Introduction

Offshore transportation of crude oil plays a very important role in oil transportation. With the development of the global economy, the volume of marine oil transportation has increased rapidly. The growing density of ships and tankers enlarges the possibility of marine oil spill accidents, which may severely threaten the marine environment. Moreover, accidents taking place at an oil rig, coastal oil pipelines, and deliberate discharge of tank cleaning wastewater are also major sources of marine oil spill pollution [1,2].
Under particular weather and oceanographic conditions, oil spills off the shore may spread and reach the shoreline very quickly, driven by the action of the winds, currents and waves [3,4,5]. Frequent and accurate surveillance of marine oil spill helps its response/treatment and provide evidence to prosecute the polluters. Synthetic aperture radar is one of the most suitable methods for marine oil spills detection for its sensitivity to marine oil slicks and all day all weather observation capabilities [6,7].
Oil film on the sea surface has different viscosity compared with water, which attenuates the short gravity wave and capillary wave [8,9]. The roughness of the sea surface is reduced on oil-covered areas, and hence lower radar backscattering of the sea surface is observed [10]. As the result, in SAR images, oil slicks are observed as dark area (black spots). However, some other phenomenon (called look-alikes) are also observed as a dark area in SAR images, among which biogenic slicks produced by algae or sea animals is one of the most common ones [11,12]. Luckily, as a kind of mono molecule film, biogenic slicks damp the sea surface roughness in a different way compared to crude oil, which could be observed by polarimetric SAR sensors [13]. Polarimetric SAR is a kind of advanced SAR sensor that transmits radar signal with different polarization states, by analyzing the coherently recorded backscattering signal at different polarization bases, the polarimetric scattering mechanism of the ground target can be obtained [14]. For crude oil-covered sea surface, Bragg scattering is damped, and non-Bragg scattering takes the place, resulting in strong depolarization effect. On the other hand, for biogenic slick covered area, Bragg scattering is still dominated [15,16]. In this way, crude oil and biogenic look-alikes can be distinguished.
There are several oil spill monitoring systems in operation. Such as CleanSeaNet by the European Maritime Safety Agency (EMSA); ISTOP (Integrated Satellite Tracking of Pollution) by Canadian Ice Service; Semi-automatic SAR oil spill detection system developed by Konsberg Satellite Services, Norway, and Ocean Monitoring Workstation developed by Satlantic Inc. Canada. State Oceanic Administration of China also developed SAR satellite-based oil spill monitoring system and used it to regularly monitor the Bohai Sea since 2009. However, these systems mainly used the intensity of the radar backscatter to detection oil slicks, which has limited performance on distinguishing crude oil and biogenic slicks without auxiliary information. This has been demonstrated in our previous analysis [12].
Although the effectiveness of polarimetric SAR images in oil spills detection has been proved in some studies, up till now there is still not an operational framework for oil spills detection based on polarimetric SAR. The speckled nature of SAR images, the complexly of polarimetric features and sea surface conditions and the relatively low signal to noise ratio (SNR) of sea surface radar backscatter, still challenging the accurate detection of marine oil slicks [17,18]. Polarimetric filters can effectively reduce the speckle by taking advantage of the statistical characterization of distributed targets. It is necessary to analyze the effect of various polarimetric filters on the information retrieval process for oil spill detection.
Some studies manifest that deep learning architectures do not need the input features to be much preprocessed since they have superb built-in capabilities of feature optimization. Most relative studies are conducted on optical images, to analyze this critical issue on polarimetric SAR features is important for marine oil spills detection and classification.
On sea surface, the SNR of the co-polarized channel is much stronger than that of the cross-polarized channel, based on which a better slick-sea boundary can be derived [17]. Therefore, it is promising to establish a post-processing step to combine the refined detail of slick-sea boundary derived from the co-polarized channel and the highly accurate crude slick/look-alike classification result obtained through polarimetric analysis.
In this paper, an architecture for marine oil spill detection is proposed. The effect of different polarimetric SAR filters on marine polarimetric SAR images are compared. Polarimetric SAR features are extracted and taken as the input of Stacked Auto Encoder (SAE) to achieve high accurate classification between crude oil, biogenic slicks and clean sea surface. A post-processing method is proposed to combine the classification result derived from SAE and the refined boundary derived from VV channel power image based on spacial density thresholding (SDT).

2. Theory and Methods

2.1. Fundamentals of Polarimetric SAR

Quad-Polarimetric SAR Mode

The scattered and incident electromagnet fields (EM) are recorded by SAR systems:
E s = e j k r r S E i
where S is scattered matrix to link the incidence and scattered Jones vectors Ei and Es. Based on Jones vectors of the received signal, the Stokes vector can be received.
g = [ g 0 g 1 g 2 g 3 ] = [ | E v | 2 + | E h | 2 | E v | 2 | E h | 2 2 Re E h E v * 2 Im E h E v * ]
where Eh and Ev stands for electric field signal received in horizontal and vertical polarization channels respectively.
For quad-polarized SAR system, S is a 2 × 2 matrix, which can be described by:
S = ( S H H S H V S V H S V V )
where the transmitted and the received polarization are given in subscript (H for horizontal and V for vertical). Based on these two orthogonal bases, signals of any transmitting/receiving polarization configurations can be simulated. As the result, quad-polarized SAR mode is also called “fully polarimetric SAR”.
The covariance matrix reflects the second order statistics of the radar backscatter, which can be derived from the scatter matrix by:
C = ( S H H 2 2 S H H S H V * S H H S V V * 2 S H V S H H * 2 S H V 2 2 S H V S V V * S V V S H H * 2 S V V S H V * S V V 2 )
where * stands for conjugate and “< >” means multi-look with an averaging window. In this study, different filters are applied to achieve the spacial multi-look.
The coherence matrix T can be derived from the scattering matrix or the covariance matrix by:
T = ACA T
where
A = [ 1 0 1 1 0 1 0 2 0 ]
Based on the decomposition of the 3 × 3 coherence matrix T of the target, the eigenvalues and eigenvector can be derived:
T = U 3 [ λ 1 λ 2 λ 3 ] U 3 H
where H stands for transpose conjugate, and U3 can be parameterized by:
U 3 = [ cos ( α 1 ) e j ϕ 1 cos ( α 2 ) e j ϕ 2 cos ( α 3 ) e j ϕ 3 cos ( α 1 ) cos ( β 1 ) e j δ 1 sin ( α 2 ) cos ( β 2 ) e j δ 2 sin ( α 3 ) cos ( β 3 ) e j δ 3 sin ( α 1 ) sin ( β 1 ) e j γ 1 sin ( α 2 ) sin ( β 2 ) e j γ 2 sin ( α 3 ) cos ( β 3 ) e j γ 3 ]

2.2. Polarimetric Filters

The coherent processing of SAR imaging algorithm inevitably introduces speckle. The speckle usually affects the visual and quantitative interpretation of SAR images, so it is also called the term “speckle-noise”. However, different from factors like thermal noise and cross-talk, speckle is not actually “noise” and contain some unique information of the distributed ground targets. It is the result of constructive or destructive superposition of backscatter from small facet within a resolution cell. As a result, whether it is necessary to implement polarimetric filtering in oil spills detection need to be analyzed. In this study, three different kinds of polarimetric SAR filters are considered:

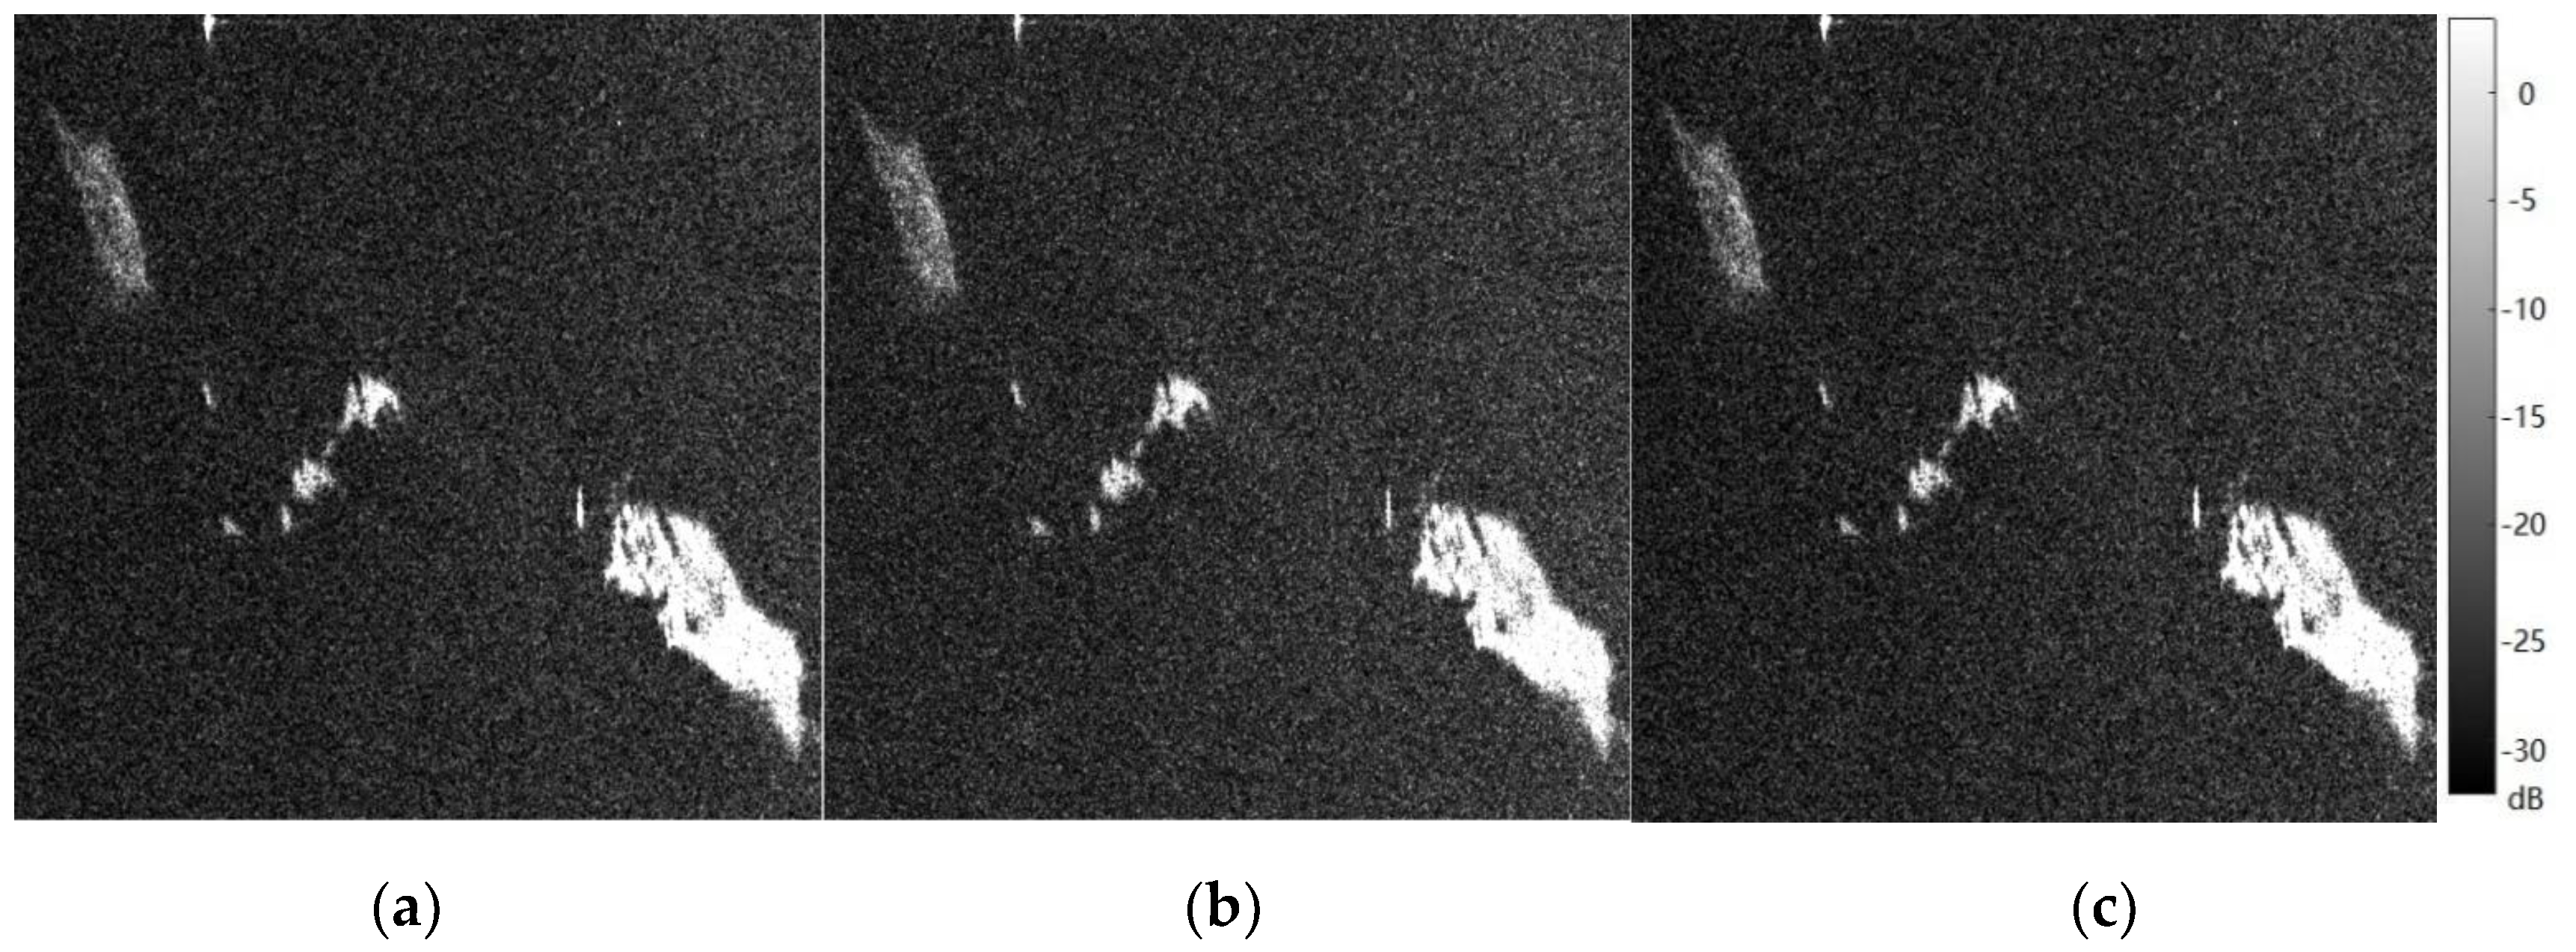
2.2.1. Boxcar Filter

Boxcar filter is easy to be implemented and widely used in SAR image preprocessing. It uses a moving window to slide over the whole image and designate the mean value within the window to the pixel on the centre. Boxcar filter can be applied on C or T matrix of polarimetric SAR data. Image and real parts in C and T matrix are filtered separately:
X ˜ i , j = Y i , j N = 1 N 2 p = ( N 1 ) / 2 ( N 1 ) / 2 q = ( N 1 ) / 2 ( N 1 ) / 2 Y i + p , i + q
where N is the size of the sliding window, i, j are elements in the ith row and jth column of the image to be filtered.
Although the boxcar filter is easy to use, it has the deficiency of smearing edges and degrading the image quality. It fails to keep the texture details of ground target especially when the distribution of scatters is not homogeneous. Hence to preserve features, edge sharpness and point-like targets in polarimetric SAR image, the local statistics filter should be used to smooth the target by its homogeneous neighbouring pixels.

2.2.2. Refined Lee

The refined Lee filter uses edge-aligned, non-square windows with a local statistics filter to preserve the details of SAR image [19]. The main procedure of refined Lee filter includes:
(a)
Selecting a nonsquare window to match the direction of edges in the span image;
(b)
Applying local statistics filter to the span image based on the multiplicative noise model;
(c)
Using the window directions and weight derived in (a) and (b) to filter the whole covariance matrix.
Refined Lee filter could preserve polarimetric information in homogeneous areas well. However, since the same filtering weight is applied to filter all elements of the covariance, it may introduce crosstalk.

2.2.3. Lopez Filter

Lopez filter is based on the speckle model of the SAR data [20]. The diagonal elements of the sample covariance matrix C are processed by using a multi-look filtering approach. The off-diagonal elements are filtered based on the polarimetric model, which consider the nature of the speckle for every off-diagonal element as a combination of a multiplicative noise and a complex additive component. Both of them are functions of the complex coefficient among different polarimetric channels. The complex correlation coefficient is also estimated by using a multi-look. Then the complex additive speckle noise and multiplicative component can be filtered out. Lopez’ filter could keep the spatial resolution (especially of point scatterers), while suppressing the speckle noise, which boosts the estimation of polarimetric information.

2.3. Polarimetric Features for Marine Oil Spills Detection

It has been proved by previous studies that polarimetric features could greatly help in distinguishing crude oil and its biogenic look-alikes. In this study, ten features are considered as the input of the classifier, their definition and characteristics for different sea surface targets are listed in Table 1.

2.4. Deep Learning Classification Algorithm

In this paper, a kind of deep neural network—Stacked-autoencoder (SAE) is considered as the classification algorithm, since it has been proved in previous studies to have the best performance on oil spills detection based on polarimetric SAR data [21]. Deep neural networks have very good capability in fitting complex functions. SAE is capable of initializing the weights of the network in a region nearer to its local minimum. Therefore, better classification accuracy and efficiency compared with ordinary neural networks could be achieved by SAE, especially when the number of training data is limited.
The autoencoder is composed of three layers, namely, an input layer, a hidden layer and an output layer [22]. From the input layer to the output of the hidden layer, the input signal is encoded. The aims of the Auto-Encoder are to minimize the difference between the input x and output y. In this way, the hidden layer can be seen as the representations of relevant high-level abstraction of input vectors. The auto-encoders are stacked by taking the output of the hidden layers as the input of its successive auto-encoder. The pretraining process uses greedy unsupervised layer-wise training strategy. The output of the last auto-encoder is connected to the classifier such as support vector machine or softmax classifier, to derive the desired classification result. The last layer of the Stacked Auto-Encoder is usually connected to a classifier, such as neural network, Softmax classifier, SVM, etc. Then the fine-tuning process based on the advantage of the label information of the data sample is taken. It can be conducted on either the whole network or only the classifier.

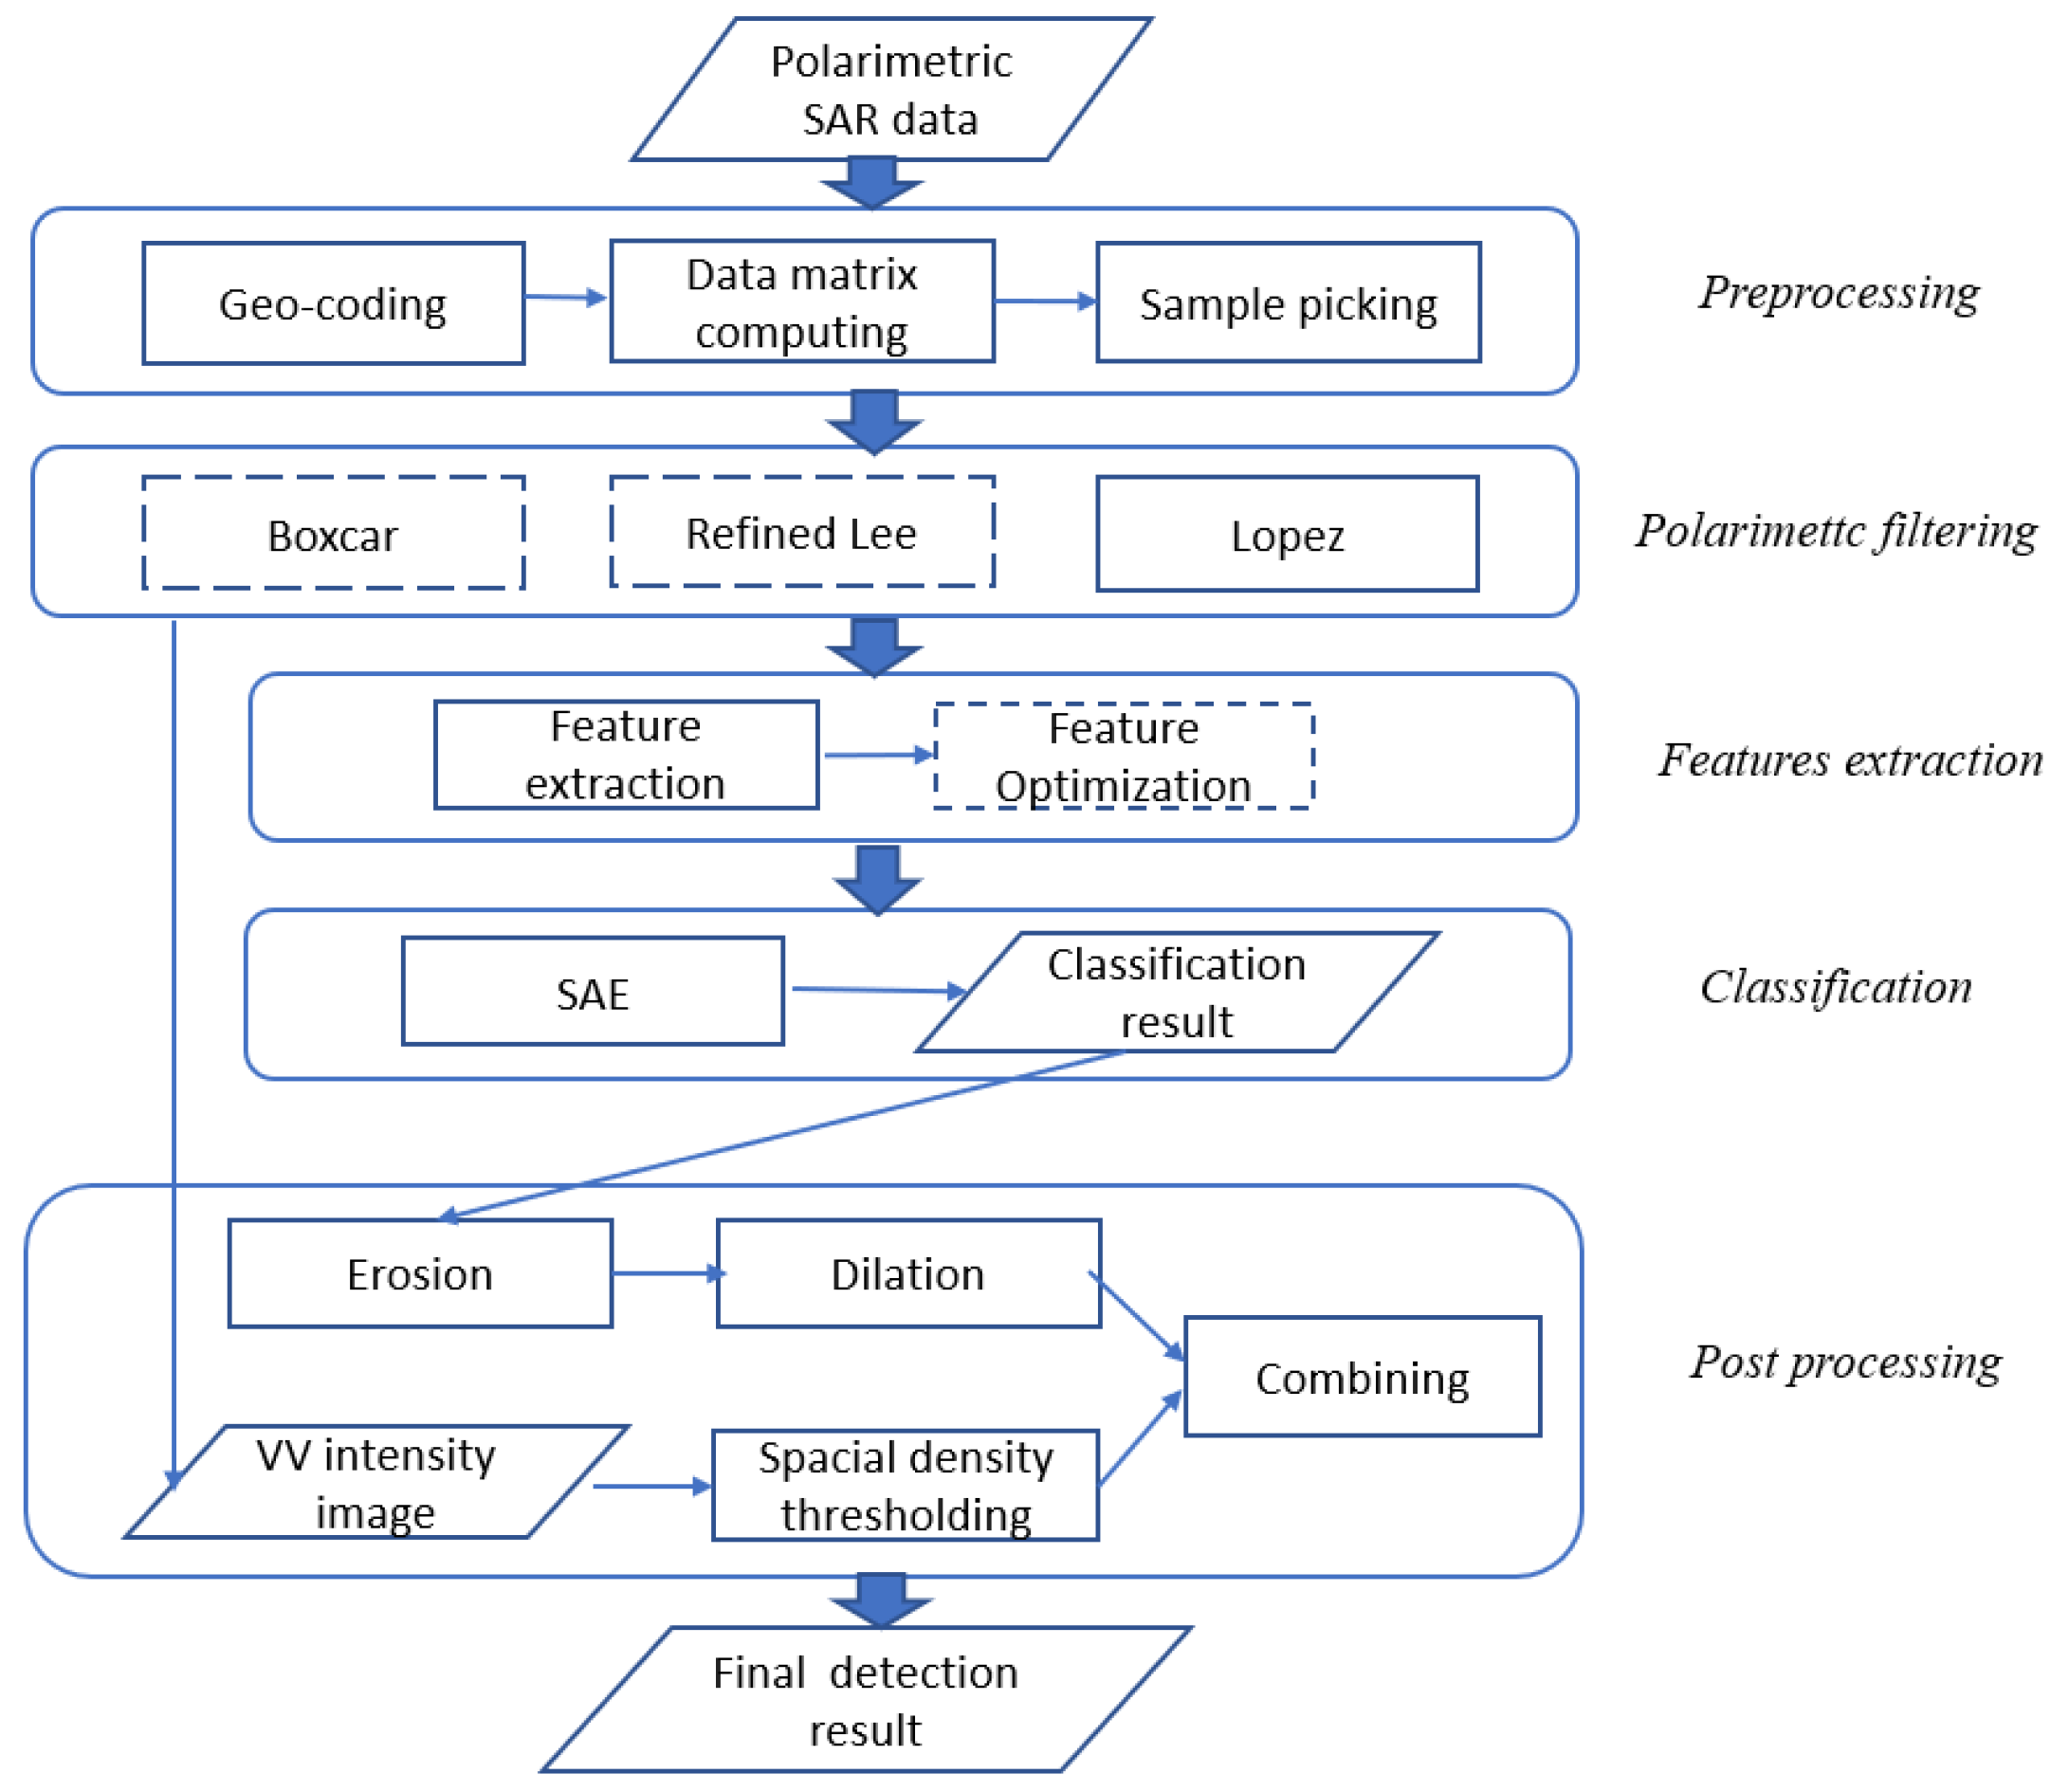
2.5. The Architecture for Marine Oil Spill Detection Based on Polarimetric SAR

The overall framework of the proposed marine oil spill detection architecture is shown in Figure 1, and the procedure can be divided into the following key steps:

2.5.1. Preprocessing

The SAR image is firstly geo-referenced. Data samples corresponding to oil slicks and clean sea surface are picked manually from the image. The covariance matrix and coherency matrix are computed.

2.5.2. Polarimetric Filtering

Polarimetric filters introduced in Section 2.2 are applied to the covariance matrix of polarimetric SAR data. In this experiment, the performance of different filters is analyzed based on visual interpretation and classification accuracy.

2.5.3. Features Extraction

The polarimetric SAR data features introduced in Section 2.3 are extracted, saved as a 10-dimension vector for each pixel. Dimension reduction algorithms could be applied, avoid redundant information and noise of the feature set, and alleviate the processing burden during the classification.

2.5.4. Classification

Taking the advantage of training data samples, crude oil and its look-alikes are classified. In this study, SAE is used, and for this step, other classifiers such as support vector machine, random forests can be also considered.

2.5.5. Post Processing

In order to derive a better oil spill detection result, post-processing is conducted. The processing is based on the hypnosis that different surface tension between water and oil slicks are normally continues distributed. Gauss kernel convolution is conducted on the intensity image of the VV channel. Then spacial density thresholding (SDT) is applied to the convolution result to detect real oil slicks [23].
I S D T = { 1 ( I G a u s s T h r e s h o l d ) 0 ( o t h e r w i z s e )
where ISDT is the output of special density thresholding, and IGauss is the result of Gauss kernel convolution.
Then the classification map derived by SAE is combined with the output of SDT to produce the result by:
  • Conduct eroding to the classification map to eliminate separate false targets to obtain IErosion
  • Conduct dilating to the resulting map to fix holes and link nearby oil slick pieces to obtain IDilation
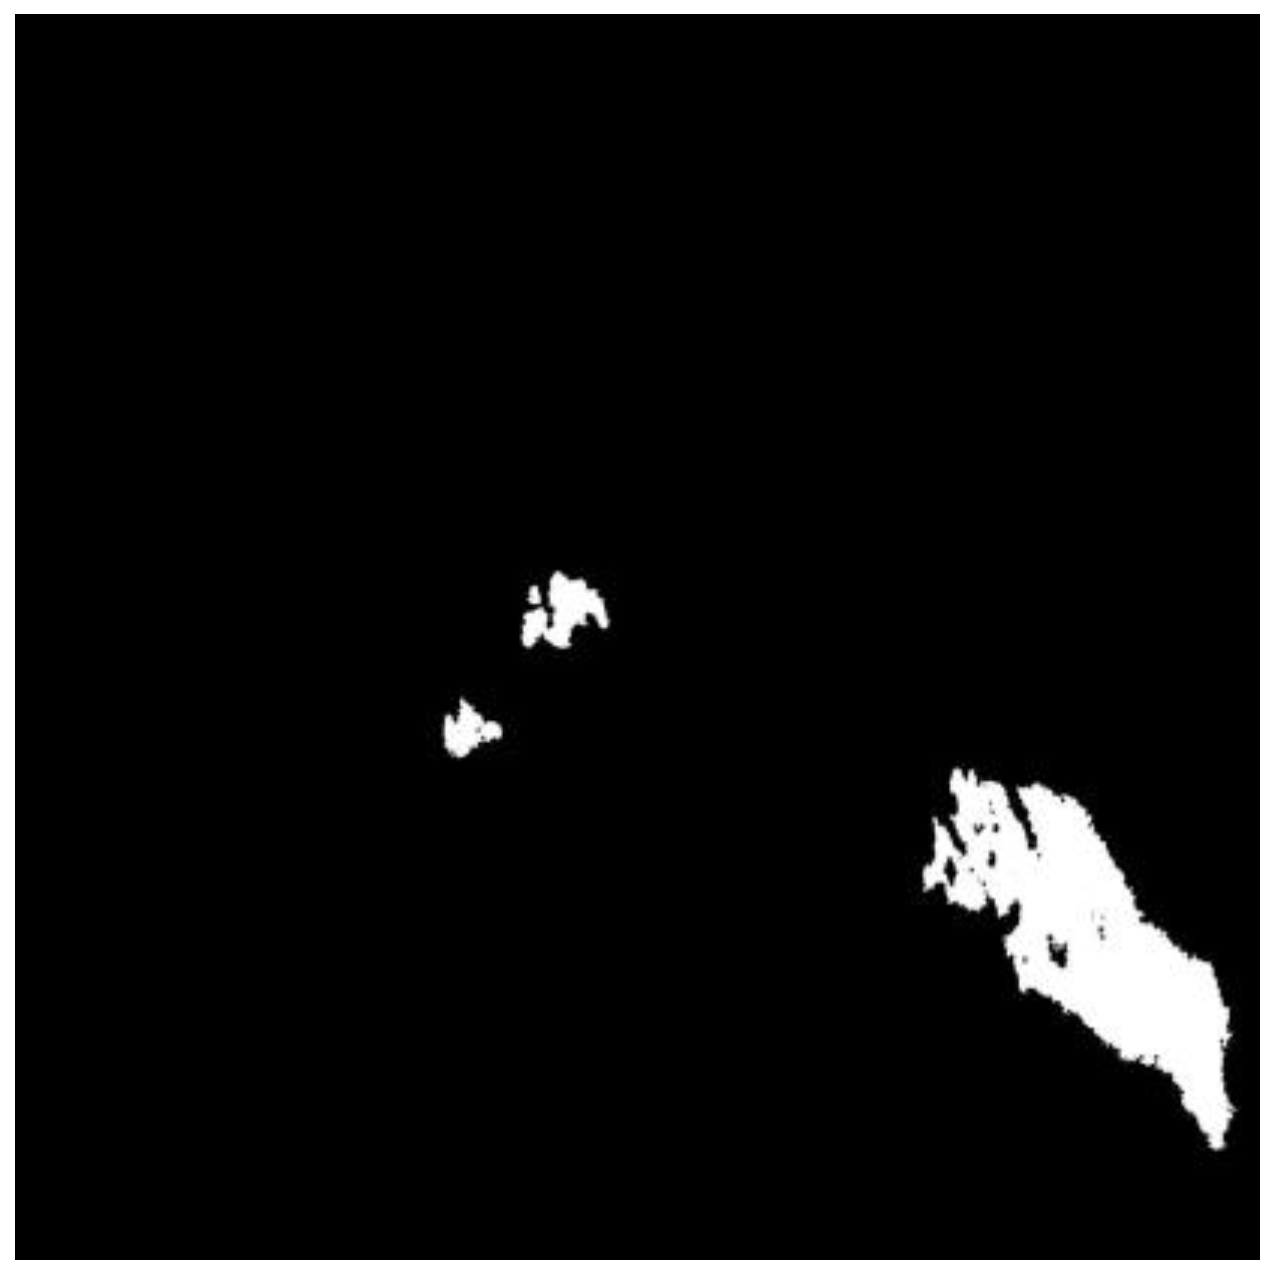
  • Multiply the processed classification map with the output of SDT to take the best advantage of the classification result and precise boundary details and shape information of oil slicks.
I f i n a l = I S D T × I D i l a t i o n

3. Experiment and Results

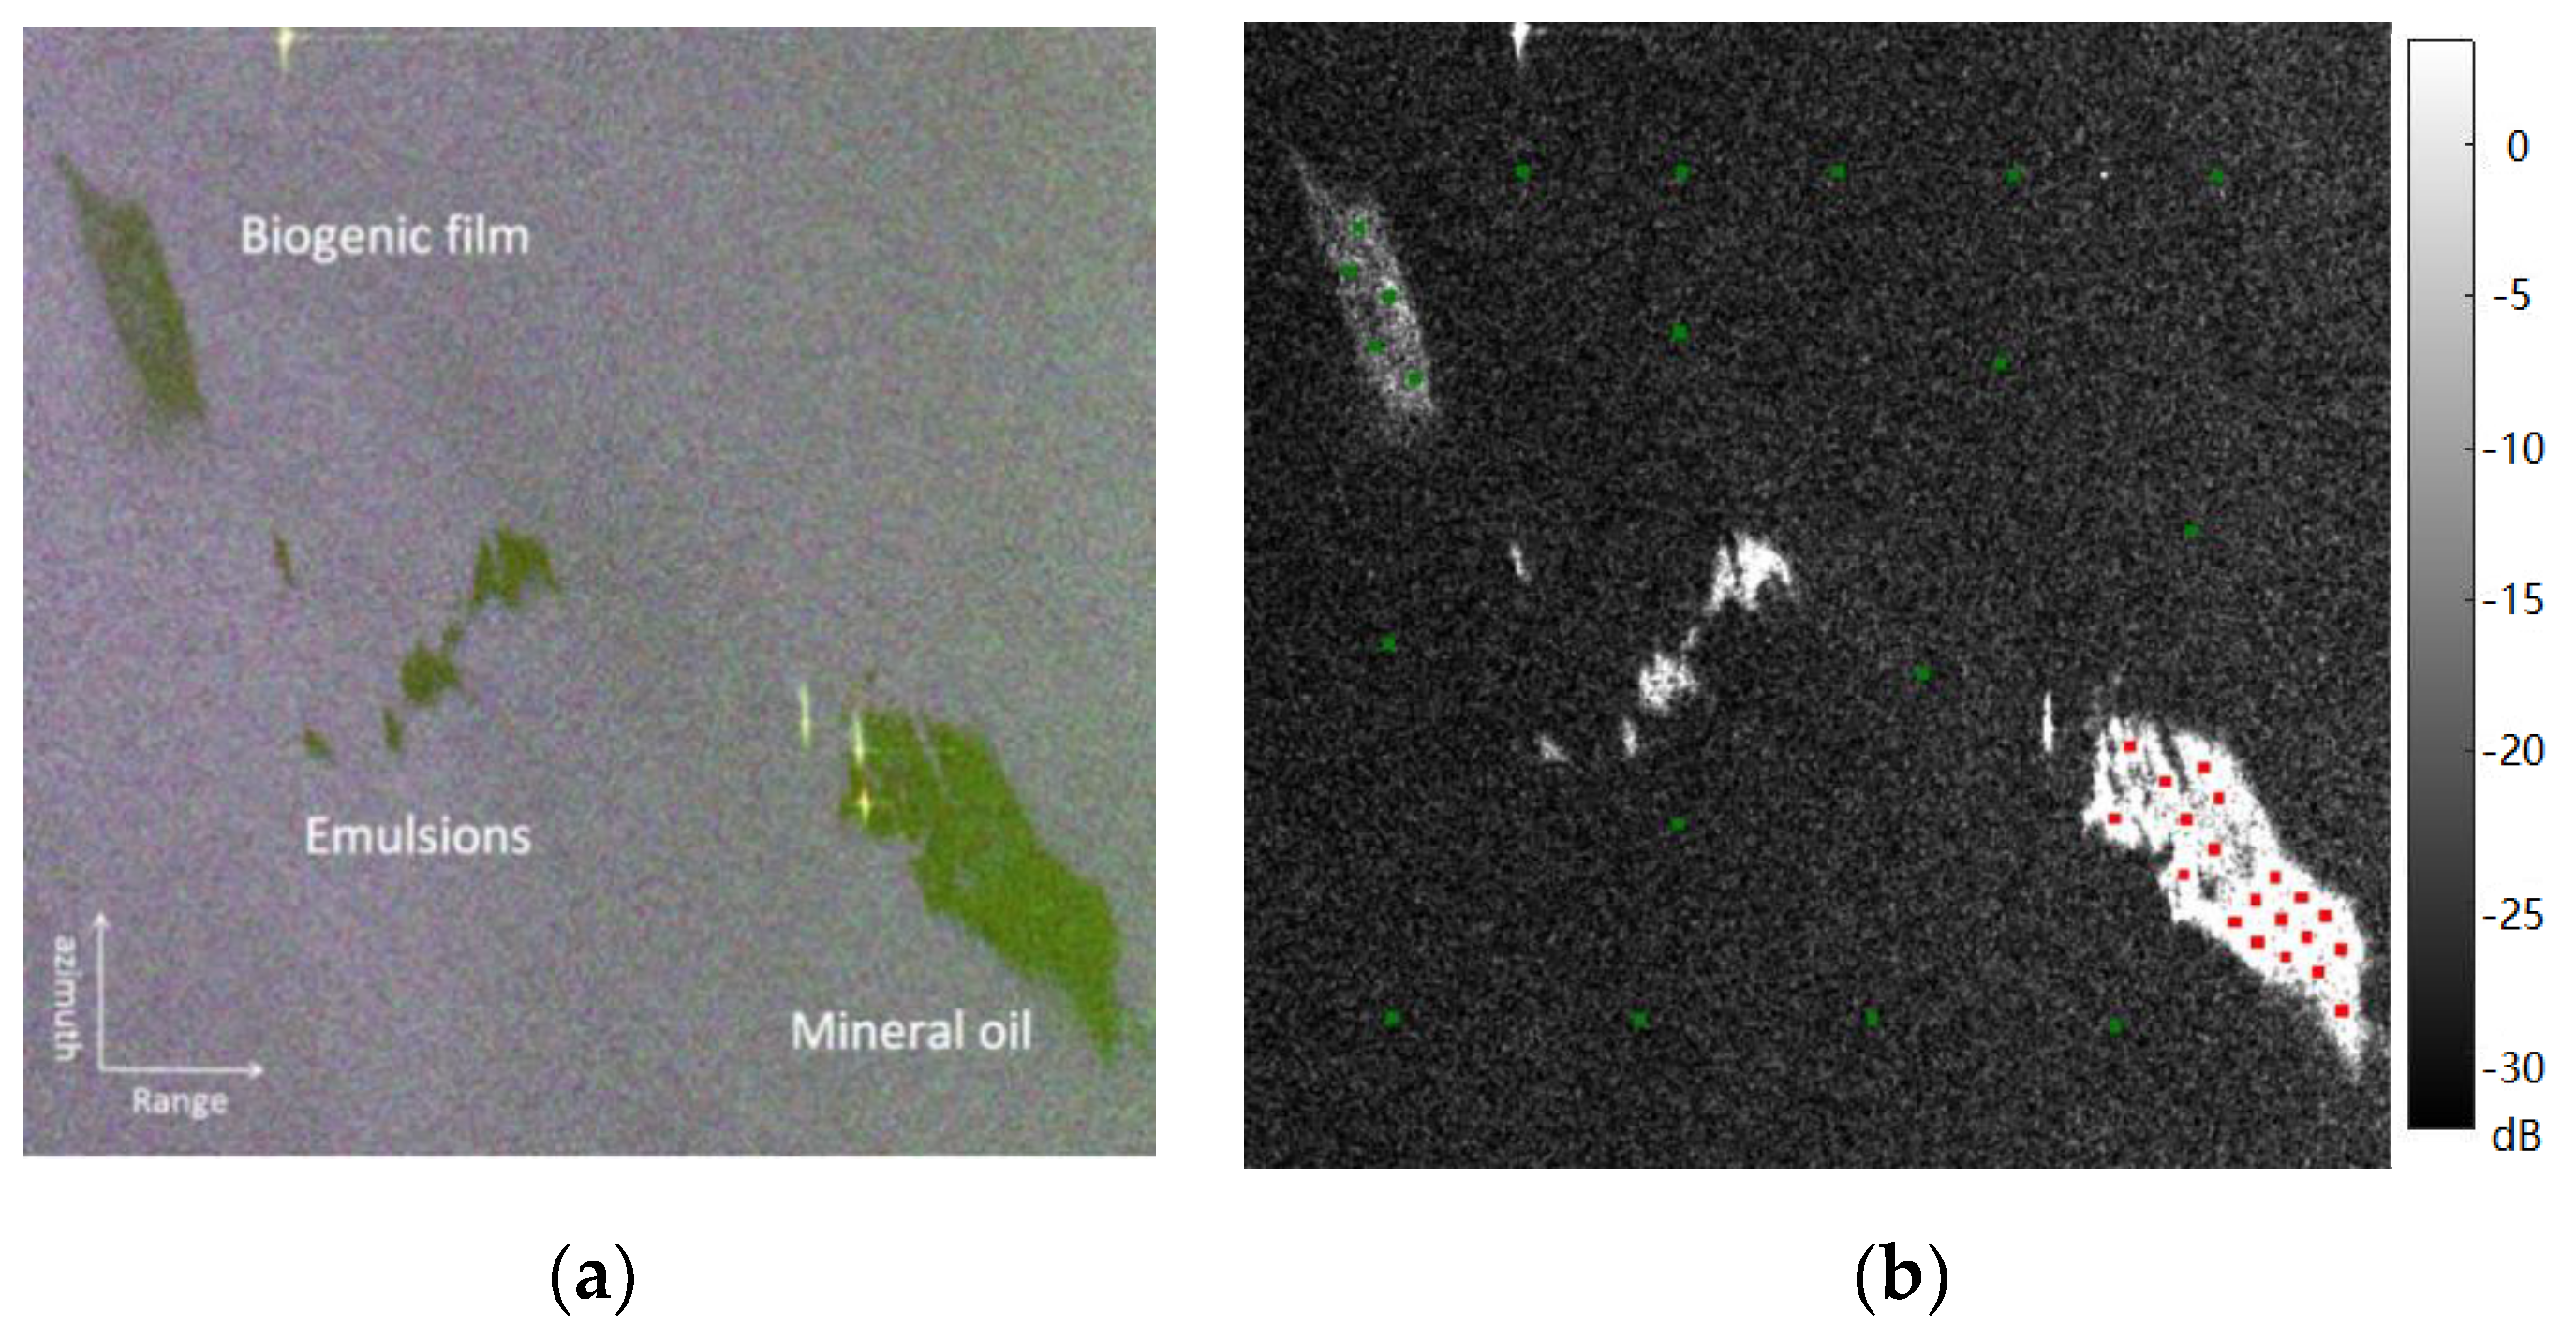
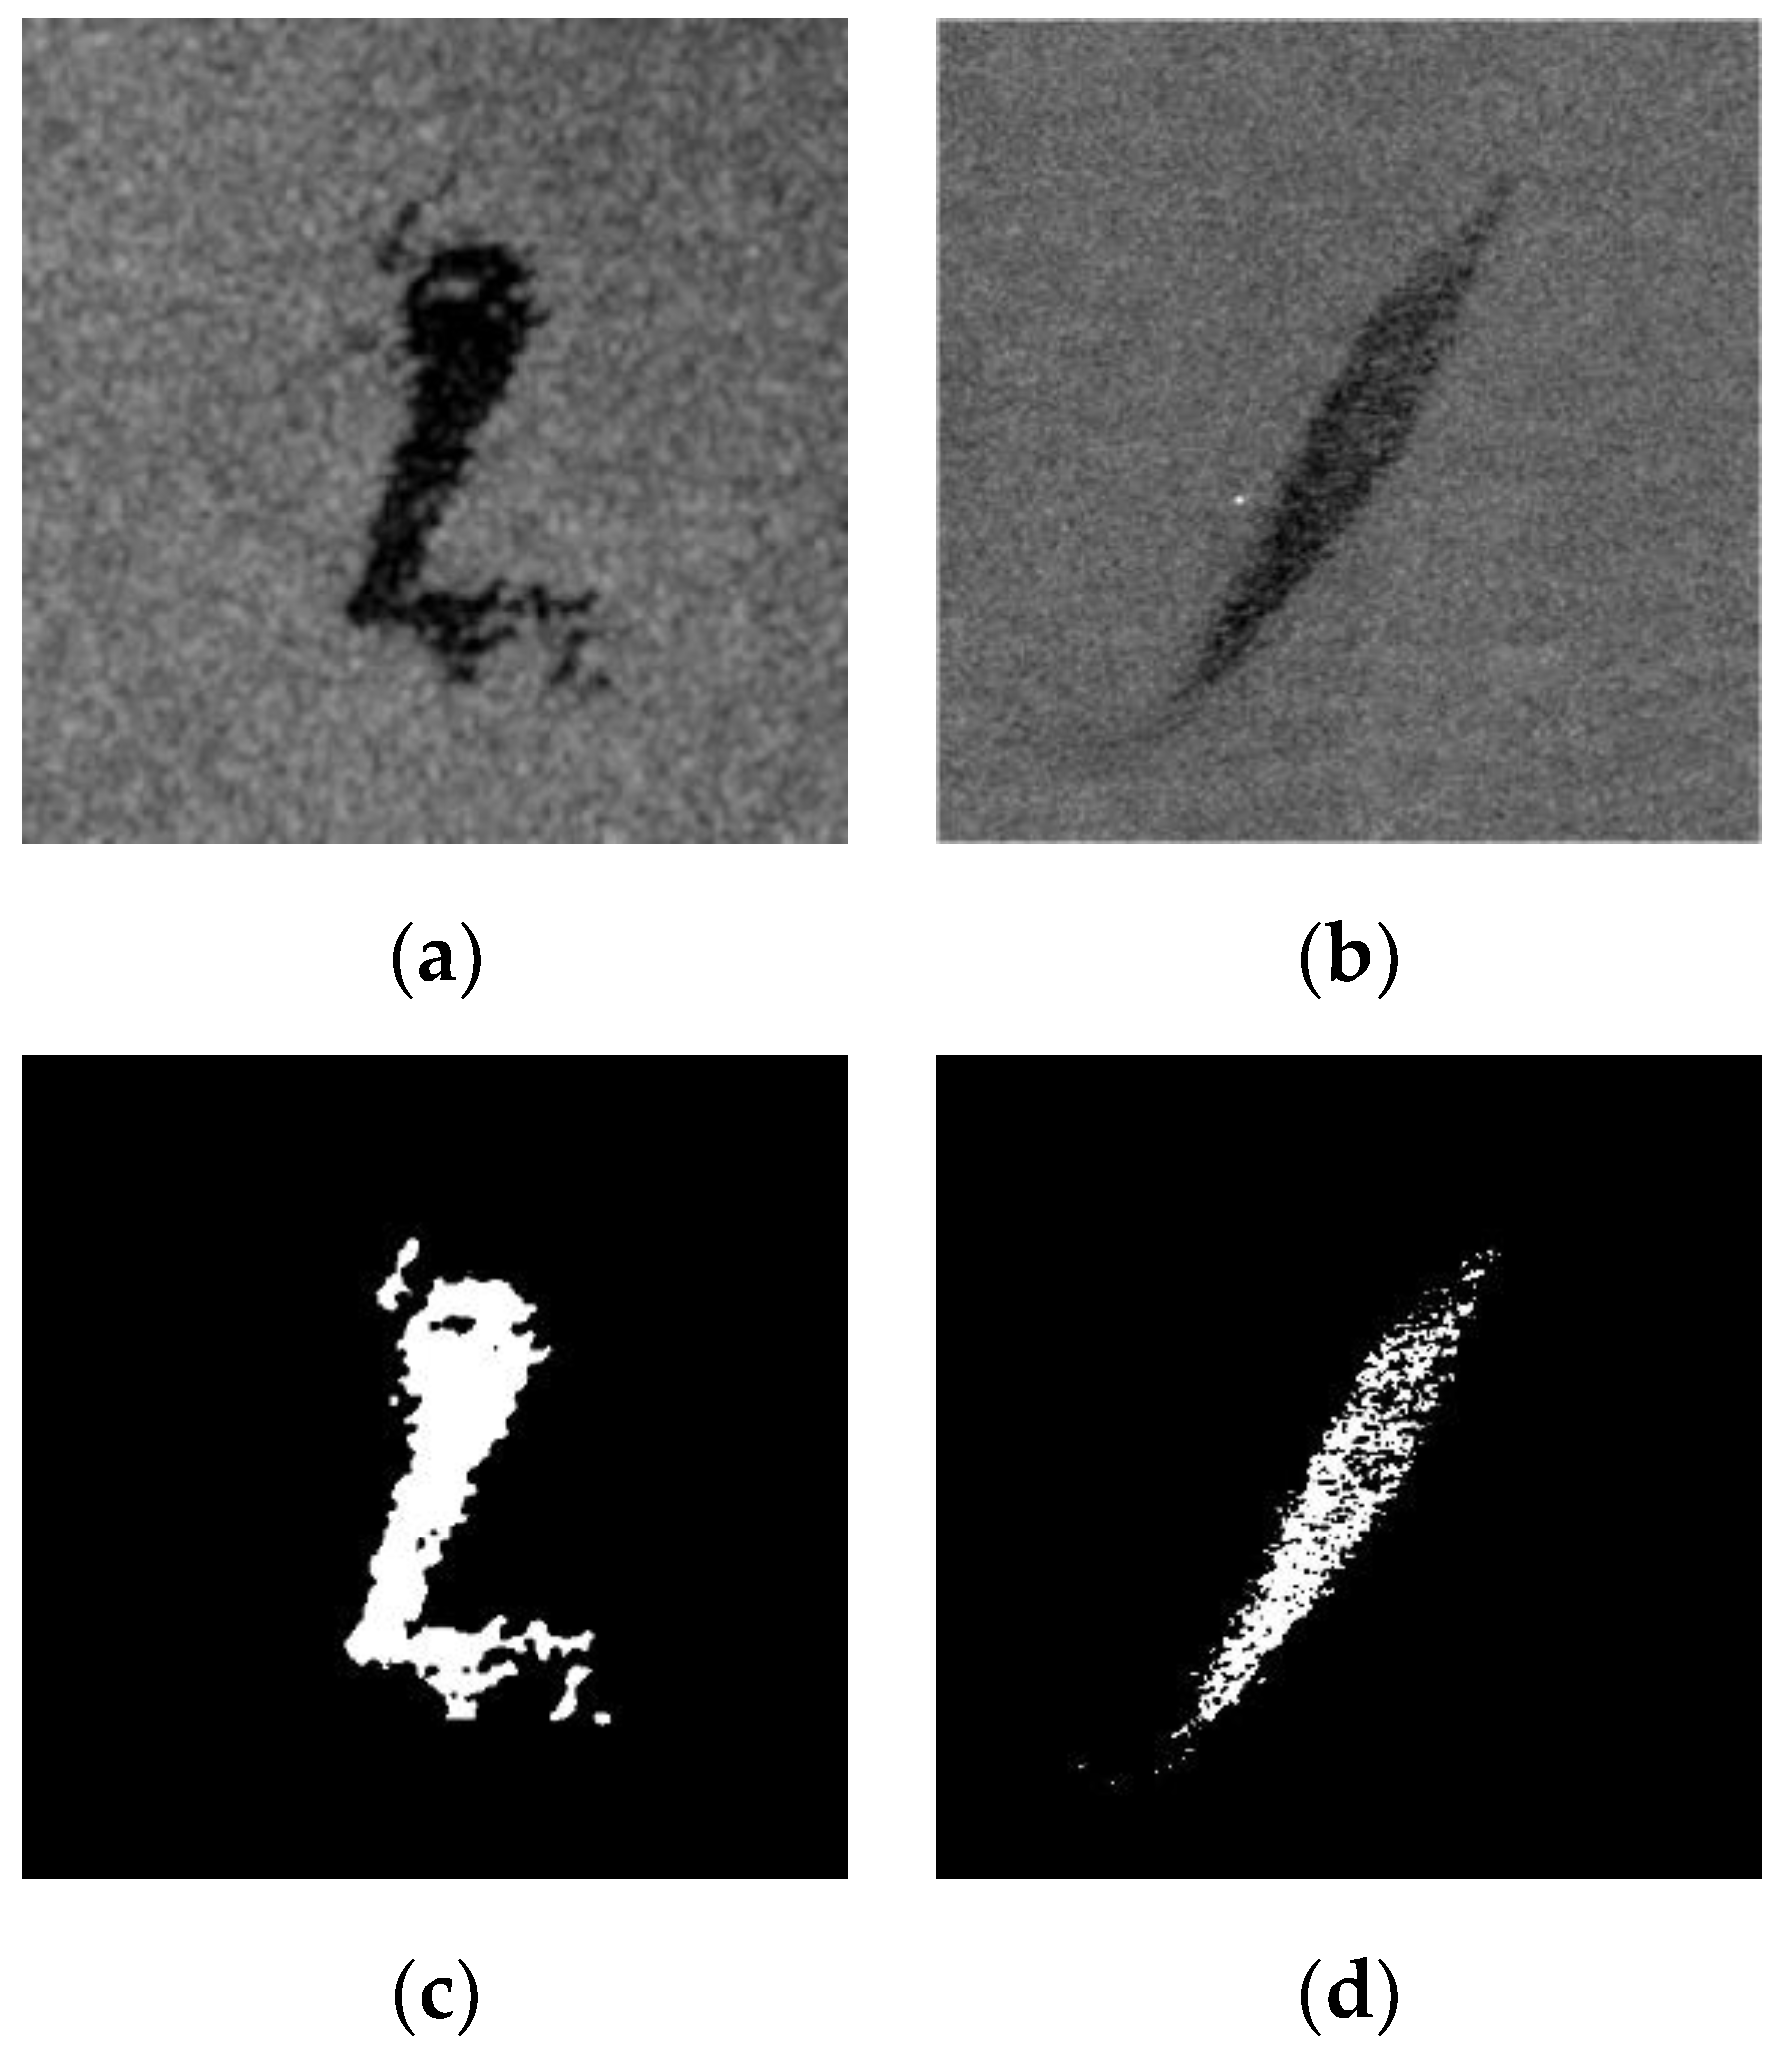
3.1. Study Site and SAR Image

RadarSAT-2 quad-polarimetric SAR dataset is used to demonstrate the effectiveness of the proposed oil spill detection method. It was acquired during a joint experiment conducted by the Norwegian Clean Seas Association for Operating Companies (NOFO). The details of the dataset are listed in Table 2.
The pseudo colour image of the data is shown in Figure 2a, where three verified slicks can be witnessed: biogenic film (Radiagreen ebo, the upper left), crude oil (Balder oil, lower right) and emulsions (Emulsion of Oseberg blend with 69% water, middle). The original width of the RS-2 image is 25 km, with range resolution around 5 m. The volume of release of emulsion and crude oil is 20 m3 and 30 m3, respectively. The slicks were released 5–9 h before the SAR acquisition when the local wind speed is 1.6–3.3 m/s. The slicks covered thousands of square meters of sea surface. More detailed information about the experiment can be found in [24].
Polarimetric features listed in Table 1 are extracted from the SAR image. Then data samples are selected manually based on auxiliary ground truth information and visual interpretation. As shown in Figure 2b, data samples with the class of crude oil and non- crude oil (clean sea surface and biogenic slicks) are picked from the feature space of the SAR image by using rectangles with the size of 20 × 20. Among them, 8000 samples belong to crude oil- and the other 8000 samples are non- crude oil. Red colour indicates crude oil and green stands for non- crude oil (clean sea surface and biogenic slicks are chosen with comparable numbers). Since the emulsion covered area has intermediate characteristics between crude oil and sea surface, it is not chosen as samples in this study. In the training of the classifiers, 4/5 (12,800) of the data samples are randomly selected for training (generate the classifier), and the left 1/5 (3200) samples are used for testing (evaluate the performance of the classifier).

3.2. Oil Spill Detection Experiments

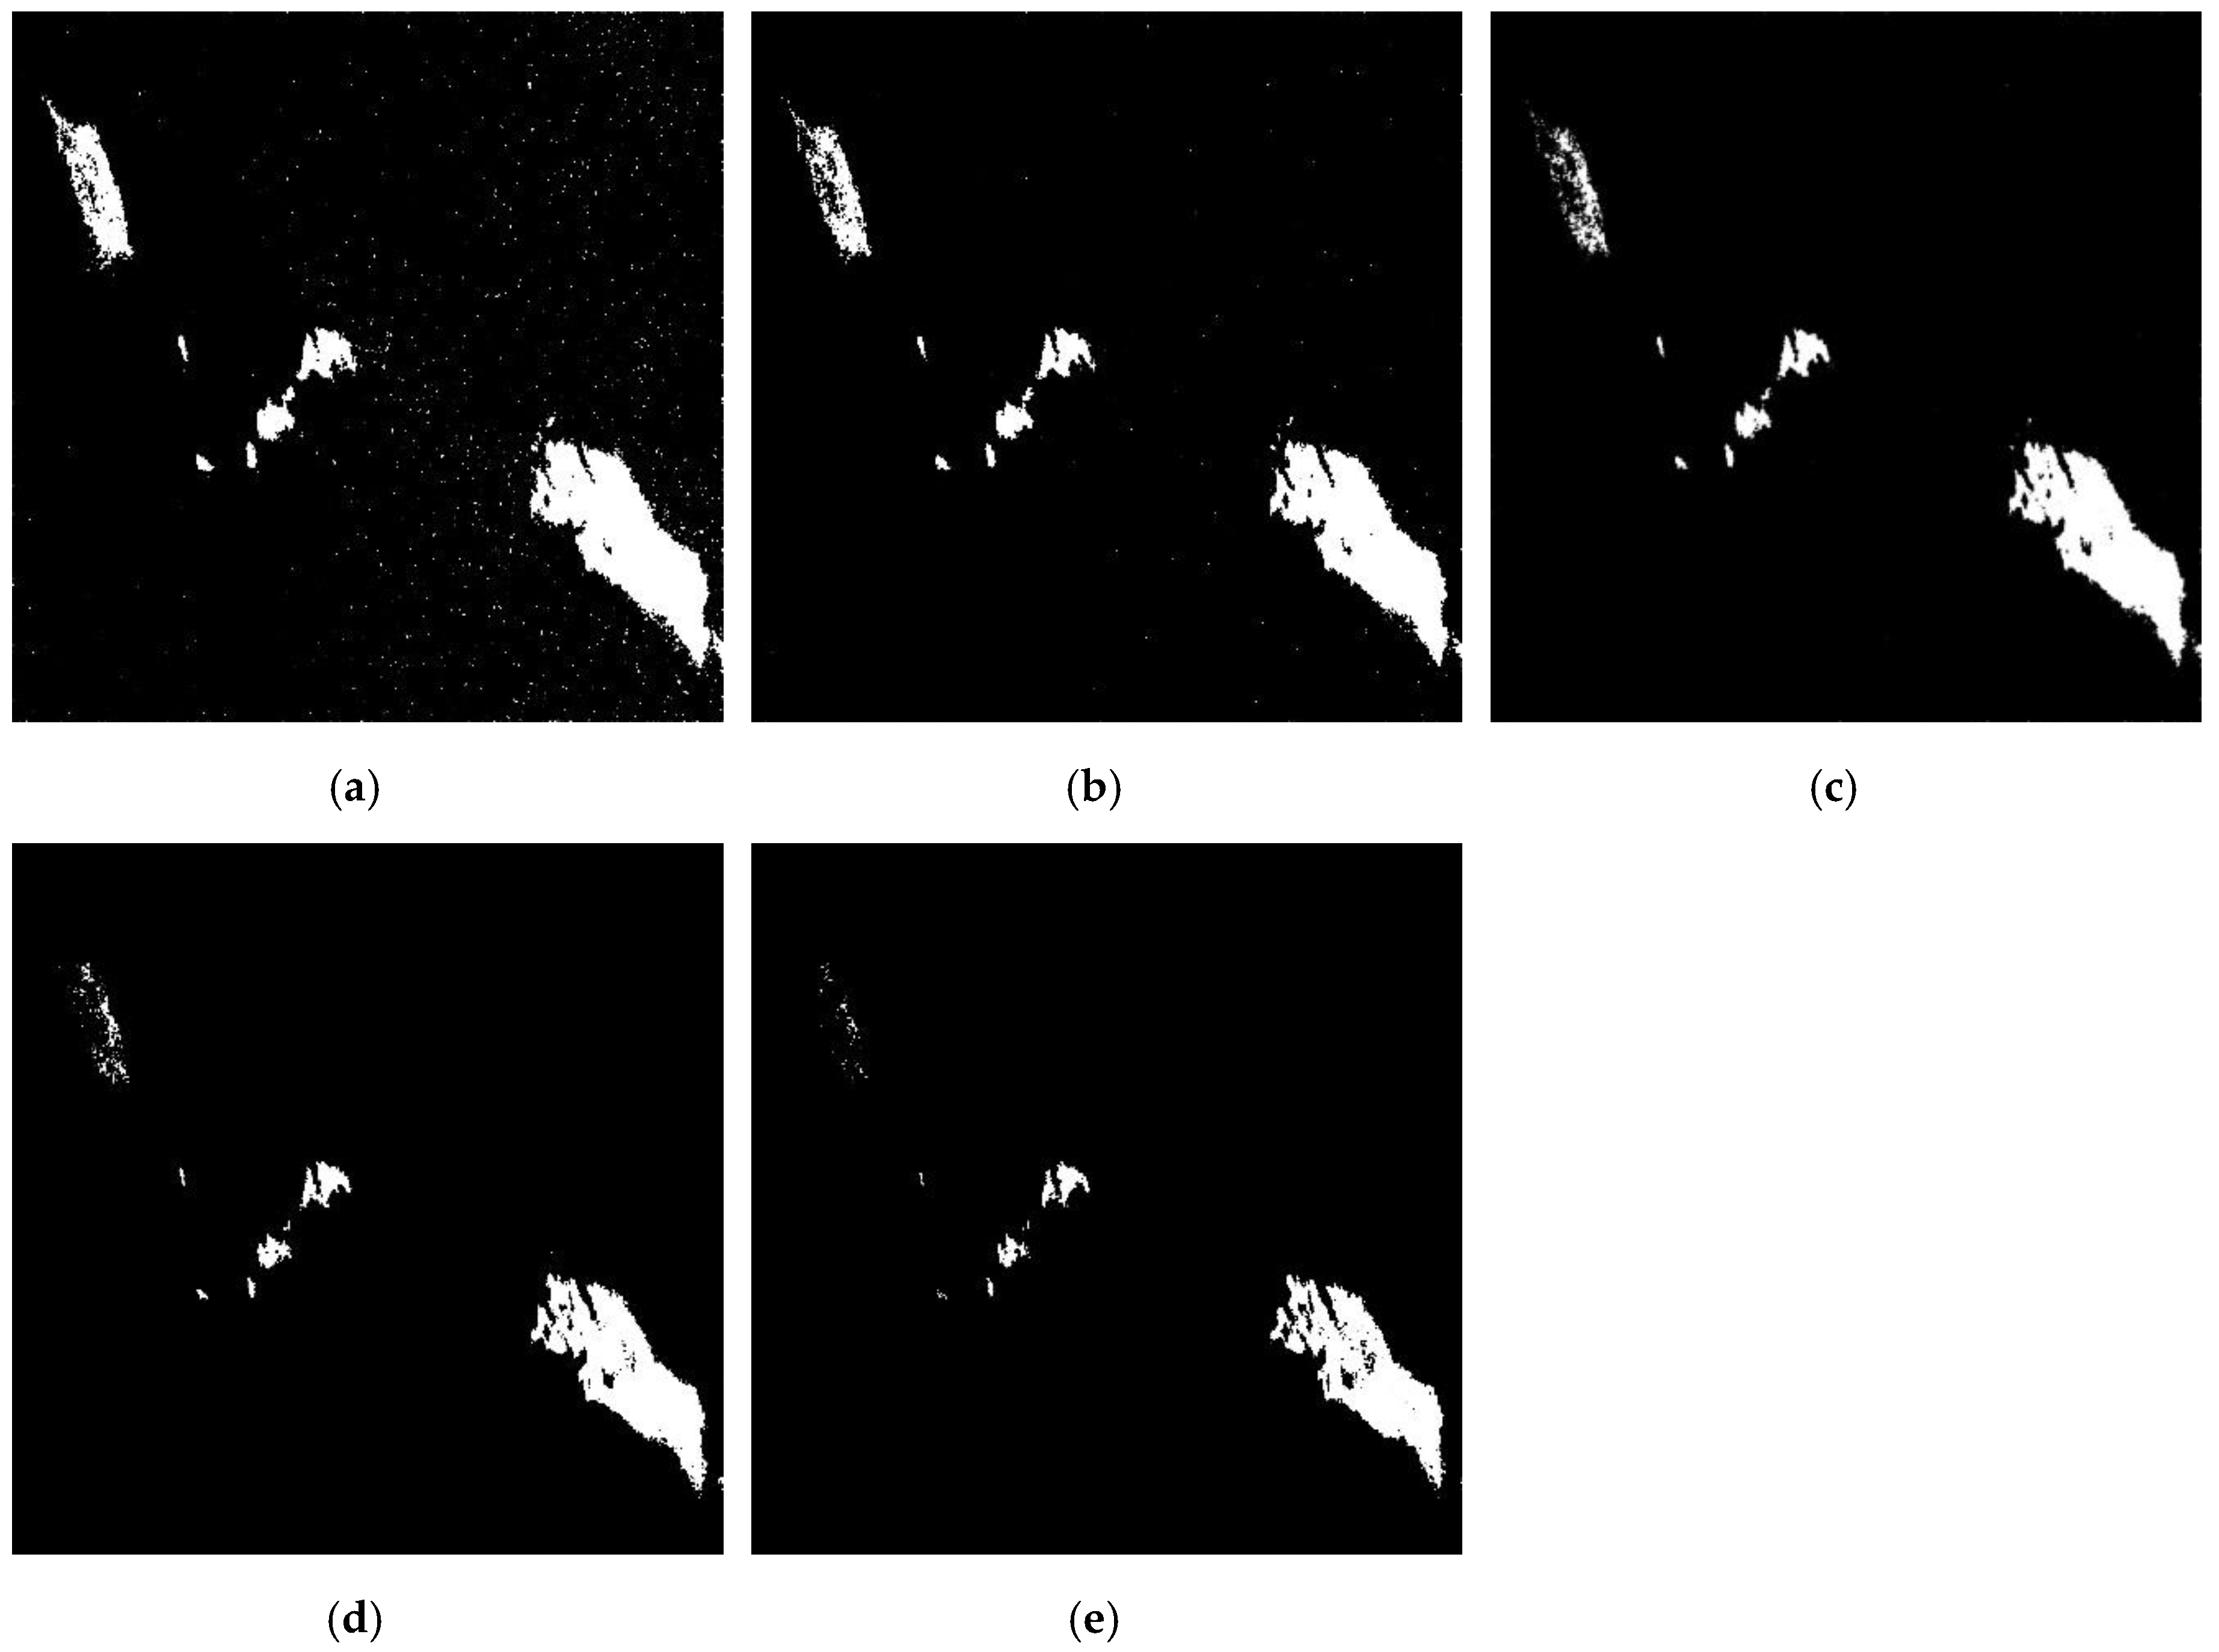
3.2.1. Comparison of Polarimetric SAR Filters

Three filters introduced in Section 2.2 are applied to every polarimetric channel of the SAR data, and the filtered VV2 image is shown in Figure 3. The features introduced in Section 2.3 are extracted from the filtered SAR data. The SAE introduced in Section 2.4 are trained by using the training samples. The SAE applied in the experiment has four layers, numbers of the neural for each layer are [2,6,8,10]. Taking Sigmoid function as the activation function, the SAE was trained for 10 epochs with the batch size of 100. Then the SAE was fine-tuned for 100 epochs with the batch size of 100 and the learning rate of 3. Then based on the testing data set, the oil spill classification result corresponding to different polarimetric filters are analyzed. Among them, Lopez filter achieved the highest classification accuracy (99.34%) on testing data samples, and the classification result is shown in Figure 4. The confusion matrix of classification results based on different filters is shown in Table 3, Table 4 and Table 5.

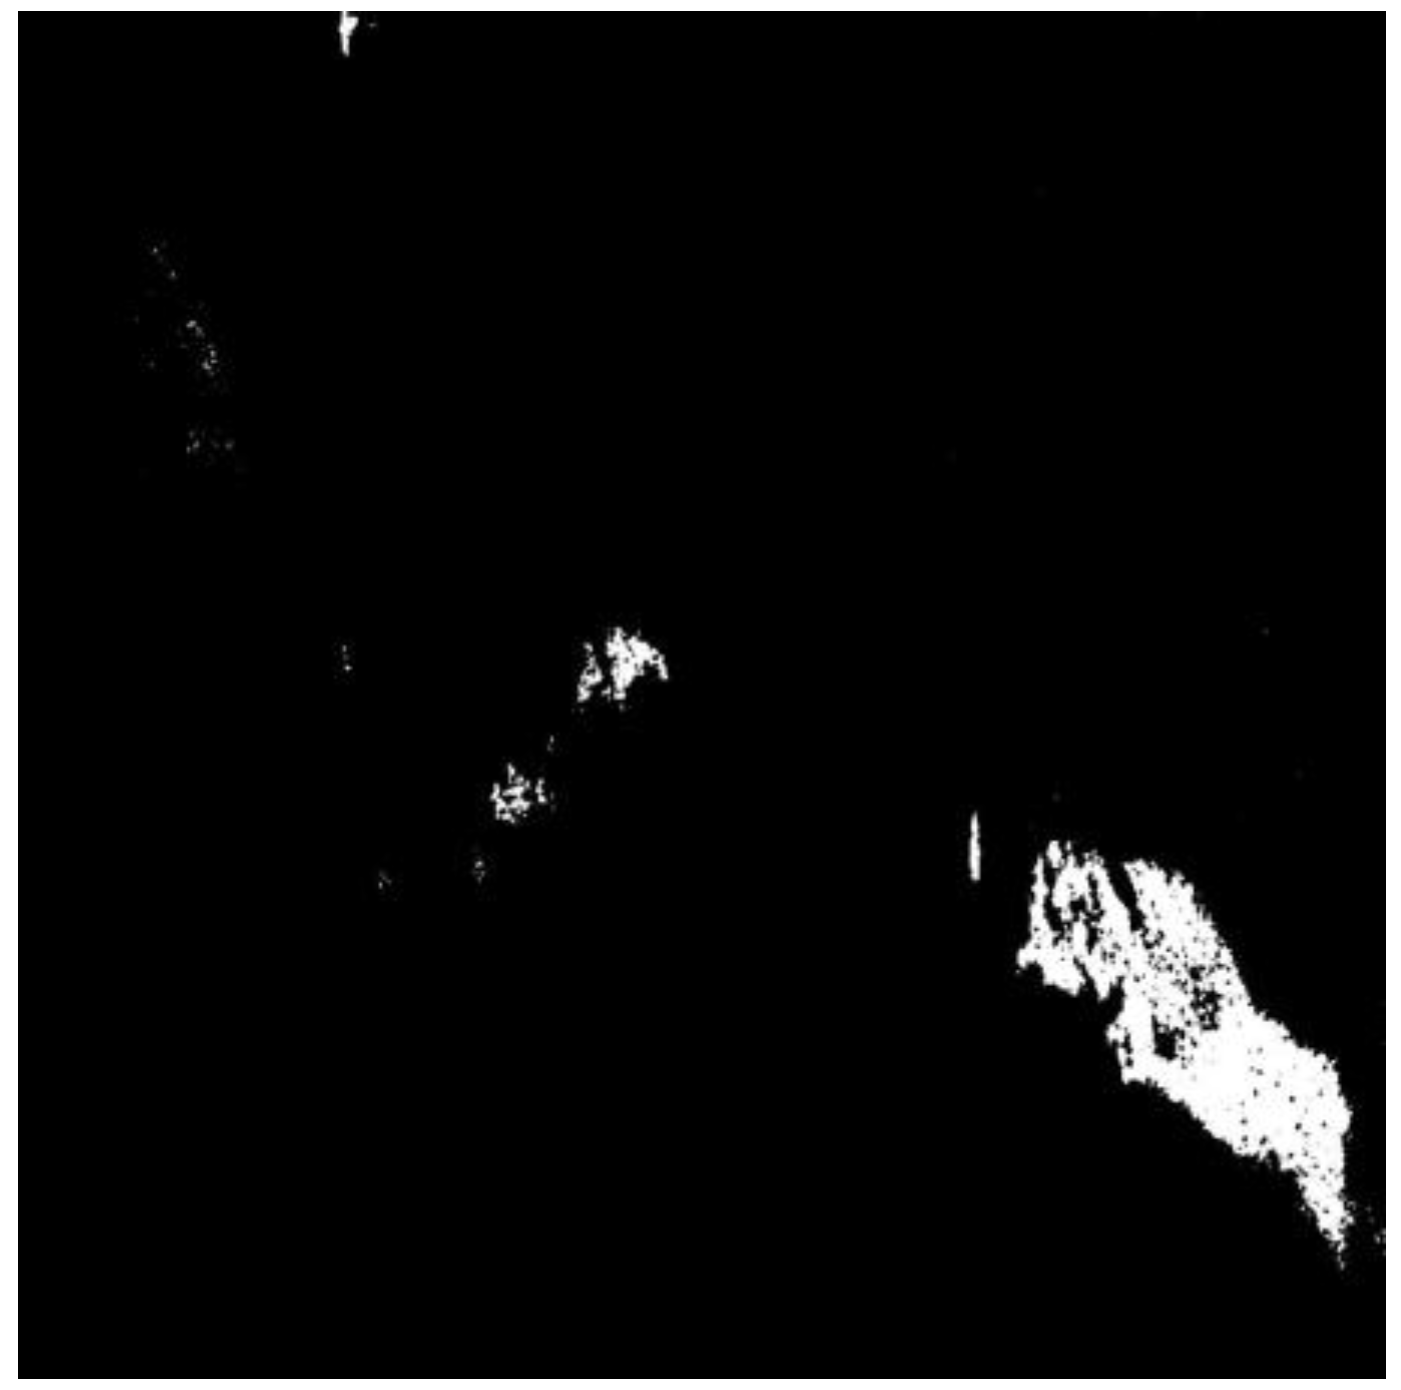
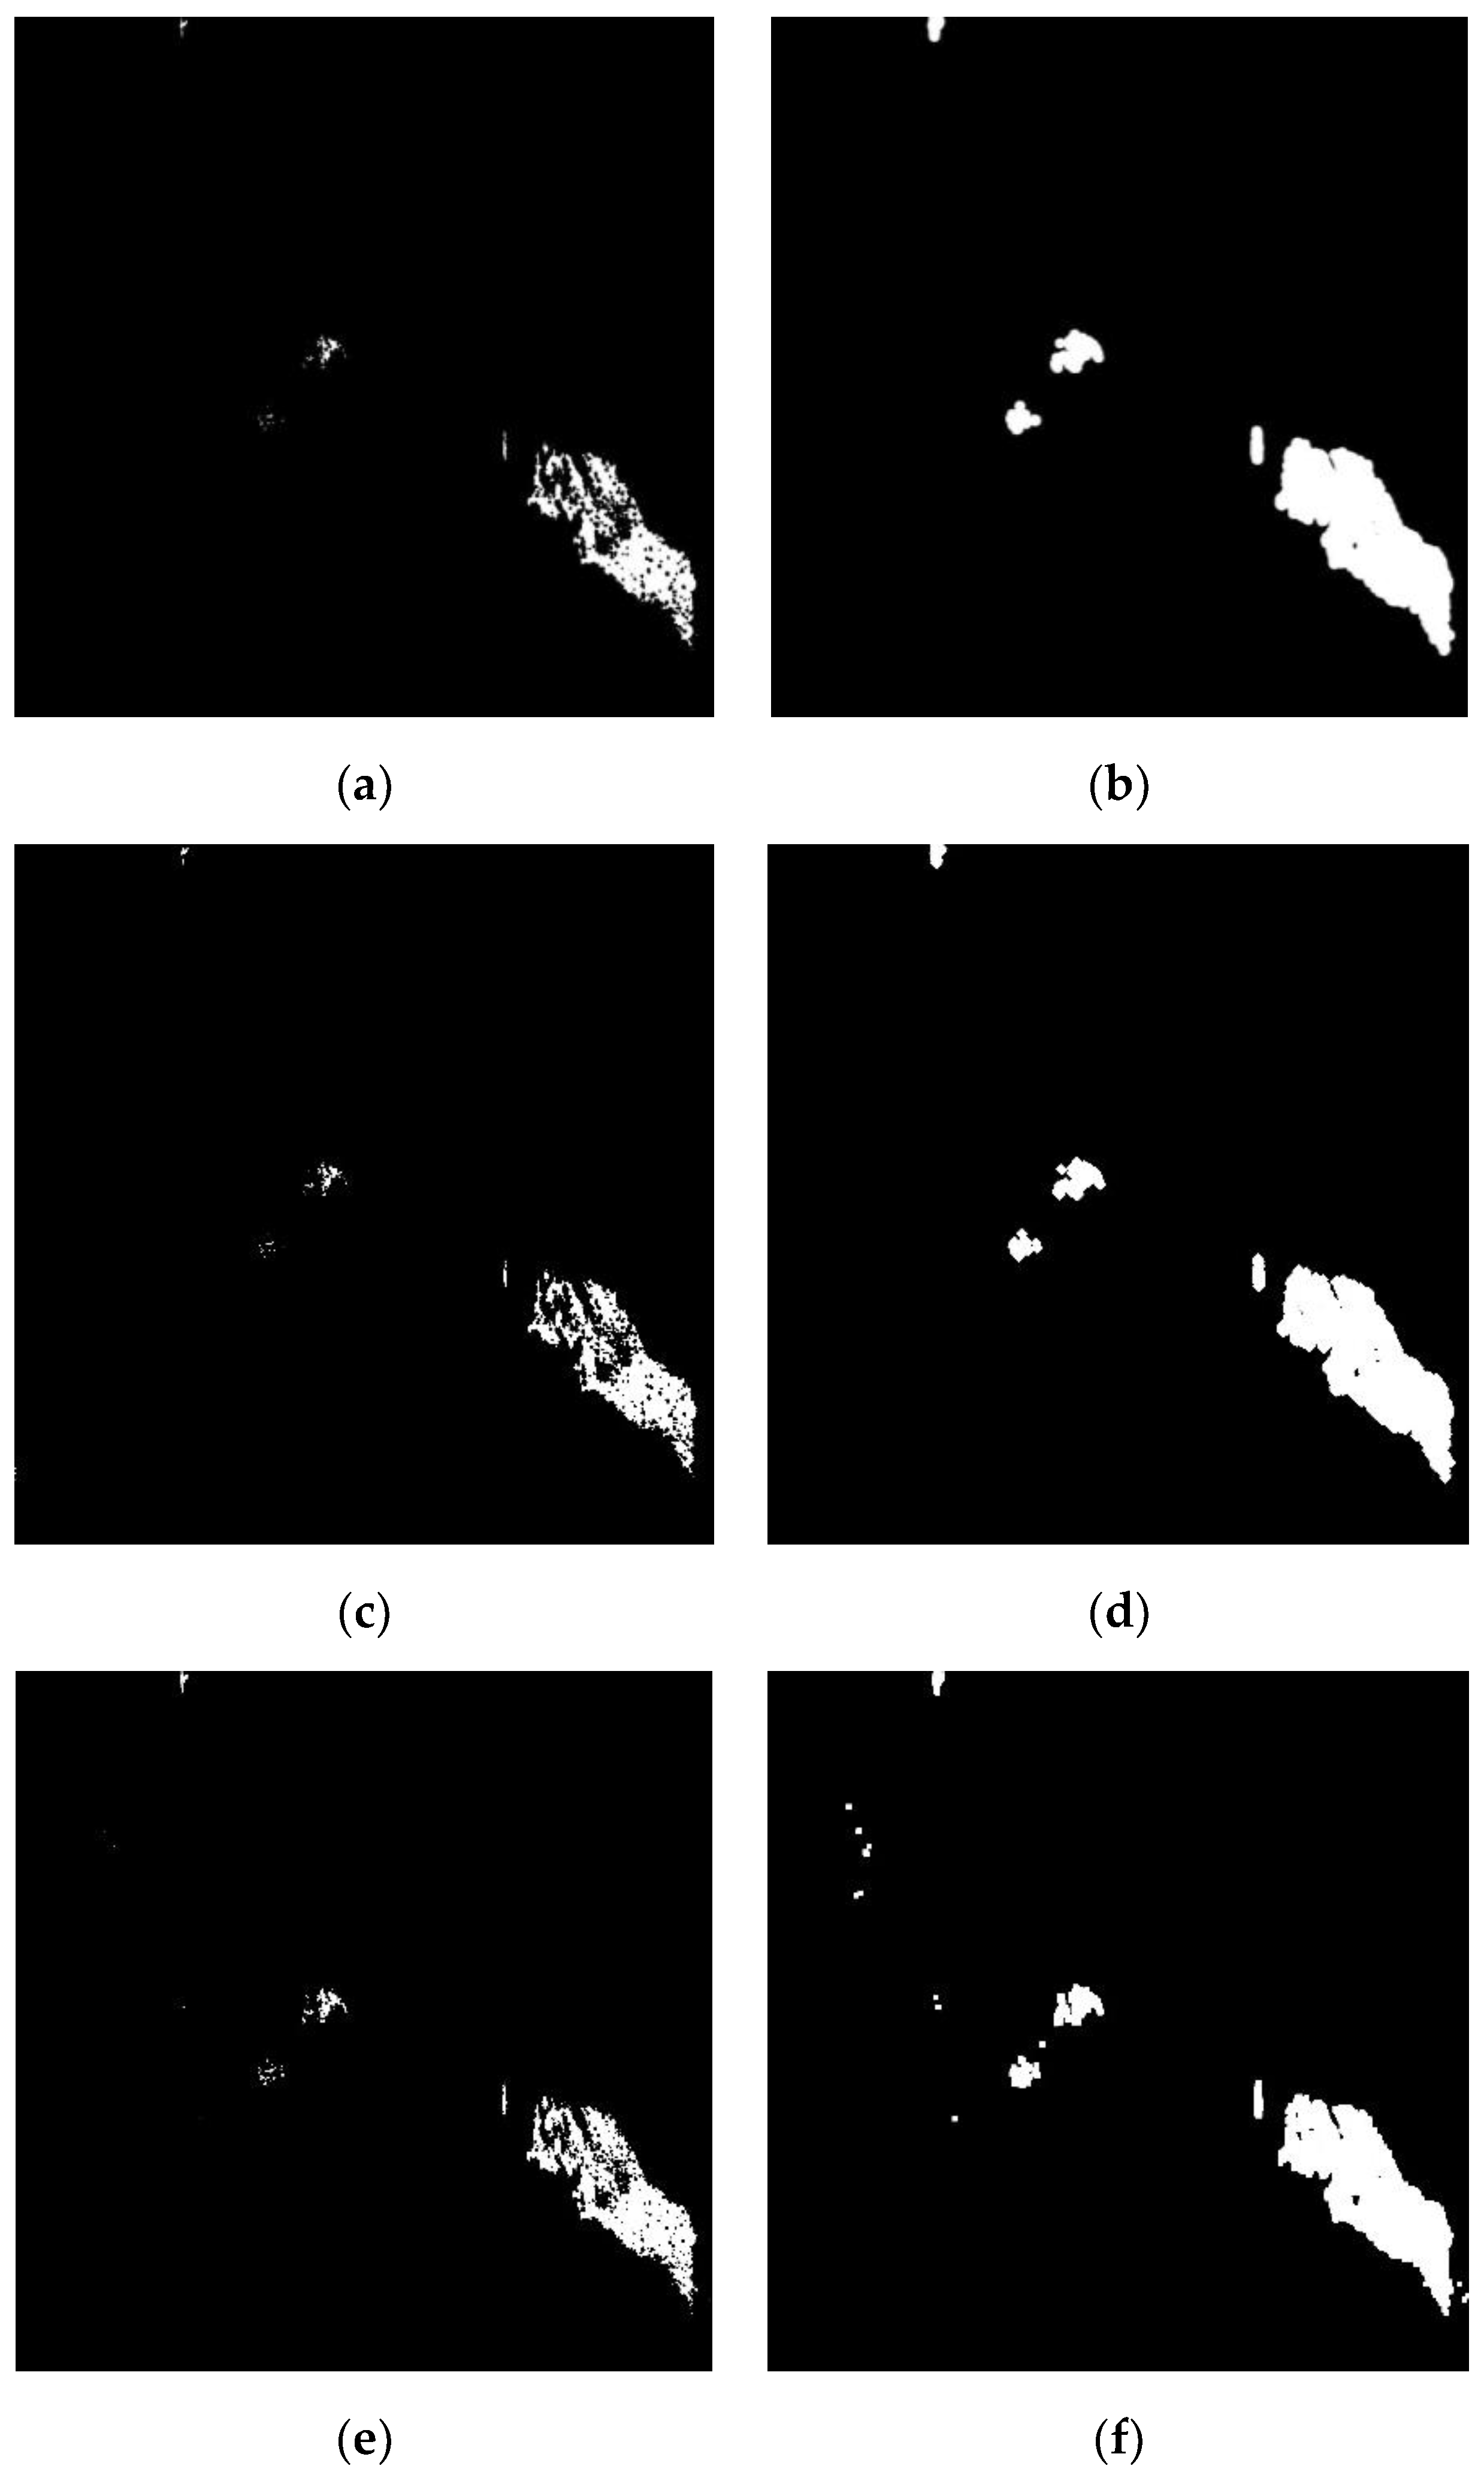
3.2.2. Optimization of Post-Processing Procedures

Although very high classification accuracy was achieved on testing samples, in the classification result (Figure 4), there is still some misclassification in the biogenic slick covered area (upper left corner). And in the crude oil-covered area, discontinuity of the edges and small holes inside the area can be observed. The post-processing procedure aims at combining the advantage of rich boundary details of VV2 power image and accurate oil type distinguishing capability of classification based on polarimetric SAR features. The procedure of post-processing can be divided into the following steps:

Spacial Density Thresholding (SDT) on VV2 Power Image

The VV2 power image is smoothed by Gauss kernel with the size of 5 × 5 (chosen based on experiments), and the result is shown in Figure 5. Then a threshold from −20 to −24 dB is applied to derive the oil slick covered area respectively (from Figure 6a–e). From the analysis, it was found the most proper thresholding is −22 dB, which could best eliminate the effect of speckle while keeping the integrity of the oil boundary. The result proved that through kernel based spacial density thresholding, the detailed boundary information of oil slicks could be effectively retained.

Morphological Processing on Classification Result by Polarimetric SAR Features

Classification result of the previous section can distinguish crude oil and its look-alikes well, based on which the crude oil mask can be generated. From the analysis, the best eroding and dilating radius is chosen to be 3 and 15 pixels respectively. In Figure 7, erosion and dilation results with the structural elements of the circle, diamond and square are shown. It was discovered that using the circle as structural elements could achieve the best performance in eliminating separate false targets and connecting breaking oil slick pieces.

None Crude Oil Spill Masking

By multiplying the output of step (a) and (b), the final oil spills detection result can be derived. From Figure 8, it is clearly shown that the crude oil and biogenic slicks can be successfully distinguished, and the boundary and inner part of the crude oil slick is very smooth and intact, which is very much accordance with in-situ measures.
To verify the feasibility of the proposed framework, another two C-band SAR images are applied. The images were obtained by Shuttle Imaging Radar with Payload C/X-SAR (SIR-C), which was flown on Space Shuttle Endeavour in October 1994. Their orbit number are PR44327 and PR49939 respectively. In both of the scenes, verified crude oil was present. Parts of the images with the size of 900 by 900 and 400 by 400 pixels were picked for easier analysis. The VV power images of the data are zoomed and shown in Figure 9a,b.
The very same algorithm applied in previous sections was conducted on the SIR-C data, and the oil spill detection results are shown in Figure 9c,d. It can be observed that both of the slicks can be detected from the noisy sea background, with very integrate boundaries.

4. Discussion

Polarimetric SAR filters could alleviate the effect of speckle noise while maintaining the details of the target. Boxcar filter uses a square to average the SAR image, which may fail to preserve the details in heterogeneous area. Refined Lee filter based on span information computed from all the polarimetric channels, which may introduce crosstalk of the SAR system. Lopez filter is based on the multiplicative-additive speckle noise model of polarimetric SAR data, which could improve the reduction of speckle noise and the estimation of polarimetric information.
Deep Neural Networks have been proved its advantage in marine oil spills detection. Based on unsupervised pre-training, SAE could initiate the parameters of the neural network close to the global optimum. For oil spill classification based on polarimetric SAR features, the training samples are relatively sparse compared with the high dimensional feature space, so SAE achieved a promising result.
The post-processing steps proposed in this paper greatly improved the integrity of the detected oil slick and avoid the effect of speckle noise to the detection result. The method does not need any auxiliary information and can be automatically processed. Some key parameters in the algorithm are set based on experiments, which could be further analyzed and optimized in future studies.
Compared with conventional marine oil slicks detection platform such as European ‘CleaSeaNet’, the proposed framework comprehensively takes advantage of polarimetric and intensity information of the SAR data, which is capable of distinguishing crude oil and its look-alikes without additional processing steps. It could be a universal solution to the problem of detecting marine oil substances.
Promising oil spill detection results in terms of classification accuracy and visual interpretation have been achieved in the experiment. Emulsions (middle part of the SAR image) have intermediate characteristics between crude oil and clean sea surface, so part of them are recognized as crude oil.

5. Conclusions

In this paper, the architecture of oil spill detection based on polarimetric SAR is proposed. The main advantage of the proposed framework includes:
(1)
By using model-based polarimetric filter, the speckle noise can be effectively suppressed;
(2)
By using SAE, the deep neural network is efficiently established given limited data samples;
(3)
By using a post-processing step, the intact oil slick piece with high confidence level can be obtained.
The proposed framework can effectively detect and extract oil slicks. Biogenic look-alikes are automatically distinguished from crude oil. The exact location, area and shape details of crude oil slicks can be easily measured. It can be easily implemented in operational oil spill detection applications based on polarimetric SAR image, which could greatly contribute to the marine environment protection.

Author Contributions

Conceptualization, Y.L. and Y.Z.; Formal analysis, Z.Y. and H.P.; Investigation, H.G. and J.G.; Methodology, Y.L.; Resources, Y.Z.; Writing—original draft, Y.L.; Writing—review & editing, Y.Z.

Funding

This research was partially funded by the National Key Research and Development Program of China grant number 2016YFB0501501, the Natural Scientific Foundation of China grant number 41706201 and 41471353, and the Spark Program of Beijing University of Technology number XH-2018-02-56.

Acknowledgments

The RADARSAT-2 data provided by CSA and MDA is highly appreciated. The SIR-C data provide by NASA is highly appreciated.

Conflicts of Interest

The authors declare no conflict of interest.

References

  1. Fingas, M.; Brown, C. Review of oil spill remote sensing. Mar. Pollut. Bull. 2014, 83, 9–23. [Google Scholar] [CrossRef] [PubMed]
  2. Brekke, C.; Solberg, A.H.S. Oil spill detection by satellite remote sensing—Review. Remote Sens. Environ. 2005, 95, 1–13. [Google Scholar] [CrossRef]
  3. Alves, T.M.; Kokinou, E.; Zodiatis, G. A three-step model to assess shoreline and offshore susceptibility to oil spills: The South Aegean (Crete) as an analogue for confined marine basins. Mar. Pollut. Bull. 2014, 86, 443–457. [Google Scholar] [CrossRef] [PubMed]
  4. Alves, T.M.; Kokinou, E.; Zodiatis, G.; Radhakrishnan, H.; Panagiotakis, C.; Lardner, R. Multidisciplinary oil spill modelling to protect coastal communities and the environment of the Eastern Mediterranean Sea. Sci. Rep. 2016, 6, 36882. [Google Scholar] [CrossRef] [PubMed]
  5. Alves, T.M.; Kokinou, E.; Zodiatis, G.; Lardner, R.; Panagiotakis, C.; Radhakrishnan, H. Modelling of oil spills in confined maritime basins: The case for early response in the Eastern Mediterranean Sea. Environ. Pollut. 2015, 206, 390–399. [Google Scholar] [CrossRef] [PubMed]
  6. Solberg, A.H.S. Remote sensing of ocean oil-spill pollution. Proc. IEEE 2012, 100, 2931–2945. [Google Scholar] [CrossRef]
  7. Chen, J.; Quegan, S. Calibration of Spaceborne CTLR Compact Polarimetric Low-Frequency SAR Using Mixed Radar Calibrators. IEEE Trans. Geosci. Remote Sens. 2011, 49, 2712–2723. [Google Scholar] [CrossRef] [Green Version]
  8. Alpers, W.; Huhnerfuss, H. The damping of the ocean waves by surface films: A new look at an old problem. J. Geophys. Res. 1989, 94, 6251–6265. [Google Scholar] [CrossRef]
  9. Marangoni, C. Sul principio della viscosith superficiale dei liquidi stabili. Nuovo Cim. 1872, 5, 239–273. [Google Scholar]
  10. Del Frate, F.; Petrocchi, A.; Lichtenegger, J.; Calabresi, G. Neural networks for oil spill detection using ERS-SAR data. IEEE Trans. Geosci. Remote Sens. 2000, 38, 2282–2287. [Google Scholar] [CrossRef] [Green Version]
  11. Li, Y.; Zhang, Y.; Chen, J.; Zhang, H. Improved compact polarimetric SAR Quad-Pol reconstruction algorithm for oil spill detection. IEEE Geosci. Remote Sens. Lett. 2014, 11, 1139–1142. [Google Scholar] [CrossRef]
  12. Li, Y.; Lin, H.; Zhang, Y.; Chen, J. Comparisons of circular transmit and linear receive compact polarimetric SAR features for oil slicks discrimination. J. Sens. 2015, 2015, 631561. [Google Scholar] [CrossRef]
  13. Migliaccio, M.; Gambardella, A.; Tranfaglia, M. SAR polarimetry to observe oil spills. IEEE Trans. Geosci. Remote Sens. 2007, 45, 506–511. [Google Scholar] [CrossRef]
  14. Migliaccio, M.; Nunziata, F.; Gambardella, A. On the co-polarized phase difference for oil spill observation. Int. J. Remote Sens. 2009, 30, 1587–1602. [Google Scholar] [CrossRef]
  15. Buono, A.; Nunziata, F.; Migliaccio, M.; Li, X. Polarimetric analysis of compact-polarimetry SAR architectures for sea oil slick observation. IEEE Trans. Geosci. Remote Sens. 2016, 54, 5862–5874. [Google Scholar] [CrossRef]
  16. Nunziata, F.; Gambardella, A.; Migliaccio, M. On the Mueller scattering matrix for SAR sea oil slick observation. IEEE Geosci. Remote Sens. Lett. 2008, 5, 691–695. [Google Scholar] [CrossRef]
  17. Zhang, Y.; Lin, H.; Liu, Q.; Hu, J.; Li, X.; Yeung, K. Oil-Spill monitoring in the coastal waters of Hong Kong and vicinity. Mar. Geod. 2012, 35, 93–106. [Google Scholar] [CrossRef]
  18. Minchew, B.; Jones, C.E.; Holt, B. Polarimetric analysis of backscatter from the Deep Water Horizon oil spill using L-Band Synthetic Aperture Radar. IEEE Trans. Geosci. Remote Sens. 2012, 50, 3812–3830. [Google Scholar] [CrossRef]
  19. Lee, J.-S.; Grunes, M.R.; de Grandi, G. Polarimetric SAR speckle filtering and its implication for classification. IEEE Trans. Geosci. Remote Sens. 1999, 37, 2363–2373. [Google Scholar]
  20. Lopez-Martinez, C.; Fabregas, X. Model-Based Polarimetric SAR Speckle Filter. IEEE Trans. Geosci. Remote Sens. 2008, 46, 3894–3907. [Google Scholar] [CrossRef]
  21. Chen, G.; Li, Y.; Sun, G.; Zhang, Y. Application of deep networks to oil spill detection using polarimetric Synthetic Aperture Radar Images. Appl. Sci. 2017, 7, 968. [Google Scholar] [CrossRef]
  22. Bengio, Y.; Lamblin, P.; Popovici, D.; Larochelle, H. Greedy Layer-Wise Training of Deep Networks. In Advances in Neural Information Processing Systems 19 (NIPS’06); MIT Press: Cambridge, MA, USA, 2006. [Google Scholar]
  23. Shu, Y.; Li, J.; Yousif, H.; Gomes, G. Dark-spot detection from SAR intensity imagery with spatial density thresholding for oil-spill monitoring. Remote Sens. Environ. 2010, 114, 2026–2035. [Google Scholar] [CrossRef] [Green Version]
  24. Skrunes, S.; Brekke, C.; Eltoft, T.; Kudryavtsev, V. Comparing near coincident C- and X-band SAR acquisitions of marine oil spills. IEEE Trans. Geosci. Remote Sens. 2015, 53, 1958–1975. [Google Scholar] [CrossRef]
Figure 1. Flowchart of the proposed framework.
Sustainability 10 04408 g001
Figure 2. (a) Pauli RGB image of the RADARSAT-2 data used for the study. (b) ROI selected from the intensity image of the SAR image. Red: crude oil; Green: none- crude oil.
Sustainability 10 04408 g002
Figure 3. VV2 image of polarimetric SAR data filtered by different filters. (a) Boxcar filter; (b) Refined Lee filter; (c) Lopez Filter.
Sustainability 10 04408 g003
Figure 4. Classification result derived from Stacked-autoencoder (SAE) based on polarimetric SAR features.
Sustainability 10 04408 g004
Figure 5. VV2 image smoothed by Gauss kernel.
Sustainability 10 04408 g005
Figure 6. Thresholding result derived from the smoothed VV2 image, with the thresholding of −20 dB, −21 dB, −22 dB, −23 dB, −24 dB (ae).
Sustainability 10 04408 g006
Figure 7. Erosion (a,c,e) and dilation (b,d,f) result based on structural elements of circle, diamond and square respectively (circle: a,b; diamond: c,d; square: e,f).
Sustainability 10 04408 g007
Figure 8. Final oil spill detection result.
Sustainability 10 04408 g008
Figure 9. Sir-C images (Courtesy of NASA) and the detection result.
Sustainability 10 04408 g009
Table 1. Features extracted from polarimetric Synthetic Aperture Radar (SAR) data [21].
FeatureDefinitionFor Crude OilFor Biogenic SlicksFor Clean Sea Surface
VV intensity S V V 2 LowerlowHigh
Entropy (H) H = i = 1 3 P i log 3 ( P i ) , P i = λ i j = 1 3 λ j HighLowLower
Alpha (α) α = P 1 α 1 + P 2 α 2 + P 3 α 3 HighLowLower
The degree of Polarization (DoP) P = g i 1 2 + g i 2 2 + g i 3 2 g i 0 2 LowHighHigh
Ellipticity ( χ ) sin ( 2 χ ) = g 3 m g 0 PositiveNegativeNegative
Pedestal Height (PH) N P H = min ( λ 1 , λ 2 , λ 3 ) max ( λ 1 , λ 2 , λ 3 ) HighLowLower
Standard Deviation of CPD S t d ( φ c ) , φ c = arg ( S H H S V V * ) HighLowLower
Conformity Coefficient (Conf. Co.) μ 2 ( Re ( S H H S V V * ) | S H V | 2 ) | S H H | 2 + 2 | S H V | 2 + | S V V | 2 NegativePositivePositive
Correlation Coefficient (Corr. Co.) ρ H H / V V = | S H H S V V * S H H 2 S V V 2 | LowHighHigher
Coherence Coefficient (Coh. Co.) C o h = | T 12 | T 11 T 22 LowHighHigher
Table 2. Details information of the RadarSAT-2 data.
ParametersConfigurations
SensorRadarSAT-2
Acquisition modeQuad-polarization: HH, HV, VH, VV
Incidence angle34.5°–36.1°
Special resolutionRange: around 4.7; Azimuth: 4.8 meters
Acquisition time8th June 2011 UTC, 17:27
Location59°59′ N, 2°27′ E
Table 3. Confusion matrix of oil spill classification based on the boxcar filter.
Confusion MatrixCrude Oil (Truth)Biogenic Slicks and CLEAN Sea Surface (Truth)Total
Crude oil (Classification)160491613
Biogenic slicks and Clean sea surface (Classification)1515721587
Total161915813200
Overall Accuracy: 99.25%.
Table 4. Confusion matrix of oil spill classification based on refined Lee filter.
Confusion MatrixCrude Oil (Truth)Biogenic Slicks and Clean Sea Surface (Truth)Total
Crude oil (Classification)1593211614
Biogenic slicks and Clean sea surface (Classification)2515611586
Total161815823200
Overall Accuracy: 98.56%.
Table 5. Confusion matrix of oil spill classification based on Lopez filter.
Confusion MatrixCrude Oil (Truth)Biogenic Slicks and Clean Sea Surface (Truth)Total
Crude oil (Classification)158951594
Biogenic slicks and Clean sea surface (Classification)1615901606
Total160515053200
Overall Accuracy: 99.34%.

