Article

The Environmental Strategy of Businesses as an Option under Recession in Greece

by
Andreas E. Fousteris
*,
Eleni A. Didaskalou
,
Markos-Marios H. Tsogas
and
Dimitrios A. Georgakellos
Department of Business Administration, University of Piraeus, 80 Karaoli & Dimitriou St., 18534 Piraeus, Greece
*
Author to whom correspondence should be addressed.
Sustainability 2018, 10(12), 4399; https://doi.org/10.3390/su10124399
Submission received: 5 November 2018 / Revised: 20 November 2018 / Accepted: 21 November 2018 / Published: 24 November 2018

Abstract

:
In recent years and mostly during the last two decades, the decisive role of the environment in the business administration field and business life in general has emerged. In the modern, fast changing, and highly competitive business environment, and even more so in the context of the recent economic crisis, businesses constantly struggle to survive, trying to resolve problems and improve their performance and competitive advantage. Therefore, they must save and invest substantial sums of money to build strong infrastructure, to change procedures, and to produce environmentally friendly products. In view of the above, the current study attempted to examine the impact of environmental strategy on the growth of medium and large enterprises in all sectors in Greece, in a period of economic crisis. The study, carried out in February and March 2018, confirmed the positive correlation and the critical role of environmental strategy in the financial performance of Greek enterprises during this period of economic recession. Both eco-efficient practices and innovative practices lead to the creation of competitive advantage and, thus, to the improvement of the financial performance of a firm.

1. Introduction

The question of how economic activity affects the environment became particularly popular in the 1960s [1,2], although historical evidence suggests that environmental disasters related to human activity have not been rare in the short history of the human species. Following the industrial revolution of the 18th century, the world’s population began to grow rapidly, and the ecological consequences started becoming more evident [2]. According to Spangenberg, the rapid rate of species extinction, wide deforestation, and depletion of natural resources are all inextricably linked to human activity [3]. Over the last fifty years, human activities have affected the planet’s ecosystems faster and more profoundly than in any other period of human history [4].
Some people consider the emergence of new types of environmental pollution, as well as the failure to deal with global warming and the ever-growing population of the Third World as clear signs of the complete lack of human foresight and prudence towards the environment [2]. Nonetheless, others focus on the tremendous progress made in hygiene, sanitary conditions, and air quality in major cities and, in general, on the steady improvement of the living standards made possible by technological advancements. The former group emphasizes on the serious environmental problems, while the latter concentrates on the amelioration of the living standards. Their views are not necessarily mutually exclusive [2].
Sustainable development has been a fundamental concept in the 21st century. Global challenges and transformations, especially in times of deep economic recession and social unrest, as well as the ever-increasing expectations of all stakeholders [5,6] have intensified the pressure to integrate environment and society issues into business strategies and activities [7,8]. Sustainability can be defined in many ways. The key element of all definitions is the balance between different magnitudes. Thus, sustainability is the improvement of the quality of human life and exists in the inherent capacity of ecosystems to support their populations [9]. This implies a series of actions which simultaneously serve the targets of the biological system (genetic diversity, endurance, biological productivity), the targets of the economic system (basic needs satisfaction, reinforcement of funds, increasing of goods and services utility), and the targets of the social system (cultural diversity, institutional viability, social justice, participation) [10,11,12].
The natural environment is a critical component of business life. Managers are confronted with environmental problems that have a direct impact on companies’ financial performance and sustainability. For companies, the ability to manage their environmental performance is a strategic issue and can help to improve their competitiveness [13]. “Image”, as a key element of highly competitive business life, depends both on the quality of goods and services as well as on the firm’s social responsibility initiatives, which have an impact on consumer preferences and demands [14,15].
Particularly in Greece, the outbreak of the global financial crisis in 2007 and its spread to Europe has triggered probably the most severe economic crisis of its recent history. Since then, Greece has faced an intense and long-lasting economic recession, which is considered to exceed the Great Depression of 1929 in the United States. From 2008, when GDP (at current prices) was estimated at € 242 billion, up until the end of 2016, when it reached €174 billion, it has fallen by more than 25% [16,17]. According to the OECD’s assessment of Greece’s environmental performance, the rich natural environment of the country forms one of its most valuable assets. Although Greece has taken important actions to control environmental pressure, further effort will be needed to achieve environmental convergence within the OECD and the European Union.
Even though numerous studies in current literature examine the impact of the natural environment on business financial performance, most of them deal with particular aspects of the link between these two elements. Moreover, most studies address the correlation between natural environment and financial performance over periods of economic growth, without considering the type of financial constraints that exist in Greece since 2008 due to the long-term recession.
The purpose of this study was to examine the impact of environmental strategy on the growth of medium and large Greek firms in times of economic crisis. According to literature [13,18,19], there is no unambiguous relation between environmental strategy and corporate financial performance. Current literature formed the basis for the development of the conceptual framework which depicts the basic variables and their correlations, while the research cases examine the specific impact of each factor. In summary, the research questions of this study are as follow:
  • To what extent can Greek companies implement an environmental strategy in a period of economic crisis?
  • To what extent can the framework of this study predict the degree of impact of a business environmental strategy on corporate financial performance in periods of economic crisis?
The field research, carried out in February and March 2018, was conducted by means of a questionnaire, which was sent and received via email. The population of the survey included the Managing Directors of every medium and large corporation (S.A.—Société Anonyme) operating in Greece and in any business sector.

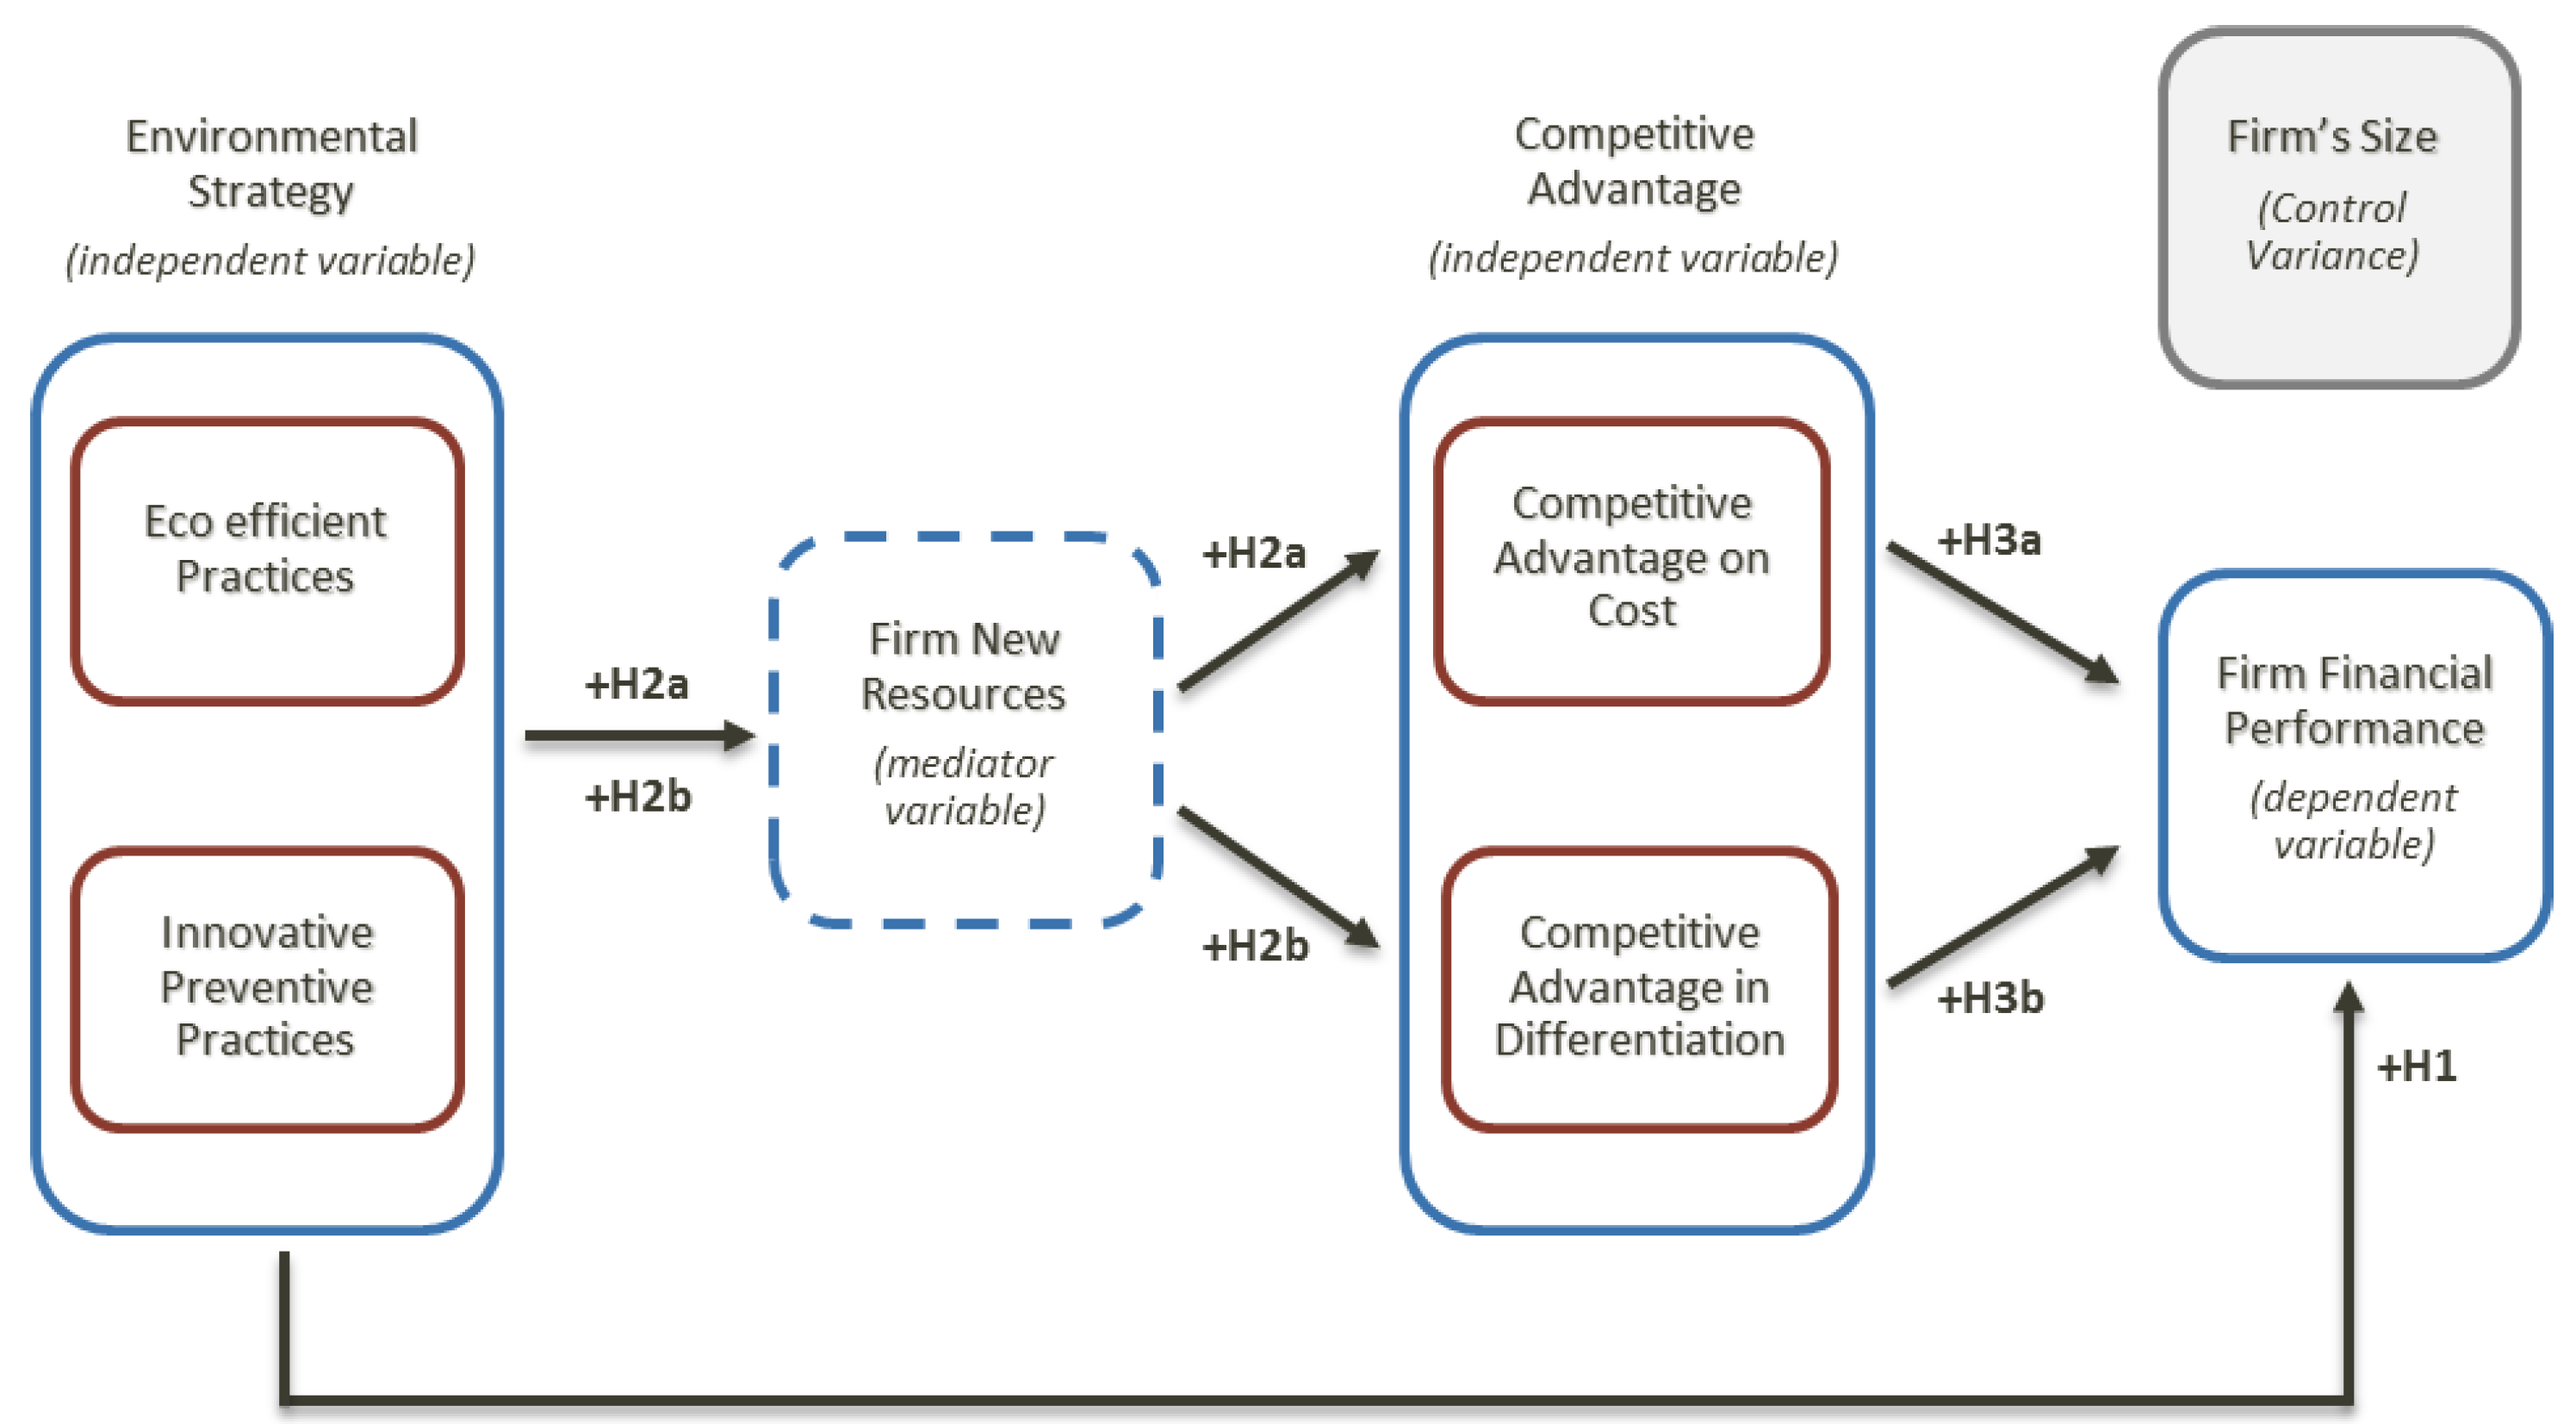
2. Theoretical Framework and Hypotheses Development

2.1. The Impact of Environmental Strategy on Business Financial Performance

According to literature, environmental strategies have a continuum range of actions, from reactive to more proactive strategies [13,20]. The aim of reactive strategies is to meet the legal requirements and implement pollution controls [13,20,21]. Proactive strategies include eco-efficient practices for reducing waste and energy consumption, and innovative preventive practices that require redesigned processes, products, operations, and business models [13]. Our study does not examine reactive strategies, as it considers them mandatory by the regulators, whereas proactive strategies depend on the company’s management.
Although, in literature, multiple findings exist around the impact of proactive environmental strategies on business financial performance, most studies have identified a positive correlation [13,20,22,23,24,25,26,27]. This interconnection between environmental strategy and financial performance is embedded in the natural-resource-based view of firms [21,28]. According to that view, a positive impact can be expected in financial performance through the competitive advantage that is generated from an environmental strategy [29,30]. In the context of large enterprises [31,32], this positive correlation is explained as the result of the connection between effective environmental strategies and big competitive potential [23,28,32,33,34,35,36,37]. Most environmental strategies have focused on redefining the business plan and on product and process innovation in order to prevent pollution and eliminate waste in production, which allows a company to keep pace with changes in business environment [20,23,28,37,38]. The adoption of eco-efficient environmental strategies, aiming to reduce energy and waste, has been found to have, at the same time, a reduced environmental impact, while providing companies with a competitive advantage by reducing costs and adding value [39].
Environmental research on small and medium enterprises has used a variety of dependent variables. Many of them explored the mechanisms of environmental ethical decision making and assessed the impact of environmental regulations on small production units [40,41,42]. Some descriptive research studies on small and medium companies generally assume that legislative pressure is the only motive for small and medium companies to adopt advanced environmental practices, since such initiatives do not have a positive effect on their performance [43]. In their conclusions, however, most of the scholars claim that “it is reasonable to expect that proper management and a more proactive attitude towards environmental issues will also be rewarded in the field of small businesses” [44].
High-level environmental performance can be attributed to different types of environmental practices with different outcomes [45]. There is no single relationship between environmental strategy and firm performance [18,46]. In addition, efficiency improvement anticipated by the adoption of environmentally preventive strategies can take the form of efficient energy use, advancements in business operation, or efficient resource management, namely the reduction of unit inputs [47]. Therefore, according to the arguments presented above, the following research case is presented:
Hypothesis 1 (H1):
Environmental strategies have a positive impact on a firm’s financial performance.
  • Hypothesis 1a (H1a):Eco-efficient practices have a positive impact on a firm’s financial performance.
  • Hypothesis 1b (H1b):Innovative preventive practices have a positive impact on a firm’s financial performance.

2.2. Environmental Strategy and Competitive Advantage

According to the current literature, the impact of environmental variables on businesses’ financial performance may not be direct. It is, therefore, important to analyze the causal relation between the various variables, considering the role of the intermediate variables. Corporate resources and competitive advantage are important in environmental strategy decisions. The implications of the environmental strategy for the creation of a competitive advantage are reflected in the cost and differentiation side [18,48,49])
The cost advantage usually results from the adoption of practices which improve the production process [28], by increasing efficiency and reducing the cost of input and waste disposal [28,49]. Decisions to invest on new, “green” technology, experiment with “green” distribution and transmission systems, and design environmentally sensitive products and manufacturing processes enable companies to gain a competitive advantage through cost reduction [50,51]. Innovative preventive corporate practices can help to avoid or decrease environmental pollution due to advanced crafts, technologies, and systems [52,53,54]. Through these practices, a firm could minimize production expenditure and create a cost advantage [13,52,53]. The higher a company’s level of innovation in precursor pollutant technologies is, the greater the cost advantage it will obtain from environmental strategies [23,51]. Further, eco-efficient practices can give a “win-win” possibility of environmentally enhancing the firm while reducing cost. Reducing consumption of natural resources is an eco-efficient activity that positively affects both the natural environment and the financial performance by enabling a company to be more efficient through cost reduction [13,23,50].
The differentiation advantage usually occurs when customers perceive a product to be of greater value [55]. Thus, the advantage of differentiation usually depends on the firm’s ability to adapt product features to the current market needs and to commercially exploit the eco-friendly characteristics of its goods and services [48]. Products that have value added by environmental practices can get better market access [56] and customers perceive those products as healthier and with higher quality standards [30,57]. The decision to invest in innovative technology or an innovative production chain can give a differentiation advantage that will reward the firm with high return [58,59]. Furthermore, environmental issues and the impact of growing consumption on the environment have unequivocally been at the top of the public agenda [14,15]. In terms of business, this means that customers have a growing interest and are concerned about eco-efficient practices, such as the reduction of waste disposals or the reuse of natural resources [49,58,60,61].
In this correlation, corporate resources must be considered as a mediation variable. In many studies [23,37,38,47], the importance of developing superior/improved business resources regarding the relation between an enterprise and the natural environment is considered a source of competitive advantage. The reputation advantage of a company will certainly favor a more profitable exploitation of marketing opportunities and, hence, increase market value [44,62]. Corporate resources are the result of preventive environmental strategies (e.g., continuous innovation, stakeholders/customers management), combined with social reputation and legitimacy [63]. At the same time, a sophisticated coordination of human and technical skills is required to reduce the environmental impact while maintaining or increasing business competitiveness [20,23,28]. Therefore, in line with the above, the following two research cases are being presented:
Hypothesis 2a (H2a):
Corporate resources generated through an environmental business strategy mediate in the positive correlation between environmental business strategy and competitive cost advantage.
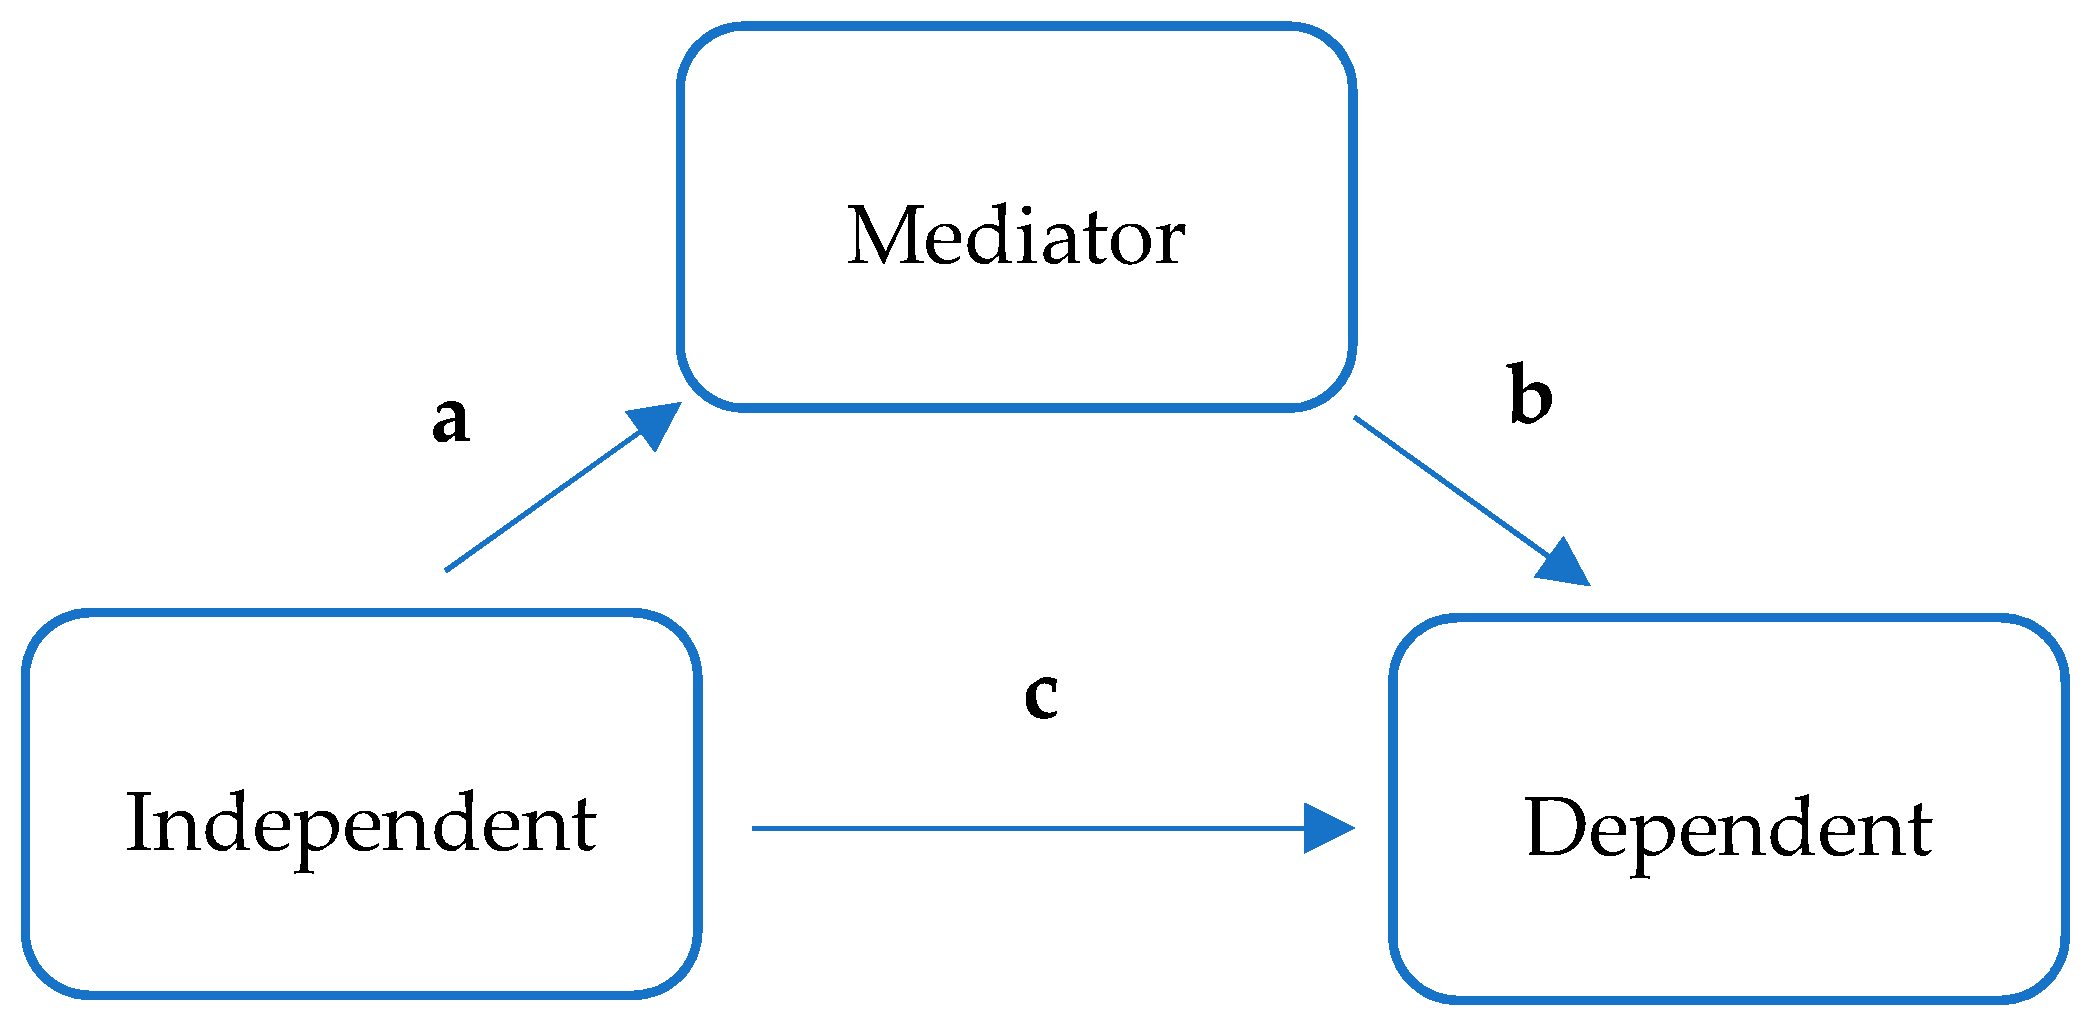
  • Hypothesis 2a1 (H2a1):Corporate resources generated through an environmental business strategy mediate in the positive correlation between eco-efficient business practices and competitive cost advantage.
  • Hypothesis 2a2 (H2a2):Corporate resources generated through an environmental business strategy mediate in the positive correlation between innovative preventive corporate practices and competitive cost advantage.
Hypothesis 2b (H2b):
Corporate resources generated through an environmental business strategy mediate in the positive correlation between environmental business strategy and competitive differentiation advantage.
  • Hypothesis 2b1 (H2b1):Corporate resources generated through an environmental business strategy mediate in the positive correlation between eco-efficient business practices and competitive differentiation advantage.
  • Hypothesis 2b2 (H2b2):Corporate resources generated through an environmental business strategy mediate in the positive correlation between innovative preventive corporate practices and competitive differentiation advantage.

2.3. Competitive Advantage and Business Financial Performance

The ultimate consequence of any competitive advantage resulting from active environmental management will probably be an improvement in financial performance [18]. Improving their environmental performance allows businesses to enhance their competitive advantage in terms of cost reduction, strong reputation among their customers, and increased competitiveness in international markets. These benefits can in turn positively influence the overall financial performance of the company [64], which at the same time can be supported by a resource-based model [20,32]. Russo and Fouts [32] tested the assumption that improving environmental performance means creating a competitive advantage, which in turn leads to economic benefits. We can, therefore, proceed to the following assumptions:
Hypothesis 3a (H3a):
A competitive cost advantage has a positive impact on a firm’s financial performance.
Hypothesis 3b (H3b):
A competitive differentiation advantage has a positive impact on a firm’s financial performance.
The Figure 1 shows the proposed conceptual framework of this research:

3. Methodology

3.1. Sample and Data Collection

The current research was carried out in February and March 2018. The population of the survey included the Managing Directors of every medium and large corporation (S.A.—Société Anonyme) operating in Greece, in any business sector, which counts 1017 entities in total (according to the International Capital—ICAP database). For the creation of the questionnaire, the existing literature was taken into consideration [65,66] in order to achieve the best results. The questionnaire contained 47 questions separated into 6 sections. The business size was determined according to the European Union definition [67]. Questionnaires were distributed to all 1017 entities, of which 188 were answered. The researchers considered this number to be sufficient for analysis, as there were no incomplete answers. Therefore, the research received an 18.5% response rate, which is considered satisfactory according to similar empirical surveys [13,21,54]. In order to assess potential nonresponse bias, the early and late respondents were compared as suggested by the literature [68]. For that purpose, the first and last 30 questionnaires were tested. The results of the independent t-test at a confidence level of 95% for all metric variables showed no statistical differences (Table A1 in Appendix). This suggests that nonresponse bias was not a concern.
The majority of respondents are men aged 45 to 54, have a postgraduate degree, and have been in that position for more than 15 years. The number of enterprises that responded is representative of the survey’s population, as it includes firms from all sectors. A total of 47.3% are industrial enterprises, 18.1% commercial enterprises, 8.5% medical services, 4.3% construction enterprises, 3.2% business services, 3.2% transportations, 3.2% telecommunications, 3.2% energy and water, 2.7% financial services, 2.1% tourism, 2.1% private education, 1.1% information technology, and 1.1% logistics. Additionally, the majority of enterprises are large (55.9%), while 44.1% are medium sized. Finally, 76.1% of the companies that participated in the survey are based in Greece, while 23.9% have their headquarters abroad (Table 1).
The structure of the questionnaire along with the variables measured in each section are presented below and summarized in Table 2.

3.2. Measures

In this section, the key variables of the study are defined into measurable factors (operationalization process), along with the corresponding measurement scales.

3.2.1. Environmental Strategy

Since the available data on business environmental performance and environmental strategy are very limited, the environmental strategy variable is usually measured on the basis of the respondents’ answers [20,23,37,40,69,70]. In this research study, that was the only available option because there is no evidence for the environmental practices of most of the sample companies.
Two sets of data were used to measure a company’s environmental proactivity. Data were grouped together following a distinction between the most innovative preventive practices (IPP) as opposed to the simpler eco-efficient practices (EEP). Although both sets of data refer to preventive practices, they differ significantly in their complexity and their objectives, ranging from significant changes in product and process design to energy saving and waste reduction. All the above have been examined in relevant studies [20,28,71].
The first group of practices was measured using 14 elements from the Aragon-Correa J.A. et al. [20,69] environmental strategy model measurement. The measurement intends to assess all the environmental practices a firm could adopt, including product and process innovations for pollution prevention. There is a five-point response scale ranging from 1 (“we have not considered this matter at all”) to 5 (“we are the leaders of this practice in our field”).
The second group of practices was measured using 9 elements for the assessment of the importance the respondent CEOs ascribe to the implementation of various eco-efficient practices. These environmental practices have been proposed as the first step towards the implementation of preventive environmental practices [20,72,73]. There is a five-point response scale ranging from 1 (“we have not considered this matter at all”) to 5 (“we are the leaders of this practice in our field”).

3.2.2. Development/Creation of New Firm Resources

The resource-based view (RBV) (FR) provides a theoretical framework explaining the creation of competitive advantage as a result of the development of new firm resources. Businesses can acquire new or develop existing resources by applying environmental practices, such as enhancing the learning process on environmental issues, developing formal and informal communication channels for the exchange of environmental information, and working with outside organizations [20,23,28,38]. We used 3 items based on the resource-based view. Respondents had to assess whether the resources developed by the company were a consequence of adopting active environmental strategies using a Likert 5-level response scale. For the first statement, the scale ranged from 1 (“we did not use”) to 5 (“mostly used”), while for the other two statements the scale ranged from 1 (“totally disagree”) to 5 (“totally agree”).

3.2.3. Competitive Advantage

Environmental competitiveness is defined as the part of the overall business competitiveness and financial performance that can be affected by the adoption of corporate environmental management practices [19].
However, measuring environmental competitiveness is not easy, as there are no available quantitative data on the environmental competitiveness of individual companies. As many business results as possible should be evaluated to provide an overall assessment of environmental competitiveness and the influence of environmental strategy on a company’s performance. Therefore, corporate self-evaluation by means of measurable factors is the most appropriate approach [20,70].
Two factors were used in this research to measure this variable [19,20,23,64]: “Competitive advantage in cost (CAC)” and “Competitive advantage in differentiation (CAD)”.
A five-point Likert scale was used for this measurement, ranging from “very negative” to “negative”, “neutral”, “positive”, and “very positive”), assessing to what extent the environmental management activities of the company were beneficial to each of the above elements of competitive advantage.

3.2.4. Firm Financial Performance

Researchers studying business strategy and physical environment have examined both the respondents’ subjective perceptions [37,74] and objective data [32]. The main reason why subjective perceptions are used in relevant studies is because respondents tend to give unprompted answers without referring to specific, quantitative data [20].
The current survey tested the respondents’ perception of financial performance by asking them to evaluate their company’s performance in comparison with other companies operating in the same sector, on the basis of 3 indicators: Return on investment, net income, and net profit margin [13,20,27,75]. A fifth-level response scale (from 1 “much worse” to 5 “much better”) was used to measure this (FFP) variable.

3.2.5. Control Variables

Because the typology of the sample enterprises varied significantly, it was considered necessary to use the size of the organization to control possible variations. The annual turnover and the number of employees were used as size indicators. However, since the two indicators were largely correlated, in this sample only the number of employees was retained. The logarithm of the number of employees in sample businesses was used to measure the sample companies’ size.

4. Analysis and Results

4.1. Analysis

In the present study, factor analysis was used to check the validity of both the data and the conceptual framework [76]. The first step in this process was to check the suitability of the data. The factor analysis method requires that the sample size be 5–10 times larger than the number of measured items for each variable [77]. In this survey, the responses were from 188 enterprises, while the largest group of questions for a single variable included 14 measured items. Therefore, counting more than 140 companies this study meets the factor analysis condition.
Subsequently, the Cronbach’s alpha [78] measure of internal consistency was used to carry out a reliability check. Values of alpha closer to 1 indicate higher reliability between measurements. Values of alpha lower than 0.6 indicate that there is no reliable consistency, while values higher than 0.7 indicate the opposite [79]. According to the results, all reliabilities exceeded the recommended 0.7 level (Table 3). After that, we performed correlation checks among variables (Table 4) using the determinant of the correlation matrix, which according to the relevant literature must be over 0.00001 [78]. Additionally, the Kaiser–Meyer–Olkin (KMO) test for sampling adequacy and the Bartlett’s test of sphericity for the correlation of variances were used. According to the Kaiser–Meyer–Olkin measure of sampling adequacy [80], only KMO values higher than 0.5 are acceptable for factor analysis, while the values of the Bartlett sphericity test must be statistically significant (sig. < 0.05) [78] (Table 3). Regarding factor loadings, values above 0.6 are considered high, while values above 0.4 are considered the cut-off of low values [81]. These components set the basis for the creation of factor scores used to analyze research cases [82]. The Kaiser criterion, which is usually applied for the assessment of different components, indicates the selection of components for which the eigenvalue is higher than 1 (the eigenvalue-one criterion). If a second factor with eigenvalue higher than 1 is observed, then the scree plot and the relation between the eigenvalues are examined.
The principal component analysis (PCA) method was used for factor analysis, while the varimax rotation method was used for the extraction of components with the simplest orthogonal rotation [78]. The factor analysis results showed that the data obtained were appropriate in terms of validity and reliability. We could, therefore, proceed to testing the research cases.
In Table 3, the Z-test (1.96) shows that a small number of variables show a statistically significant difference in asymmetry and/or kurtosis [78]. Based on the above, transforming the data of the variables was not considered necessary. Additionally, data transformation would entail the loss of valuable information about the conceptual items under study.
In order to examine the hypotheses and identify the casual relationships between the variables, multiple linear regressions were used [54,78].
The “eco-efficiency practices” variable (t = 3.977, p < 0.01) has a significant contribution in the prediction of the dependent financial firm performance variable (Table 5).
The “innovative preventive practices” variable (t = 4.990, p < 0.01) has a significant contribution in the prediction of the dependent financial firm performance variable (Table 6).
The H2a1 hypothesis was initially examined by the Pearson’s r. The test shows that although the EEP variable is correlated with the CAC variable (r = 0.256 **, p < 0.01), it is not correlated with the FR variable (r = 0.131, p = 0.074). Consequently, FR cannot mediate the positive relation between EEP and CAC.
The examination of the H2a2 hypothesis was initially carried out by the Pearson’s r. The test led to the conclusion that there is significant positive correlation between variables IPP–FR (r = 0.406 **, p < 0.01), FR–CAC (r = 0.459 **, p < 0.01), and IPP–CAC (r = 0.307 **, p < 0.01).
The simple mediation model (Hayes, 2013) was used to find out whether the “development/creation of new resources” (FR) variable is a mediator variable in the relationship between “innovative environmental practices” (IPP) and “cost competitive advantage” (CAC). According to this model, conclusions were drawn for the direct effect (c) of the independent variable on the dependent and the indirect effect (a, b) through the mediator variable (Figure 2).
Initially, we examined the casual relationship between IPP and FR. Model 1 explains 16.5% of the FR volatility, while it significantly improves the predictive outcome (F = 36.7178, p < 0.01). The coefficient a, which indicates the relationship between IPP and FR, is equal to 0.406. Then, all variables are examined with dependent variable CAC. Model 2 explains 22.8% of the versatility of the CAC, while it significantly improves the predictive ability (F = 27.3602, p < 0.01). The coefficient b, which shows the relationship between FR and CAC, is equal to 0.4 (t = 5.6656 **, p < 0.01), while coefficient c, which shows the relationship between IPP and CAC (direct effect), is 0.1446 (t = 2.0461 *, p < 0.05) (Table 7).
Table 8 shows that the indirect effect of using FR as a mediation variable is statistically significant as the bootstrap confidence interval does not include a zero value (BootLLCI = 0.0941 and BootULCI = 0.2366).
The H2b1 hypothesis was initially examined by the Pearson’s r. The test shows that although the EEP variable is correlated with the CAD variable (r = 0.264 **, p < 0.01), it is not correlated with the FR variable (r = 0.131, p = 0.074). Consequently, FR cannot mediate the positive relation between EEP and CAD.
The examination of the H2b2 hypothesis was initially carried out by the Pearson’s r. The test led to the conclusion that there is significant positive correlation between variables IPP–FR (r = 0.406 **, p < 0.01), FR–CAD (r = 0.575 **, p < 0.01), and IPP–CAC (r = 0.329 **, p < 0.01).
Subsequently, we examined coefficients for the mediation of FR in the relationship of IPP and CAD. Model 1 explains 16.5% of the FR volatility, while it significantly improves the predictive outcome (F = 36.7178, p < 0.01). The coefficient a, which indicates the relationship between IPP and FR, is equal to 0.406. Then, all variables are examined with dependent variable CAD. Model 2 explains 34.13% of the versatility of the CAD, while it significantly improves the predictive ability (F = 47.9249, p < 0.01). The coefficient b, which shows the relationship between FR and CAD, is equal to 0.5284(t = 8.0929 **, p < 0.01), while coefficient c, which shows the relationship between IPP and CAD (direct effect), is 0.1142 (t = 1.7489 *, p < 0.05) (Table 9).
Table 10 shows that the indirect effect of using FR as a mediation variable is statistically significant as the bootstrap confidence interval does not include a zero value (BootLLCI = 0.1302 and BootULCI = 0.3114).
The CAC variable (t = 8.547, p < 0.01) has a significant contribution in the prediction of dependent variable FFR (Table 11).
The CAD variable (t = 11.107, p < 0.01) has a significant contribution in the prediction of dependent variable FFR (Table 12).

4.2. Results

The results for the H1 (H1a, H1b) research case group suggest that environmental strategies have a positive impact on business financial performance. The positive correlation between business environmental strategy and business financial performance confirms the results of most existing studies [20,23,28,31,32,33,34,35,36,37]. This positive correlation demonstrates the mutual effect of active environmental strategies and valuable competitive opportunities (e.g., cost saving, product diversification), even in times of economic recession.
The measurement for the H2 (H2a1, H2a2, H2b1, H2b2) research case group shows that while corporate resources generated through an environmental strategy positively mediate between innovative preventive practices and competitive (cost and differentiation) advantage, they do not appear to mediate between eco-efficient practices and competitive advantage. This is because the eco-efficient practices applied by Greek companies during the period of the economic crisis have not improved the production process. Essentially, while the respondents acknowledge the effect of these practices on cost reduction, the benefits have not emerged through the production of new products, nor have they been invested into the creation of “green” resources. The latter has been achieved through innovative practices. The researcher assumes that this situation mirrors the deep economic recession and the wider economic climate of the period. Greek businesses, operating in conditions of minimum liquidity and reduced demand, have funneled the capital they have earned from increasing their effectiveness to the reduction of their operating costs to improve competitiveness. This has given them the necessary liquidity and profitability to cope with in a strained economic environment.
Finally, the testing of the H3 (H3a, H3b) research group denotes that the competitive advantage of cost and differentiation has a positive impact on a company’s financial performance. The findings of this research study confirm those of the existing literature [18,20,32,64], where it is contended that by improving their environmental performance, businesses can strengthen their competitive advantage in terms of cost reduction, reputation enhancement among customers, and improved competitiveness in international markets. These, in turn, positively influence the overall financial performance of a company.

5. Discussion, Conclusions, and Future Research

The discussion about the relationship between environmental protection and a firm’s performance has undoubtedly been at the top of the public agenda in recent years. As a main part of this research, we analyzed the determinants of environmental strategy and examined the links between environmental strategy and a firm’s performance. This research confirmed the positive impact of environmental strategy on the growth of medium and large businesses in Greece in times of economic crisis. Our contribution is to show that large and medium corporates can adopt eco-efficient practices and innovative preventive practices in times of recession, and these practices can lead to exceptional financial performance. Moreover, our research also contributes to the resource-based view by showing that this perspective is relevant for medium and large firms in time of recession.
Specifically, according to the research findings, the CEOs of Greek enterprises lay emphasis on the creation of a cost and differentiation competitive advantage through environmental strategies. For that reason, they have intensified environmental audits, enhanced recycling programs, and introduced stricter environmental requirements into their operational plans. This result confirms the existing studies that have occurred in different countries [18,20,21,54,64]. Even when the creation of new resources is not integrated in an environmental practice, the correlation between environmental strategies and competitive advantage is positive. This result revealed that environmental strategies create a competitive advantage, which is in accordance with the conclusions of existing literature [7,13,20,23,49]. The administrative executives in Greek enterprises of all sectors seem to recognize environmental ethics and the production of eco-friendly goods and services as the lever for growth and business relaunching, even in periods of economic recession. Therefore, they have either invested in innovative practices, implemented recycling processes, or improved existing procedures. Our findings coincide with those derived from previous research [20,21,33,83].
Moreover, they acknowledge that the implementation of the environmental strategy has led to improved financial performance compared to their main competitors and to their own business plan provisions. These results confirm previous research [13,18,20,21,27,32,33,83].
Finally, some limitations and future research opportunities should be noted. Firstly, since this survey relies on subjective perceptions provided by firm CEO, future research could make use of objective qualitative and quantitative data, for example, data retrieved from sustainability reports, corporate Social Responsibility reports, or similar databases. Secondly, this survey relies on measurements provided only by the population of a single country. For that reason, we would like to suggest future research in other countries, in order to have the chance to compare and confirm findings from places bearing different socioeconomic characteristics.

Author Contributions

Writing—review and editing, A.E.F., E.A.D., M.-M.H.T. and D.A.G.

Funding

The APC was funded by University of Piraeus Research Center.

Acknowledgments

The authors wish to thank the University of Piraeus Research Center for funding the study.

Conflicts of Interest

The authors declare no conflict of interest.

Appendix A

Table A1. t-test—nonresponse bias.
VariablesLevene’s Testt-test
FSig.tdfSig. (2-tailed)Difference in Means
IPP10.2980.5870.567590.5730.16022
IPP20.3910.534−0.304590.762−0.07419
IPP30.7860.379−0.023590.982−0.00538
IPP40.6060.439−0.022590.982−0.00645
IPP50.5010.482−0.436590.665−0.14731
IPP61.2740.2640.296590.7690.04301
IPP70.6630.419−0.163590.871−0.03871
IPP80.7770.3820.020590.9840.00645
IPP90.8510.3600.052590.9590.01613
IPP100.1340.7160.430590.6690.13118
IPP110.5860.447−0.041590.967−0.0129
IPP120.0030.9590.396590.6940.11828
IPP130.5480.462−0.014590.989−0.0043
IPP140.2170.643−0.162590.872−0.05591
EEP10.1550.6950.103590.9180.0172
EEP22.0280.160.898590.3730.12151
EEP30.6700.416−0.485590.629−0.12473
EEP40.0010.9740.409590.6840.08065
EEP50.2060.6510.423590.6740.07634
EEP60.0060.9400.598590.5520.19677
EEP70.0000.9930.301590.7640.04839
EEP80.2780.6000.535590.5940.08495
EEP90.0060.9390.273590.7860.04731
FR1a0.0180.8950.004590.9970.00108
FR1b0.3690.546−0.139590.890−0.03763
FR1c0.0410.840−0.333590.740−0.05269
FR2a0.0110.918−0.673590.503−0.19462
FR2b0.1140.737−0.412590.682−0.09032
FR2c0.3730.544−0.496590.622−0.0828
FR3a0.0670.796−0.785590.435−0.16237
FR3b0.1130.738−0.782590.438−0.16022
CAC10.2100.6480.235590.8150.04409
CAC20.4240.5170.413590.6810.08172
CAC30.3080.581−0.354590.724−0.06129
CAC40.5710.4530.135590.8930.02258
CAC50.1060.7450.073590.9420.01398
CAC60.1540.6960.14590.8890.03871
CAC70.2120.6470.326590.7460.05914
CAD10.0140.9060.027590.9790.0043
CAD20.0360.850.375590.7090.06344
CAD30.1140.7360.271590.7870.05699
CAD40.1250.7250.397590.6930.08602
CAD50.3530.555−0.04590.968−0.00645
CAD60.6860.4110.169590.8670.02473
CAD70.4390.5100.087590.9310.01613
CAD81.0800.303−0.572590.570−0.07312
FFP1a1.0920.300−0.043590.966−0.0086
FFP1b0.0350.8520.154590.8780.03118
FFP1c0.1390.711−0.354590.724−0.06667
FFP2a0.0090.926−0.081590.936−0.01505
FFP2b0.1630.688−0.05590.961−0.00753
FFP2c0.0920.763−0.537590.594−0.07312

References

  1. Van den Bergh, J.C. Environment versus growth—A criticism of “degrowth” and a plea for “a-growth”. Ecol. Econ. 2011, 70, 881–890. [Google Scholar] [CrossRef]
  2. Brock, W.A.; Taylor, M.S. Economic growth and the environment: A review of theory and empirics. In Handbook of Economic Growth; Elsevier: Amsterdam, The Netherlands, 2005; Volume 1, pp. 1749–1821. [Google Scholar]
  3. Spangenberg, J.H. Biodiversity pressure and the driving forces behind. Ecol. Econ. 2007, 61, 146–158. [Google Scholar] [CrossRef]
  4. Heikkurinen, P.; Bonnedahl, K.J. Corporate responsibility for sustainable development: A review and conceptual comparison of market-and stakeholder-oriented strategies. J. Clean. Prod. 2013, 43, 191–198. [Google Scholar] [CrossRef]
  5. Husted, B.W. A contingency theory of corporate social performance. Bus. Soc. 2000, 39, 24–48. [Google Scholar] [CrossRef]
  6. Ho, F.N.; Wang, H.-M.D.; Vitell, S.J. A global analysis of corporate social performance: The effects of cultural and geographic environments. J. Bus. Ethics 2012, 107, 423–433. [Google Scholar] [CrossRef]
  7. Lo, S.F.; Sheu, H.J. Is corporate sustainability a value-increasing strategy for business? Corp. Gov. Int. Rev. 2007, 15, 345–358. [Google Scholar] [CrossRef]
  8. Lamberti, L.; Noci, G. The relationship between CSR and corporate strategy in medium-sized companies: Evidence from Italy. Bus. Ethics A Eur. Rev. 2012, 21, 402–416. [Google Scholar] [CrossRef]
  9. Munro, D.A.; Holdgate, M.W. Caring for the Earth: A Strategy for Sustainable Living; Routledge: Abingdon, UK, 1991. [Google Scholar]
  10. Barbier, E.B. The concept of sustainable economic development. Environ. Conserv. 1987, 14, 101–110. [Google Scholar] [CrossRef]
  11. Borga, F.; Citterio, A.; Noci, G.; Pizzurno, E. Sustainability report in small enterprises: Case studies in Italian furniture companies. Bus. Strategy Environ. 2009, 18, 162–176. [Google Scholar] [CrossRef]
  12. Gladwin, T.N.; Kennelly, J.J.; Krause, T.-S. Shifting paradigms for sustainable development: Implications for management theory and research. Acad. Manag. Rev. 1995, 20, 874–907. [Google Scholar] [CrossRef]
  13. López-Gamero, M.D.; Molina-Azorín, J.F.; Claver-Cortes, E. The whole relationship between environmental variables and firm performance: Competitive advantage and firm resources as mediator variables. J. Environ. Manag. 2009, 90, 3110–3121. [Google Scholar] [CrossRef] [PubMed] [Green Version]
  14. Choudri, B.; Baawain, M.; Al-Zeidi, K.; Al-Nofli, H.; Al-Busaidi, R.; Al-Fazari, K. Citizen perception on environmental responsibility of the corporate sector in rural areas. Environ. Dev. Sustain. 2017, 19, 2565–2576. [Google Scholar] [CrossRef]
  15. Moravcikova, D.; Krizanova, A.; Kliestikova, J.; Rypakova, M. Green Marketing as the Source of the Competitive Advantage of the Business. Sustainability 2017, 9, 2218. [Google Scholar] [CrossRef]
  16. Fund, I.M. Greece: Staff Report on Request for Stand-by Arrangement; International Monetary Fund: Washington, DC, USA, 2010. [Google Scholar]
  17. Greece, B.O. Governor’s Report for the Year 2010; Bank of Greece: Athens, Greece, 2011. [Google Scholar]
  18. González-Benito, J.; González-Benito, Ó. Environmental proactivity and business performance: An empirical analysis. Omega 2005, 33, 1–15. [Google Scholar] [CrossRef]
  19. Wagner, M.; Schaltegger, S. The effect of corporate environmental strategy choice and environmental performance on competitiveness and economic performance: An empirical study of EU manufacturing. Eur. Manag. J. 2004, 22, 557–572. [Google Scholar] [CrossRef]
  20. Aragón-Correa, J.A.; Hurtado-Torres, N.; Sharma, S.; García-Morales, V.J. Environmental strategy and performance in small firms: A resource-based perspective. J. Environ. Manag. 2008, 86, 88–103. [Google Scholar] [CrossRef] [PubMed]
  21. Ryszko, A. Proactive environmental strategy, technological eco-innovation and firm performance—Case of poland. Sustainability 2016, 8, 156. [Google Scholar] [CrossRef]
  22. Bansal, P. Evolving sustainably: A longitudinal study of corporate sustainable development. Strat. Manag. J. 2005, 26, 197–218. [Google Scholar] [CrossRef]
  23. Christmann, P. Effects of “best practices” of environmental management on cost advantage: The role of complementary assets. Acad. Manag. J. 2000, 43, 663–680. [Google Scholar]
  24. Margolis, J.D.; Walsh, J.P. Misery loves companies: Rethinking social initiatives by business. Adm. Sci. Q. 2003, 48, 268–305. [Google Scholar] [CrossRef]
  25. Genç, K.Y. Natural environment as a strategic issue for firms: Theoretical perspectives. Procedia Soc. Behav. Sci. 2013, 99, 143–153. [Google Scholar] [CrossRef]
  26. Carballo-Penela, A.; Castromán-Diz, J.L. Environmental policies for sustainable development: An analysis of the drivers of proactive environmental strategies in the service sector. Bus. Strategy Environ. 2015, 24, 802–818. [Google Scholar] [CrossRef]
  27. Lucato, W.C.; Costa, E.M.; de Oliveira Neto, G.C. The environmental performance of SMEs in the Brazilian textile industry and the relationship with their financial performance. J. Environ. Manag. 2017, 203, 550–556. [Google Scholar] [CrossRef] [PubMed]
  28. Hart, S.L. A natural-resource-based view of the firm. Acad. Manag. Rev. 1995, 20, 986–1014. [Google Scholar] [CrossRef]
  29. Ghisetti, C.; Rennings, K. Environmental innovations and profitability: How does it pay to be green? An empirical analysis on the German innovation survey. J. Clean. Prod. 2014, 75, 106–117. [Google Scholar] [CrossRef]
  30. Chiou, T.-Y.; Chan, H.K.; Lettice, F.; Chung, S.H. The influence of greening the suppliers and green innovation on environmental performance and competitive advantage in Taiwan. Transp. Res. Part E Logist. Transp. Rev. 2011, 47, 822–836. [Google Scholar] [CrossRef]
  31. Klassen, R.D.; McLaughlin, C.P. The impact of environmental management on firm performance. Manag. Sci. 1996, 42, 1199–1214. [Google Scholar] [CrossRef]
  32. Russo, M.V.; Fouts, P.A. A resource-based perspective on corporate environmental performance and profitability. Acad. Manag. J. 1997, 40, 534–559. [Google Scholar]
  33. Annandale, D.; Morrison-Saunders, A.; Bouma, G. The impact of voluntary environmental protection instruments on company environmental performance. Bus. Strategy Environ. 2004, 13, 1–12. [Google Scholar] [CrossRef] [Green Version]
  34. Melnyk, S.A.; Sroufe, R.P.; Calantone, R. Assessing the impact of environmental management systems on corporate and environmental performance. J. Oper. Manag. 2003, 21, 329–351. [Google Scholar] [CrossRef]
  35. Zhu, Q.; Sarkis, J. Relationships between operational practices and performance among early adopters of green supply chain management practices in Chinese manufacturing enterprises. J. Oper. Manag. 2004, 22, 265–289. [Google Scholar] [CrossRef]
  36. Majumdar, S.K.; Marcus, A.A. Rules versus discretion: The productivity consequences of flexible regulation. Acad. Manag. J. 2001, 44, 170–179. [Google Scholar]
  37. Sharma, S.; Vredenburg, H. Proactive corporate environmental strategy and the development of competitively valuable organizational capabilities. Strat. Manag. J. 1998, 19, 729–753. [Google Scholar] [CrossRef]
  38. Aragón-Correa, J.A.; Sharma, S. A contingent resource-based view of proactive corporate environmental strategy. Acad. Manag. Rev. 2003, 28, 71–88. [Google Scholar] [CrossRef]
  39. Lehni, M. Eco-Efficiency: Creating More Value with Less Impact; World Business Council for Sustainable Development: Geneva, Switzerland, 2000. [Google Scholar]
  40. Flannery, B.L.; May, D.R. Environmental ethical decision making in the US metal-finishing industry. Acad. Manag. J. 2000, 43, 642–662. [Google Scholar]
  41. Dean, T.J.; Brown, R.L.; Bamford, C.E. Differences in large and small firm responses to environmental context: Strategic implications from a comparative analysis of business formations. Strat. Manag. J. 1998, 19, 709–728. [Google Scholar] [CrossRef]
  42. Dean, T.J.; Brown, R.L.; Stango, V. Environmental regulation as a barrier to the formation of small manufacturing establishments: A longitudinal examination. J. Environ. Econ. Manag. 2000, 40, 56–75. [Google Scholar] [CrossRef]
  43. Rutherfoord, R.; Blackburn, R.A.; Spence, L.J. Environmental management and the small firm: An international comparison. Int. J. Entrep. Behav. Res. 2000, 6, 310–326. [Google Scholar] [CrossRef]
  44. Miles, M.P.; Munilla, L.S.; McClurg, T. The impact of ISO 14,000 environmental management standards on small and medium sized enterprises. J. Qual. Manag. 1999, 4, 111–122. [Google Scholar] [CrossRef]
  45. Henri, J.-F.; Journeault, M. Environmental performance indicators: An empirical study of Canadian manufacturing firms. J. Environ. Manag. 2008, 87, 165–176. [Google Scholar] [CrossRef] [PubMed]
  46. Hart, S.L.; Dowell, G. Invited editorial: A natural-resource-based view of the firm: Fifteen years after. J. Manag. 2011, 37, 1464–1479. [Google Scholar] [CrossRef]
  47. Wagner, M. How to reconcile environmental and economic performance to improve corporate sustainability: Corporate environmental strategies in the European paper industry. J. Environ. Manag. 2005, 76, 105–118. [Google Scholar] [CrossRef] [PubMed]
  48. Galdeano-Gomez, E.; Céspedes-Lorente, J.; Martínez-del-Río, J. Environmental performance and spillover effects on productivity: Evidence from horticultural firms. J. Environ. Manag. 2008, 88, 1552–1561. [Google Scholar] [CrossRef] [PubMed]
  49. Shrivastava, P. Environmental technologies and competitive advantage. Strat. Manag. J. 1995, 16, 183–200. [Google Scholar] [CrossRef]
  50. Fraj-Andrés, E.; Martínez-Salinas, E.; Matute-Vallejo, J. Factors affecting corporate environmental strategy in Spanish industrial firms. Bus. Strategy Environ. 2009, 18, 500–514. [Google Scholar] [CrossRef]
  51. Weng, H.-H.R.; Chen, J.-S.; Chen, P.-C. Effects of green innovation on environmental and corporate performance: A stakeholder perspective. Sustainability 2015, 7, 4997–5026. [Google Scholar] [CrossRef]
  52. Lee, K.-H.; Min, B. Green R&D for eco-innovation and its impact on carbon emissions and firm performance. J. Clean. Prod. 2015, 108, 534–542. [Google Scholar]
  53. Zhang, Y.-J.; Peng, Y.-L.; Ma, C.-Q.; Shen, B. Can environmental innovation facilitate carbon emissions reduction? Evidence from China. Energy Policy 2017, 100, 18–28. [Google Scholar] [CrossRef]
  54. Long, X.; Chen, Y.; Du, J.; Oh, K.; Han, I. Environmental innovation and its impact on economic and environmental performance: Evidence from Korean-owned firms in China. Energy Policy 2017, 107, 131–137. [Google Scholar] [CrossRef]
  55. Lankoski, L. Corporate responsibility activities and economic performance: A theory of why and how they are connected. Bus. Strategy Environ. 2008, 17, 536–547. [Google Scholar] [CrossRef]
  56. Ecker, S.; Coote, L. BestFarms-An Integrated Approach to Environmentally Sustainable Farming in the South-west Region of Western Australia. Australas. J. Environ. Manag. 2005, 12, 215–220. [Google Scholar]
  57. Walley, K.; Custance, P.; Parsons, S. UK consumer attitudes concerning environmental issues impacting the agrifood industry. Bus. Strategy Environ. 2000, 9, 355–366. [Google Scholar] [CrossRef]
  58. Azzone, G.; Bertelè, U. Exploiting green strategies for competitive advantage. Long Range Plan. 1994, 27, 69–81. [Google Scholar] [CrossRef]
  59. Porter, M.; Van der Linde, C. Green and competitive: Ending the stalemate. Harv. Bus. Rev. 1995, 33, 5. [Google Scholar]
  60. Wubben, E.F. The Dynamics of the Eco-Efficient Economy: Environmental Regulation and Competitive Advantage; Edward Elgar Publishing: Cheltenham, UK, 2000. [Google Scholar]
  61. Witjes, S.; Vermeulen, W.J.; Cramer, J.M. Assessing Corporate Sustainability integration for corporate self-reflection. Resour. Conserv. Recycl. 2017, 127, 132–147. [Google Scholar] [CrossRef]
  62. Covin, J.G.; Slevin, D.P. New venture strategic posture, structure, and performance: An industry life cycle analysis. J. Bus. Ventur. 1990, 5, 123–135. [Google Scholar] [CrossRef]
  63. Aragón-Correa, J.A.; Rubio-Lopez, E.A. Proactive corporate environmental strategies: Myths and misunderstandings. Long Range Plan. 2007, 40, 357–381. [Google Scholar] [CrossRef]
  64. Lindell, M.; Karagozoglu, N. Corporate environmental behaviour–a comparison between Nordic and US firms. Bus. Strategy Environ. 2001, 10, 38–52. [Google Scholar] [CrossRef]
  65. Saunders, M.; Lewis, P.; Thornhill, A. Research Methods for Business Students; Pearson Education: London, UK, 2009. [Google Scholar]
  66. Dillman, D.A.; Smyth, J.D.; Christian, L.M. Internet, Phone, Mail and Mixed-Mode Surveys: The Tailored Design Method. Reis 2016, 154, 161–176. [Google Scholar]
  67. COTE. General Report on the Activities of the European Union; European Commission: Brussels, Belgium, 2003. [Google Scholar]
  68. Armstrong, J.S.; Overton, T.S. Estimating nonresponse bias in mail surveys. J. Mark. Res. 1977, 14, 396–402. [Google Scholar] [CrossRef]
  69. Aragón-Correa, J.A. Strategic proactivity and firm approach to the natural environment. Acad. Manag. J. 1998, 41, 556–567. [Google Scholar] [CrossRef]
  70. Sharma, S. Managerial interpretations and organizational context as predictors of corporate choice of environmental strategy. Acad. Manag. J. 2000, 43, 681–697. [Google Scholar]
  71. Marcus, A.A.; Anderson, M.H. A general dynamic capability: Does it propagate business and social competencies in the retail food industry? J. Manag. Stud. 2006, 43, 19–46. [Google Scholar] [CrossRef]
  72. Schmidheiny, S. Changing Course: A Global Business Perspective on Development and the Environment; MIT Press: Cambridge, MA, USA, 1992; Volume 1. [Google Scholar]
  73. Smith, M.; Kemp, R. Small Firms and the Environment: A Grounded Report; Grounded in Birmingham: Birmingham, AL, USA, 1998. [Google Scholar]
  74. Judge, W.Q.; Douglas, T.J. Performance implications of incorporating natural environmental issues into the strategic planning process: An empirical assessment. J. Manag. Stud. 1998, 35, 241–262. [Google Scholar] [CrossRef]
  75. Gitman, L.J.; Zutter, C.J. Principles of Managerial Finance, 14th ed.; Pearson: Boston, MA, USA, 2015; Volume 1, (various pagings). [Google Scholar]
  76. Trochim, W.; Donnelly, J.P.; Arora, K. Research Methods: The Essential Knowledge Base; Nelson Education: Scarborough, ON, Canada, 2015. [Google Scholar]
  77. Kass, R.A.; Tinsley, H.E.A. Factor Analysis. J. Leis. Res. 1979, 11, 120–138. [Google Scholar] [CrossRef]
  78. Field, A. Discovering Statistics Using IBM SPSS Statistics; Sage: Newcastle upon Tyne, UK, 2013. [Google Scholar]
  79. Sekaran, U.; Bougie, R. Research Methods for Business: A Skill Building Approach; John Wiley & Sons: Hoboken, NJ, USA, 2016. [Google Scholar]
  80. Kaiser, H.F. An index of factorial simplicity. Psychometrika 1974, 39, 31–36. [Google Scholar] [CrossRef]
  81. Hair, J., Jr.; Black, W.; Babin, B.; Anderson, R.; Tatham, R. SEM: An introduction. In Multivariate Data Analysis: A Global Perspective; Pearson Education: London, UK, 2010; pp. 629–686. [Google Scholar]
  82. DiStefano, C.; Zhu, M.; Mindrila, D. Understanding and using factor scores: Considerations for the applied researcher. Pract. Assess. Res. Eval. 2009, 14, 1–11. [Google Scholar]
  83. Cheng, C.C.; Yang, C.-L.; Sheu, C. The link between eco-innovation and business performance: A Taiwanese industry context. J. Clean. Prod. 2014, 64, 81–90. [Google Scholar] [CrossRef]
Figure 1. Conceptual framework.
Sustainability 10 04399 g001
Figure 2. Simple mediation model.
Sustainability 10 04399 g002
Table 1. Details of surveyed sample.
CharacteristicsFrequency (%)
Gender
Male162 (86.2)
Female26 (13.8)
Age
25–3415 (8)
35–4443 (22.9)
45–5455 (29.3)
55–6451 (27.1)
>6524 (12.7)
Education
High school diploma17 (9)
Bachelor degree72 (38.3)
Master degree90 (47.9)
Ph.D.9 (4.8)
Sector
Transportation6 (3.2)
Commerce34 (18.1)
Industry89 (47.3)
Medical services16 (8.5)
Information technology2 (1.1)
Tourism4 (2.1)
Constructions8 (4.3)
Business services6 (3.2)
Private education4 (2.1)
Telecommunications6 (3.2)
Energy–water6 (3.2)
Logistics2 (1.1)
Financial services5 (2.7)
Size
Medium83 (44.1)
Large105 (55.9)
Home country
Greece143 (76.1)
Abroad45 (23.9)
Table 2. Questionnaire Structure.
QuestionsSection DescriptionVariables
1–3Natural environment-
4–26Strategic proactivity—environmental strategy (innovative environmental practices and eco-efficient practices)IPP, EEP
27–29Development/creation of new resourcesFR
30–45Competitive advantage (cost competitive advantage, competitive differentiation advantage)CAC, CAD
46–47Business economic performanceFFP
-General comments (respondent’s comments on the research)-
-Corporate identity/demographics (business sector, number of employees, turnover, staff position, level of study)SIZE
-Respondent’s contact information (research findings available upon request)
Table 3. Reliability test.
Variables# ItemsCronbach’s Alpha (>0.7)Determinant of the Correlation Matrix (>0.00001)KMO (>0.5)Bartlett’s Test of SphericityZ-Test (1.96)
Approx. Chi-SquaredfValues for AsymmetryValues for Kyrtosis
Innovative preventive practices [IPP]140.9330.000012510.8652048.87891−0.4040.609
Eco-efficient practices [EEP]90.8690.0010.751208.96536−0.498−0.548
Development/creation of new resources [FR]80.8610.0130.817802.48728−0.506−0.531
Competitive advantage on cost [CAC]70.860.0250.746678.94821−0.3470.537
Competitive advantage on differentiation [CAD]80.850.0130.788797.54828−0.1280.436
Firm financial performance [FFP]60.8930.0110.697832.59715−0.3210.647
Table 4. Correlation of variables.
IPPEEPFRCACCADFFPSIZE
IPPPearson correlation1
Sig. (2-tailed)
N188
EEPPearson correlation0.496 **1
Sig. (2-tailed)0
N188188
FRPearson correlation0.406 **.1311
Sig. (2-tailed)00.074
N188188188
CACPearson correlation0.307 **0.256 **0.459 **1
Sig. (2-tailed)000
N188188188188
CADPearson correlation0.329 **0.264 **0.575 **0.707 **1
Sig. (2-tailed)0000
N188188188188188
FFPPearson correlation0.399 **0.302 **0.577 **0.558 **0.636 **1
Sig. (2-tailed)00000
N188188188188188188
SIZEPearson correlation0.298 **0.1220.248 **0.209 **0.1190.282 **1
Sig. (2-tailed)00.0940.0010.0040.1050
N188188188188188188188
** The correlation is significant at level of 0.01 (1-tailed)
* The correlation is significant at level of 0.05 (1-tailed)
Table 5. H1a-EEP and control variables predicting FFP.
VariableBB (SE)βtp
Constant−1.7740.492 −3.6040.00
Control variables
Size0.50.1370.2493.6460.00
Independent Variables
EEP0.2710.0680.2713.9770.00
F = 16.579, p = 0.00, R2 = 0.152
Table 6. H1b-IPP and control variables predicting FFP.
VariableBB (SE)βtp
Constant−1.2780.500 −2.5550.00
Control Variables
Size0.3590.1390.1792.5780.00
Independent Variable
IPP0.3460.0690.3464.9900.00
F = 21.514, p = 0.00, R2 = 0.189
Table 7. Model coefficients for the mediation of FR in the relationship of IPP and CAC.
ModelSymbolCoeff.S.E.tp
1ConstantI10.0000.06680.0001.00
IPPa0.4060.067060.5950.00
R2 = 0.1649
F(1.186) = 36.7178 p < 0.001
ModelSymbolCoeff.S.E.tp
2ConstantI10.0000.06440.0001.00
IPPc0.14460.070720.4610.0422
FFPb0.40040.070756.6560.000
R2 = 0.2283
F(2.185) = 27.3602 p < 0.001
Dependent variable: CAC
Table 8. H2a2-Indirect impact of IPP and CAC.
VariableEffectBootSE95% CI Bootstrap
BootLLCIBootULCI
FR0.16260.03630.09410.2366
Table 9. Model coefficients for the mediation of FR in the relationship of IPP and CAD.
ModelSymbolCoeff. S.E.tp
1ConstantI1 0.0000.06680.0001.00
IPPa 0.4060.067060595
R2 = 0.1649
F(1.186) = 36.7178 p < 0.001
ModelSymbolCoeff. S.E.tp
2ConstantI2 0.0000.05950.0001.00
IPPC 0.11420.065317489
FFPB 0.52840.0653809290.00
R2 = 0.3413
F(2.185) = 47.9249 p < 0.001
Dependent variable: CAD
Table 10. H2b2-Indirect impact of IPP and CAD.
VariableEffectBootSE95% CI Bootstrap
BootLLCIBootULCI
FR0.21460.04750.13020.3114
Table 11. H3a-CAC and control variables predicting FFP.
VariableBB (SE)βtp
Constant−1.2340.441 −2.8020.00
Control Variables
Size0.3470.1230.1732.8280.00
Independent Variable
CAC0.5220.0610.5228.5470.00
F = 47.668, p = 0.00, R2 = 0.340
Table 12. H3b-CAD and control variables predicting FFP.
VariableBB (SE)βtp
Constant−1.4970.397 −3.770.00
Control Variables
Size0.4210.1110.2093.8060.00
Independent Variable
CAD0.6110.0550.61111.1070.00
F = 74.996, p = 0.00, R2 = 0.448

