Article

Spatial Variation and Factors Impacting Grassland Circulation Price in Inner Mongolia, China

School of Agriculture and Food Sciences, The University of Queensland, Brisbane 4072, Australia
*
Author to whom correspondence should be addressed.
Sustainability 2018, 10(12), 4381; https://doi.org/10.3390/su10124381
Submission received: 28 September 2018 / Revised: 15 November 2018 / Accepted: 20 November 2018 / Published: 23 November 2018

Abstract

:
As the circulation of grassland use rights in China increases, relatively little is known about the factors that influence circulation price. This paper examines the spatial distribution of grassland circulation prices and the impact of various attributes on grassland circulation prices in Inner Mongolia Autonomous Region (IMAR). Spatial autocorrelation tests and quantile regression methods are applied to data from an online land-circulation website covering the period from January to October 2017. The spatial analysis found that grassland circulation price does vary greatly throughout IMAR but that no significant spatial autocorrelation is evident. The quantile regression analysis revealed significant, though varied, quantile effects across the price distribution indicating that local market structures, strong demand for grazing land in desert steppe, high demand of poor herders for smaller plots, and high demand of richer herders for larger plots all play an important role in determining circulation prices. These nuanced findings should enable policy makers, grassland users, and other grassland actors to better understand how grassland price is determined with respect to a range of factors across the quantiles of price as well as the spatial pattern of price characteristics. This information and understanding are a crucial step in improving grassland circulation.

1. Introduction

The grasslands of Inner Mongolia Autonomous Region (IMAR) provide the feed base for more than 57.8 million small ruminants and 8.8 million large ruminants, support the livelihoods of 10 million rural residents [1], as well as providing key ecological services in the north of China. Grassland use rights were allocated to pastoral households in the 1980s and 1990s primarily according to household size. As all land in China is owned by the state or collective, only the use rights rather than any freehold title were allocated [2]. (More details of the allocation of the use rights across the different parts of the study area are outlined in Section 3.2.) However, as the composition of pastoral households changes, along with broader structural changes and agrarian transition in pastoral and semi-pastoral areas of China, the administrative allocation may lead to a mismatch of grassland resources with household labor, capital, and management [3,4]. The ability to circulate use rights is seen as one mechanism to allow for more efficient use of the grassland resources. Two main forms of circulation are evident in China namely: (a) rental of use rights and (b) transfer of use rights. The circulation of grassland use rights not only allows those with the desire and ability to herd to gain access to additional grassland, but also frees those with skills and interests in non-pastoral occupations to pursue off-farm incomes and so promotes rural–urban migration [5].
In agricultural areas, the circulation of farm land use rights has become widespread with around 35% of the total contracted arable area (460 million mu where there are 15 mu in 1 hectare) circulated by mid-2016 of which 47% was through transfer, 33% through rental (The Law of the People’s Republic of China on the Contracting of Rural Land enacted in 2002), 6% through exchange, and 7% through cooperation [6]. The Law of the People’s Republic of China on the Contracting of Rural Land enacted in 2002 sets out the transfer of use rights where if the contractor has a stable non-agricultural occupation or income source then with mutual consent, the land use rights or contractual management can be transferred to another household [2] (Article 41 in Section 5, Chapter 2). Similarly, the Law sets out the main principles for the renting of land namely: the term of circulation must not exceed the remaining term of the contract; consultation and voluntariness; no change in the use purpose and capacity of tenant to use land for this purpose; and priority for co-operatives to rent other things being equal [2] (Article 33 in Section 5, Chapter 2). In pastoral areas, grassland circulation accelerated only after 2007, when land transfer became more formalized, reaching 75 million mu or 7.2% of total contracted grassland area in IMAR by the end of 2016. While the scope of grassland circulation has increased and become more formalized [3], less is known about price determination and discovery of grassland circulation prices which play a vital role in the operation of the grassland circulation market. Various factors potentially influence the price while the current land circulation market does not necessarily provide a good reference for prices. The heterogeneous nature of herders and investors with different needs, land resources and levels of information means scope for potentially large variation in circulation prices. Thus, it is important to understand factors affecting prices as the grassland market expands.
This study seeks to provide insights on two lesser-known areas of grassland price determination. First, a complex of local and regional factors may impact grassland price. For instance, weather or relationship with markets may dominate grassland prices in adjacent areas relative to other factors. Conversely individual characteristics of the land, of the transaction or of local social characteristics might outweigh any of the broader spatial impacts. Disentangling these regional and local impacts and identifying the extent of any spatial relationships with grassland circulation price is a key focus of the paper. Second, past studies suggest, but do not rigorously investigate, marked differences in the relationship between grassland price and land, contract and social economical characteristics across the distribution of circulation prices. Segmenting the relationships that occur within the grassland circulation market may provide a richer understanding of this market.

2. Literature Review

A growing literature on grassland circulation has accompanied the increasing encouragement of land circulation by the central government particularly in areas such as intentions [7,8], pros and cons [9], types and characteristics [10], social and economic significance [11], drivers and issues [9,12], and implications for migration and labor market policy [13]. However, to date, there has been relatively little research on the price of the grassland use rights being circulated.
According to a large scale survey in 2016 by the Research Centre for Rural Economy of the Ministry of Agriculture, big differences were reported in the average land circulation price by province (including farmland, grassland, garden land, forest land) with the price in Shanghai (3240 CNY/mu (1 USD = 6.30 CNY (April 2018))) nearly 10 times the price in Jiangxi Province (340 CNY/mu) and Inner Mongolia (390 CNY/mu on average). Land use factors, and especially the competing uses and scarcity of land, explain the very high circulation price in Shanghai and Beijing. However large variations are also observed within the same region. Du et al. [14] and Lin et al. [15] reported variations in land circulation price in Henan of between CNY 285 to 1383/mu and from CNY 100 to 714/mu in Heilongjiang Province. Currently the central government does not provide a price guide for land circulation but does encourage local governments to develop a reference value or benchmark price based on productivity, benefits, and costs including labour [16]. Nanjing City stipulates the price of circulated farmland in 2014 should not be lower than 600 CNY/mu and should include provision for a rate increase if the contract term is longer than 3 years [17] while Jiangsu Province, where Nanjing City is located, has compiled and published a price index of the circulation of rural contracted land management rights for each city each quarter since the second half of 2015 [18]. However, Jiangsu province is the exception in China in providing these reference prices. The problem is compounded in pastoral areas where the diversity of grasslands, grasslands’ social security function, characteristics of herders, less developed market, and consideration of ecological values make it difficult to determine reference prices. Furthermore, disputes continue to arise about the prices associated with grassland circulation. Gao et al. [19] found that some herders underestimated circulation prices and so transferred their grassland at lower prices and regretted the decision afterwards. As shown in a report by the Director of Xilingol League Intermediate People’s Court [20], disputes over grassland circulation account for 41% of the 512 grassland disputes in Xilingol between 2010 and 2015 while half of them related to circulation price.
Various studies have investigated factors impacting the price of farmland circulation in China. Lin et al. [15] used multiple regression analysis to examine land circulation prices in Heilongjiang Province, a main grain producing area in China’s north-eastern part, and identified grain yield, degree of rural economic development, county traffic accessibility as having significant positive impacts on land prices, while local per capita gross domestic product (GDP) and distance from the city centre had a significant negative impact. Du et al. [14] applied spatial correlation to data in Henan Province and found farmland classification and rural per capita net income were more significant factors in cultivated land circulation than GDP and public revenue and urbanization rate. In a multi-ordered logistic model of farmland use rights circulation price drawing on survey data from 786 households from Jiangxi, Anhui, and Jiangsu, Shen et al. [21] showed that households’ willingness to farm, slope and geographic location all had significantly positive effects on the price of renting out farmland-use rights, while respondent age, opportunity cost of farming, and use of social security insurance (including rural endowment insurance, new rural cooperative medical insurance, rural minimum subsistence guarantee system, accident insurance, and other insurance) had significant negative effects. In a similar survey of households in Anhui and Zhejiang, Wu et al. [22] found education levels of the family head, land usage, circulation term, and farmers’ degree of organization as the most important factors on rental price. However, Tian and Chen [23] found the price of land circulation to be determined by the relationship between various stakeholders, subject to social structure, rural norms, administrative intervention, risk sharing, and other multiple social logic interaction in addition to the land conditions, market and economic factors mentioned above.
Literature on the price of grassland circulation is much less advanced. Li et al. [24] surveyed households in Xianghuang Banner of Xilingol League of Inner Mongolia and suggested that grassland quality and precipitation may have the greatest influence on regional variations in grassland rental prices. Sa and Zhang [25], taking Dongwuzhumuqin Banner as a case, found pasture type, plant communities, vegetation height and coverage, and precipitation as the main factors affecting grassland prices while they also found a large variation in grassland circulation prices. However, their analysis, published in Chinese only, was based primarily on a qualitative assessment rather than a rigorous empirical analysis. Qiao et al. [26], in their study of the decision on whether to rent in or rent out grassland in Inner Mongolia, also examined the prices of the land rented in or out among their survey respondents. Their analysis revealed that prices depended significantly on the form of contract and relationship of the participants in the exchange, as well as on area rented and type of grassland. However, their focus was on the rental decision rather than rental price per se.
Although the aforementioned studies reveal some aspects of grassland circulation prices, there is still much to learn about the grassland circulation market. This paper focusses on two key aspects to further develop this understanding, namely the spatial pattern of prices and influence of regional and local factors, and the dominant drivers of price across different parts of the price distribution. The findings can help both parties in grassland circulation to better understand how grassland price is determined and so promote more stability and harmony in pastoral regions.

3. Methods and Materials

3.1. Methods

To address the two main aspects of interest in the study, a spatial autocorrelation analysis and quantile regression hedonic pricing analysis were done. Spatial autocorrelation is investigated using Global Moran’s Index based on both grassland location and circulation prices to show the spatial characteristics of price and to understand the degree to which circulation price in one area is related to prices in nearby areas. Moran’s Index statistic for spatial autocorrelation is given as Equation (1):
I = n i = 1 n j = 1 n w i , j ( x i x ¯ ) ( x j x ¯ ) ( i = 1 n j = 1 n w i , j ) i = 1 n ( x i x ¯ ) 2
where n is the number of observations; xi and xj are circulation prices at location i and j; x ¯ is the mean of circulation price; wi,j is the spatial weight between price i and price j where if observation i and j are spatial adjacent wi,j = 1, otherwise wi,j = 0. The numerator is normalized by the variance so that the index values are expected to fall between −1 and +1. Given a set of locations and associated price xn, if high prices cluster near other high prices and low prices cluster near other low prices, Moran’s Index will be positive. Conversely when high prices repel other high prices, and tend towards low prices, Moran’s Index will be negative. If positive cross-region prices balance negative cross-region prices, Moran’s Index will be near zero while a value of 0 indicates no autocorrelation. Moran’s Index was calculated using the Geostatistical Analyst and Spatial Statistic tools in ArcGIS 10.5 (ESRI).
After testing for spatial autocorrelation, a hedonic price model of grassland circulation price is used to identify key variables influencing price and is outlined in Equation (2). Grasslands comprise a bundle of attributes from which herders draw utility. The price for the composite product (grassland) is a function of these attributes and how herders value these attributes. However, markets exist only for the composite product (grassland) and not for the individual attributes and so values of these attributes cannot be directly observed. Hedonic price analysis enables determination of the implicit price or marginal value of the specific attributes. The independent variables in Equation (2) are a set of attributes to come out of the review of literature that may be important in determining grassland circulation price and relate to: (1) grassland characteristics which might impact on grassland use potential and hence grassland circulation price; (2) contract and transaction characteristics including term length and type; and (3) local social, economic and environmental factors including economic development. The general functional form to determine the implicit price of specific attributes for grassland circulation though the hedonic price function is:
Y ( P ) = α 0 + α 1 X G r a s s l a n d + α 2 X C o n t r a c t + α 3 X S o c i a l E c o n o m i c +
where the dependent variable, Y(P), is of grassland price in natural log form; XGrassland, XContract, and XSocialEconomic represent 3 categories of independent variables; the coefficients α1, α2 and α3 represent parameters to be estimated; α0 is constant term; ε is assumed to be a normally distributed error term, with E (ε) = 0.
The use of hedonic price analysis to determine the implicit value of particular land characteristics, including for grazing land, has long been used [27,28,29]. However, what differs from these standard studies is to look at different segments of the market. To do so, the analysis draws on quantile regression. Quantile regression was first introduced by Koenker and Bassett [30]. It is based on the minimization of weighted absolute deviations to estimate conditional quantile functions. It has become a popular tool in modelling dependence as it involves the consideration of a set of regression curves that differ across different quantiles of the conditional distribution of the dependent variable [31]. Unlike ordinary least squares (OLS) regression that is limited to explaining the mean of the dependent variable, quantile regression is more robust against non-normal errors or outliers in the response measurements and can explain the determinants at any point of the distribution of the dependent variable. Quantile regression makes it possible to statistically examine the extent to which grassland characteristics are valued differently across the distribution of bidding prices, and so provide a more precise and accurate indicator of the impact of conditional variables on the dependent variable [32].
The mathematical forms of the τ quantile for a random variable {y1, y2, y3yn} of Y, which is assumed to be linearly dependent on X (see Equation (1)), with probability distribution function FY(y) = Prob (Yy), can be shown as the inverse function:
Q Y ( τ ) = F Y 1 ( τ ) = i n f { y : F Y ( y ) τ }
where 0 < τ < 1, it splits the data into proportions τ below and 1 − τ above. When τ = 0.5 it is median regression. Median regression minimizes ∑|εi| if εi is the model prediction error ((εi = Y − Y*, Y* denote the predictor function) and quantile regression minimizes a sum that gives asymmetric penalties (1- τ)|εi| for over-prediction and τ|εi| for under-prediction. That is, a specific quantile τ can be found by minimizing the weighted absolute deviations min{∑τ|εi|+∑(1-τ)|εi|} and the quantile regression estimator β for quantile τ can be written as:
Q ( β τ ) = i : y i x i β n τ   | y i x i β τ | + i : y i < x i β n ( 1 τ ) | y i x i β τ | .
The main advantage of quantile regression is that it facilitates understanding relationships between variables outside of the mean of the data. This is useful in understanding outcomes that are non-normally distributed and that have non-linear relationships with predictor variables. Various studies use this model in many different areas of research including housing value [33], wage differentials [34] and therapy treatment effects [35]. This study applies quantile regression method to identify significant quantile effects and to show how the relationships vary across different parts of the grassland circulation price distribution.

3.2. Materials

With no official dataset and given the highly dispersed nature of Inner Mongolia’s grassland circulation market, this study leverages the unique characteristics of a public domain named Tuliu (www.tuliu.com). This domain is the largest comprehensive online service platform for land circulations in China, who provide verified (onsite or telephone check) land information covering farmland, forest land, grassland and residential land. Some 197 individual grassland observation records from 33 counties of Inner Mongolia over the period from January to October 2017 were gathered after cleaning the sample for negotiable prices or observations with incomplete information. Use of this specific platform enables this study to access prices over a wide area and with heterogeneity in the observations without problems of sample selection bias or incidental truncation. The study makes use of asking prices which may or may not correlate with final prices. However, Haurin [36] notes that the asking price was considered as a virtual reserve price for the specific parcel of grassland, indicating that offers below the asking price will not be acceptable. Thus, grassland owners should list at around the market price or otherwise risk losing potential buyers. Based on the asking price, a thematic price map of IMAR was constructed using 5 price class ranges (5–13.5, 13.5–29.4, 29.4–47.6, 47.6–101.9, 101.9–166.1 all in CNY/mu) as shown in Figure 1.
Inner Mongolia Autonomous Region is located on China’s northern frontier stretching 2400 km from east to west and 1700 km from north to south. It is adjacent to most of China’s border with Mongolia and a small section of China’s border with Russia, it is relatively close to the capital Beijing and municipality of Tianjin, borders eight provincial-level divisions, and spans across the northeast, north, and northwest of China. It is also the largest pastoral area in China with 87 million ha of natural grassland. For these reasons, IMAR grasslands are often perceived as the largest, most important and most comprehensive ecological shelter for northern China. It has 12 prefecture (city)-level divisions and 103 banner (county)-level divisions. The research samples in this study distributed across 10 city-level divisions and 33 county-level divisions. As the observations are drawn from the online website that is a secondary resource, the observations are not evenly distributed across the study region. On average, each county has around 6 observations but there is a range from 2 to 19 observations. Ar Horqin Banner and Heshigten Banner under the administration of Chifeng City exhibit the highest asking price (dark) in grassland circulation, while most counties in Hulunbuir, Xilingol and Ulanqab League have the lowest asking price (light grey).
Table 1 provides a description of variables used in this study along with the basic descriptive statistics for the variables. The average asking price of grassland circulation per mu per year is CNY 66 for IMAR as a whole in 2017, of which the average for transfer is CNY 66.75 and for rent CNY 64.54. These prices are higher than previous findings in smaller scale field work of CNY 6–8 on average in Xinlingol, Ordos and Ulanqab in 2015 [26]; around CNY 10 in Xianghuang Banner of Xilingol in 2014 [24]; and CNY 4–10 in East Ujimqin Banner of Xilingol in 2014 [25]. However, if only the observations of Xilingol and Ulanqab in this study are considered, which is CNY 10.85 and CNY 11.91 on average, the values are more consistent with the household surveys of Li et al. [24] and Sa and Zhang [25]. They also indicate that prices do vary greatly across IMAR.
Grasslands in China are owned by the state or collective with individual households enjoying fixed-term use rights, the duration of which is between 30–50 years [4]. Grassland contracting started from 1984, although most grasslands were not contracted out until the second half of the 1990s, under a different distribution system. For instance, in Old Barag Banner (Chenbaerhu), 60% of total grasslands were distributed by the number of people in the household and the other 40% is distributed by livestock number. In Siziwang Banner, herders of Mongolian nationality received one-third to one-half more allocated grassland than people from Han nationality. In Alxa, grasslands were allocated mainly on the basis of household numbers but other factors such as residential density were also considered [37]. Thus, different grassland distribution policies resulted in large differences across households in grassland areas. Even in the same League such as Xilingol, average grassland area per household in Bai Banner is only 665 mu, compared with East Ujimqin Banner, Xilinhaote and Sonid Left Banner where they are more than 10,000 mu, which may be due to the large number of herders in the southern region of IMAR immigrating to Hebei province in China’s modern history [38]. In addition, use rights by formal grassland certificate were implemented primarily before 1999. Thus, most current grassland use rights term can continue to 2028–2048, and so still have 10 to 30 years to run. This is consistent with the average circulation term 23 years in Table 1. The average circulation term by rent is 13 years, while it is around 29 years on average by rent form. The relatively long period enables an environment for long term investment and sustainable management practices.
Some 53% of observations are of typical grassland, 35% are desert grassland, and the remaining 12% are meadow grassland. Meadow grassland is the moister and most fertile land among these three grassland types, typically formed in areas with annual precipitation around 400 mm and soils of high organic content. Typical grassland usually occurs under a semi-arid climate in the temperate zone with annual precipitation of around 350 mm and the plant species are characteristically drought tolerant. Desert grassland is the most arid type, developing in places with annual precipitation between 150 and 250 mm and under the impact of continental climatic in the medium temperate zone [39]. All three types of grassland are used for livestock grazing in IMAR. Around 28% of grassland parcels have no irrigation facilities, 37% have basic irrigation facilities like dams and ditches that can guide surface water such as rivers and lakes basically meeting the water demand of pasture growth, while 34% have full irrigation capacity such as advanced sprinkler irrigation facility that can use groundwater fully meeting the water demand of pasture growth and saving water. More than half of the observed grassland parcels (52.8%) are located at a distance of between 10 km and 50 km from the nearest national road, 36% are located within 10 km, while the other 11.2% are located beyond 50 km. As for transaction form, 59% of vendors transacting land would like to transfer while the other 41% would like to rent out. The term of rent cannot exceed the remaining years of grassland owners’ contract duration, while herders lose their grassland contract rights with transfer [2]. Thus, households who would like to transfer their grasslands must have a substantial non-farm income guarantee and obtain approval from the collective. The substantial difference between rent and transfer is that grassland tenants by transfer establish a new and formal contract with the collective and so can receive corresponding subsidies and benefits including an award for forage-livestock balance (CNY 1.5 per mu per year), a subsidy for pastoralist’s production materials (CNY 500 per household per year), and a grass seed subsidy (about CNY 30/mu for the first three years) [40]. Conversely, grassland rent does not affect the original household contracted relationship and so tenants are not eligible to receive subsidies from the grassland authorities. Local gross domestic production value and per capita disposable income of permanent residents of rural and pastoral areas are compiled from information contained in the Inner Mongolia Statistic Yearbook [41].

4. Results and Discussions

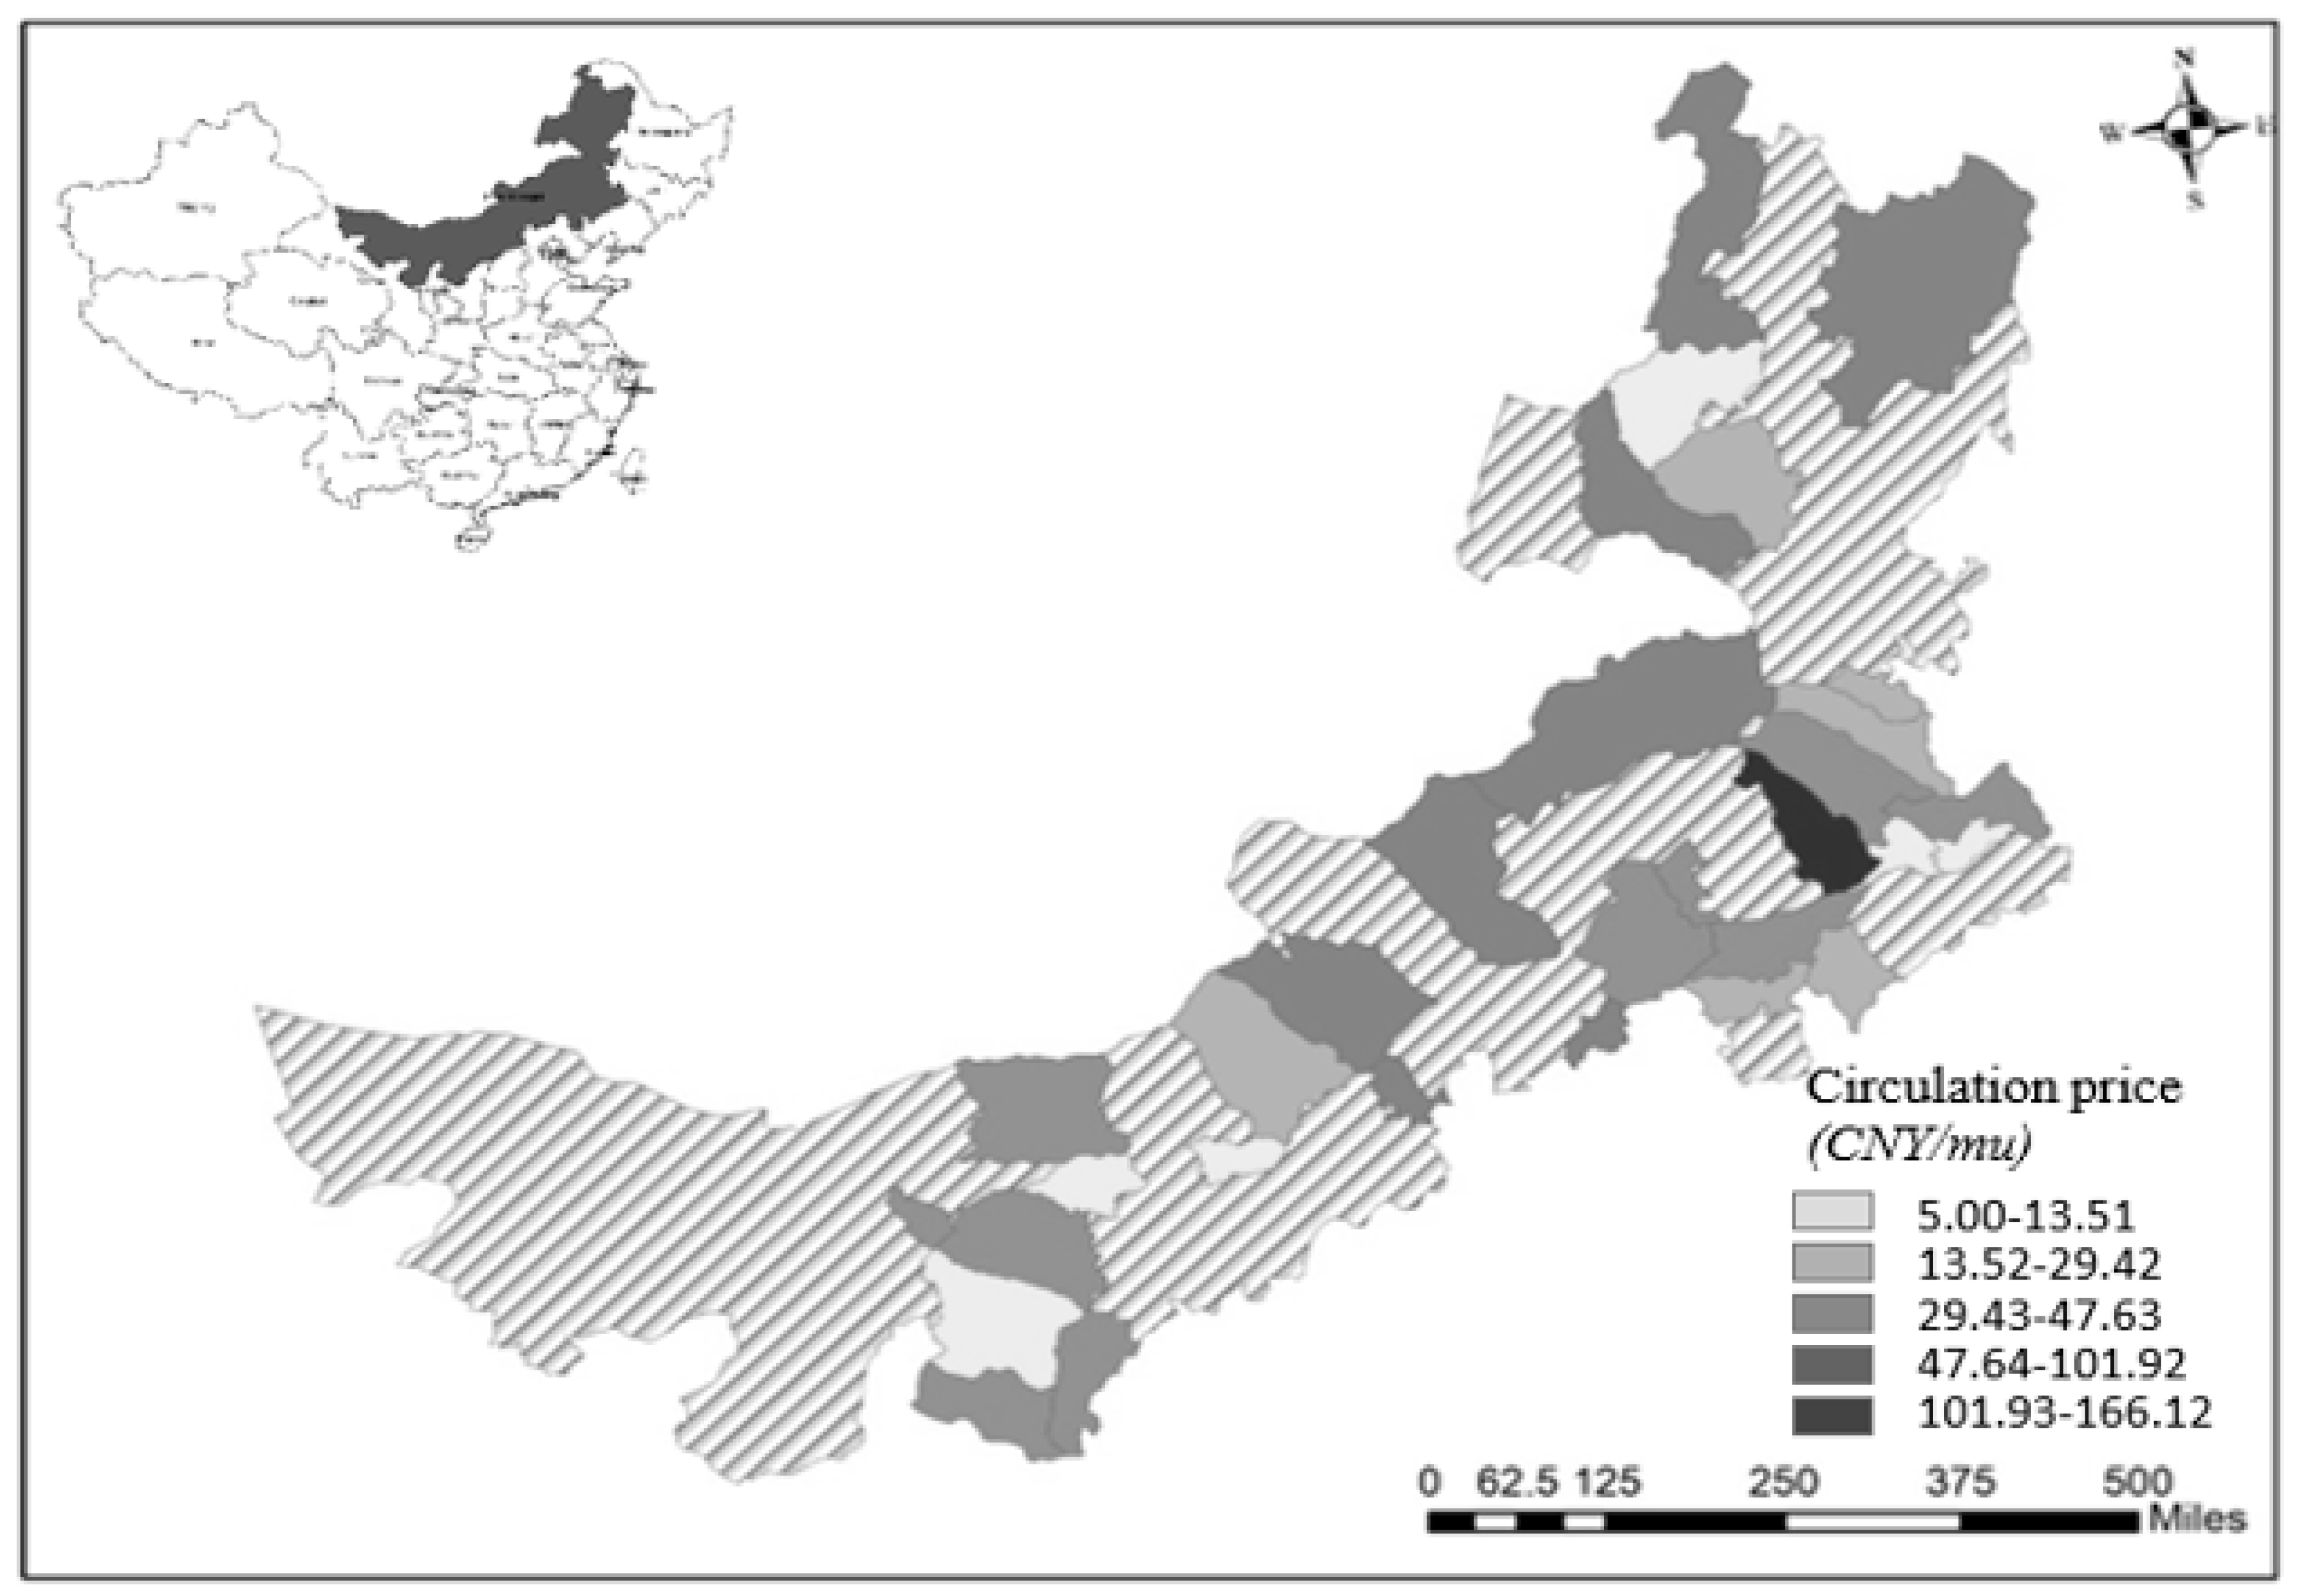
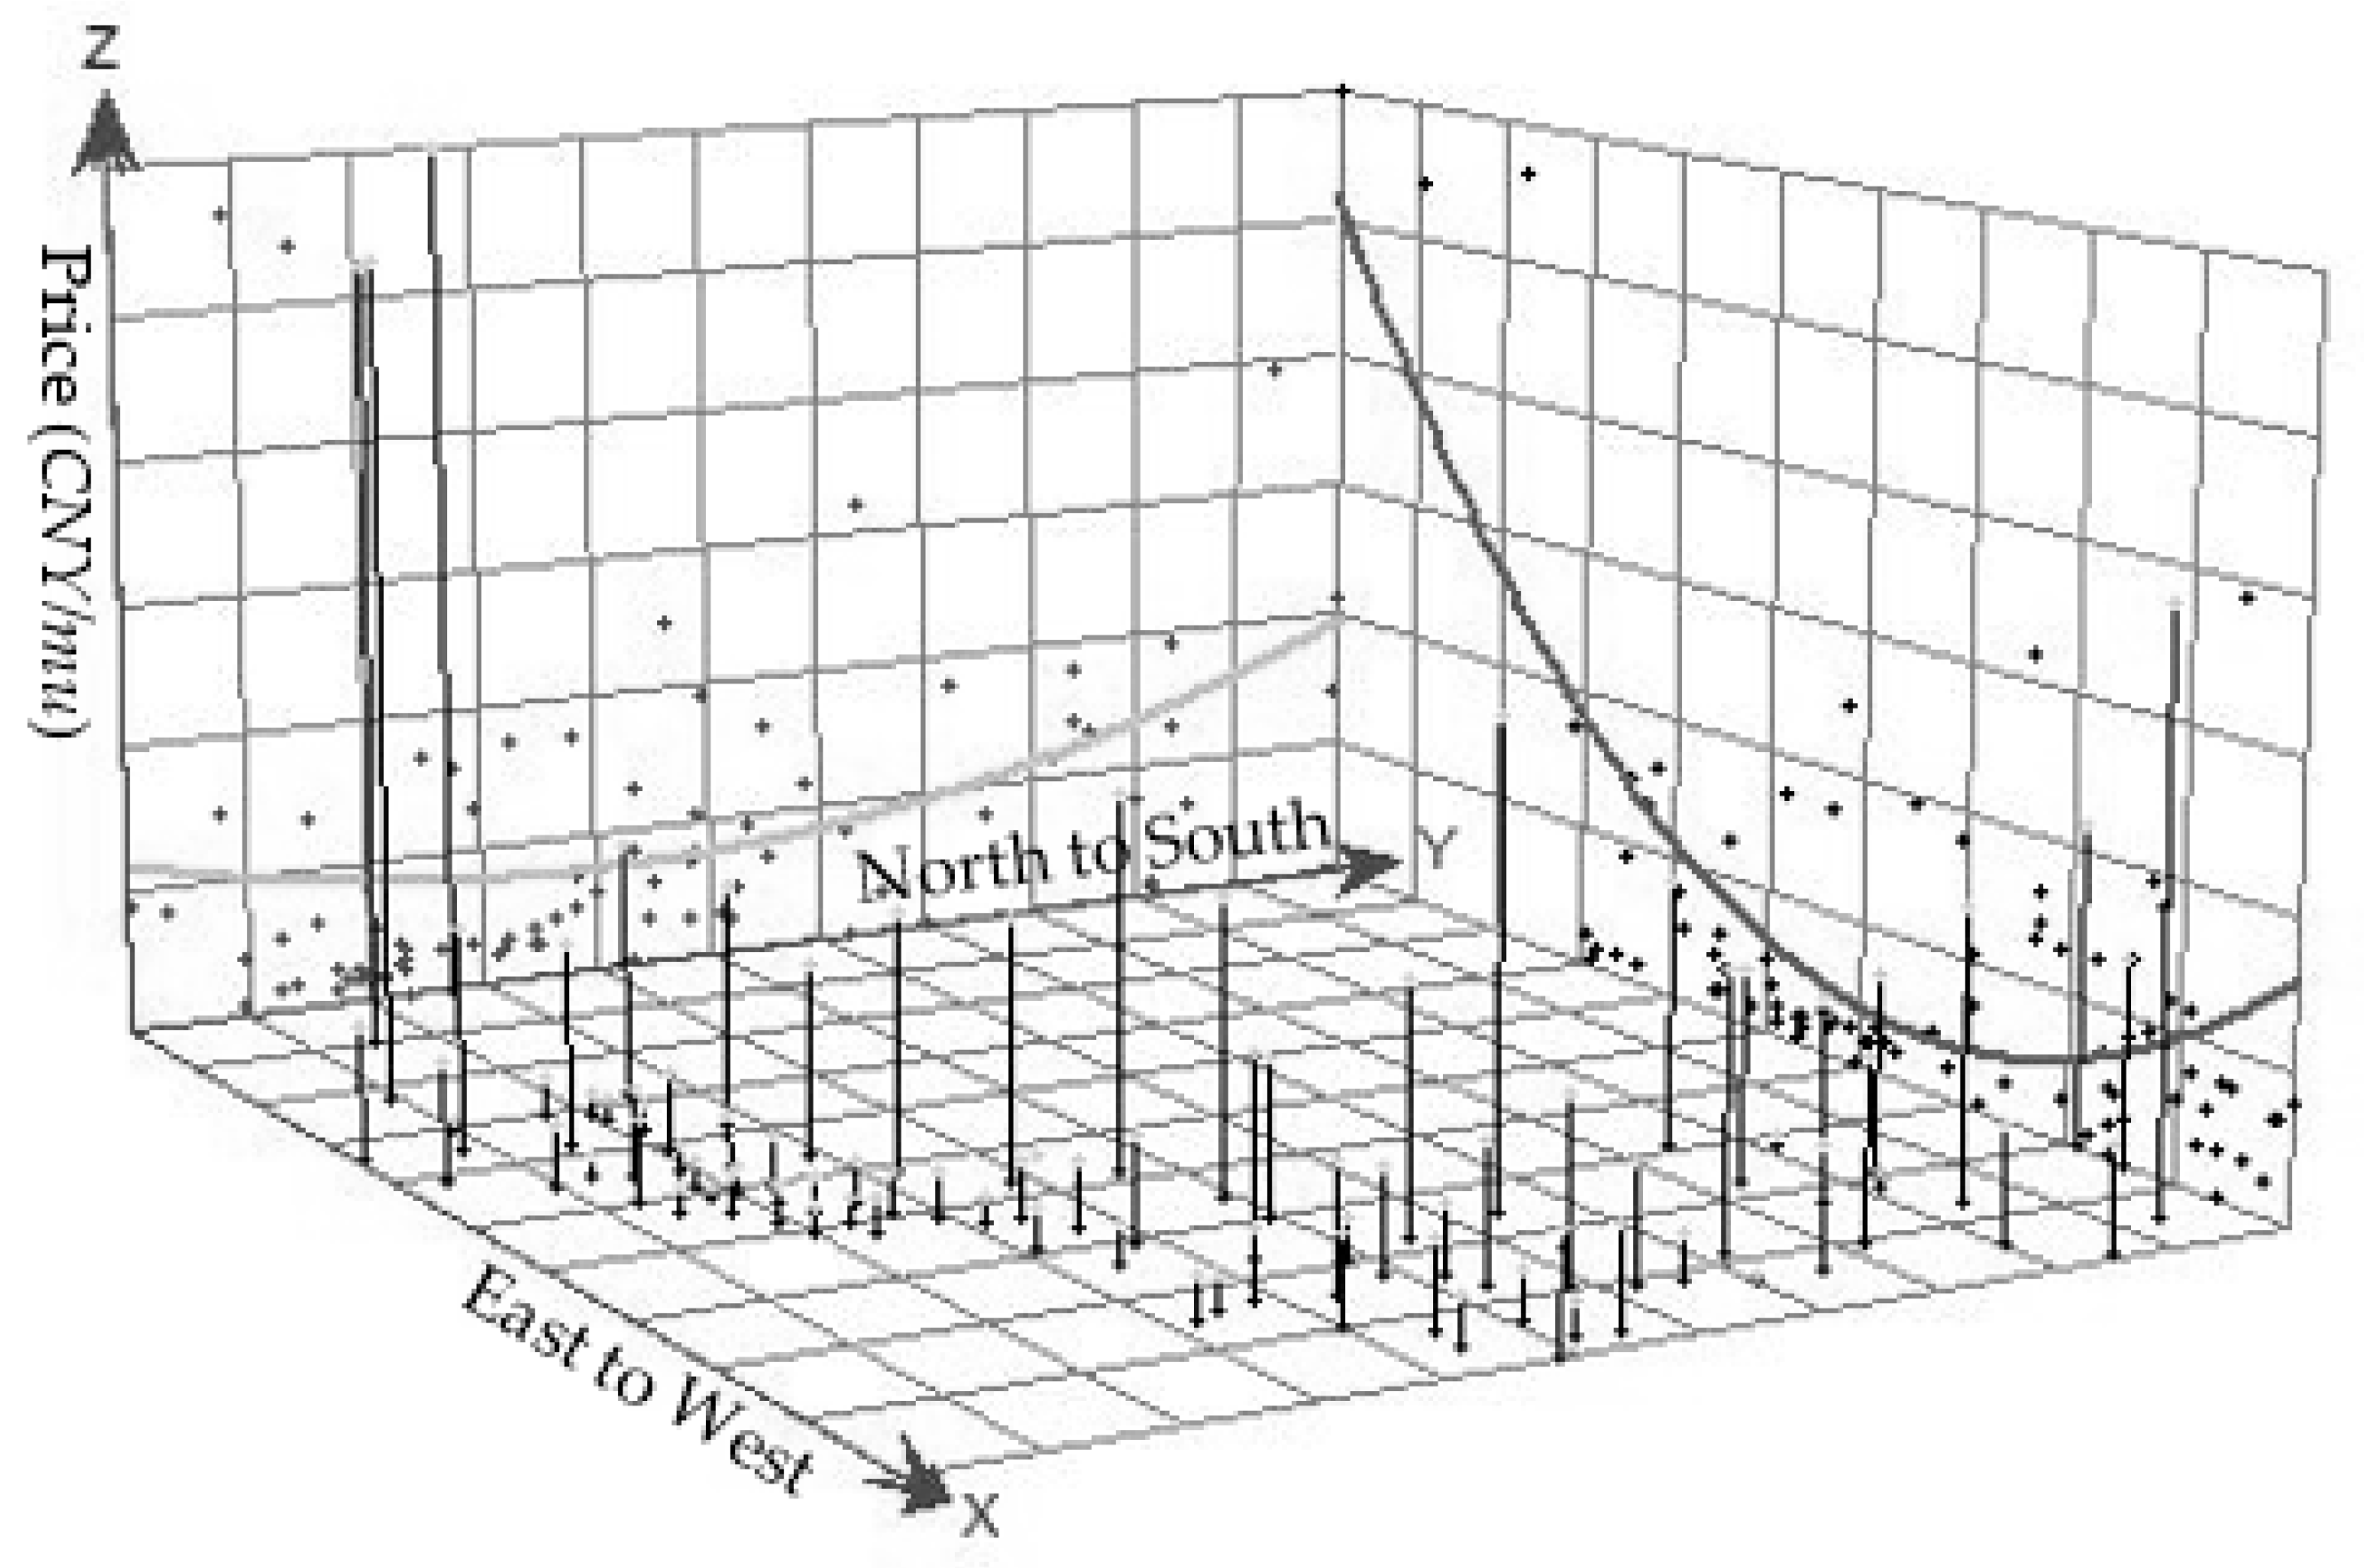
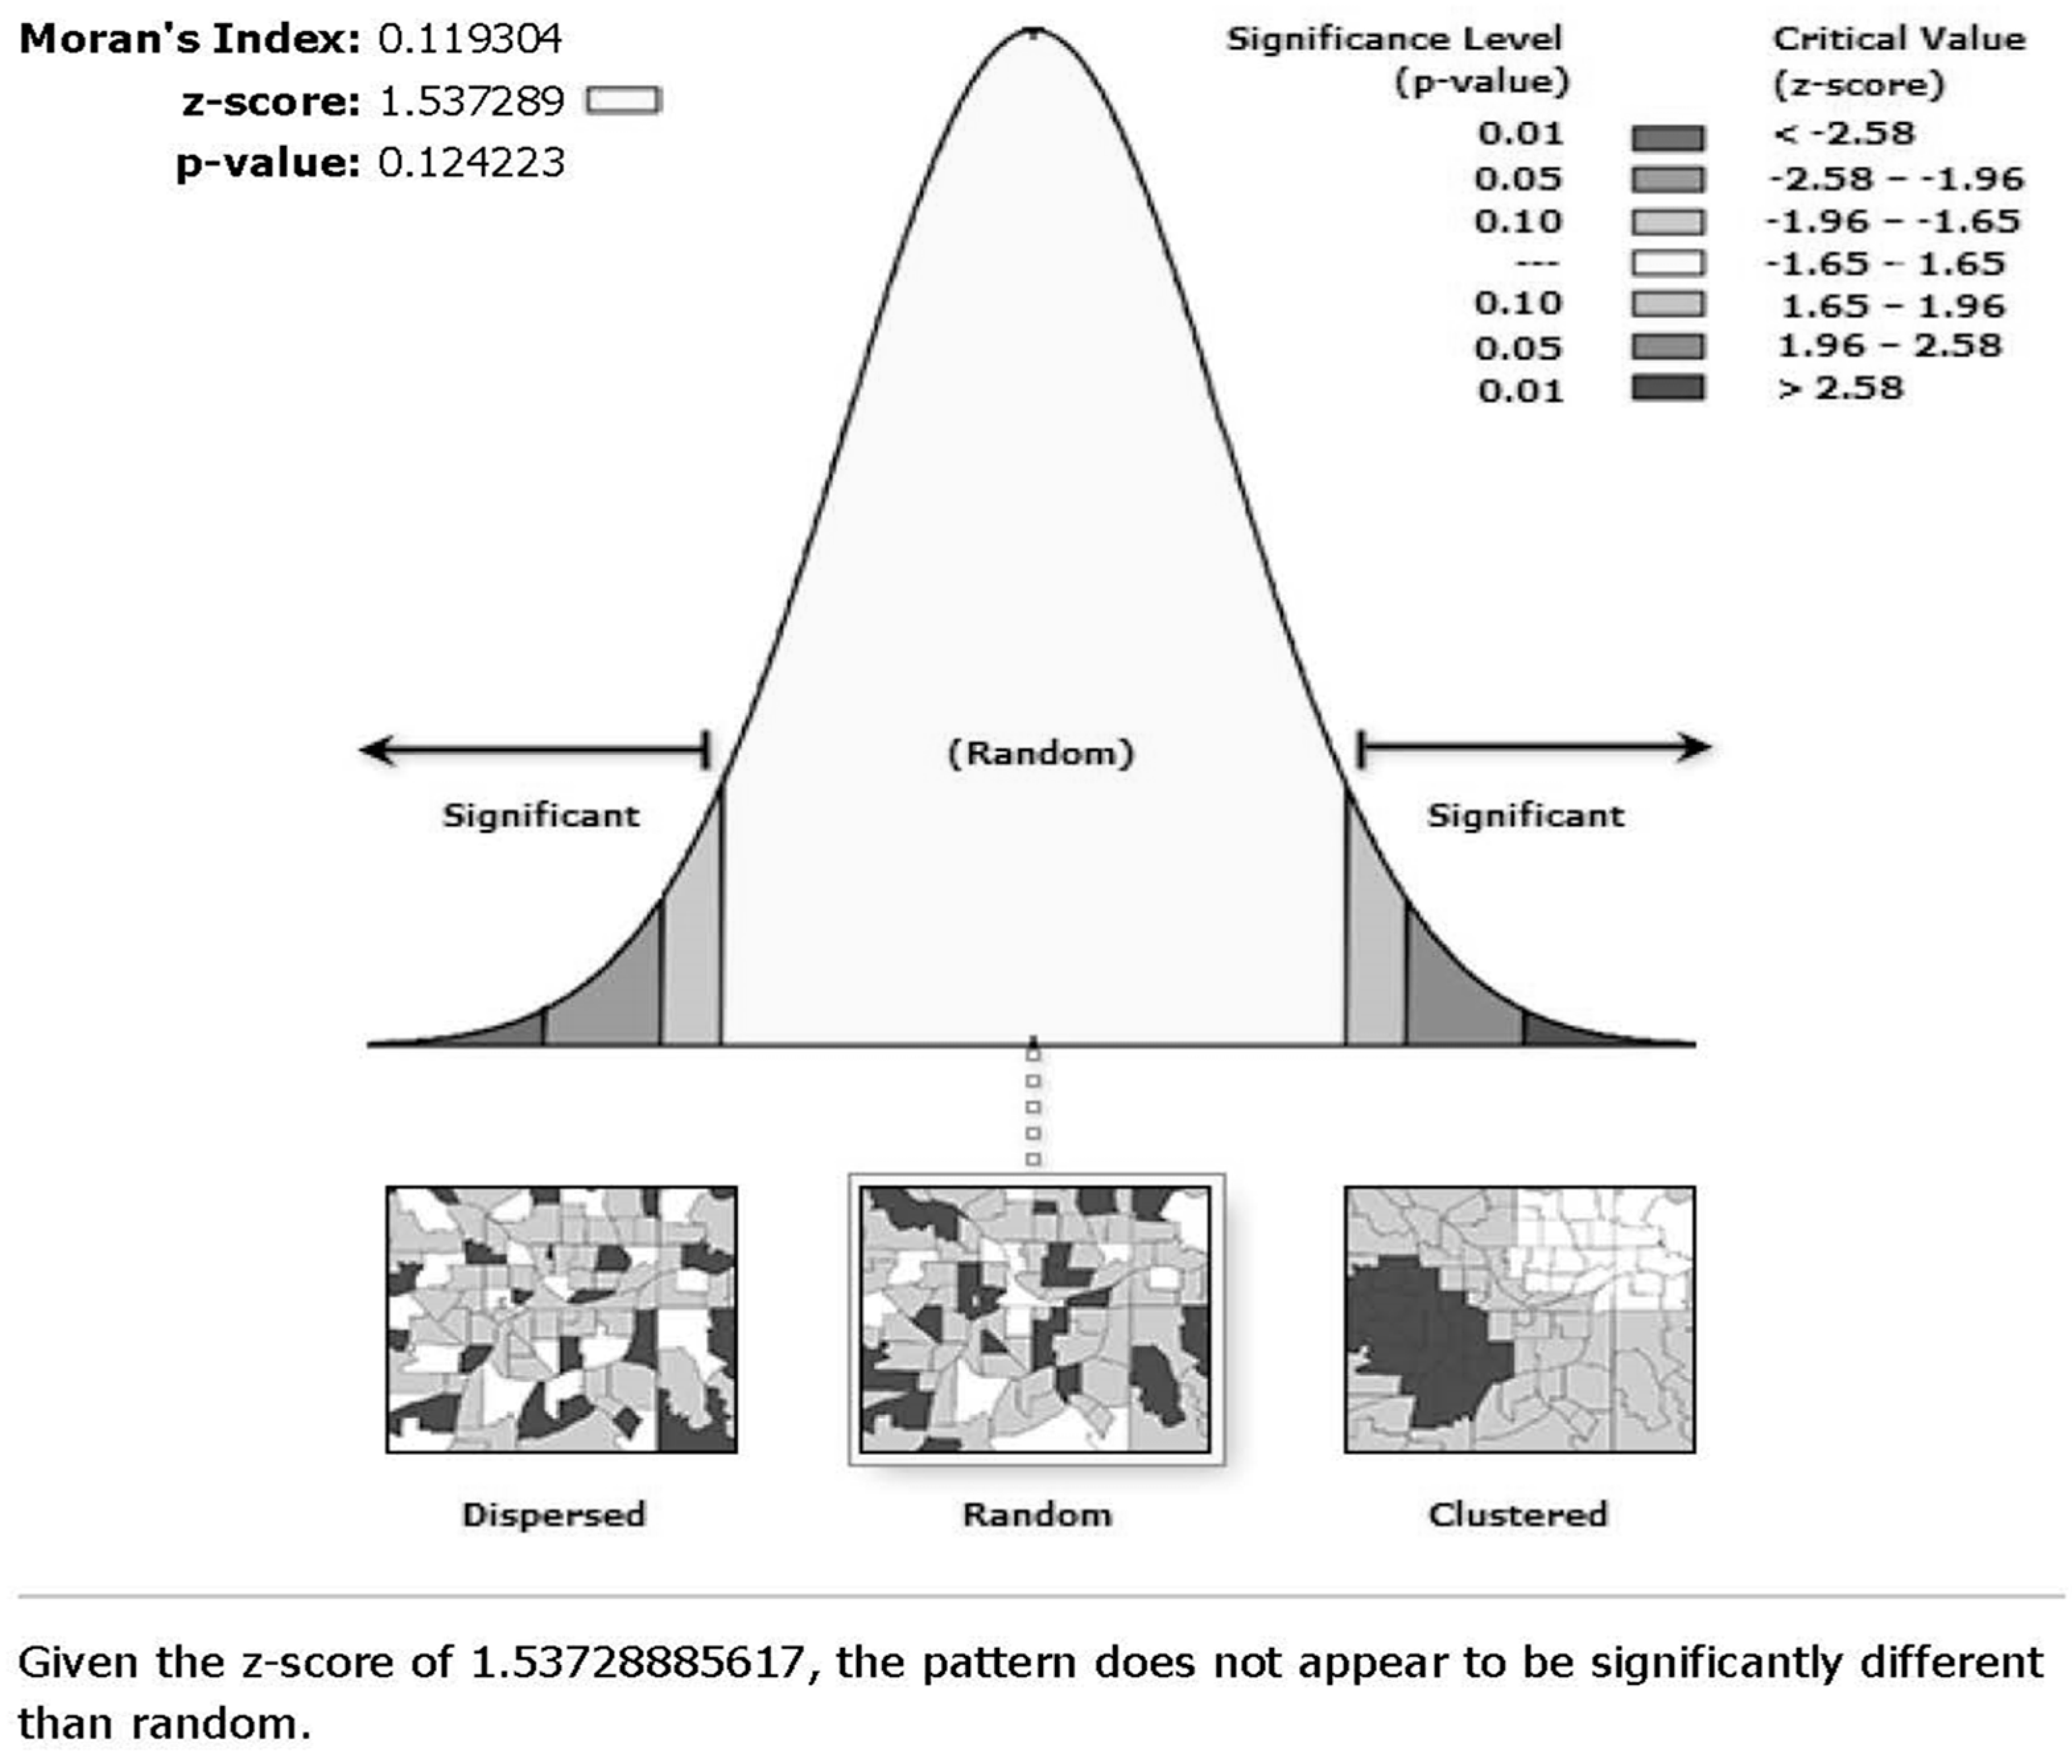
4.1. Spatial Variation and Spatial Autocorrelation

The spatial variation analysis in the Geostatistical Analyst tool provides a three-dimensional perspective of the data in which the locations of sample points are plotted on the x (East-West) and y (North-South) planes. The price values given by the height of a line in the z-dimension above each sample point projected onto the x,z plane and the y,z plane as scatterplots and then fitted by polynomials. Figure 2 reveals the price trend over the space as a slight U shape in the south–north direction, but also an apparent U shape in the west–east direction, with a fast descending trend from west to the middle but a gradual ascending trend from the middle to the east. Inner Mongolia Autonomous Region is located in the norther border of China presenting an elongated shape extending from northeast to southwest as shown in Figure 1. Regional differences from west to east exist in urbanization, rainfall gradient, and grassland resource [42]. The eastern region of IMAR represented by Hulunbuir, Hinggan, Tongliao, and Chifeng has meadow and typical grassland with fertile soil, abundant participation, and a wide range of forage grass, while the groundwater recharge of the east is greater than that in the middle and west. Thus, there is a better natural foundation for the east region’s agricultural and animal husbandry development. However, some of the western areas of IMAR, represented by Hohhot, Baotou, Wuhai, and Ordos, are rich in resources of rare earths, coal, and mineral that also have a leading role in social, economic, cultural, and transportation, and have high urbanization development due to the rapid economic growth and industrial expansion. Conversely, the middle region of IMAR, represented by Xilingol and Ulanqab, has a less developed local economy with a high share of rural population and with relatively poor natural conditions and weak economic development. Thus, in general, the prices of grassland circulation gradually decrease from the southwest and northeast to the center.
As shown in Figure 3, Moran’s Index value of grassland circulation asking prices in IMAR is 0.12 (p > 0.05) indicating a positive spatial autocorrelation is not significant at a 95% confidence interval. Under the null hypothesis of random spatial distribution, the test result means the circulation prices of grasslands from the observations are randomly distributed rather than clustered across the study area. It may be that the observations collected are too scattered across the province or that it is difficult for individual households to exchange price information given the vast distance. Conversely, it may be that the observations are priced arbitrarily without professional guide due to market imperfections. Without a trusted guide to inform grassland contract owners and potential tenants, the cost of information search increases for both sides and adds difficulty to the price negotiations and extra risk of disputes during the grassland circulation transaction. Moreover, the imperfect market information may lead to problems of adverse selection whereby the incompleteness of land information available to potential tenants means they will only be willing to pay a circulation price based on average or below average quality of the grassland. This means, in turn, that they will underestimate the price of premium grassland and force this type of grassland to be withdrawn from the circulation market and so reduce the amount of grassland being circulation.

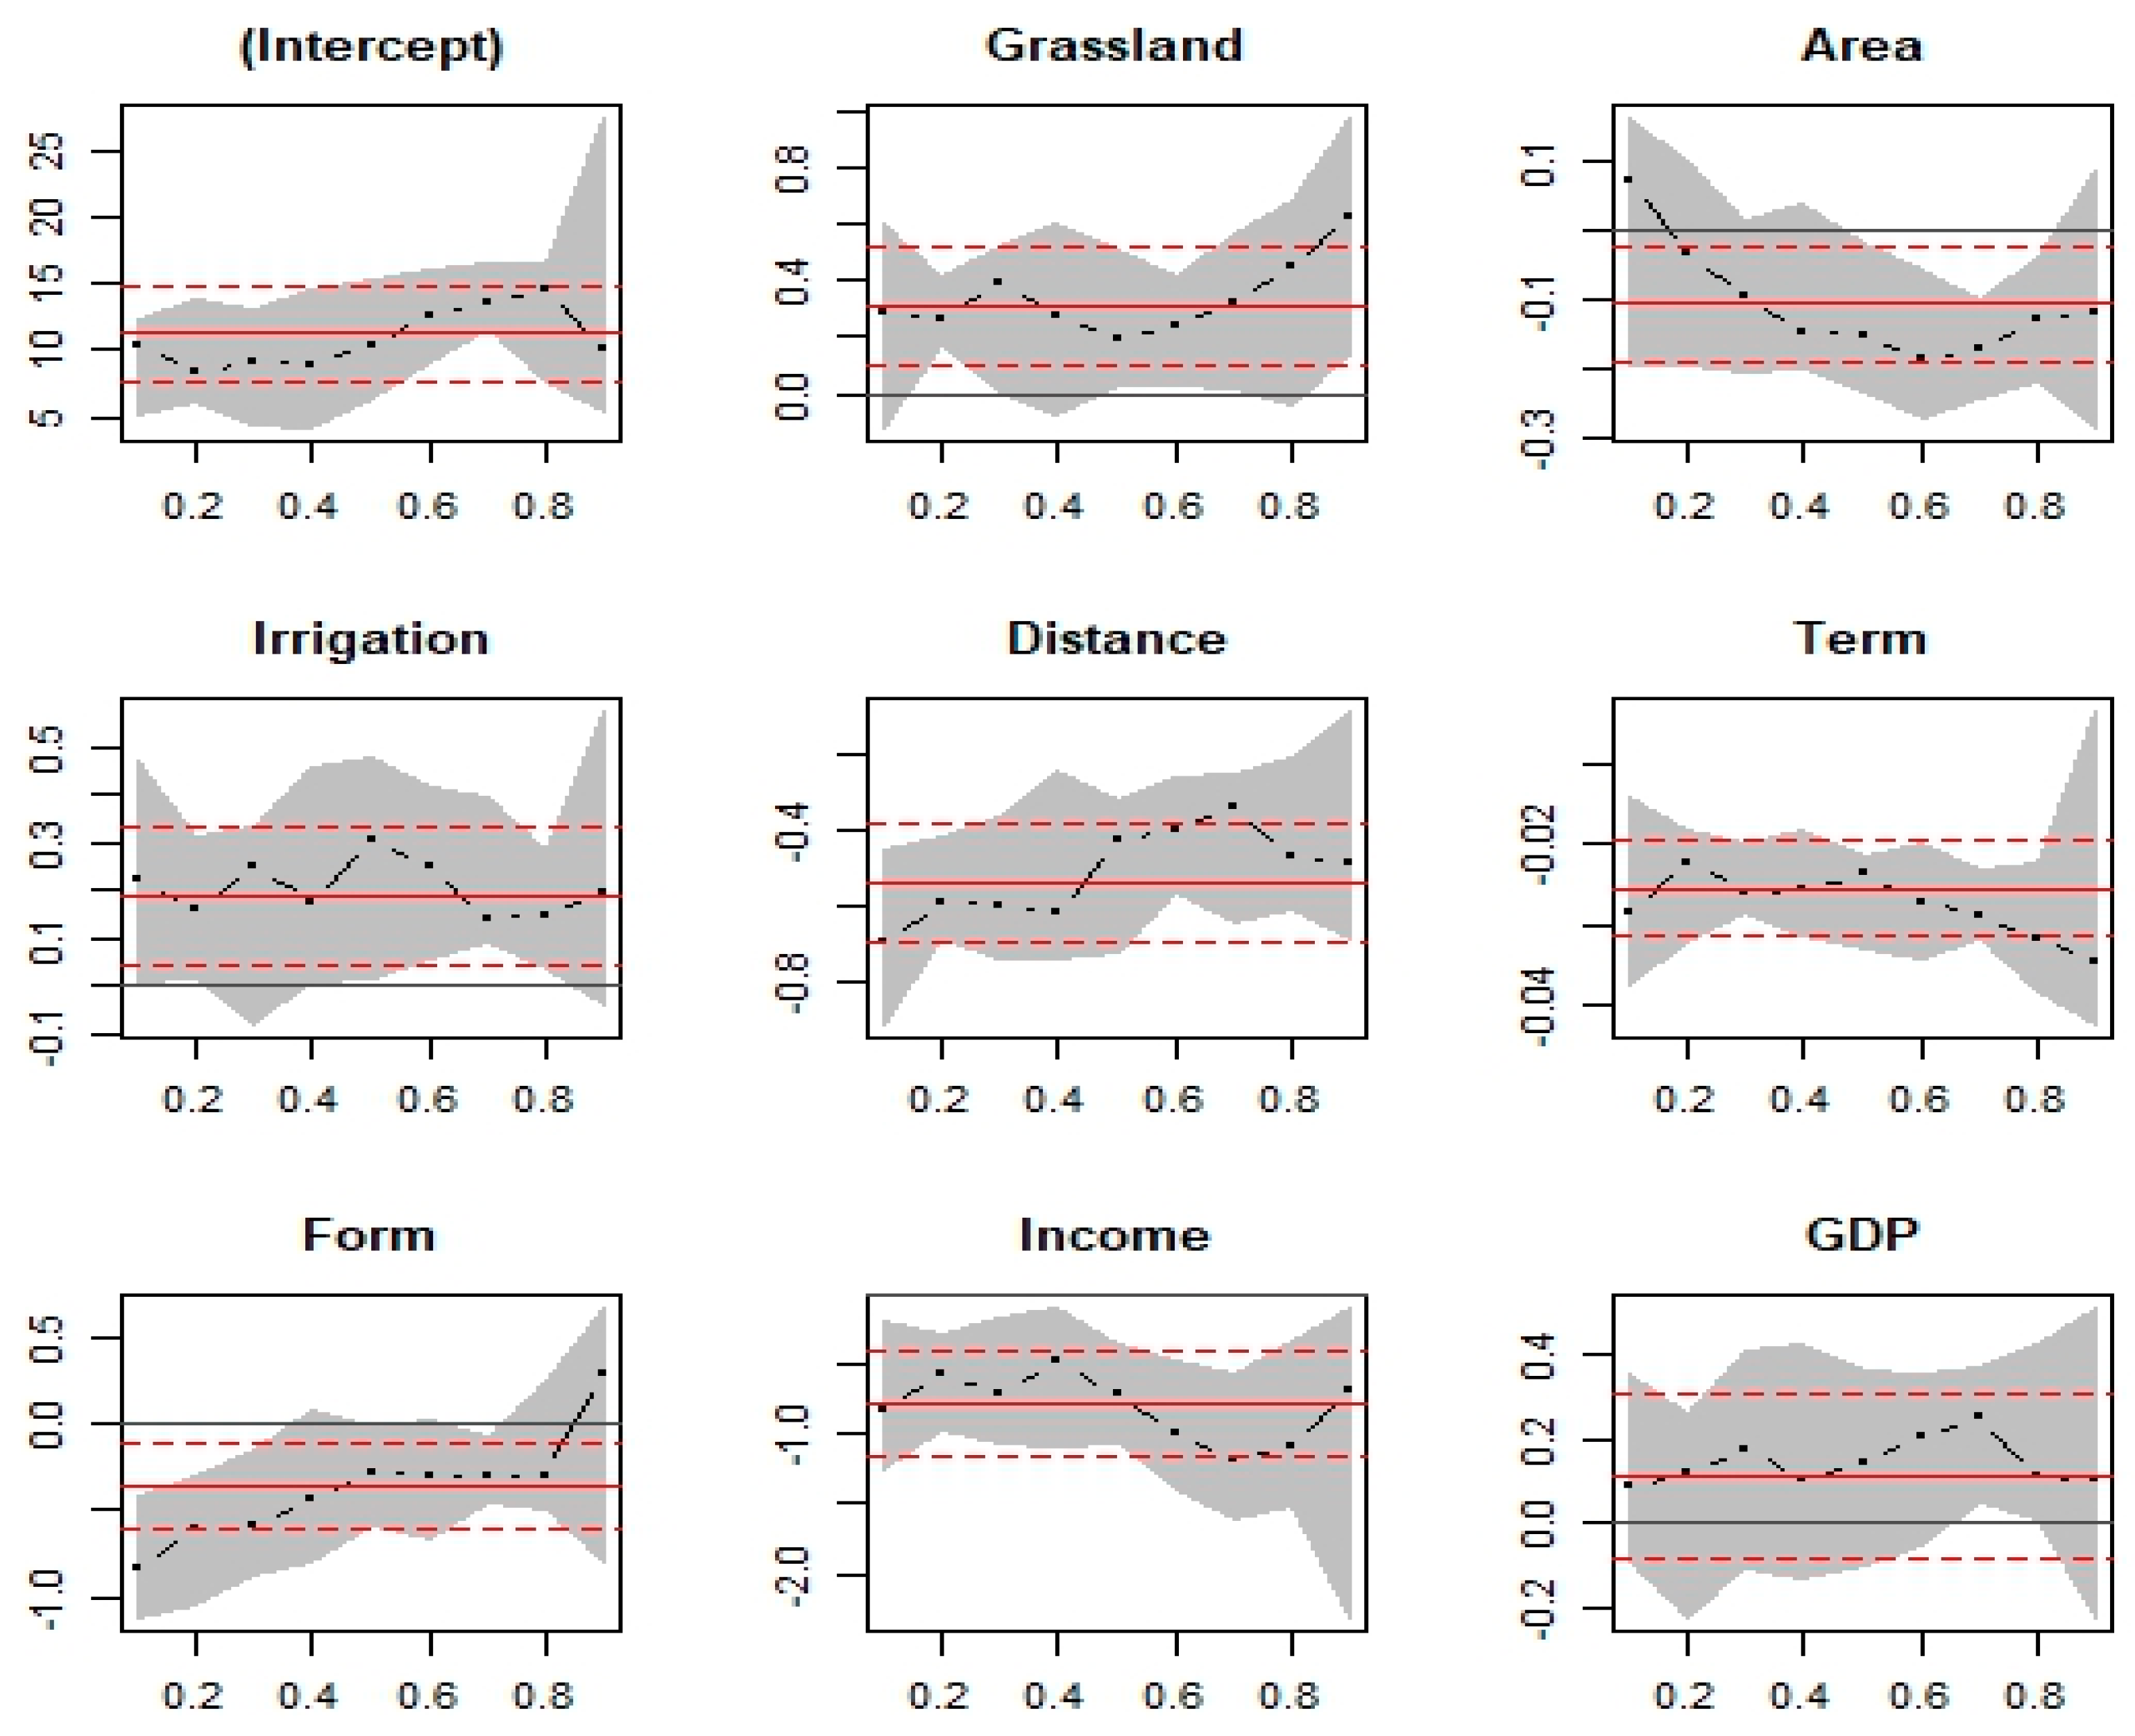
4.2. Price Dominant Analysis

Price dominant analysis was conducted using the OLS and quantile regression models in the Stata 14 software with the results reported in Table 2. The OLS estimation appears in column 2 and indicates that all independent variables except GDP are significant in impacting the asking price of grassland circulation. However, the significance of the factors varies across the different quantiles as demonstrated by three quantile regressions of 0.25, 0.5, and 0.75 in columns 3 to 5 of Table 2. That is, sorting the grassland circulation price from the smallest to largest, the values at the three cut points are 12, 30, and 80, respectively. Thus, the price range for the lower quantile regression refers to the group below CNY 12/mu/year, the price range for the median quantile regression refers to the group equal to and below CNY 30/mu/year, while the price range for the upper quantile regression refers to the group over CNY 80/mu/year. Distance, contract term and per capita income are significant in all three quantiles, whereas irrigation is only significant in the median regression (τ = 0.5) rather than the two tails. Furthermore, grassland type and transaction form are only significant in the lower quantile regression (τ = 0.25) while grassland area is insignificant in the lower quantile regression (significant at τ = 0.5 and τ = 0.75). Local GDP, which is not significant in the OLS regression, is significant in higher quantiles (more expensive land).
Figure 4 is a graphical representation to show how the impact power varies between nine separate quantiles (τ = c (0.1, 0.9)). The curves of these variables in Figure 4 reveal a downward (negative) trend in the variables of land area, distance to national road, contract term, transaction form, and local per capita income. Conversely, the coefficient curves for grassland type, irrigation variable, and local GDP reveal a positive (upward) trend. This is consistent with the sign on the coefficients in Table 2 and is also consistent with a priori expectations that large area, long contract term and rental rather than transfer brings down the per unit circulation price, while good irrigation condition, good social environment, close proximity to the main road, and transfer rather than rent pushes up the per unit circulation price.
The significant influence of distance to main road, use term, and incomes emerge clearly and consistently in the results. Increases in herders’ disposable income, distance to nearest national road, and circulation term are all associated with leftward shifts in the distribution of circulation price. However, the more expensive grassland parcels are less sensitive to the distance, while more sensitive to the variable of per capita income of rural and pastoral areas. In particular, location of grassland plots that conveniently access national roads to urban centres command higher land values in terms of market access and the ability to supply premium fresh produce (mainly meat and dairy) markets. More favourable access to amenities or non-farm income-generating opportunities are also of interest to potential buyers. On segmented markets, as shown in Figure 4, the coefficient curve of the distance variable highlights that when distance upgrades one level, such as from 0–10 km to 10–50 km, the natural log of circulation price decreases by 56% in the lower quantile, 43% in the median quantile, and 34% in the higher quantile. That is, more expensive grassland parcels are less sensitive to distance to national road, but road construction does raise the value of nearby grassland. Second, long term circulation offers stability and sustainability for farm production which is favoured by big herders or investors who outlay substantial up-front investments in specialized equipment. The coefficient curve in Table 2 shows that the circulation price decreases by 2.4% in the lower quantile but by 2.9% in the higher quantile with the value increasing year-by-year. That is, the negative impact of contract term is more pronounced in the higher quantile where the curve slopes down since τ = 0.6. Nevertheless, this pattern may present a disincentive to land suppliers to circulate out grassland through short term contract. Third, per capita income has a consistently negative relation with grassland prices in low-median-high quantiles, but the impact power varies across the quantiles. For instance, circulation price decreases 7.6% in lower quantile regression but 11.6% in higher quantile regression if the per capita income increases 10%. It may be that areas with higher per capita income have a lower share of agricultural income in their total income while the opportunity cost of staying in livestock production is high and so this is why they ask for a lower circulation price. Therefore, more expensive grassland parcels are more sensitive to per capita incomes of rural and pastoral areas.
Thus, distinctions do arise in the price dominant factors between the upper quantile and lower quantile segments of the grassland circulation market. First, in drought-prone areas like the mid- and west-IMAR, grassland may need to be irrigated where possible to reduce the water limitation of plant growth [43]. However, the effect of full irrigation associated with 30% higher circulation price was only found in the median regression rather than the two tails. This does not necessarily mean that irrigation condition will not play a role in the high-end and low-end markets. Instead, it may be that irrigation condition is generally similar at the two tails, where more expensive grassland parcels all have better irrigation, and cheaper grassland parcels all have relatively poor irrigation. Second, land transfer dominates the median and upper quantile market while rent is more often used for low-priced land. Most vendors (59%) choose to transfer their land rather than rent out and the price for giving up the land contract right and associated grassland subsidies should be more expensive than renting the land contract. However, a high-priced transfer may be risky in the long term due to sovereign risk and market uncertainty where rental options enable shorter term, more flexible options where the tenants pay more attention to immediate benefits rather than the condition of the grasslands. Thus, rented grassland may occur more for lower quality grassland to avoid any adverse tenant behaviour on good condition or higher productivity grassland. Finally, the negative significance of grassland area to the higher and median price quantile is consistent with expectations that grassland values are commonly found to increase as parcel sizes decrease, a phenomenon referred to as the “small parcel size premium” [44,45]. This finding may indicate a high demand for small plots among poor farmers with limited capital and borrowing constraints. However, the same relationship seems to disappear in low quantile regression, namely that larger parcels in low-end market may not necessarily be cheaper on a per unit basis due to economies of scale in agricultural production.
While the results are generally consistent with the findings of previous research, one exception is that grassland type categorized as “desert” was associated with 32% higher price than “typical” and “meadow” grassland, although this is only significant in the lower quantile regression. The grassland circulation market is far from uniform throughout the province, and so a possible reason is the high demand among poor farmers for grazing land in desert steppe, given the land use competition driven by the rapid development of the mining industry in the western region. Conversely, the insignificant effect of desert steppe grassland on circulation price for expensive grassland indicates that meadow and typical steppe, as indicators of better grassland productivity and potential, are still positive determinants of grassland value in mid- and high-priced market. Furthermore, the indicator of local economy (GDP) was positively correlated with circulation price in the high-priced market. Specifically every 10% increase in local GDP increased the circulation price by 2.3%. However, GDP was not be correlated with circulation price in low quantile and mid-quantile regression, as well as in the OLS regression.

5. Implication and Conclusions

This paper contributes to the existing literature by quantitatively assessing the spatial autocorrelation and impact of different attributes on the grassland circulation price across different quantiles of the asking price distributions. The analysis of circulation prices reveals that there is a large variation in prices across IMAR. However, no significant spatial autocorrelation was identified highlighting that the spatially correlated factors were not as important as other factors in influencing the circulation prices. Thus, while broad spatial patterns in prices arise, the analysis highlights that generalizations on prices based on location may not reveal very much and that a full understanding of the underlying and local factors influencing prices is also needed to better understand the grassland circulation market.
The paper also highlights that generalizations based on the median of the grassland price distribution is also limited in what it can reveal. The relationship between the underlying factors and the grassland circulation price varies according to what part of the price distribution is being referred to. The significant quantile effects across the price distribution suggest that local market structures, strong demand for grazing land in desert steppe, high demand of poor herders for smaller plots, and high demand of richer herders for larger plots all play an important role in determining circulation prices.
This study also confirms insights from previous studies such as Qiao et al. [26] and Palmquist [46] that grassland circulation price is dependent on attributes beyond mere grazing productivity. Non-grassland attributes such as contract term and circulation form also impact land value. Thus, a well-designed platform for grassland circulation is necessary to provide services such as contract signing, registration, dispute mediation for parties involved in the circulation, and improved information and reference prices.
Future areas of worthwhile research to improve the performance of the grassland circulation market include investigation of information and price guides, oversight of the circulation market, grassland amenity, and its value reflection in the circulation market. Other factors that could be explored include the characteristics and responses of individual households, precipitation information, and the behavior of local governments who regulate the grassland circulation market. For instance, some banners require households to prioritize transactions with local herders or villagers in the same village. Thus, the background of households and the most likely transaction partner may affect herders’ estimates of their land values. Future analysis might also explore the relationship between asking and final prices. As the grassland circulation becomes more prevalent in IMAR, a larger and more rigorous dataset of final negotiated prices may shed light on why some categories of farmers systematically under- or over-estimate the value of their grassland.

Author Contributions

Conceptualization, J.Z. and C.B.; formal analysis, J.Z.; writing—original draft preparation, J.Z.; writing—review and editing, C.B.; funding acquisition, C.B.

Funding

This research was funded by an Australian Centre for International Agricultural Research Project (ACIAR), grant number ADP/2012/107, on “Strengthening incentives for improved grassland management in China and Mongolia”.

Conflicts of Interest

The authors declare no conflict of interest.

References

  1. EBCAHVY (Editorial Board of China Animal Husbandry Yearbook). China Animal Husbandry Yearbook; China Agriculture Press: Beijing, China, 2016. [Google Scholar]
  2. Law of the People’s Republic of China on Land Contract in Rural Areas. Available online: http://www.npc.gov.cn/englishnpc/Law/2007-12/06/content_1382125.htm (accessed on 22 September 2018).
  3. Tan, S.; Liu, B.; Zhang, Q.; Zhu, Y.; Yang, J.; Fang, X. Understanding grassland rental markets and their determinants in Eastern Inner Mongolia, PR China. Land Use Policy 2017, 67, 733–741. [Google Scholar] [CrossRef]
  4. Zhang, M.; Zhang, L.; Zhang, Y.; Xu, Y.; Chen, J. Pastureland transfer as a livelihood adaptation strategy for herdsmen: A case study of Xilingol, Inner Mongolia. Rangel. J. 2017, 39, 179–187. [Google Scholar] [CrossRef]
  5. Deininger, K.; Jin, S. The potential of land rental markets in the process of economic development: Evidence from China. J. Dev. Econ. 2005, 78, 241–270. [Google Scholar] [CrossRef]
  6. Liu, S.; Wang, R.; Shi, G. Historical Transformation of China’s Agriculture: Productivity Changes and Other Key Features. China World Econ. 2018, 26, 42–65. [Google Scholar] [CrossRef]
  7. Ding, G.; Li, X. Defining the circulation of the right to land contractual management. J. Zhejiang Univ. Hum. Soc. Sci. 2008, 38, 5–13. [Google Scholar]
  8. Wang, Y.; Guo, X. Analysis on price of rural land transfer on contractual management right in China. Agric. Econ. Manag. 2012, 3, 19–22. [Google Scholar]
  9. Liu, Y.; Fang, F.; Li, Y. Key issues of land use in China and implications for policy making. Land Use Policy 2014, 40, 6–12. [Google Scholar] [CrossRef]
  10. Gao, Y.; Tang, H.; Zhang, X.; Li, J. Study on transferring price of contractual right of farmland based on property rights value: A case study in Guangzhou. J. Huazhong Agric. Univ. Soc. Sci. Ed. 2012, 2, 58–63. [Google Scholar]
  11. Mu, S.; Zhang, Y.; Wang, K.; Dhruba Bijaya, G.C. Agricultural land contract and management rights: Transferring price and countermeasures in typical agricultural areas of China. J. Resour. Ecol. 2012, 3, 262–268. [Google Scholar] [CrossRef]
  12. Cao, G.; Feng, C.; Tao, R. Local “land finance” in China’s urban expansion: Challenges and solutions. China World Econ. 2008, 16, 19–30. [Google Scholar] [CrossRef]
  13. Chen, R.; Ye, C.; Cai, Y.; Xing, X.; Chen, Q. The impact of rural out-migration on land use transition in China: Past, present and trend. Land Use Policy 2014, 40, 101–110. [Google Scholar] [CrossRef]
  14. Du, T.; Zhu, D.; Zhang, L.; Zhao, Y. Spatial distribution and formation mechanism of cultivated land transfer price in Henan Province. Trans. Chin. Soc. Agric. Eng. 2016, 32, 250–258. [Google Scholar]
  15. Lin, T.; Song, G.; Qiao, Y. Influence factors on price of farmland transfer organized by farmers in main grain-producing region of northeast China. Trans. Chin. Soc. Agric. Eng. 2017, 33, 260–266. [Google Scholar] [CrossRef]
  16. MOA (Ministry of Agriculture). The Opinions of the General Office of the Central Committee of the Communist Party of China and the General Office of the State Council on Guiding the Orderly Circulation of Rural Land Management Rights for the Development of Agricultural Operations at an Appropriate Scale (No. 61 [2014]). Available online: http://jiuban.moa.gov.cn/zwllm/tzgg/tz/201606/t20160628_5189308.htm (accessed on 22 September 2018).
  17. NMG (Nanjing Municipal Government). The Opinions of Nanjing Municipal Government on Guiding the Orderly Circulation of Rural Land Contractual Management Rights. Available online: http://www.nanjing.gov.cn/xxgk/szf/201304/t20130415_1183530.html (accessed on 22 September 2018).
  18. Jiangsu Provincial Committee Rural Work Leading Group Office. Rural Contracted Land Management Rights Circulation Price Index in Jiangsu Province. Available online: http://www.jsnc.gov.cn/jyfx/jyfx/2018/03/30085436813.html (accessed on 22 September 2018).
  19. Gao, F.; Zhao, H.; Peng, R. Existing Problems and Improvement Measures in the Circulation of Land Contractual Management Right in Rural and Pastoral Areas. Inn. Mong. Financ. Res. 2013, 5, 45–46. [Google Scholar]
  20. Chen, L. Investigation and Research on the Disputes over Management Rights of Pasture Land in Pastoral Areas. Available online: http://zxbqfy.chinacourt.org/article/detail/2015/02/id/1556374.shtml (accessed on 22 September 2018).
  21. Shen, Y.; Zhu, S.; Deng, Y.; Teng, L.; Zheng, R. An analysis of factors of the price of farmland use rights’ circulation: The experience from farms and regional level. China Rural Surv. 2012, 3, 2–25. [Google Scholar]
  22. Wu, Z.; Kong, X.; Zheng, L. On factors influencing farmland transfer rent and the role of land share cooperatives: A study based on the survey of 413 households in Anhui and Zhejiang. J. Jiangxi Agric. Univ. Soc. Sci. Ed. 2011, 10, 1–6. [Google Scholar]
  23. Tian, X.; Chen, L. How to determine the land rent: A sociological study of formation mechanism of land circulation price. China Rural Surv. 2013, 6, 2–12. [Google Scholar]
  24. Li, L.; Zhang, Y.; Du, R. Analysis on Grassland Circulation Price and its Influencing Factors in Xianghuang Banner, Inner Mongolia. Agric. Technol. 2016, 36, 167–169. [Google Scholar] [CrossRef]
  25. Sa, R.; Zhang, Y. The Investigation and Study on Grassland Circulation Price at Dongwuzhumuqin Region in Xilinguole League. China Land Sci. 2015, 29, 89–94. [Google Scholar] [CrossRef]
  26. Qiao, G.; Zhang, B.; Zhang, J.; Brown, C. Land rental, prices and the management of China’s grasslands: The case of Inner Mongolia Autonomous Region. Rangel. J. 2018, 40, 231–240. [Google Scholar] [CrossRef]
  27. Chin, T.L.; Chau, K.W. A Critical Review of Literature on the Hedonic Price Model. Int. J. Hous. Sci. Appl. 2003, 27, 145–165. [Google Scholar]
  28. Malpezzi, S. Hedonic Pricing Models: A Selective and Applied Review; O’Sullivan, T., Gibb, K., Eds.; Housing Economics and Public Policy, Blackwell Science Ltd.: Oxford, UK, 2003. [Google Scholar] [CrossRef]
  29. Waltert, F.; Schläpfer, F. Landscape amenities and local development: A review of migration, regional economic and hedonic pricing studies. Ecol. Econ. 2010, 70, 141–152. [Google Scholar] [CrossRef] [Green Version]
  30. Koenker, R.; Bassett, G., Jr. Regression quantiles. Econ. J. Econ. Soc. 1978, 46, 33–50. [Google Scholar] [CrossRef]
  31. Koenker, R.; Hallock, K.F. Quantile regression. J. Econ. Perspect. 2001, 15, 143–156. [Google Scholar] [CrossRef]
  32. Koenker, R. Quantile Regression (Econometric Society Monographs Volume 38); Cambridge University Press: Cambridge, UK, 2005. [Google Scholar] [CrossRef]
  33. Zietz, J.; Zietz, E.N.; Sirmans, G.S. Determinants of house prices: A quantile regression approach. J. Real Estate Financ. Econ. 2008, 37, 317–333. [Google Scholar] [CrossRef]
  34. Machado, J.A.; Mata, J. Counterfactual decomposition of changes in wage distributions using quantile regression. J. Appl. Econ. 2005, 20, 445–465. [Google Scholar] [CrossRef] [Green Version]
  35. Farias, A.J.; Hansen, R.N.; Zeliadt, S.B.; Ornelas, I.J.; Li, C.I.; Thompson, B. Factors associated with adherence to adjuvant endocrine therapy among privately insured and newly diagnosed breast cancer patients: A quantile regression analysis. J. Manag. Care Spéc. Pharm. 2016, 22, 969–978. [Google Scholar] [CrossRef] [PubMed]
  36. Haurin, D.R. The duration of marketing time of residential housing. Real Estate Econ. 1988, 16, 396–410. [Google Scholar] [CrossRef]
  37. Hu, Z.; Kong, D.; Wei, J. Grassland Eco-compensation: Equivalent Relationship between Livestock Reduction and Compensation. J. Nat. Resour. 2015, 30, 1846–1859. [Google Scholar]
  38. Sodsuchin. Background analysis on the regional differences of stock farming: A case study in pasture region of Xilingol league. Mong. Stud. 2011, 31, 54–59. [Google Scholar]
  39. Kang, L.; Han, X.; Zhang, Z.; Sun, O. Grassland ecosystems in China: Review of current knowledge and research advancement. Philos. Trans. R. Soc. Lond. B Boil. Sci. 2007, 362, 997–1008. [Google Scholar] [CrossRef] [PubMed]
  40. AAHDIMAR (Agriculture and Animal Husbandry Department of Inner Mongolia Autonomous Region). Implementation Plan of Grassland Ecological Protection Subsidies Reward Mechanism in Inner Mongolia Autonomous Region. Available online: http://zfs.mep.gov.cn/hjjj/gjfbdjjzc/stbczc1/201412/t20141224_293427.htm (accessed on 26 July 2018).
  41. IMARBS (Inner Mongolia Autonomous Region Bureau of Statistics). Inner Mongolia Statistical Yearbook; China Statistics Press: Beijing, China, 2016. [Google Scholar]
  42. Li, A.; Wu, J.; Zhang, X.; Xue, J.; Liu, Z.; Han, X.; Huang, J. China’s new rural “separating three property rights” land reform results in grassland degradation: Evidence from Inner Mongolia. Land Use Policy 2018, 71, 170–182. [Google Scholar] [CrossRef]
  43. Liu, X.; Wang, Y.; Peng, J.; Braimoh, A.K.; Yin, H. Assessing vulnerability to drought based on exposure, sensitivity and adaptive capacity: A case study in middle Inner Mongolia of China. Chin. Geogr. Sci. 2013, 23, 13–25. [Google Scholar] [CrossRef]
  44. Maddison, D. A Hedonic Analysis of Agricultural Land Prices in England and Wales. Eur. Rev. Agric. Econ. 2000, 27, 519–532. [Google Scholar] [CrossRef]
  45. Brorsen, B.W.; Doye, D.; Neal, K.B. Agricultural Land and the Small Parcel Size Premium Puzzle. Land Econ. 2015, 91, 572–585. [Google Scholar] [CrossRef]
  46. Palmquist, R.B. Land as a differentiated factor of production: A hedonic model and its implications for welfare measurement. Land Econ. 1989, 65, 23–28. [Google Scholar] [CrossRef]
Figure 1. Map of study site and sample distribution at county level.
Sustainability 10 04381 g001
Figure 2. Trend analysis of grassland circulation price in Inner Mongolia Autonomous Region (IMAR).
Sustainability 10 04381 g002
Figure 3. Spatial autocorrelation (Moran’s Index).
Sustainability 10 04381 g003
Figure 4. Coefficients and 95% confidence intervals for independent variables. Note: Horizontal axis refers to separate quantiles from 0.1 to 0.9; Vertical axis refers to the impact power of each independent variable on grassland circulation prices at each quantile and so provides a visual overview of the dynamic impact patterns.
Sustainability 10 04381 g004
Table 1. Variable definitions and basic statistics.
Variable Variable DefinitionMean St DevMaxMin
Dependent variable
Grassland PriceGP a*Grassland circulation’s bid price in CNYb/mu/year 65.854100.854003
Independent variables
Grassland Area *Size of grassland in mu (1 hectare = 15mu)5932.87359.940,000120
Grassland Type1 if it is meadow grassland; 2 if it is typical grassland; 3 if it is desert grassland;2.23350.643931
Irrigation 0 if no irrigation facility; 1 if irrigation is basically meet; 2 if irrigation condition is fully meet; 1.05580.790220
Distance1 if distance of land plot to national road was in 0–10 km; 2 if it was in 10–50 km; 3 if it was in 50–100 km; 4 if it was over 100 km;1.78170.741041
ContractForm1 if by transfer; 2 if by rent1.40610.492421
TermYears in which grassland is going to transfer/rent22.91421.516501
Social-EconomicPer capita income *Per capita disposable income of permanent residents of rural and pastoral areas in CNY11,7284257.423,8436325
Local GDP c*Local GDP in CNY 10,000 1,682,6561,399,9056,912,805359,071
* variables are log-transformed in analysis; a GP refers to Grassland Price; b CNY is the official abbreviation for Chinese Yuan Renminbi; c GDP refers to gross domestic product.
Table 2. Estimates for ordinary least squares regression and quantile regression.
OLSQ (0.25)Q (0.50)Q (0.75)
Grassland Type0.3102 **
(0.1244)
0.3199 *
(0.1583)
0.1884
(0.1742)
0.3401
(0.1702)
Area−0.1066 **
(0.0516)
−0.0598
(0.0657)
−0.1511 *
(0.0723)
−0.1741 **
(0.0706)
Irrigation0.1861 **
(0.0881)
0.1334
(0.1121)
0.3022 *
(0.1234)
0.1267
(0.1205)
Distance−0.5393 ***
(0.0952)
−0.5584 ***
(0.1212)
−0.4296 ***
(0.1334)
−0.3399 ***
(0.1304)
Term−0.0254 ***
(0.0035)
−0.0240 ***
(0.0045)
−0.0237 ***
(0.0050)
−0.0286 ***
(0.0048)
Form−0.3598 **
(0.1512)
−0.5162 **
(0.1924)
−0.2746
(0.2118)
−0.2110
(0.2069)
Per capita income−0.7858 ***
(0.2310)
−0.7557 **
(0.2940)
−0.7223 ***
(0.3237)
−1.1584 ***
(0.3162)
Local GDP0.1107
(0.1206)
0.1936
(0.1536)
0.1444
(0.1690)
0.2314 *
(0.1651)
Cons 11.2290 ***
(2.1756)
8.9831 ***
(2.7693)
10.3385 ***
(3.0483)
13.5475 ***
(2.9778)
Adjusted/Pseudo R20.39290.25950.25700.2650
Note: Standard error of the estimate is reported in parentheses below the estimated coefficient; the dependent variable is the log-transformed grassland circulation prices; for a full description of the independent variables, see Table 1; Significant Codes: *** 0.01, ** 0.05, * 0.1; and N = 197.

