Article

Impacts of Urbanization and Associated Factors on Ecosystem Services in the Beijing-Tianjin-Hebei Urban Agglomeration, China: Implications for Land Use Policy

1
Faculty of Tourism Management, Shanxi University of Finance and Economics, Taiyuan 030006, China
2
Faculty of Geographical Science, Beijing Normal University, Beijing 100875, China
3
School of Geography and Tourism, Qufu Normal University, Rizhao 276826, China
4
College of Geo-Exploration Science and Technology, Jilin University, Changchun 130026, China
*
Authors to whom correspondence should be addressed.
Sustainability 2018, 10(11), 4334; https://doi.org/10.3390/su10114334
Submission received: 27 September 2018 / Revised: 12 November 2018 / Accepted: 18 November 2018 / Published: 21 November 2018
(This article belongs to the Special Issue Urban Land Use Form in China)

Abstract

:
Conflicts between ecological conservation and socio-economic development persisted over many decades in the Beijing–Tianjin–Hebei urban agglomeration (BTH). Ecosystem services were affected drastically by rapid urbanization and ecological restoration programs in the BTH since 2000. This study aims to identify the spatial patterns of the four types of ecosystem services (net primary productivity (NPP), crop production, water retention, and soil conservation) in 2000 and 2010, and to make clear the impacts of urbanization and associated factors on the spatial patterns of ecosystem services. Based on the quantification of ecosystem services, we assessed the spatial patterns and changes, and identified the relationships between the type diversity of ecosystem services and land-use change. We also analyzed the effect of the spatial differentiation of influencing factors on ecosystem services, using the geographical detector model. The results showed that the average value of crop production increased substantially between 2000 and 2010, whereas the net primary productivity decreased significantly, and the water retention and soil conservation decreased slightly. The ecosystem services exhibited a spatial similar to that of influencing factors, and the combination of any two factors strengthened the spatial effect more than a single factor. The geomorphic factors (elevation and slope) were found to control the distribution of NPP, water retention, and soil conservation. The population density was responsible for crop production. We also found that the urbanization rate plays a major indirect role in crop production and water retention when interacting with population density and slope, respectively. The normalized difference vegetation index (NDVI) indirectly influences the spatial distribution of NPP when interacting with geomorphic factors. These findings highlight the need to promote new strategies of land-use management in the BTH. On the one hand, it is necessary to carefully select where new urban land should be located in order to relieve the pressure on ecosystem services in dense urban areas. On the other hand, the maintenance of ecological restoration programs is needed for improving vegetation coverage in the ecological functional zones in the medium and long term.

1. Introduction

Ecosystem services (ESs) are defined as the direct and indirect products and services that the ecosystem provides for human survival, health, and welfare [1,2]. As an important link between human and natural systems, ESs became one of the core issues in the field of sustainable development [3,4]. In the context of global urbanization, ecosystems are substantially transformed, degraded, or destroyed due to population growth and economic development caused by urbanization [5]. Specifically, non-urban areas were gradually replaced by increasing urban areas, and this was accompanied by undesirable landscape fragmentation and declines in ESs [6,7]. In China, rapid urbanization, population growth, and economic development put enormous pressure on ESs in urban agglomerations from 2000 to 2010, based on the tremendous land-use and land-cover changes (LUCC) that occurred in this time period. Increasing urbanization most likely altered the pattern and the quality of the ESs during this period. Therefore, exploring the impact of urbanization and its associated influencing factors on ESs is regarded as an important tool to promote the effective management of ESs [8,9], especially in urban agglomerations.
Urbanization, natural factors, and ecological restoration programs have complex effects on ESs [5]. Numerous studies showed that urbanization is one of the major drivers influencing changes in the ecosystem and its services [10,11]. Firstly, in order to meet the strong demands of urban development for space and resources, some natural and semi-natural ecosystems are transformed into artificial or semi-artificial ecosystems in urban agglomerations [12,13]. Although these processes provide social and economic benefits for humans, they trigger severe degradation, destruction, or transformation of ESs related to human wellbeing [14,15]. Zhang et al. [16] simulated urban expansion in the Beijing–Tianjin–Hebei urban agglomeration, and highlighted that the conversion of cropland to urban land due to urbanization was the main cause of ecosystem service loss. In order to mitigate and adapt to the degradation of ESs, in particular in rapid urbanization regions, a series of ecological restoration programs were implemented in China, such as the “Grain to Green Project (GGP)”, “Natural Forest Conservation Program (NFCP)”, and “Beijing–Tianjin Sand Source Control Program (BTSSCP)” [17]. The period of time we consider in this paper (2000–2010) was a period of maximum investment in ecological restoration programs [18]. These programs aimed to achieve local eco-environmental restoration by planting trees, protecting the natural forests, and encouraging afforestation activities [19]. The creation of policies to address the crises of ESs reflects effective management in favor of socio-economically sustainable development. Despite its negative effects, urbanization may boost some ESs. For instance, Buyantuyev et al. [20] found that the combined urban and agriculture areas contributed more to the regional primary production than the natural desert did in normal and dry years, in the Phoenix metropolitan region in the United States of America (USA). Additionally, natural factors (e.g., terrain [21], soil [22], biophysics [23], and climate [24]) in relation to ecological process were also recognized as important drivers of the patterns of ESs. In fact, urbanization not only influences ES provision by altering land-use patterns, but also the distribution of populations relative to the location of ESs. Land-use changes caused by urbanization are a major direct driver of ESs [4,25,26]; however, few studies considered the underlying impact of urbanization on ESs, as well as the interactive effect of urbanization and natural factors. The formulation mechanism of the spatial patterns of ESs is still not clearly understood [27,28].
As one of the largest urban agglomerations in China, the Beijing–Tianjin–Hebei urban agglomeration (BTH) was intensively dominated by strong urbanization pressures. The average urban growth rate was 3.51% from 2000 to 2012. The number of permanent residents reached 112 million in 2015, accounting for 8.1% of the total population of China. Urbanization will probably be the main cause of land conversion in the future. Indeed, a large proportion of land made up of ecosystems was converted to artificial surfaces to meet the demands of housing, industry, and traffic [29,30]. Rapid urbanization triggered a reduction in ESs, which is an obstacle to sustainability in the BTH [31,32]. In the face of the realistic contradictions between the reduction of ecological land and the increasing demands of socio-economic development, there is an urgent need for the BTH to improve its sustainable supply of ESs. It is, thus, also crucial for government regulators to make decisions to either reduce the associated costs to society, or increase ecosystem services [33]. However, some regions are yet to incorporate ecosystem services into conservation planning in the BTH.
The objective of this study was to analyze the impacts of urbanization and associated factors on the spatial patterns of ESs. To achieve this goal, we firstly quantified the ESs related to urbanization and ecological restoration policy in the BTH in 2000 and 2010, and identified the spatial patterns and changes in ESs provision. Then, we analyzed the interactive effect of influencing factors on the spatial differentiation of ESs using the geographical detector model. Finally, we discuss the potential effect of the urbanization rate and ecological restoration programs on ESs, and implications for land-use policy. The results provide useful information for understanding the interactions between increasing urbanization and ecosystem service provision, and mediating this relationship through land-use policy in the BTH.

2. Materials and Methodology
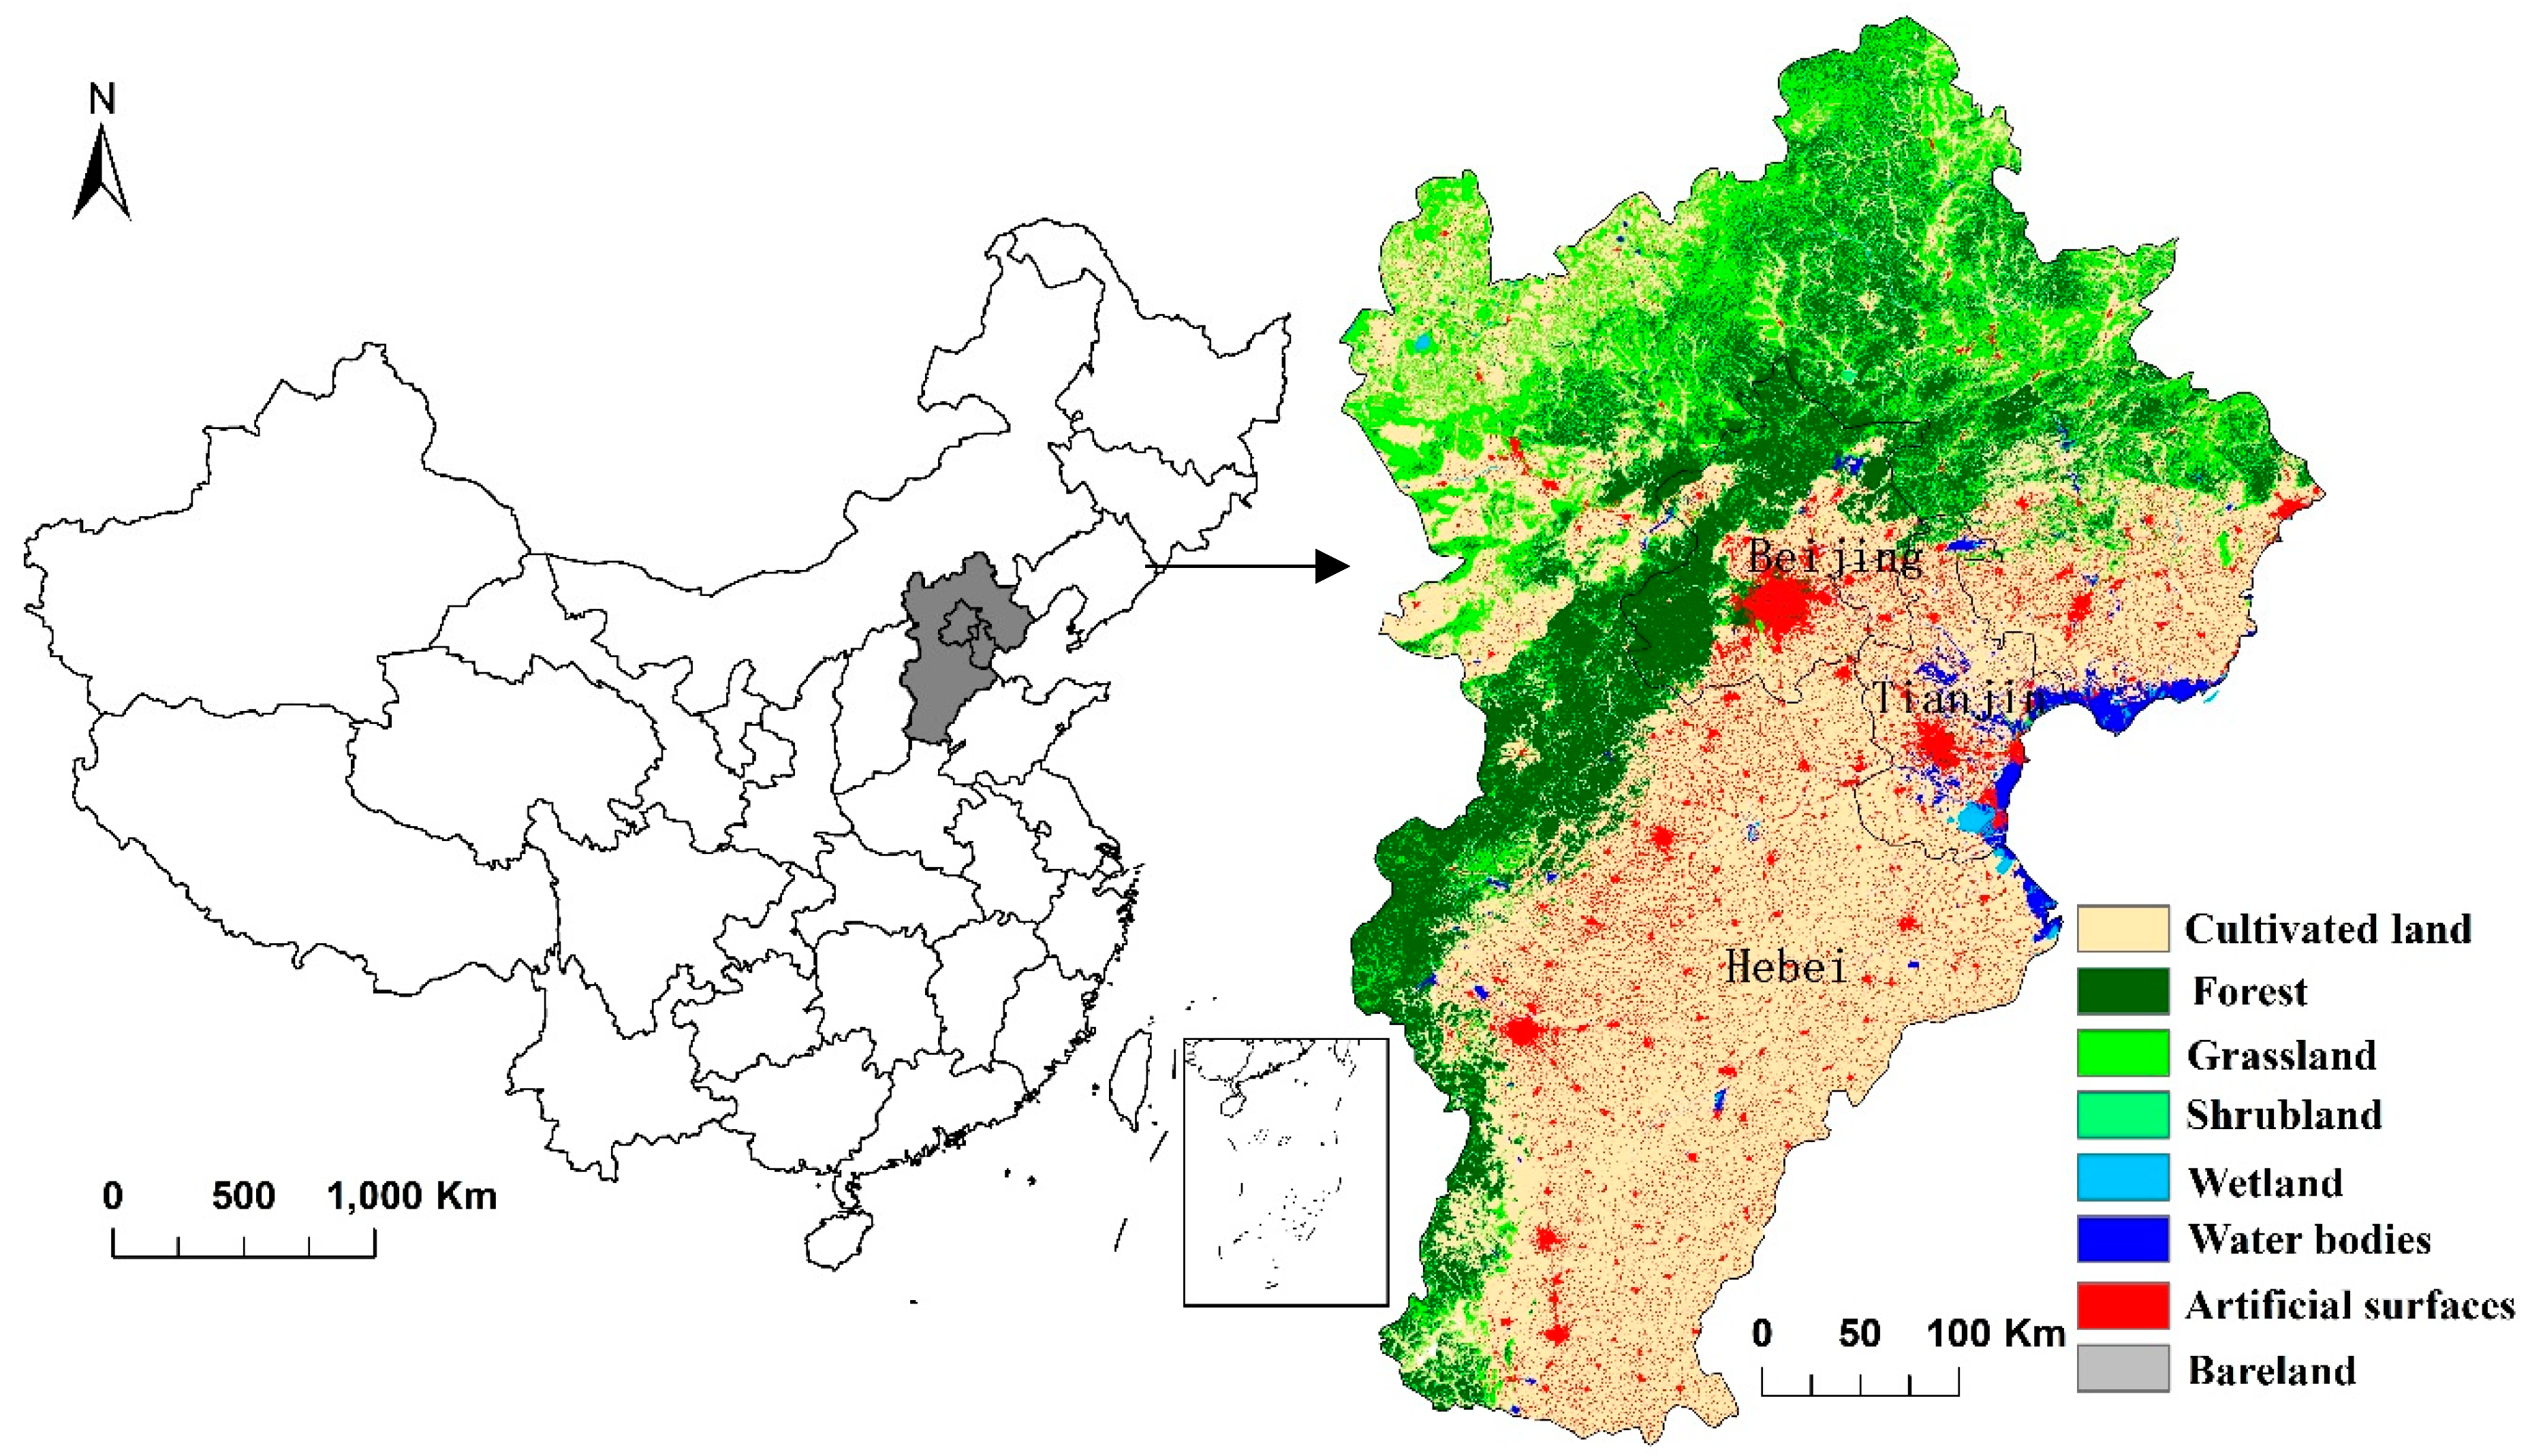
2.1. Study Area

The BTH is located in the northern part of China’s eastern coast (36°03′ N–42°40′ N, 113°27′ E–119°50′ E) (Figure 1), including Beijing city, Tianjin city, and Hebei province. It covers an area of over 218,000 km2. Most of the terrain southeast of the region consists of plains, while, to the northwest, there are mountains and hills. Mountains and plains account for approximately 48.2% and 43.8% of the total area of the BTH, respectively. The climate is temperate continental monsoon, with an annual average temperature of 3–15 °C and annual average rainfall of 304–750 mm.
As the third-largest urban agglomeration in China, the BTH has the most important concentrations of commerce, industry, and trade, in addition to relatively high agricultural productivity [34]. As shown in the China Statistical Yearbook (2016), the region accounts for 2.2% of the total land area of China, while it feeds 8% of the Chinese population and contributes 10.9% of China’s gross domestic product (GDP). Its eco-environment is under tremendous pressure exerted by increasing urbanization and population growth [35]. In the document of “Coordinated Development for the Beijing–Tianjin–Hebei Region (CDPBTH)” issued by the Chinese central government, it is indicated that the development objective of the BTH is to become a “world-class urban agglomeration centered on Beijing” and an “ecological restoration and environmental improvement demonstration region” in China. There is an urgent need to make breakthroughs in protecting the ecological environment, in order to promote sustainable development in the BTH.

2.2. Data

The data include both spatial data and statistical data. The land-cover datasets in 2000 and 2010 were derived from China’s Global Land Cover data product, with a resolution of 30 m (GlobeLand30). In total, all the spatial data were generated in grid cells of size 1 km × 1 km. Geographic coordinates and projections were consolidated into the WGS84 coordinate system and Albert projection. The data used for the analysis and the corresponding sources are listed in Table 1.

2.3. Methods

2.3.1. Quantifying Ecosystem Services

The ESs in this study were chosen to meet the subsequent criteria. Firstly, the selected services were severely affected by increasing urbanization in the study area. For instance, crop production is a critically important ecosystem service, whereas urban expansion leads to larger cultivated land degradation owing to the expansion of impervious surfaces. Secondly, they were relevant to ecological restoration policy for government decision-makers. The ecological problems of the BTH are always a focus of the government, and ecological restoration decisions were developed by the Chinese central government to promote ecological sustainability. For example, Beijing and the neighboring areas are in the sandstorm source area in northern China, which resulted in a strong focus on regulating services by decision-makers, such as services around water retention and soil conservation that are related to the implementation of ecological restoration programs. Finally, the selected ESs required the availability of data and methodologies for identifying their spatial patterns and providing management decisions. Under such criteria, the following ESs were selected in this study (Table 2): (i) net primary production (NPP), (ii) crop production (CRO), (iii) water retention (WAT), and (iv) soil conservation (SOI).
We chose the assessing models as the existing and extensively used tools that were originally developed to quantify the ESs. Specifically, the Carnegie Ames Stanford Approach (CASA) model was used to assess net primary production [36]. The assessment of crop production was based on the annual crop yield [37]. The water storage of forest ecosystems method was used for the measurement of water retention [38], and the universal soil loss equation (USLE) model was used for the calculation of soil conservation [39]. Individual ecosystem services were mapped in ArcGIS to visualize their spatial patterns. The specific models and processes used to assess the ESs are shown in Table 2.

2.3.2. Identifying the Diversity of the Types of Ecosystem Services

The supply types of ecosystem services at the county level were calculated based on the analysis of the spatial distribution of ESs. The means of each type of ecosystem service in the study areas were taken as the criterion for classification. If the spatial unit value of one type of ecosystem service was higher than the means of the study area, the spatial unit was determined to have a strong ability to provide the ESs. Counties whose supply levels of each ES were lower than the average levels of corresponding services were categorized as class “0”. Using this analogy, class “I”, class “II”, and class “III” are also included. The highest level was “III” due to a lack of counties where the values for the four ESs were all higher than the means in the study area.

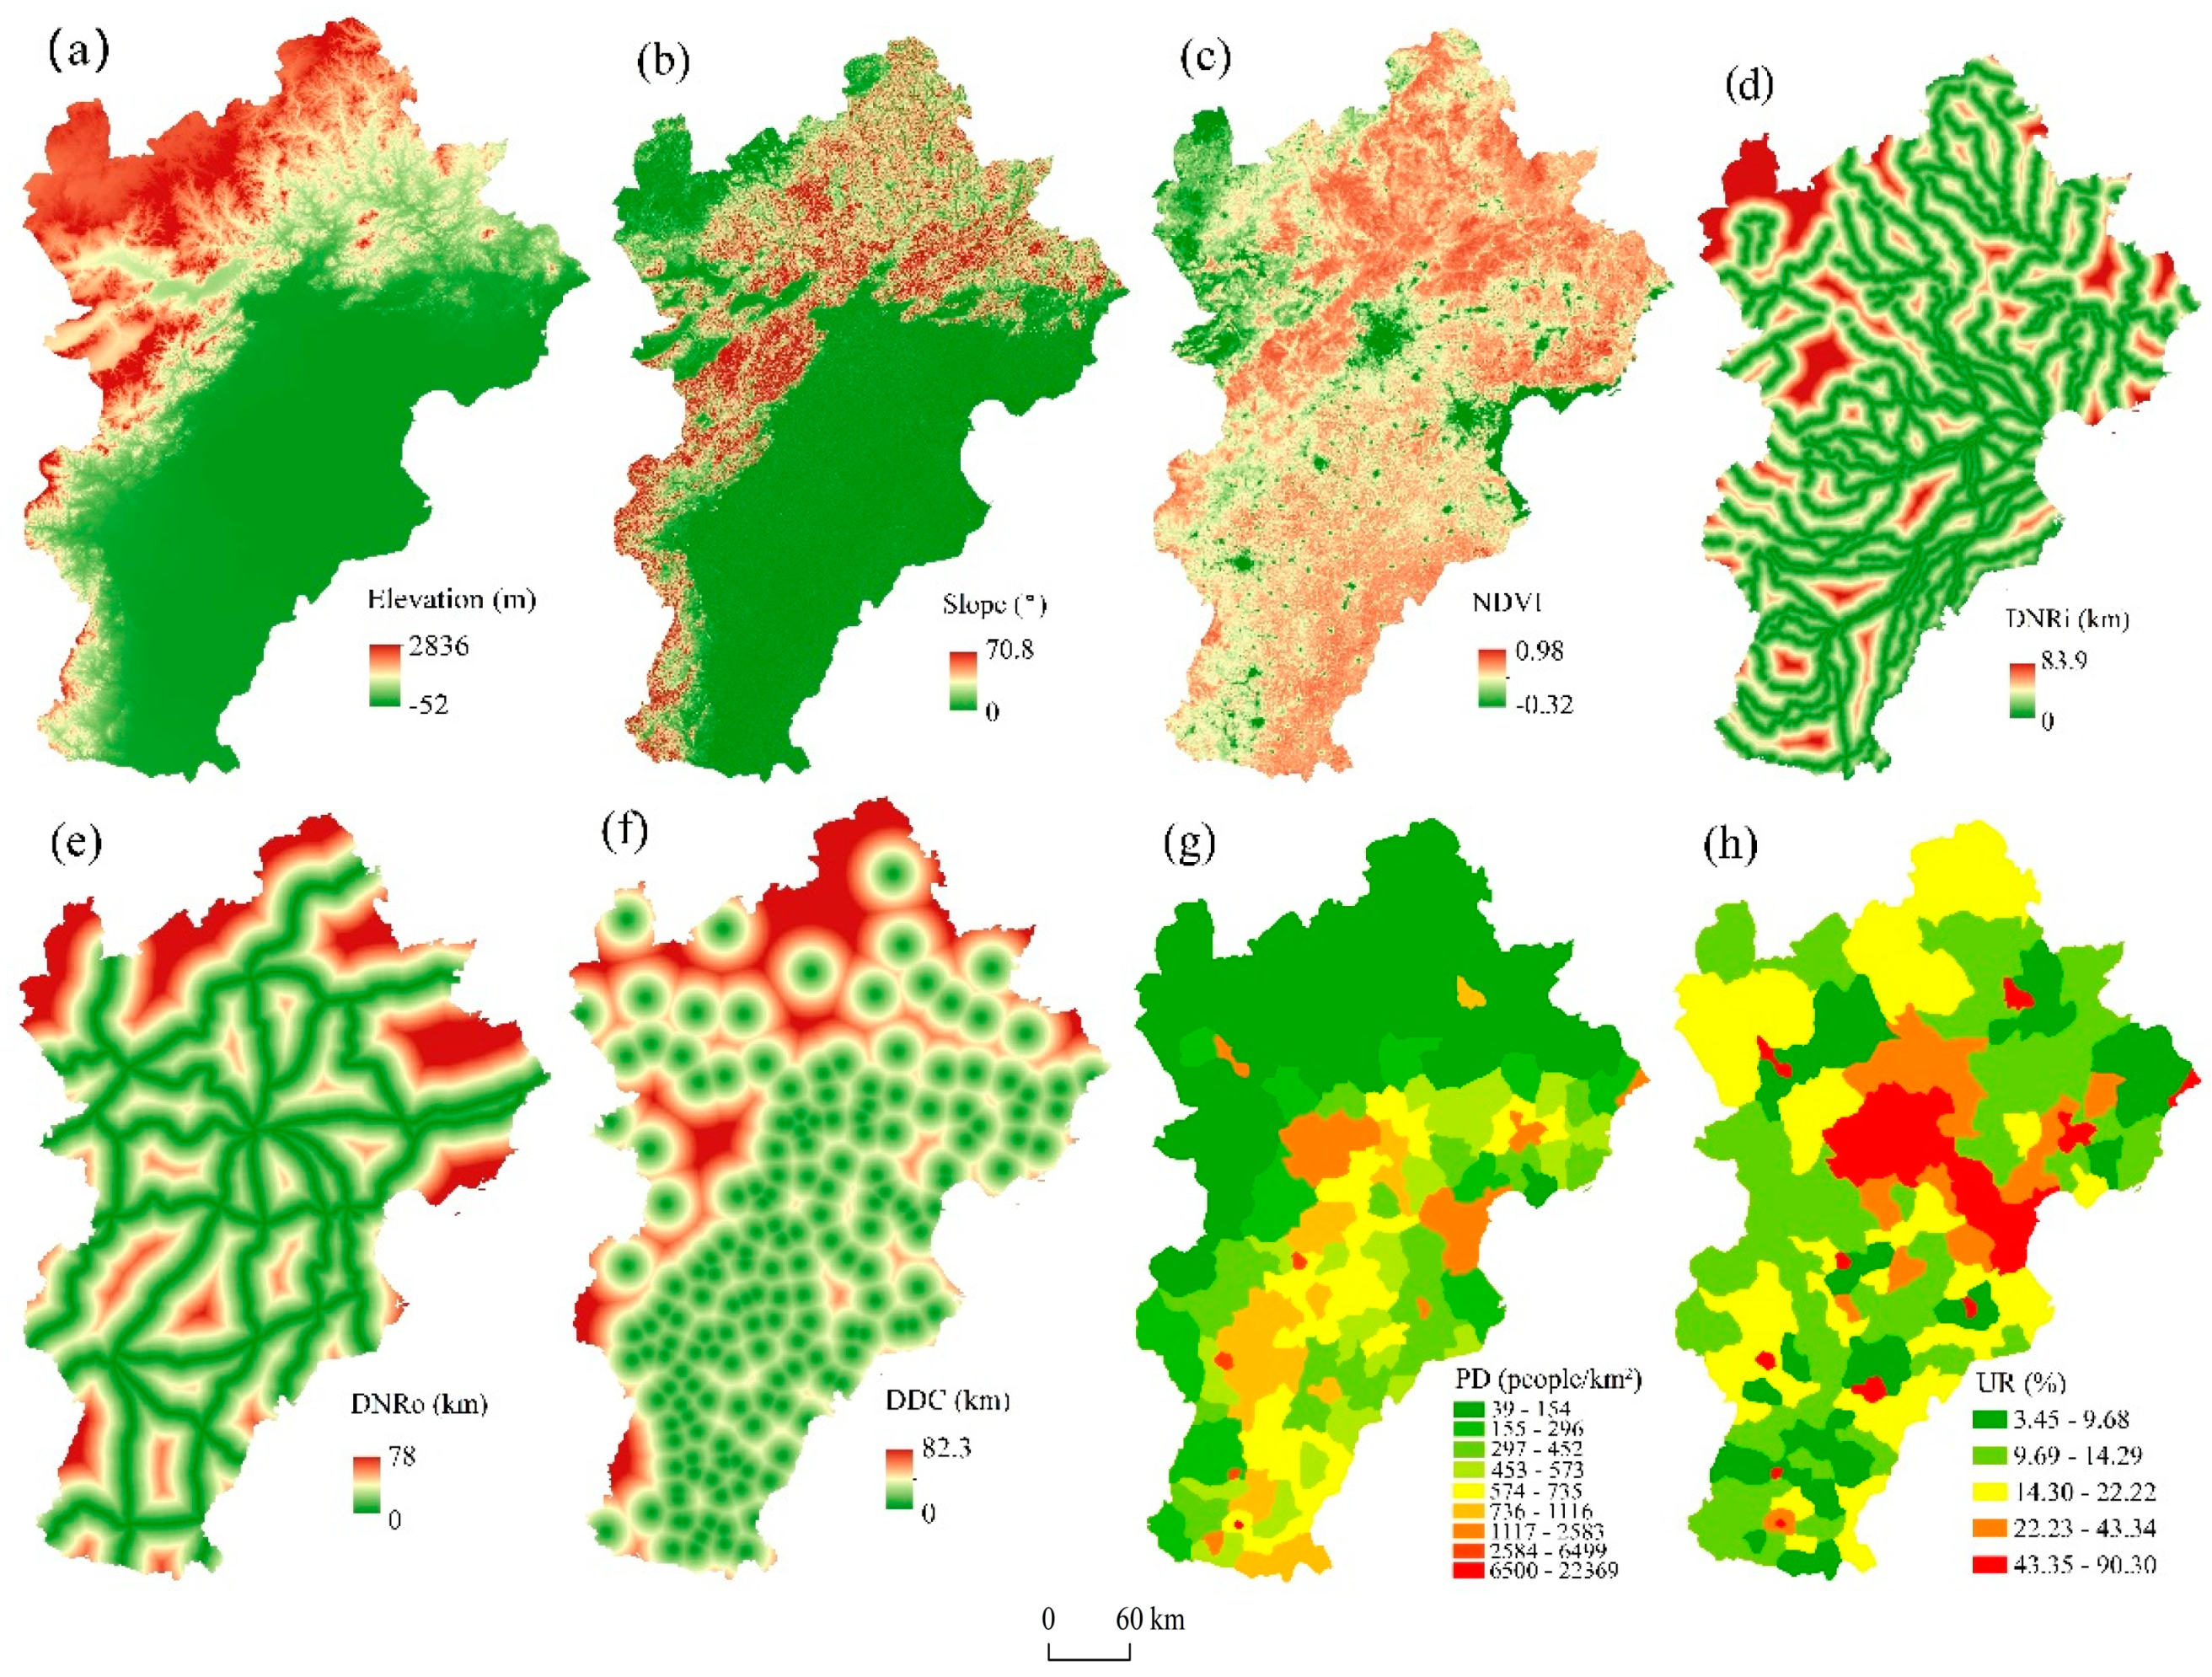
2.3.3. Selecting the Influencing Factors of Ecosystem Services

In analyzing the impacts on ESs in the BTH, we need to consider that many socio-economic and biophysical factors work simultaneously [46]. Three important considerations were used to select the influencing factors to study. Firstly, the selected factors were based on previously found relationships for ESs, and the biophysical and vegetation factors that have distinct ecological effects [37]. Secondly, a large increase in urbanization is a major driver of the conversion of land to impervious surfaces (e.g., highway, roads, and residential and industrial areas). Because a great deal of traffic facility construction was carried out in the BTH since 2000, the highly dense transportation networks would disturb the connectivity of the ecosystems, which may cause an unpredictable reduction in ecosystem structure and function. In addition, the expansion of urban areas shortens the distance from the land providing ESs, and this could lead to a reduction in available ecosystem goods and services. Thirdly, increasing urbanization is accompanied by the growth of the human population and the percentage of the population living urban areas, which not only influences the supply and use of ESs, but also the distribution of potential beneficiaries of the services. Finally, we selected eight influencing factors (Figure 2): elevation, slope, NDVI, the distance from the nearest river (DNRi), the distance from the nearest road (DNRo), the distance from the district center (DDC), population density (PD), and urbanization rate (UR).

2.3.4. Analyzing the Impacts on Ecosystem Services Using the Geographical Detector Model

The geographical detector model proposed by Wang et al. [47] is based on spatial variance analysis (SVA). The basic idea of SVA is to compare the spatial consistency of the dependent variable versus the independent variables, and, on this basis, to quantify the interpretation of the independent variables in relation to the dependent variables. There is no linear assumption for the independent variables [48]. It is widely used to analyze the effect of several independent variables on the spatial distribution of the dependent variable [49]. In this study, we assumed that the ESs would exhibit a spatial pattern similar to that of the influencing factors. Geographical detector software is considered useful for the purpose of analyzing the interpretation of single and multiple factors on the spatial patterns of ESs. This approach allows us to (a) identify which factor is determinant for the distribution of ESs; (b) examine whether two factors have a stronger or weaker effect on ESs than they do independently; and (c) explore how the other variables will increase or decrease the determinants’ effect.
The factor detector is used to determine the influence of a single factor on the spatial patterns of ESs. The formula is as follows:
P D , H = 1 1 n σ H 2 i = 1 m n D , i σ 2 H D , j ,
where PD,H are the detection values of the influencing factor D on ESs; n and δH2 are the sample size and variance of the study area, respectively; m is the classification number of a factor; and ND,i is the number of samples of D index in class i. The value range of P is [0, 1]; when the PD,H value is 1, it indicates that the factor has the same spatial distribution as the ES; when the value is 0, it implies a completely random spatial occurrence of the ESs.
The interaction detector is applied to assess the interactive effect of any two factors on ESs. The types of interactions between two variables are as follows:
Enhance: if PD,H (D1 ∩ D2) > PD, H (D1) or PD, H (D2)
Enhance, bivariate: if PD,H (D1 ∩ D2) > PD, H (D1) and PD,H (D2)
Enhance, nonlinear: if PD,H (D1 ∩ D2) > PD, H (D1) + PD,H (D2)
Weaken: if PD,H (D1 ∩ D2) < PD, H (D1) + PD, H (D2)
Weaken, univariate: PD,H (D1 ∩ D2) < PD, H (D1) or PD,H (D2)
Weaken, nonlinear: if PD,H (D1 ∩ D2) < PD, H (D1) and PD,H (D2)
Independent: if PD,H (D1 ∩ D2) = PD,H (D1) + PD,H (D2)
where the symbol “∩” denotes the intersection between the layers D1 and D2. The attributes of layer (D1 ∩ D2) are determined by the combination of the attributes of layer D1 and D2 by overlaying both in geographic information systems (GIS) to form a new layer. P (D1), P (D2), and P (D1 ∩ D2) were calculated using Equation (1). By comparing the sum (PD, H (D1) + PD, H (D2)) of the factors’ contribution to two individual attributes (P (D1), P (D2)) to the contribution of the two attributes when combined (P (D1 ∩ D2)), the interactive effects of two factors can be defined, referring to the above seven types.

3. Results

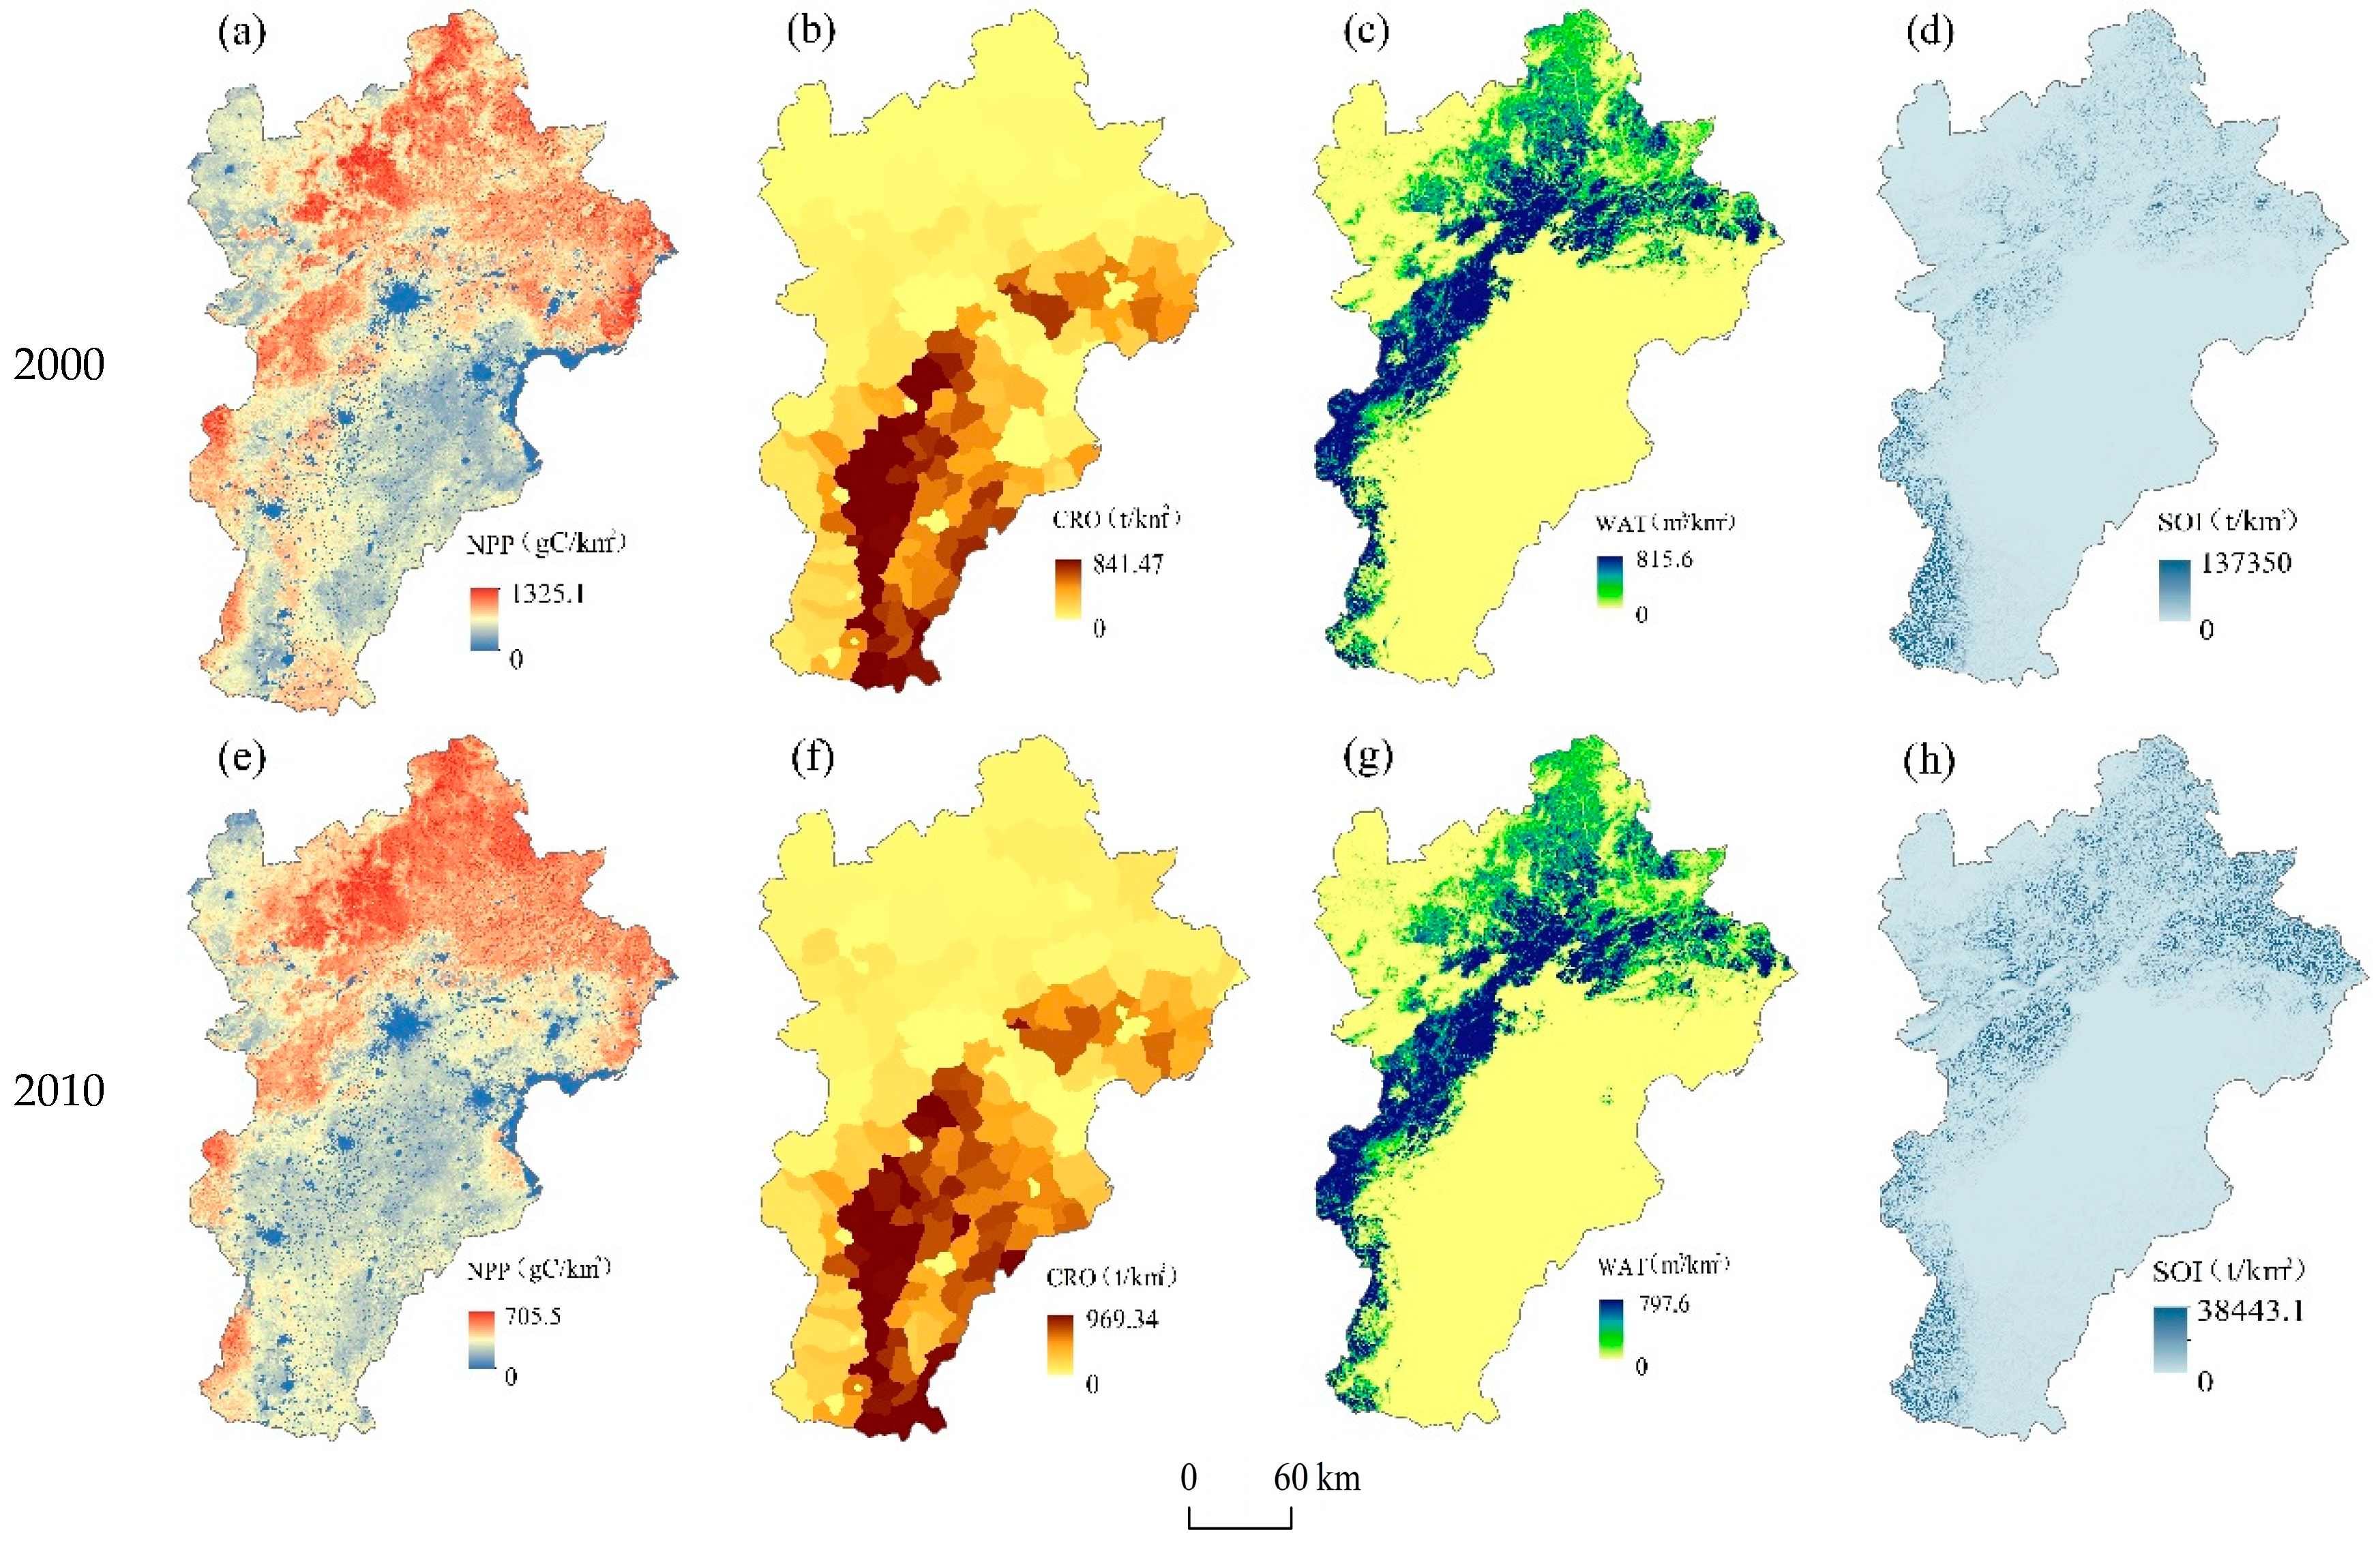
3.1. Spatial Patterns of Ecosystem Services

The ESs presented spatial differentiation in the BTH in 2000 and 2010 (Figure 3). There was a large decreasing trend in the average value of NPP (Table 3), where a reduction of 46.32% from 522.18 gC/m2 in 2000 to 280.31 gC/m2 in 2010 was found. However, NPP had a gradient increasing pattern from urban areas to the dense vegetation coverage. Crop production demonstrated a rough decreasing tendency from the southeast to the northwest in both 2000 and 2010. The high-value region was mainly located on the plains in the southeast of the BTH. During the study period, the average value of crop production increased by 23.25% (33.27 t/km2), from 143.08 t/km2 in 2000 to 176.36 t/km2 in 2010. Water retention showed a tendency of high value in the northwest and low value in the southeast. The high-value region of water retention was located in the east of Mount Yanshan and along the line of Mount Taihang, which was covered with abundant vegetation. There was only a minor decrease in water retention by 1.15% (1.35 m3/km2). A similar spatial pattern occurred in soil conservation. The distribution of soil conservation was higher in the southwest of Mount Taihang and the northeast of Mount Yanshan than in the southeast of the plain, with mountainous areas having a high level of soil conservation. The average value of soil conservation reached as high as 137.35 t/km2 in 2000; however, it decreased by 21.48% during the 10-year period.

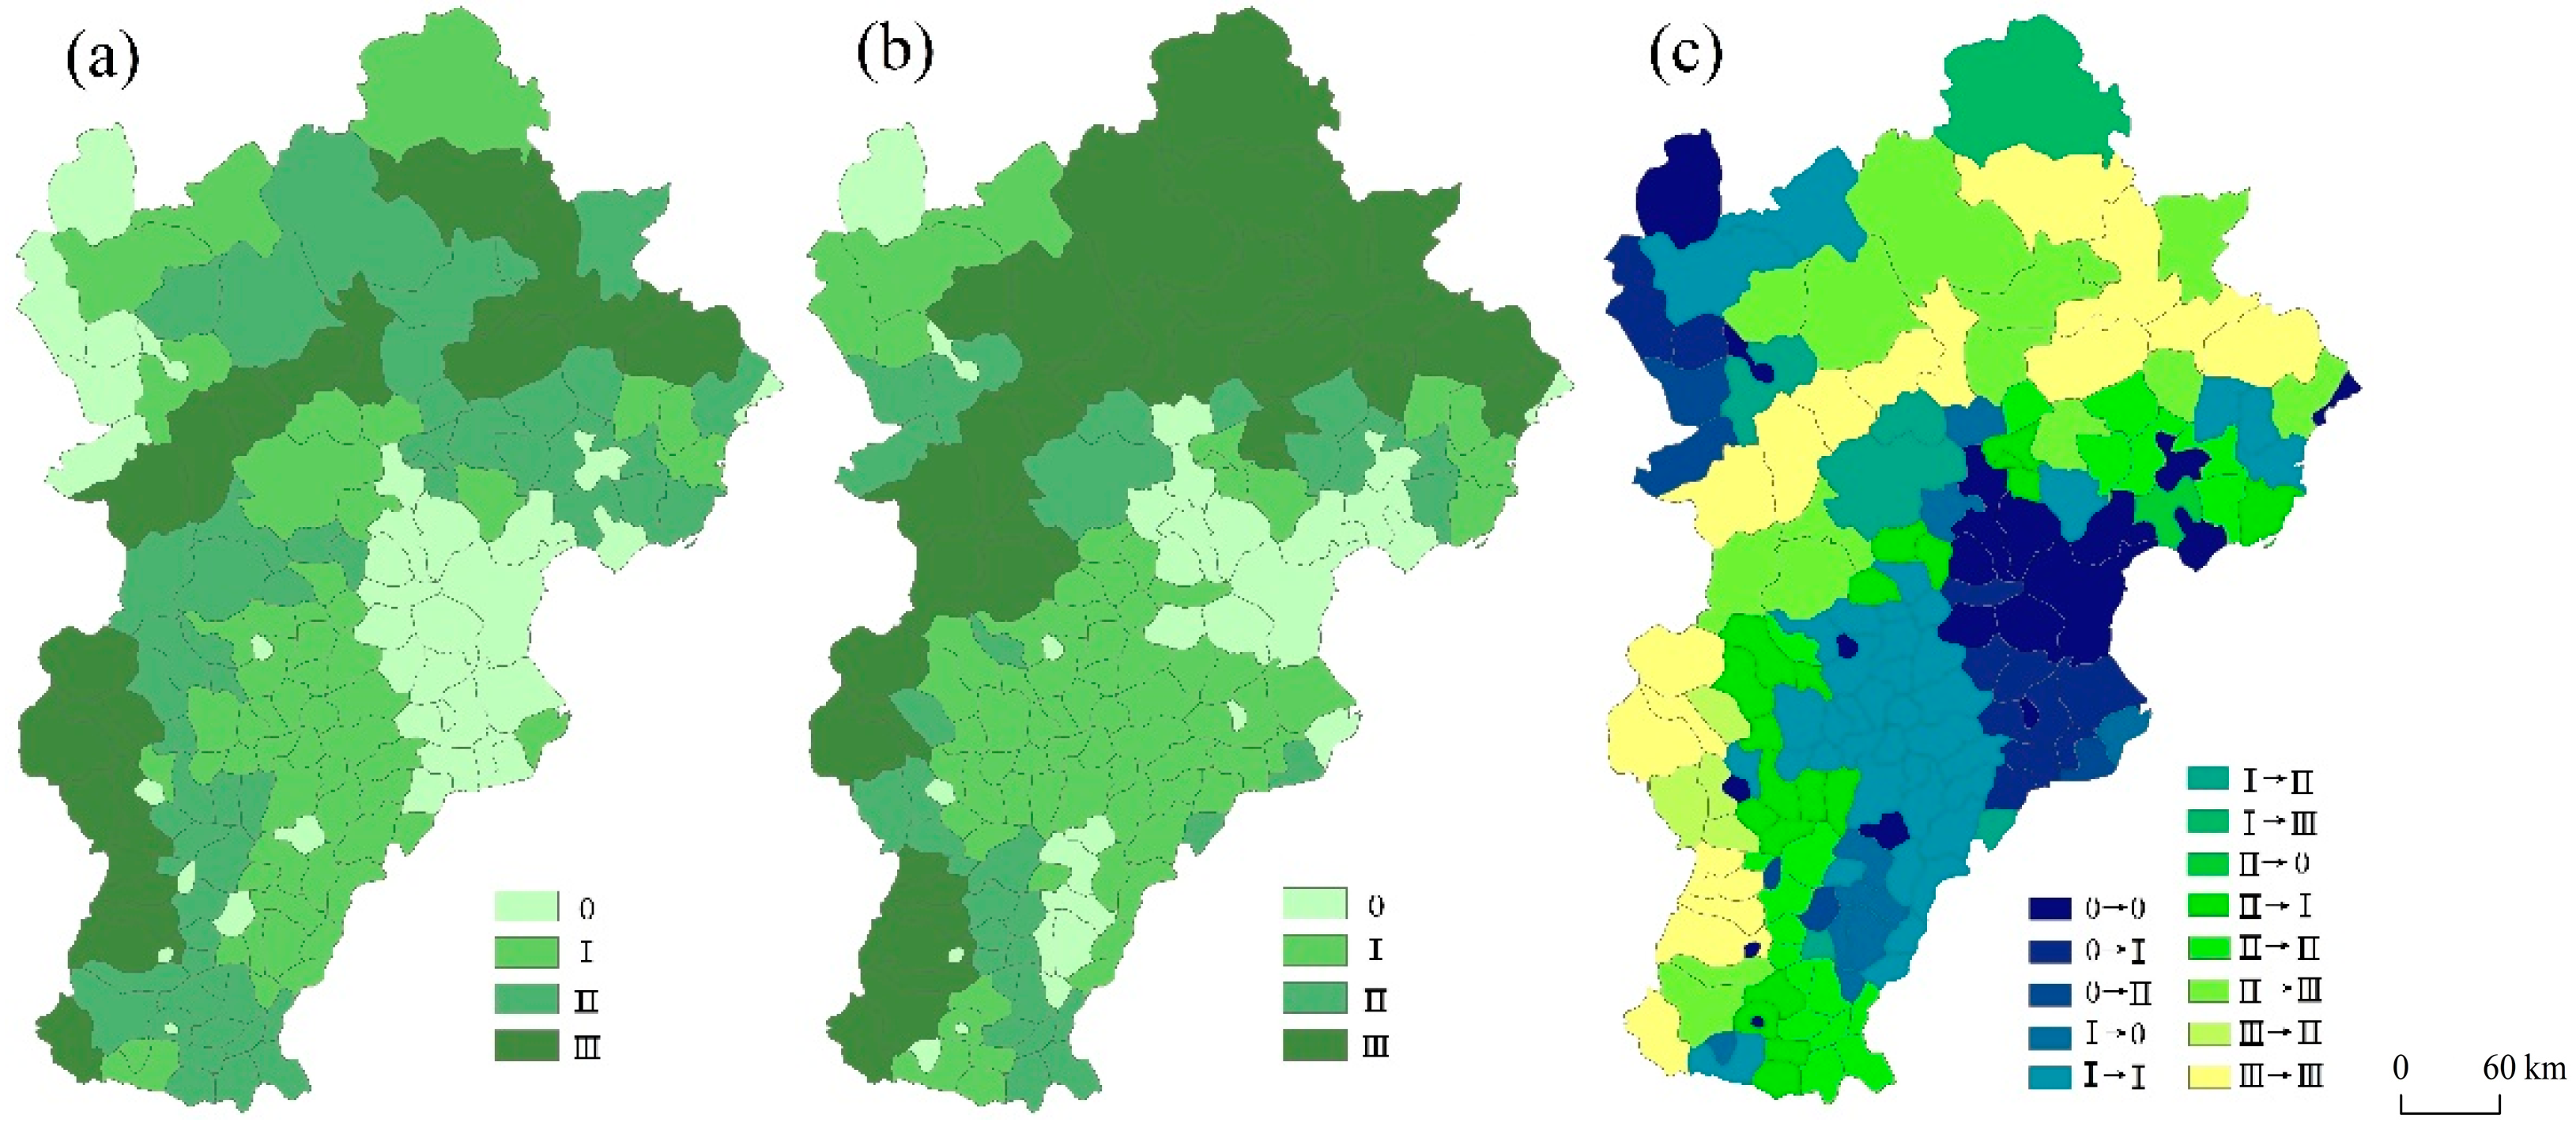
3.2. Spatiotemporal Patterns of Type Diversity of Ecosystem Services

The map of the types of ESs provision (Figure 4) showed that the types of ESs can be sorted as class “II” > class “I” > class “III” > class “0”, according to the proportion at the county level in 2000. Class “II” supplied two types of ESs, accounting for 32.3% of the total area of the BTH. Of the total area, 28.9% provided a single ecosystem service (class “I”). Meanwhile, 21.7% provided three types of ESs (class “III”), mainly located in the western and northern mountainous areas. Compared with those in 2000, the proportion of class “I” and class “III” in 2010 increased to 29.2% and 42.4%, respectively, while the proportion of class “0” and class “II” decreased to 12.8% and 15.6%. During 2000–2010, the middle plain showed a decrease in type diversity of ESs, mainly because of the transformation from class “II” into class “I”, which was caused by a fall in the NPP of the counties below the average level of the BTH. In contrast, the mountainous areas in the north experienced a major increase in the types of ESs, primarily due to the transformation from class “II” into class “III”, with an increase in soil conservation representing a growth above the average level of the BTH.
The spatial and temporal variations of type diversity of ESs showed the spatial differences of LUCC (Figure 5). Cultivated land was the primary land-cover type of the class “0” region in 2000, accounting for 71.3% of this area. Similarly, cultivated land area accounted for 65.3% and 50% in class “I” and class “II”, respectively. Forest, as one of the most important ecosystems for supplying diversified services, was the primary land-cover type in class “III”, accounting for 41.75% of the region. Between 2000 and 2010, forest in class “III” increased by 16,114.24 km2, and grassland increased by 16,540.47 km2. Thus, the main reason for the increase in the proportion of class “III” was the increase of forest and grassland area in the northern part of the BTH, resulting in NPP, water retention, and soil conservation being higher than the average level in the BTH and, thus, prompting the significant change in the spatial pattern of diversified ESs.

3.3. Impacts of Urbanization and Associated Factors on the Spatial Patterns of Ecosystem Services

3.3.1. Factor Detector

Using the factor detector, the p statistic value and Q significance value of each influencing factor were calculated based on Equation (1) for 2000 and 2010 (Table 4). The Q-value of DNRi on soil conservation in 2000 was 0.3495 > 0.1, which indicated the effect of DNRi on soil conservation was statistically insignificant. The Q-values of the other factors were 0.0000, indicating that the spatial consistency of the factors vs. the ESs was statistically significant. However, the factors had a weak effect on soil conservation according to the p statistic value. For NPP, the influencing factors in 2000 can be ranked according to the p-values as slope (0.2623) > NDVI (0.2463) > elevation (0.2105) > population density (0.1994). This result shows that the slope could predominantly explain the spatial variability of the NPP in 2000. Similarly, the slope had the highest influence on water retention. Slope and elevation were the major determinants of soil conservation in 2000 and 2010, respectively. Water retention and soil conservation showed a similar distribution as elevation and slope (Figure 2 and Figure 3). For crop production, population density had the strongest effect, followed by elevation.

3.3.2. Interaction Detector

The impacts of any two factors according to p-values were assessed and compared with their separate impacts. The results presented two modes of interaction of various factors on ESs, such as nonlinear enhancement ( Sustainability 10 04334 i001) and mutual enhancement (↑↑). This indicated that the explanatory power of the interaction of any two factors on ESs was greater than that of a single factor. We selected the factor combinations with the dominant factor in the single factor detection with the larger p-value (>0.5) (Table 5). It is important to note that soil conservation is not in Table 5, because the p-values of the interaction of any two factors were less than 0.5. We found that NDVI enhanced nonlinearly to slope and elevation for NPP in 2000 and 2010, respectively. For crop production, the interactive effects between population density and the seven other factors were stronger than that of itself. After interacting with the urbanization rate in 2000 and 2010, the p-values reached 0.8342 and 0.8467 respectively, which were far higher than the separate effect of population density. For water retention, the interactions between slope and other factors were enhanced compared to the main effect of the slope. Similar results were detected in slope for water retention. The p-values after the interaction of slope and the urbanization rate were 0.6466 and 0.6580 in 2000 and 2010, respectively, and the urbanization rate increased the role of the slope in influencing the distribution of water retention, followed by NDVI. This indicates that the urbanization rate was an important external driving force in crop production and water retention, while NDVI was the strongest external driver of the distribution of NPP. However, the high-value areas of urbanization and crop production were both located in the southeastern plains, and high-value water retention was located in the northwestern mountain areas (Figure 2 and Figure 3); thus, the effects of the urbanization rate on crop production and water retention were opposite in terms of spatial patterns.

4. Discussion

4.1. The Effect of the Urbanization Rate on Spatial Distribution in Crop Production and Water Retention

The urbanization rate contributed a lot to the spatial distribution of crop production when interacting with population density. This is mainly because the increasing urbanization rate generally represented highly intense human activities, resulting in impervious land and cultivated land being the main land-use type. It revealed that the distribution of crop production was socially supported by population growth and economic benefits. However, the spatial similarities of the urbanization rate vs. crop production and water retention will put enormous pressure on the supply of these two ESs in the study area. By altering the magnitude, type, and distribution of land use, the urbanization rate affected the patterns of ES provision [50]. Since 2000, attracted by job opportunities, medical treatments, and education, large numbers of people moved to urban regions in the BTH, which is accelerating the conversion of non-urban areas to urban areas. In the BTH, the impervious land increased by 19.4% from 2000 to 2010 and the cultivated land decreased by 3.2% [51]. In our study, the total regional mean crop production increased during the 10-year period due to increased annual grain production, rather than an increase in arable land. As one of the largest hotspots for urban development in the BTH, the increase in crop production was urgently needed to accommodate the increasing population.
In addition, the results of geographical detectors also confirmed the findings of other works (e.g., Alberti et al. [52]), particularly the fact that the effect of urbanization on ESs strongly depends on natural conditions. In our study, the main determinant of the distribution of water retention was the slope, followed by the elevation. Although the urbanization rate was found to have a weak effect in single-factor detection, it played an important role after interacting with the geomorphic factors. Indeed, the increase in impervious land associated with urbanization affects both geomorphic and hydrological processes, causing changes in water and sediment fluxes [53]. Several studies reported that the effect of increasing urbanization (e.g., urban expansion and population growth) on ESs was negative in multi-scale [54]. Our results support all of these preceding studies. Nevertheless, taking a more comprehensive perspective, our study evidenced a common fundamental understanding of the interactive effect of urbanization and natural factors on the spatial patterns of ESs at the regional scale.

4.2. The Effect of Vegetation Cover on NPP

Our study showed that NDVI had the greatest role in the distribution of NPP after interacting with geomorphic factors. More generally, NDVI was suggested as an effective measure of vegetation coverage [55]. In fact, the vegetation cover was substantially increased by implementing a series of ecological restoration programs in the north of the BTH since 2000 [4]. These include GGP, a program that converts cultivated land into forests and grassland since 1999, which is the first and the most ambitious “payment for ESs” in China, with the strongest policy support. The cumulative total investment was planned at United States dollar (USD) $40 billion to convert 147 million hectares of croplands and 173 million hectares of barren mountains and wastelands into forests and grasslands in 25 provinces from 1999 to 2010 [42]. NFCP aims to protect natural forests through logging bans. BTSSCP aims to prevent sandstorms through afforestation in the north of the BTH. By 2009, the cumulative total investment through the NFCP and BTSSCP exceeded USD $50 billion. These programs aimed to reduce natural disaster risk by restoring forest and grassland, which improved variations of ESs (e.g., food production, carbon sequestration, and soil conservation) in China. Li et al. found that the NDVI index showed a rising trend in the north and west of the BTH region in 2005–2010 [56].
Our study evidenced that the influence of NDVI on NPP in quantity and distribution was affected greatly by ecological restoration programs in the BTH. For instance, the total area of grassland and forest increased by 686.06 km2 and 350.13 km2 in the BTH during the period of 2000–2010. The greatest vegetation cover was in the Mount Yan region in the north of the study area, where the mean NDVI was higher than 0.67 in 2010. The average value of NPP in the study area was decreased, whereas it was increased and distributed continuously in the north of the BTH. It could be speculated that changes occurred in the vegetation coverage driven by ecological restoration programs in the north of the BTH. The performance of these programs directly promoted the increase of forest and grassland coverage and drove the betterment of NPP, water retention, and soil conservation in Mount Yan and Mount Taihang (Figure 3 and Figure 4). The results of our study are in accordance with those of previous studies. For example, Wu et al. [57] found that some of the ecological restoration programs exhibited positive impacts on ESs in the northwest of the BTH. Wu et al. [58] also found that the BTSSCP and GGP were effective for vegetation increase in the Beijing–Tianjin Sand Source Region of the northern BTH. Moreover, Jiang et al. [59] found that the ecological restoration programs played a positive role in the ESs in the Beijing–Tianjin Sand Source Region.

4.3. Implications for Socio-Ecological Development Land-Use Policy in Urban Agglomerations

The interactions between urbanization and ESs are spatially determined by land use, and land-use policy is highly influenced by patterns of land uses [60]. Our study highlighted the challenges in determining how to control the distribution of ESs by altering land-use patterns in the BTH. With the aim of identifying implications and recommendations in land-use policies, some policy suggestions are put forward by integrating our findings and the development targets of the BTH. On the one hand, greater efforts to control urban sprawl by strictly limiting the transformation of cultivated land to land for construction purposes is needed [61]. We propose that careful selection of new urban land siting may limit the loss of ESs based on a reliable land program. In our study, crop production had a spatial coincidence with population density and the urbanization rate, meaning that the effects of urban development on crop production were significant. Despite the cultivated land requisition–compensation balance policy that was implemented in China in recent years, the quality of the cultivated land occupied by urban expansion in the periphery of cities is higher than the compensated cultivated land. This could cause ungovernable changes in the spatial pattern of ESs impacted by cultivated land.
On the other hand, the restoration of ESs by ecological restoration programs needs to be promoted through the incorporation of multi-stakeholder governance that has a multi-scale focus. Linking supplies of ESs to changes in the distribution of beneficiaries is vital for informed policy-making. Our study showed that, although the implementation of the ecological programs achieved a positive effect on the ESs in the northern areas in BTH, the total mean level of ESs continued decreasing, except for crop production. Specific land-use policies should be made in terms of not only the local ecosystem service provision, but also the regional benefits. For example, the Water Retention Reserve was established in Chengde County in the northern mountainous areas of the BTH, located upstream of the Luan River, Chao River, Liao River, and Daling River, and has two reservoirs (Panjiakou and Miyun). It is necessary to prohibit the occupation of forest and grassland by cultivated land in these reservoir areas in order to maintain sustainable water retention. According to Liu et al. [62], the ecological effect of ecological restoration programs lags behind where it needs to be. Thus, the trade-off between ecological sustainability and socio-economic development remains a challenge for the BTH under the pressure of an increasing urban population. As Quintas-Soriano et al. [63] state, it is difficult to face the binomial relationship between development and conservation.

4.4. Limitations and Future Perspectives

Our study has several limitations. Firstly, the quantitative models and data for evaluating ESs were integrated in multi-scale, which would inevitably generate uncertainties in spatial statistics. For example, the crop production was estimated at the county level, so the calculation accuracy was lower than for NPP, water retention, and soil conservation at the pixel level. In addition, the cell resolution of 1 km × 1 km for assessment of ESs was generally coarse for implicating land-use policy. However, as an integrated functional zone specified by the Chinese government, the BTH needs to formulate regional land-use strategies and policies. This study aimed to apply decision-making regarding land use at the urban agglomeration level. Nevertheless, we still argue that the gains/losses in ESs need to be evaluated at finer scales for improved accuracy, to improve the application efficiency in practice.
Secondly, we considered the road traffic (the distance from the nearest road), urban expansion (the distance from the district center), population density, and the urbanization population (urbanization rate) as the indicators of urbanization. Due to the limitations of acquiring the data, we only adopted commonly used influencing factors in this study. However, these direct and indirect drivers cannot completely explain the mechanisms of urbanization relevant to ESs. Therefore, diverse influencing factors that are driven by urbanization patterns still need to be explored to facilitate the understanding of the cause–effect of ESs.
Thirdly, we only explored the effect at the regional scale. The impact of the urbanization and associated factors on ESs occurred at different spatial and temporal scales. ESs are linked closely with natural factors, whereas the spatial scale of human activities is tinted by administrations or institutions. Most of the previous research focused on the county, city, and pixel scales; however, the most relevant influencing factors for one type of ecosystem service may not be the same at different scales. For instance, Yang et al. [37] found that the socio-economic driver has a greater contribution than the natural endowment in the variance of the ecosystem services at the city cluster scale in the Yangtze River Delta, China. Raudsepp-Hearne et al. [64] found that land cover contributed more to the variance of the ecosystem services at the city scale in Quebec, Canada. Therefore, it is argued that it is important to properly address the scale effect of influencing factors that give rise to ecosystem service heterogeneity in future studies. Doing so will improve the efficient management of ESs in urban agglomerations.

5. Conclusions

This study assessed ESs and analyzed the impacts of urbanization and associated factors on the spatial patterns of ESs. The results showed the changes in the magnitude and distribution of ESs in the BTH. Crop production was enhanced between 2000 and 2010, while there was a major decrease in NPP. Both the water retention and soil conservation slightly decreased over time. The number of different types of ESs increased due to the enhancement of the NPP, water retention, and soil conservation in the northern mountainous areas of BTH. It was found that geomorphic factors had a major role in the spatial patterns of NPP, water retention, and soil conservation, whereas population density controlled the distribution of crop production. The urbanization rate was the indirect spatial determinant of crop production and water retention. The combination of NDVI and geomorphic factors (elevation and slope) strengthened the spatial differences of NPP. Although the implementation of ecological restoration programs was effective in local areas between 2000 and 2010, the negative effect of increasing urbanization on ESs will need to be moderated in the future. This also has implications for land-use policy. It is urgent for dense urban areas to reduce the pressure of ecosystem service provision by controlling rapid urban sprawl in the BTH. At the same time, it is important to maintain the implementation of ecological restoration programs in the ecological functional zone. Finally, it is critical to pay attention to stakeholders in driving decisions for sustainable ecosystem service provision in the medium and long term.

Author Contributions

Y.Z. conceptualized this manuscript. Y.Z. and B.L. prepared the database and wrote this manuscript. X.L. and D.W. reviewed the manuscript and assisted in writing and finalizing the manuscript. All authors read and approved the final manuscript.

Funding

This study was funded by the National Natural Science Foundation of China [Grant No. 41771128; 41301185; 41701630], and the 985 Project of Beijing Normal University [No. 2015KJJCB29].

Acknowledgments

We are especially grateful to the National Geomatic Center of China for providing land-use/land-cover data (GlobeLand30). We thank the academic editors and anonymous reviewers for their kind suggestions and valuable comments.

Conflicts of Interest

The authors declare no conflicts of interests.

References

  1. Aily, G. Nature’s Services: Societal Dependence on Natural Ecosystems; Island Press: Washington, DC, USA, 1997. [Google Scholar]
  2. MEA. Ecosystems and Human Well-Being: Synthesis; Island Press: Washington, DC, USA, 2005. [Google Scholar]
  3. Costanza, R.; D’arge, R.; De Groot, R.; Farber, S.; Grasso, M.; Hannon, B.; Limburg, K.; Naeem, S.; O’neill, R.; Paruelo, J.; et al. The value of the world’s ecosystem services and natural capital. Nature 1997, 387, 253–260. [Google Scholar] [CrossRef]
  4. Ouyang, Z.; Zheng, H.; Xiao, Y.; Polasky, S.; Liu, J.; Xu, W.; Wang, Q.; Zhang, L.; Xiao, Y.; Rao, E.; et al. Improvements in ecosystem services from investments in natural capital. Science 2016, 352, 1455–1459. [Google Scholar] [CrossRef] [PubMed]
  5. Haase, D.; Schwarz, N.; Strohbach, M.; Kroll, F. Synergies, Trade-offs, and Losses of Ecosystem Services in Urban Regions: An Integrated Multiscale Framework Applied to the Leipzig-Halle Region, German. Ecol. Soc. 2012, 17, 22. [Google Scholar] [CrossRef]
  6. Metzger, M.J.; Rounsevell, M.D.A.; Acosta-Michlik, L.; Leemans, R.; Schroter, D. The vulnerability of ecosystem services to land use change. Agric. Ecosyst. Environ. 2006, 114, 69–85. [Google Scholar] [CrossRef]
  7. Long, H.; Liu, Y.; Hou, X.; Li, T.; Li, Y. Effects of land use transitions due to rapid urbanization on ecosystem services: Implications for urban planning in the new developing area of China. Habitat Int. 2014, 44, 536–544. [Google Scholar] [CrossRef]
  8. Liu, J.; Dietz, T.; Carpenter, S.R.; Floke, C.; Alberti, M.; Redman, C.L.; Schneider, S.H.; Ostrom, E.; Pell, A.N.; Lubchenco, J.; et al. Coupled Human and Natural Systems. Ambio 2007, 36, 639–649. [Google Scholar] [CrossRef] [Green Version]
  9. Wong, C.P.; Jiang, B.; Kinzig, A.P.; Lee, K.N.; Ouyang, Z. Linking ecosystem characteristics to final ecosystem services for public policy. Ecol. Lett. 2015, 18, 108–118. [Google Scholar] [CrossRef] [PubMed]
  10. Shrestha, M.K.; York, A.M.; Boone, C.G.; Zhang, S. Land fragmentation due to rapid urbanization in the Phoenix Metropolitan Area: Analyzing the spatiotemporal patterns and drivers. Appl. Geogr. 2012, 32, 522–531. [Google Scholar] [CrossRef]
  11. Wang, J.; Huang, B.; Fu, D.; Atkinson, P.M.; Zhang, X. Response of urban heat island to future urban expansion over the Beijing–Tianjin–Hebei metropolitan area. Appl. Geogr. 2016, 70, 26–36. [Google Scholar] [CrossRef] [Green Version]
  12. Foley, J.A.; Defries, R.; Asner, G.P.; Barford, C.; Bonan, G.; Carpenter, S.R.; Chapin, F.S.; Coe, M.T.; Daily, G.C.; Gibbs, H.K.; et al. Global Consequences of Land Use. Science 2005, 309, 570–574. [Google Scholar] [CrossRef] [PubMed] [Green Version]
  13. Li, B.; Chen, D.; Wu, S.; Zhou, S.; Wang, T.; Chen, H. Spatio-temporal assessment of urbanization impacts on ecosystem services: Case study of Nanjing City, China. Ecol. Indic. 2016, 71, 416–427. [Google Scholar] [CrossRef]
  14. Lu, X.; Shi, Y.; Chen, C.; Yu, M. Monitoring Cropland Transition and Its Impact on Ecosystem Services Value. Land Use Policy 2017, 69, 25–40. [Google Scholar] [CrossRef]
  15. Qiu, J.; Turner, M.G. Spatial interactions among ecosystem services in an urbanizing agricultural watershed. Proc. Natl. Acad. Sci. USA 2013, 110, 12149–12154. [Google Scholar] [CrossRef] [PubMed] [Green Version]
  16. Zhang, D.; Huang, Q.; He, C.; Wu, J. Impacts of urban expansion on ecosystem services in the Beijing-Tianjin-Hebei urban agglomeration, China: A scenario analysis based on the Shared Socioeconomic Pathways. Resour. Conserv. Recycl. 2017, 125, 115–130. [Google Scholar] [CrossRef]
  17. Yin, R.; Yin, G. China’s primary programs of terrestrial ecosystem restoration: Initiation, implementation, and challenges. Environ. Manag. 2010, 45, 429. [Google Scholar] [CrossRef] [PubMed]
  18. Ouyang, Z.; Wang, Q.; Zheng, H.; Zhang, F.; Hou, P. National ecosystem survey and assessment of China (2000–2010). Chin. Sci. Bull. 2014, 1, 462–466. [Google Scholar]
  19. Zhang, Y.; Peng, C.; Li, W.; Tian, L.; Zhu, Q.; Chen, H.; Fang, X.; Zhang, G.; Liu, G.; Mu, X.; et al. Multiple afforestation programs accelerate the greenness in the ‘Three North’ region of China from 1982 to 2013. Ecol. Indic. 2016, 61, 404–412. [Google Scholar] [CrossRef] [Green Version]
  20. Buyantuyev, A.; Wu, J. Urbanization alters spatiotemporal patterns of ecosystem primary production: A case study of the Phoenix metropolitan region, USA. J. Arid. Environ. 2009, 73, 512–520. [Google Scholar] [CrossRef]
  21. Marshall, J.M. Influence of topography, bare sand, and soil pH on the occurrence and distribution of plant species in a lacustrine dune ecosystem. J. Torrey Bot. Soc. 2014, 141, 29–38. [Google Scholar] [CrossRef]
  22. Milne, E.; Banwart, S.A.; Noellemeyer, E.; Abson, D.J.; Ballabio, C.; Bampa, F.; Bationo, A.; Batjes, N.H.; Bernoux, M.; Bhattacharyya, T.; et al. Soil carbon, multiple benefits. Environ. Dev. 2015, 13, 33–38. [Google Scholar] [CrossRef]
  23. Zavaleta, E.S.; Pasari, J.D.; Hulvey, K.D.; Tilman, G.D. Sustaining multiple ecosystem functions in grassland communities requires higher biodiversity. Proc. Natl. Acad. Sci. USA 2010, 107, 1443–1446. [Google Scholar] [CrossRef] [PubMed] [Green Version]
  24. Xiong, W.; Holman, I.; Lin, E.; Conway, D.; Li, Y.; Wu, W. Untangling relative contributions of recent climate and CO2 trends to national cereal production in China. Environ. Res. Lett. 2012, 7, 1–9. [Google Scholar] [CrossRef]
  25. Lawler, J.J.; Lewis, D.J.; Nelson, E.; Polasky, S.; Withey, J.C.; Helmers, D.P.; Martinuzzi, S.; Pennington, D.; Radeloff, V.C. Projected land-use change impacts on ecosystem services in the United States. Proc. Natl. Acad. Sci. USA 2014, 111, 7492–7509. [Google Scholar] [CrossRef] [PubMed]
  26. Turner, K.G.; Anderson, S.; Gonzales-Chang, M.; Costanza, R.; Courville, S.; Dalgaard, T.; Dominati, E.; Kubiszewski, I.; Porfirio, L.; Ratna, N.; et al. A review of methods, data, and models to assess changes in the value of ecosystem services from land degradation and restoration. Ecol. Model. 2016, 319, 190–207. [Google Scholar] [CrossRef]
  27. Häyhä, T.; Franzese, P.P. Ecosystem services assessment: A review under an ecological-economic and systems perspective. Ecol. Model. 2014, 289, 124–132. [Google Scholar] [CrossRef]
  28. Wu, K.; Ye, X.; Qi, Z.; Zhang, H. Impacts of land use/land cover change and socioeconomic development on regional ecosystem services: The case of fast-growing Hangzhou metropolitan area, China. Cities 2013, 31, 276–284. [Google Scholar] [CrossRef]
  29. Haas, J.; Ban, Y. Urban growth and environmental impacts in Jing-Jin-Ji, the Yangtze, River Delta and the Pearl River Delta. Int. J. Appl. Earth Obs. Geoinform. 2014, 30, 42–55. [Google Scholar] [CrossRef]
  30. Tan, M.; Li, X.; Xie, H.; Lu, C. Urban land expansion and arable land loss in China—A case study of Beijing–Tianjin–Hebei region. Land Use Policy 2005, 22, 187–196. [Google Scholar] [CrossRef]
  31. Peng, J.; Chen, X.; Liu, Y.; Lu, H.; Hu, X. Spatial identification of multifunctional landscapes and associated influencing factors in the Beijing-Tianjin-Hebei region, China. Appl. Geogr. 2016, 74, 170–181. [Google Scholar] [CrossRef]
  32. Peng, J.; Liu, Y.; Liu, Z.; Yang, Y. Mapping spatial non-stationarity of human- natural factors associated with agricultural landscape multifunctionality in Beijing–Tianjin–Hebei region, China. Agric. Ecosyst. Environ. 2017, 246, 221–233. [Google Scholar] [CrossRef]
  33. Cumming, G.S.; Buerkert, A.; Hoffmann, E.M.; Schiecht, E.; von Cramon-Taubadel, S.; Tscharntke, T. Implications of agricultural transitions and urbanization for ecosystem services. Nature 2014, 515, 50–57. [Google Scholar] [CrossRef] [PubMed]
  34. Fang, C. New Structure and new trend of formation and development of urban agglomerations in China. Sci. Geogr. Sinica 2011, 31, 1025–1034. [Google Scholar]
  35. Li, Y.; Qian, Z. Human-environment interactions in China: Evidence of land-use change in Beijing-Tianjin-Hebei Metropolitan Region. Hum. Ecol. Rev. 2013, 20, 26–35. [Google Scholar]
  36. Potter, C.S.; Randerson, J.T.; Field, C.B.; Matson, P.A.; Mooney, H.A.; Klooster, S.A. Terrestrial ecosystem production: A process model based on global satellite and surface data. Global. Biogeochem. Cy. 1993, 7, 811–841. [Google Scholar] [CrossRef]
  37. Yang, G.; Ge, Y.; Xue, H.; Yang, W.; Shi, Y.; Peng, C.; Du, Y.; Fan, X.; Ren, Y.; Chang, J. Using ecosystem service bundles to detect trade-offs and synergies across urban–rural complexes. Landsc. Urban Plan. 2015, 136, 110–121. [Google Scholar] [CrossRef]
  38. Li, J. Ecological Value Theory; Island Press: Chongqing, China, 1999. [Google Scholar]
  39. Wischmeier, W.H.; Smith, D.D. Predicting Rainfall Erosion Losses-A Guide to Conservation, Agricultural Handbook; Island Press: Washington, DC, USA, 1978. [Google Scholar]
  40. Zhao, T.; Ouyang, Z.; Zheng, H.; Wang, X.; Hong, M. Forest ecosystem services and their valuation in China. J. Nat. Resour. 2004, 19, 480–491. [Google Scholar]
  41. Williams, J.R. The erosion-productivity impact calculator (EPIC) model: A case history. Philos. Trans. R. Soc. B 1990, 329, 421–428. [Google Scholar] [CrossRef]
  42. Mccool, D.K.; Foster, G.R.; Mutchler, C.K.; Meyer, L.D. Revised Slope Length Factor for the Universal Soil Loss Equation. Trans. ASAE 1989, 32, 1571–1576. [Google Scholar] [CrossRef]
  43. Liu, B.; Nearing, M.; Shi, P.; Jia, Z. Slope Length Effects on Soil Loss for Steep Slopes. Soil Sci. Soc. Am. J. 2000, 64, 1759–1763. [Google Scholar] [CrossRef]
  44. Cai, C.; Ding, S.; Shi, Z.; Huang, L.; Zhang, G. Study of applying USLE and geographical information system IDRISI to predict soil erosion in small watershed. J. Soil Water Conserv. 2000, 14, 19–24. [Google Scholar]
  45. Kumar, A.; Devi, M.; Deshmukh, B. Integrated remote sensing and geographic information system based RUSLE modelling for estimation of soil loss in Western Himalaya, India. Water Resour. Manag. 2014, 28, 3307–3317. [Google Scholar] [CrossRef]
  46. Eigenbrod, F.; Bell, V.A.; Davies, H.N.; Heinemeyer, A.; Armsworth, P.R.; Gaston, K.J. The impact of projected increases in urbanization on ecosystem services. Proc Biol Sci 2011, 278, 3201–3208. [Google Scholar] [CrossRef] [PubMed] [Green Version]
  47. Wang, J.; Zhang, T.; Fu, B. A measure of spatial stratified heterogeneity. Ecol. Indic. 2016, 67, 250–256. [Google Scholar] [CrossRef] [Green Version]
  48. Wang, J.; Li, X.; Christakos, G.; Liao, Y.; Zhang, T.; Gu, X.; Zheng, X. Geographical Detectors-based health risk assessment and its application in the Neural Tube Defects study of the Heshun Region, China. Int. J. Geogr. Inf. Sci. 2010, 24, 107–127. [Google Scholar] [CrossRef]
  49. Wu, R.; Zhang, J.; Bao, Y.; Zhang, F. Geographical detector model for influencing factors of industrial sector carbon dioxide emissions in Inner Mongolia, China. Sustainability 2016, 8, 149. [Google Scholar] [CrossRef]
  50. Alberti, M. The effects of urban patterns on ecosystem function. Int. Reg. Sci. Rev. 2005, 28, 168. [Google Scholar] [CrossRef]
  51. Zhang, Y.; Zhao, L.; Liu, J.; Liu, Y.; Li, C. The Impact of Land Cover Change on Ecosystem Service Values in Urban Agglomerations along the Coast of the Bohai Rim, China. Sustainability 2015, 7, 10365–10387. [Google Scholar] [CrossRef] [Green Version]
  52. Alberi, M.; Marzluff, J.; Shulenberger, E.; Bradley, G.; Ryan, C.; Zumbrunnen, C. Integrating humans into ecology: Opportunities and challenges for studying urban ecosystems. Bioscience 2003, 12, 1169–1179. [Google Scholar] [CrossRef]
  53. Paul, M.J.; Meyer, J.L. Streams in the urban landscape. Annu. Rev. Ecol. Syst. 2001, 32, 333–365. [Google Scholar] [CrossRef]
  54. Arnold, C.L.; Gibbons, C.J. Impervious surface coverage: Emergence of a key environmental indicator. J. Am. Plan. Assoc. 1996, 62, 243–258. [Google Scholar] [CrossRef]
  55. Carlson, T.N.; Ripley, D.A. On the relation between NDVI, fractional vegetation cover, and Leaf area index. Remote Sens. Environ. 1997, 62, 241–252. [Google Scholar] [CrossRef]
  56. Li, Z.; Sun, R.; Zhang, J.; Zhang, C. Temporal-spatial analysis of vegetation coverage dynamics in Beijing-Tianjin-Hebei metropolitan regions. Acta Ecol. Sin. 2017, 37, 7418–7426. [Google Scholar]
  57. Wu, J.; Zhao, L.; Zheng, Y.; Lu, A. Regional differences in the relationship between climatic factors, vegetation, land surface conditions, and dust weather in China’s Beijing-Tianjin Sand Source Region. Nat. Hazards 2012, 62, 31–44. [Google Scholar] [CrossRef]
  58. Wu, Z.; Wu, J.; Liu, J.; He, B.; Lei, T.; Wang, Q. Increasing terrestrial vegetation activity of ecological restoration program in the Beijing–Tianjin Sand Source Region of China. Ecol. Eng. 2013, 52, 37–50. [Google Scholar] [CrossRef]
  59. Jiang, C.; Nath, R.; Labovskii, L.; Wang, D. Integrating ecosystem services into effectiveness assessment of ecological restoration program in northern China's arid areas: Insights from the Beijing-Tianjin Sandstorm Source Region. Land Use Policy 2018, 75, 201–214. [Google Scholar] [CrossRef]
  60. Zhang, L.; Gong, L.; Zhang, Y. A review of ecosystem services: A biometric analysis based on web of science. Acta Ecol. Sin. 2016, 36, 5967–5977. [Google Scholar]
  61. Zhong, T.; Mitchell, B.; Scott, S.; Huang, X.; Li, Y.; Lu, X. Growing Centralization in China’s Farmland Protection Policy in Response to Policy Failure and Related Upward-extending Unwillingness to Protect Farmland Since 1978. Environ. Plan. C 2017, 35, 1075–1097. [Google Scholar] [CrossRef]
  62. Liu, J.; Dietz, T.; Carpenter, S.R.; Alberti, M.; Folke, C.; Moran, E.; Pell, A.N.; Deadman, P.; Kratz, T.; Lubchenco, J.; et al. Complexity of coupled human and natural systems. Science 2007, 317, 1513–1516. [Google Scholar] [CrossRef] [PubMed]
  63. Quintas-Soriano, C.; Castro, A.J.; García-Llorente, M.; Cabello, J.; Castro, H. From supply to social demand: A landscape-scale analysis of the water regulation service. Landsc. Ecol. 2014, 29, 1069–1082. [Google Scholar] [CrossRef]
  64. Raudsepp-Hearne, C.; Peterson, G.D.; Bennett, E.M. Ecosystem services bundles for analyzing tradeoffs in diver landscapes. Proc. Natl. Acad. Sci. USA 2010, 107, 5242–5247. [Google Scholar] [CrossRef] [PubMed]
Figure 1. Study area comprising the province-level administrations of Beijing, Tianjin, and Hebei.
Sustainability 10 04334 g001
Figure 2. Spatial distribution of factors influencing ecosystem services (1 km × 1 km): (a) elevation; (b) slope; (c) normalized difference vegetation index (NDVI); (d) distance to the nearest river (DNRi); (e) distance to the nearest road (DNRo); (f) distance to district center (DDC); (g) population density (PD); (h) urbanization rate (UR).
Sustainability 10 04334 g002
Figure 3. Spatial distribution of ecosystem services in 2000 (ad) and 2010 (eh): (a,e) net primary productivity (NPP); (b,f) crop production (CRO); (c,g) water retention (WAT); (d,h) soil conservation (SOI).
Sustainability 10 04334 g003
Figure 4. Spatial distribution of the multifunctional ecosystem services in 2000 (a), 2010 (b), and 2000–2010 (c).
Sustainability 10 04334 g004
Figure 5. Area of each ecosystem service type in land-use and land-cover types in 2000 (left) and 2010 (right).
Sustainability 10 04334 g005
Table 1. Datasets used in the study. NDVI—normalized difference vegetation index; NASA—National Aeronautics and Space Administration; USGS—United States Geological Survey; DEM—digital elevation model; NIMA—National Imagery and Mapping Agency.
DatasetData DeclarationTimeData Sources
Land use/land coverRaster; 30 m2000, 2010National Geomatics Center of China (http://www.globallandcover.com/GLC30Download/index.aspx)
NDVIRaster; 250 m2000, 2010NASA and USGS
(http://e4ftl01.cr.usgs.gov/MOLT/MOD13Q1.006/)
DEMRaster; 90 m2009NASA and NIMA (http://e0mss21u.ecs.nasa.gov/srtm/)
Precipitation and temperature dataText;1956–2010China Meteorological Data Sharing Service System
(http://www.escience.gov.cn/metdata/page/index.html)
Soil dataVector;
1:1,000,000
2009Harmonized World Soil Database
(http://www.fao.org/soils-portal/soil-survey/soil-maps-and-databases/harmonied-world-soil-datebse-v12/en/)
Administrative mapVector;
1:4,000,000
2010National Geomatics Center of China
Crop yieldStatistics2000, 2010Statistical Yearbook
Table 2. Methods and processes of ecosystem service assessments. NPP—net primary productivity; CRO—crop production; WAT—water retention; SOI—soil conservation.
CategorySub-CategoryModels or PrincipleAssessment Process
Supporting servicesNPPCASA (Carnegie Ames Stanford Approach) N P P = A P A R × ξ
N P P = net primary productivity (gC/m2), A P A R = absorbed
photosynthetic active radiation (MJ/m), ξ = the utilization
rate of light energy (gC/MJ).
Provisioning servicesCROAnnual crop yieldCrop production was calculated by dividing the crop yield of each county by its territory to illustrate per-unit provision service.
Regulating servicesWATWater storage of forest ecosystems method as the proxy of water-retention service W C = i = 1 n A i × P i × K i × R i
A i = forest area, P i = annual precipitation, K i = the proportion of run-off of the total rainfall (0.4 according to a previous study) [40], R i = the coefficient of forest ecosystems to reduce run-off compared with bare land, ranging from 0.21 to 0.39 across different forest types.
SOIUSLE (universal soil loss equation) Δ A = R × K × L × S ( 1 C × P )
Δ A = soil conservation (t/(hm2·a)), R = rainfall erosivity index (MJ·mm/(hm2·h·a)), K = soil erodibility factor (t·hm2·h/ (MJ·mm·hm2)), L S = slope length and steepness factor (unitless), C = cover and management factor (unitless), P = conservation practice factor (unitless). The parameters R were from Wischmeier and Smith [40], K from Williams [41], L S from McCool et al. [42] and Liu et al. [43], C from Cai et al. [44], and P from Kumar et al. [45].
Table 3. The average value of ecosystem services in 2000 and 2010.
NPP (gC/m2)CRO (t/km2)WAT(m3/km2SOI (t/km2)
20002010200020102000201020002010
Mean522.18 280.31 143.08 176.36 118.00 116.65 294.80 231.48
Table 4. Factor-detected results of potential determinants of ecosystem services (ESs). NDVI—normalized difference vegetation index; DNRi—distance to nearest river; DNRo—distance to nearest road; DDC—distance to district center; PD—population density; UR—urbanization rate.
2000NPPCROWATSOI
pQpQpQpQ
Elevation0.21050.0000 0.4437 0.0000 0.3671 0.0000 0.0330 0.0000
Slope0.26230.0000 0.2910 0.0000 0.6240 0.0000 0.0594 0.0000
NDVI0.24630.0000 0.0634 0.0000 0.1426 0.0000 0.0037 0.0000
DNRi0.02220.0000 0.0291 0.0000 0.0247 0.0000 0.0011 0.3945
DNRo0.03030.0000 0.0355 0.0000 0.0110 0.0000 0.0042 0.0000
DDC0.12760.0000 0.1887 0.0000 0.1817 0.0000 0.0199 0.0000
PD0.19940.0000 0.6720 0.0000 0.1793 0.0000 0.0368 0.0000
UR0.08450.0000 0.0885 0.0000 0.0090 0.0000 0.0048 0.0000
2010NPPCROWATSOI
pQpQpQpQ
Elevation0.4035 0.0000 0.4695 0.0000 0.3730 0.0000 0.1174 0.0000
Slope0.3917 0.0000 0.3152 0.0000 0.6153 0.0000 0.1467 0.0000
NDVI0.1503 0.0000 0.0358 0.0000 0.1344 0.0000 0.0232 0.0000
DNRi0.0348 0.0000 0.0367 0.0000 0.0244 0.0000 0.0114 0.0000
DNRo0.0540 0.0000 0.0401 0.0000 0.0145 0.0000 0.0161 0.0000
DDC0.2391 0.0000 0.1943 0.0000 0.1820 0.0000 0.0409 0.0000
PD0.2175 0.0000 0.6609 0.0000 0.1810 0.0000 0.0615 0.0000
UR0.0564 0.0000 0.0637 0.0000 0.0183 0.0000 0.0162 0.0000
Table 5. Interactions (measured by PD,H value) between pairs of factors on the ESs (p > 0.5).
2000Interaction FactorsCriterionConclusionInterpretation
NPPSlope ∩ NDVI 0.5026 > 0.4457C > A + B Sustainability 10 04334 i001
CROPD ∩ Elevation0.6997 < 1.1157A, B < C < A + B↑↑
PD ∩ Slope 0.6973 < 0.9630A, B < C < A + B↑↑
PD ∩ NDVI0.7007 < 0.7354A, B < C < A + B↑↑
PD ∩ UR0.8342 > 0.7605C > A + B Sustainability 10 04334 i001
PD ∩ DNRi0.6811 < 0.7011A, B < C < A + B↑↑
PD ∩ DNRo0.6804 < 1.4086A, B < C < A + B↑↑
PD ∩ DDC0.6802 < 0.8607A, B < C < A + B↑↑
WAT Slope ∩ Elevation 0.6635 < 0.9912A, B < C < A + B↑↑
Slope ∩ NDVI0.7161 < 0.7667A, B < C < A + B↑↑
Slope ∩ PD 0.6421 < 0.8043A, B < C < A + B↑↑
Slope ∩ UR0.6466 > 0.6331C > A + B Sustainability 10 04334 i001
Slope ∩ DNRi0.6280 < 0.6488A, B < C < A + B↑↑
Slope ∩ DNRo0.6326 < 0.6351A, B < C < A + B↑↑
Slope ∩ DDC0.6360 < 0.8058A, B < C < A + B↑↑
2010Interaction FactorCriterionComparisonInteraction
NPPElevation ∩ NDVI 0.5826 > 0.5538C > A + B Sustainability 10 04334 i001
CROPD ∩ Elevation0.7262 < 1.2612A, B < C < A + B↑↑
PD ∩ Slope0.7243 < 1.0669A, B < C < A + B↑↑
PD ∩ NDVI0.7289 > 0.7153C > A + B Sustainability 10 04334 i001
PD ∩ UR0.8467 > 0.7103C > A + B Sustainability 10 04334 i001
PD ∩ DNRi0.6944 < 0.7400A, B < C < A + B↑↑
PD ∩ DNRo0.6974 < 0.7451A, B < C < A + B↑↑
PD ∩ DDC0.7014 < 0.9333A, B < C < A + B↑↑
WATSlope ∩ Elevation 0.6565 < 0.9883A, B < C < A + B↑↑
Slope ∩ NDVI0.6743 < 0.7497A, B < C < A + B↑↑
Slope ∩ PD 0.6282 < 0.7963A, B < C < A + B↑↑
Slope ∩ UR0.6580 > 0.6336C > A + B Sustainability 10 04334 i001
Slope ∩ DNRi0.6190 < 0.6397A, B < C < A + B↑↑
Slope ∩ DNRo0.6234 < 0.6298A, B < C < A + B↑↑
Slope ∩ DDC0.6275 < 0.7973A, B < C < A + B↑↑
Notes: A denotes P (D1), B denotes P (D2), and C denotes P (D1 ∩ D2) (see Section 2.3.3). “ Sustainability 10 04334 i001” denotes nonlinear enhancement of A and B when C > A + B; “↑↑” denotes A and B enhancement of each other when C > A, B.

