1. Introduction
Road network related assets, such as roads, bridges, and tunnels, are critical infrastructure components that support the economic activities of the surrounding population. If disasters or unexpected situations occur that impact the performance of these networks, there is a high probability that the disruption will diffuse into the surrounding area and can result in the paralysis of the larger network due to the resulting chaos. Because road networks play a pivotal role in evacuation, relief, and rescue efforts over both the short and long term in real disaster situations, it is essential that a disaster prevention plan be developed ahead of time and that the road maintenance be performed regularly to ensure the network will function optimally in times of great need.
In many developed countries, including the U.S. and Japan, national and local governments collaborate to establish infrastructure related disaster prevention and restoration plans, to designate certain major roads for both emergency evacuation and transportation, and to train and prepare personnel on how best to respond in order to minimize the damage from disasters [
1,
2].
Increases in the amount of unusual weather due to global warming raises the likelihood of various unexpected situations. The Department for Transport in the UK [
3] conducted a study predicting the probability of performance reduction in the traffic sector due to various unexpected situations and the Department of Transport in the U.S. [
1] classified the absorption and restoration processes of the traffic system in the event of disasters into several stages, including preparation, impact, response, and restoration, and presented strategies to improve the resilience before and after a disaster event. In both cases, the importance of addressing the risk of disasters in order to minimize their effects and overcome unexpected situations was emphasized.
The term resilience, which has a long history, with roots in ecology, engineering and psychology, has also been defined in different ways [
4]. Within mathematics, physics and engineering, it is often described as the capacity of an ecosystem to “bounce-back” or return to a steady-state equilibrium [
4]. The definition of resilience is very diverse in each field, and the engineering resilience therefore focuses on maintaining efficiency of function, constancy of the system, and a predictable world near a single steady state [
5]. In other words, it could be defined as the “ability of a system to recover system function by overcoming instability caused by internal or external impact due to occurrence of an event or the like”. Bruneau et al. [
6] defined the resilience of a community to an earthquake and presented a method for quantitatively measuring the same. Rose [
7] studied the differences between static and dynamic resilience, compared the changes in the performance of the network during a disaster from an economic perspective, and provided a method for quantifying the resilience.
Many studies are also actively underway on disaster control and the measurement and evaluation of the resilience of infrastructure. In Japan and the U.S., where disasters frequently occur, various studies on disaster/accident control, evacuation, and emergency evacuation road selection have been conducted in order to prevent accidents from typhoons, floods, earthquakes, and terrorism. Many of these studies employed traffic simulation software to better evaluate traffic patterns and load during primarily evacuation events. There have also been studies to investigate disaster prevention measures for evacuation plans and to develop methods to reduce the evacuation time from disaster-stricken areas [
8,
9]. The studies that evaluated evacuation strategy methods tested lane-based routing [
10,
11] and contraflow [
12] techniques. Cova et al. [
10] surmised that most traffic jams in evacuation areas occur at crossroads and therefore conducted a study that applied the lane-based routing method to the estimation of the best path through a crossroads for quick evacuation. Zhang et al. [
13] examined changes in the performance of a road network in large scale areas based on the movement path of a hurricane in the Gulf Coast. That study employed the TRANSIMS (TRansportation ANalysis SIMulation System) simulation package and found that an evacuation strategy that used a reverse direction lane increased the total system efficiency. They also conducted a study on the effects of this strategy in an emergency evacuation situation.
Previous studies have focused on resilience assessment for lifelines such as road networks using flow diagrams and complex network theory [
14,
15,
16]. Aydin et al. [
14] studied the recovery behavior of road networks and simplified the evaluation process using rural transportation networks. Ganin et al. [
15] focused on multi-level directed acyclic graphs and interdependent networks, and demonstrated how network parameters can be traded off to obtain desired levels of resilience and other performance parameters. McDaniels et al. [
16] showed that both the speed of recovery and the impact resistance can be improved by appropriate organizational responses. Many studies to date have evaluated the resilience based on various related indicators (urban resilience and vulnerability) [
17,
18,
19]. For example, the vulnerability of a road network can be measured based on an accessibility sensitivity indicator according to the changes in the total travel time or traffic network state due to the closure of a specific road [
18,
19]. Studies have also been conducted to evaluate the resilience of cities in terms of their architecture [
17].
In the U.S. and New Zealand, an infrastructure asset management (IAM) concept was adopted that includes the life cycle cost analysis (LCCA) method for long-term infrastructure performance management and control [
20,
21]. The definition of an asset management system should include existing engineering concepts and accounting asset concepts to ensure the appropriate control and oversight of roads to maximize their level of service (LOS). In addition, such a system should include the requirement for suitable budgets to ensure the optimal repair and maintenance of roads as well as a plan to establish and operate long-term assets. This is the current approach in the U.S., U.K., and Australia [
21,
22,
23].
The ISO-55000 series details information related to international standards and procedures regarding infrastructure asset management in developed countries [
20]. In addition, the International Infrastructure Management Manual (IIMM), which covers infrastructure asset management, has been widely distributed [
23].
Construction of an asset management system first requires the value of the assets to be assessed. This requires an asset value to be assigned via engineering, accounting, and social methods. In general, asset values are essential for maintenance processes, proper costing, and financial management, and can used in calculating the capitalization ratio and as an indicator to properly represent the asset in infrastructure management plans. By creating an accurate database as part of the asset management system that contains continuously and accurately assessed values, it becomes possible to ensure an appropriate level of infrastructure service and performance. Furthermore, accurate asset values are very important for efficient prioritization and decision making in a limited budget.
In terms of studies that investigated the asset value of infrastructure, Falls et al. [
24] conducted a comparative analysis of various infrastructure asset assessment methods and performed a value assessment of a road pavement path via a Monte Carlo simulation. Do et al. [
21] examined an asset value assessment methodology for domestic and international infrastructure and reassessed the road asset value based on straight line and alternative depreciation methods, which included consumption-based and state-based depreciation methods. By using the alternative depreciation methods and evaluating the advantages and disadvantages of each, they developed a method of assessing the value of road assets.
Most previous disaster control studies focused on the evacuation of pedestrians and vehicles post-disaster as well as the selection of optimal evacuation roads (i.e., links). Other studies evaluated the quantitative resilience by considering algorithms for targeting city areas via geographic information system (GIS) methodologies. Most previous studies on the assessment of the asset value of infrastructure, such as road pavement and bridges, primarily focused on assessment methods and the improvement of the same.
To the best of our knowledge, there have been very few studies involving quantitative evaluations that have considered both the performance loss and asset value of road networks when natural disasters occur at the regional scale. We attempt to suggest a method to determine the critical path that needs to be prioritized for maintenance in consideration of the performance loss and asset value using cluster analysis. We consider the hazard resilience speed, i.e., the speed of recovery of existing performance, according to the damage recovery scenario of the targeted road network. We herein advance the notion that a resilience framework might provide insights into dealing with new types of performance and asset values of road networks.
The next section of this paper explains the methodology. It describes how to assess the performance (or performance loss) and asset value of a road network.
Section 3 applies this framework to a case study of disaster mitigation in Sejong city, which relies on traffic simulation. The road network resilience and maintenance priority are explored in greater detail in
Section 3, while
Section 4 discusses the critical path and marginal utility from an economic perspective.
Section 5 provides a general summary of this study. Some issues for future research are also discussed.
2. Methodology
In this study, we analyze road network resilience by comparing the difference between the usual level of performance and the reduced level of performance due to natural disaster. One of the important notions advanced in this study is that the asset value of infrastructure enables a road manager to determine maintenance priority and critical paths using an economic perspective.
2.1. Performance Loss of the Road Network
Infrastructure, including roads, railways, harbors, dams, airports, etc., whether in operation or under construction are assets that require large scale investment to construct and maintain over the long-term. When the performance of such infrastructure degrades, drivers and users tend to migrate to other routes. We focus on resilience as the ability of specific infrastructure systems at the regional scale to absorb the shocks of earthquakes. The occurrence of a disaster such as an earthquake leads to a rapid decrease in performance. In the case of a road network, performance might refer to the number of drivers using the road within a certain period of time.
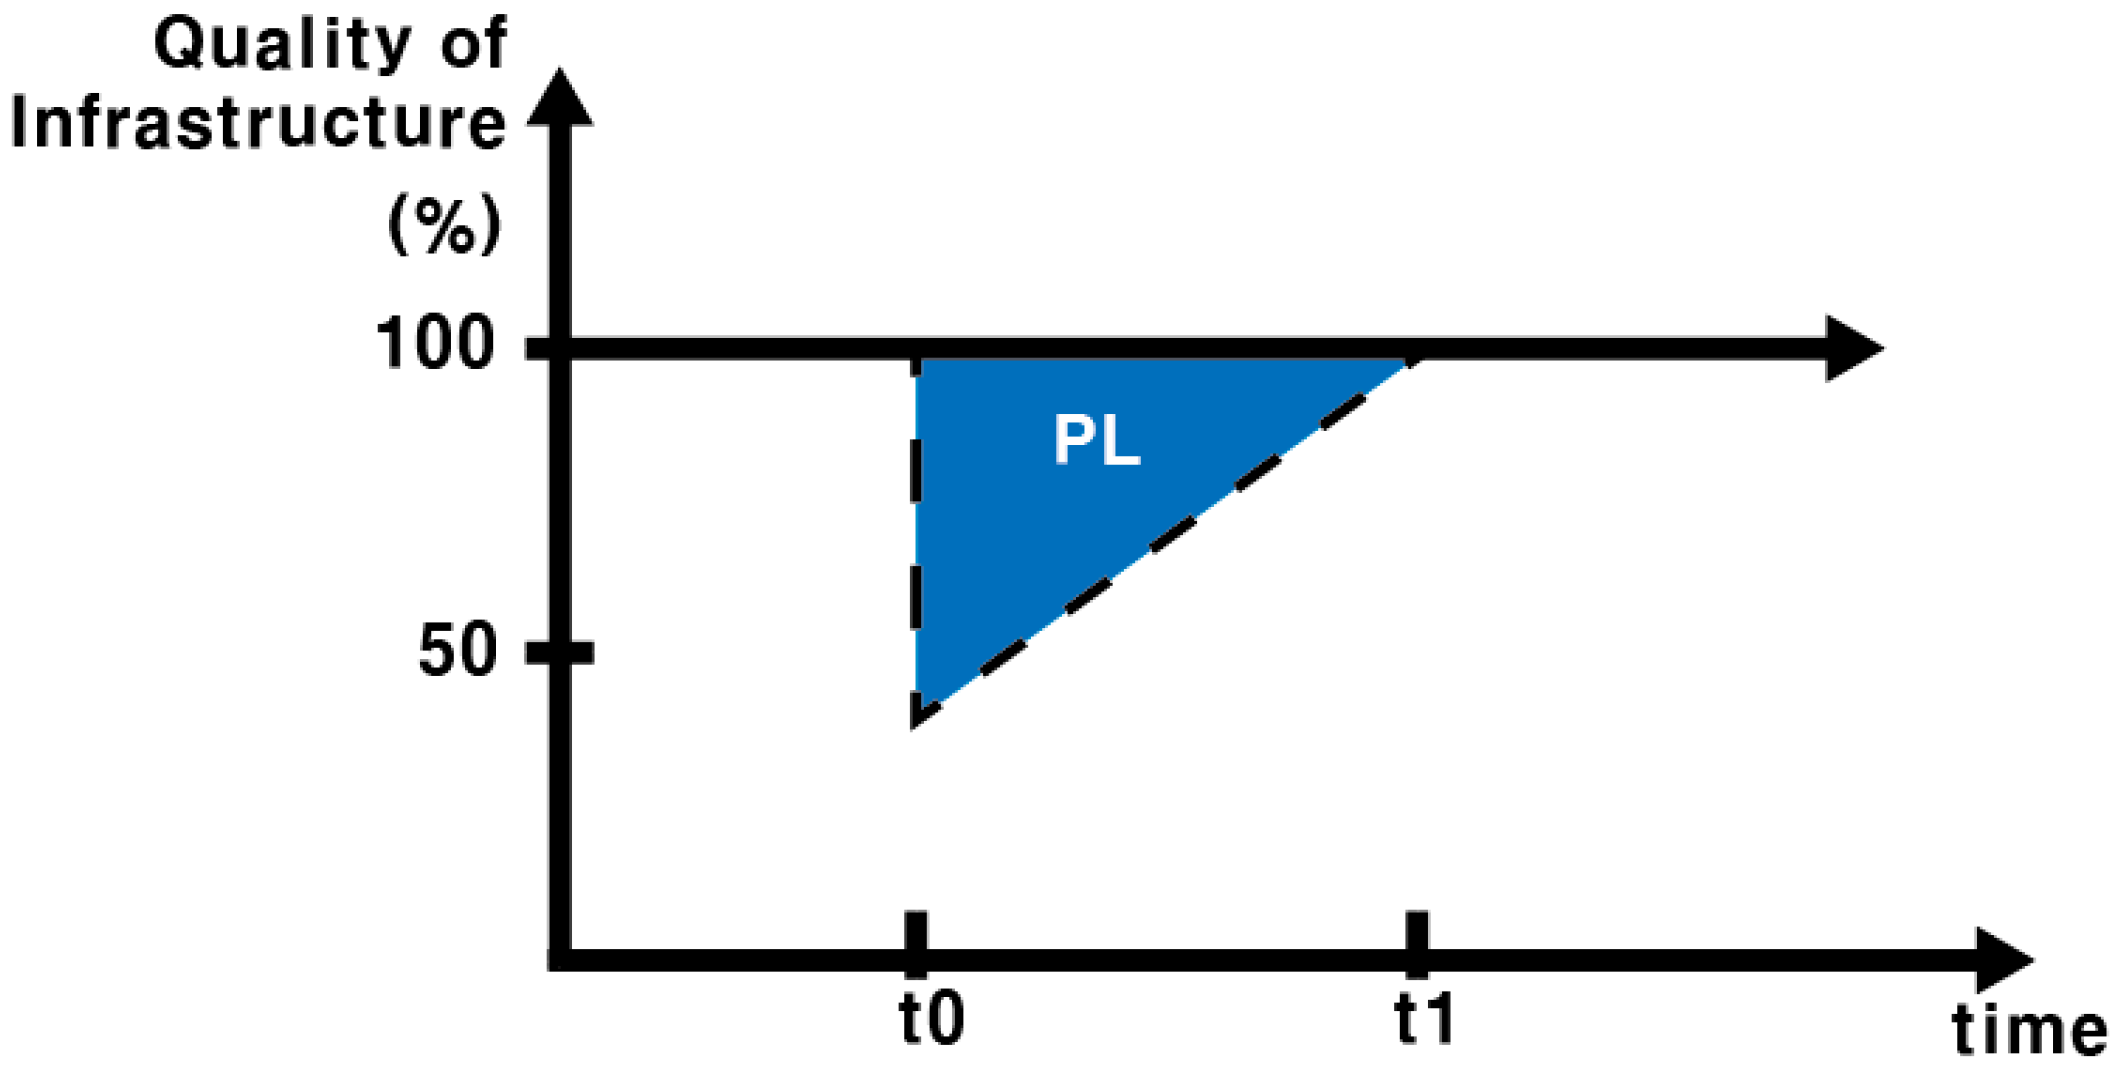
Although there are various definitions of resilience in the literature, in the current study, this term is defined as the time to restore a road to its original state after damage or a disaster has occurred. From the traffic system, X axis in
Figure 1 shows flow of time and Y axis shows traffic system performance or quality of road infrastructure. PL (Performance Loss) can be quality loss of road network occurred by damages due to disaster. For roads that have a larger performance loss, as indicated by the triangle in
Figure 1, larger damages are predicted in the event of a disaster. For this reason, it is important to conduct the necessary maintenance. The quantitative PL can be calculated using Equation (1).
where,
ti represents the time and
Q(
t) represents the performance of the road network.
Therefore, performance loss can be obtained by integrating the difference between the usual level of performance (which is set as 100) and the reduced level of performance.
2.2. Asset Value of Infrastructure
In this study, the road asset value was evaluated based on the written down replacement cost methodology after depreciation as defined in the tangible assets and infrastructure accounting guidelines of the Ministry of Strategy and Finance (MOSF) [
26].
There are three methods of evaluating land asset value: (1) using the officially assessed reference land price and the officially assessed individual land price as the reassessment amount, if such a price based on the reassessment base date exists; (2) evaluating the value by applying the standard land price index table to the forces influencing the price provided by the Ministry of Land, Infrastructure, and Transport (MOLIT), as well as the officially assessed reference land price posted by the MOLIT according to the Act on the Public Announcement of Values and Appraisal of Real Estate; (3) evaluating the arithmetic mean of the officially assessed individual land price of the relevant land category or similar land category in the City, County, and District in which the land is located in Korea. In this study, the land asset value of the road section was based on the officially assessed land price in 2016 by the MOLIT [
27]. According to the MOLIT [
28], this land is classified based on its road length (area) by region. Thus, the asset value of each road section was evaluated based on this classification.
The MOLIT [
29] specified that the price multiple method can be applied in a discretionary manner to ensure the case acquisition cost can be reliably measured. However, the current study applied the construction cost index to the general national highway construction unit price (work type) as specified in the road work manual of the MOLIT [
30] because there are difficulties in acquiring the necessary cost data for each section of road pavement, bridge, and tunnel. Because the unit price of road pavement in terms of construction on the general national highway is part of civil engineering and other work and is similar to the tunnel in case of the underground road in Sejong city, it was defined as the unit construction price of the tunnel. For general national highway construction unit price (work type), a work type unit price was applied (based on 2016) by reflecting the construction cost index from the unit price upon the national highway construction by the MOLIT [
30] (
Table 1). Prior to evaluating the asset value of structures (i.e., road pavement, bridges, underground roads, etc.), road pavement was classified as depreciation alternative infrastructure, and thus did not require separate depreciation.
Likewise, the road pavement was considered to be depreciation-alternative infrastructure and therefore did not require separate depreciation [
21]. Thus, the bridges and underground roads were depreciated without considering the road pavement. In terms of the road pavement, its asset value was evaluated based on the calculated unit re-procurement cost and area, except that bridges and tunnels was excluded. In other words, the asset value of the pavement was calculated by multiplying the area of the road section with the construction cost.
Thus, only bridges and underground roads were depreciated and road pavement was not. In case of road pavement, an asset value was determined using the results of a unit re-procurement cost evaluation and area, excluding bridges and tunnels. Depreciation for bridges and underground roads was as per the straight-line depreciation method. As for the remaining useful life of bridges and underground roads within general National Highway No. 1 in 2016, which was the base year used in the analysis, the asset value was evaluated as per the straight-line depreciation method in Equation (2) based on the construction year (CY) difference provided by the MOLIT [
31].
The bridges and underground roads were depreciated using the written down replacement cost method as per Equation (2).
2.3. Maintenance Priority and Marginal Utility
If roads exhibit a large performance loss, it indicates that that there is a significant reduction in performance, which results in detrimental effects on the total travel time of the road network. Since road infrastructure is an important state asset, the assessment of the asset value of such facilities can be a significant indicator to guide the continuous and systematic management of national assets.
A cluster analysis refers to the clustering of individual objects by measuring the similarity of each object. In our study, a cluster analysis was conducted using the Ward method, as hierarchical clustering method was utilized for clustering indexes of node and link. In Ward method, distance measure is like Equation (3).
where,
W is distance among the clusters,
is attribution on object
i in a cluster,
is average of objects in a cluster and
n is the number of objects in a cluster. Using cluster analysis, we try to classify into four clusters based on their respective characteristics in this study
From an economic perspective, when public agencies restore social infrastructure, they consume goods in the form of cost or time, and when they restore the performance of the network, this is termed utility. The total utility (TU) indicates the total utility volume that can be gained by inputting a certain amount of goods in a certain period of time. The relationship between the input quantity of goods (Q) and utility is provided in Equation (4), where the marginal utility (MU) refers to the increase in the utility due to the input of a single unit of goods. In other words, the marginal utility is the value obtained by dividing the change in the total utility by the change in the consumption of a good. When the total utility function is differentiated with the consumption (
Q), this produces the marginal utility, as shown in Equation (5).
where, TU is the total utility and Q represents the consumption of goods.
If the input amount of a good increases, the total utility increases but the marginal utility, i.e., the increase in the utility due to the addition of a single unit of goods, gradually decreases and approaches zero for a certain consumption level. In this case, the total utility reaches a maximum while the marginal utility becomes negative as the input continues to increase, at which time the total utility starts to decrease. As input amount of goods increases, the marginal utility gradually decreases. This is termed the law of diminishing marginal utility. Thus, after an accident or disaster occurs, it is important for public agencies to devising a means to minimize the reduction in the travel time in the network based on the invested cost under the limited social overhead capital (SOC) budget.
The current study analyzed the effects of restoring relatively important roads and assessed the impact on the network resilience over a certain period of time based on the actual size of the network and its function and capacity.
3. Road Network Resilience and Case Study
3.1. Performance and Performance Loss of Road Network
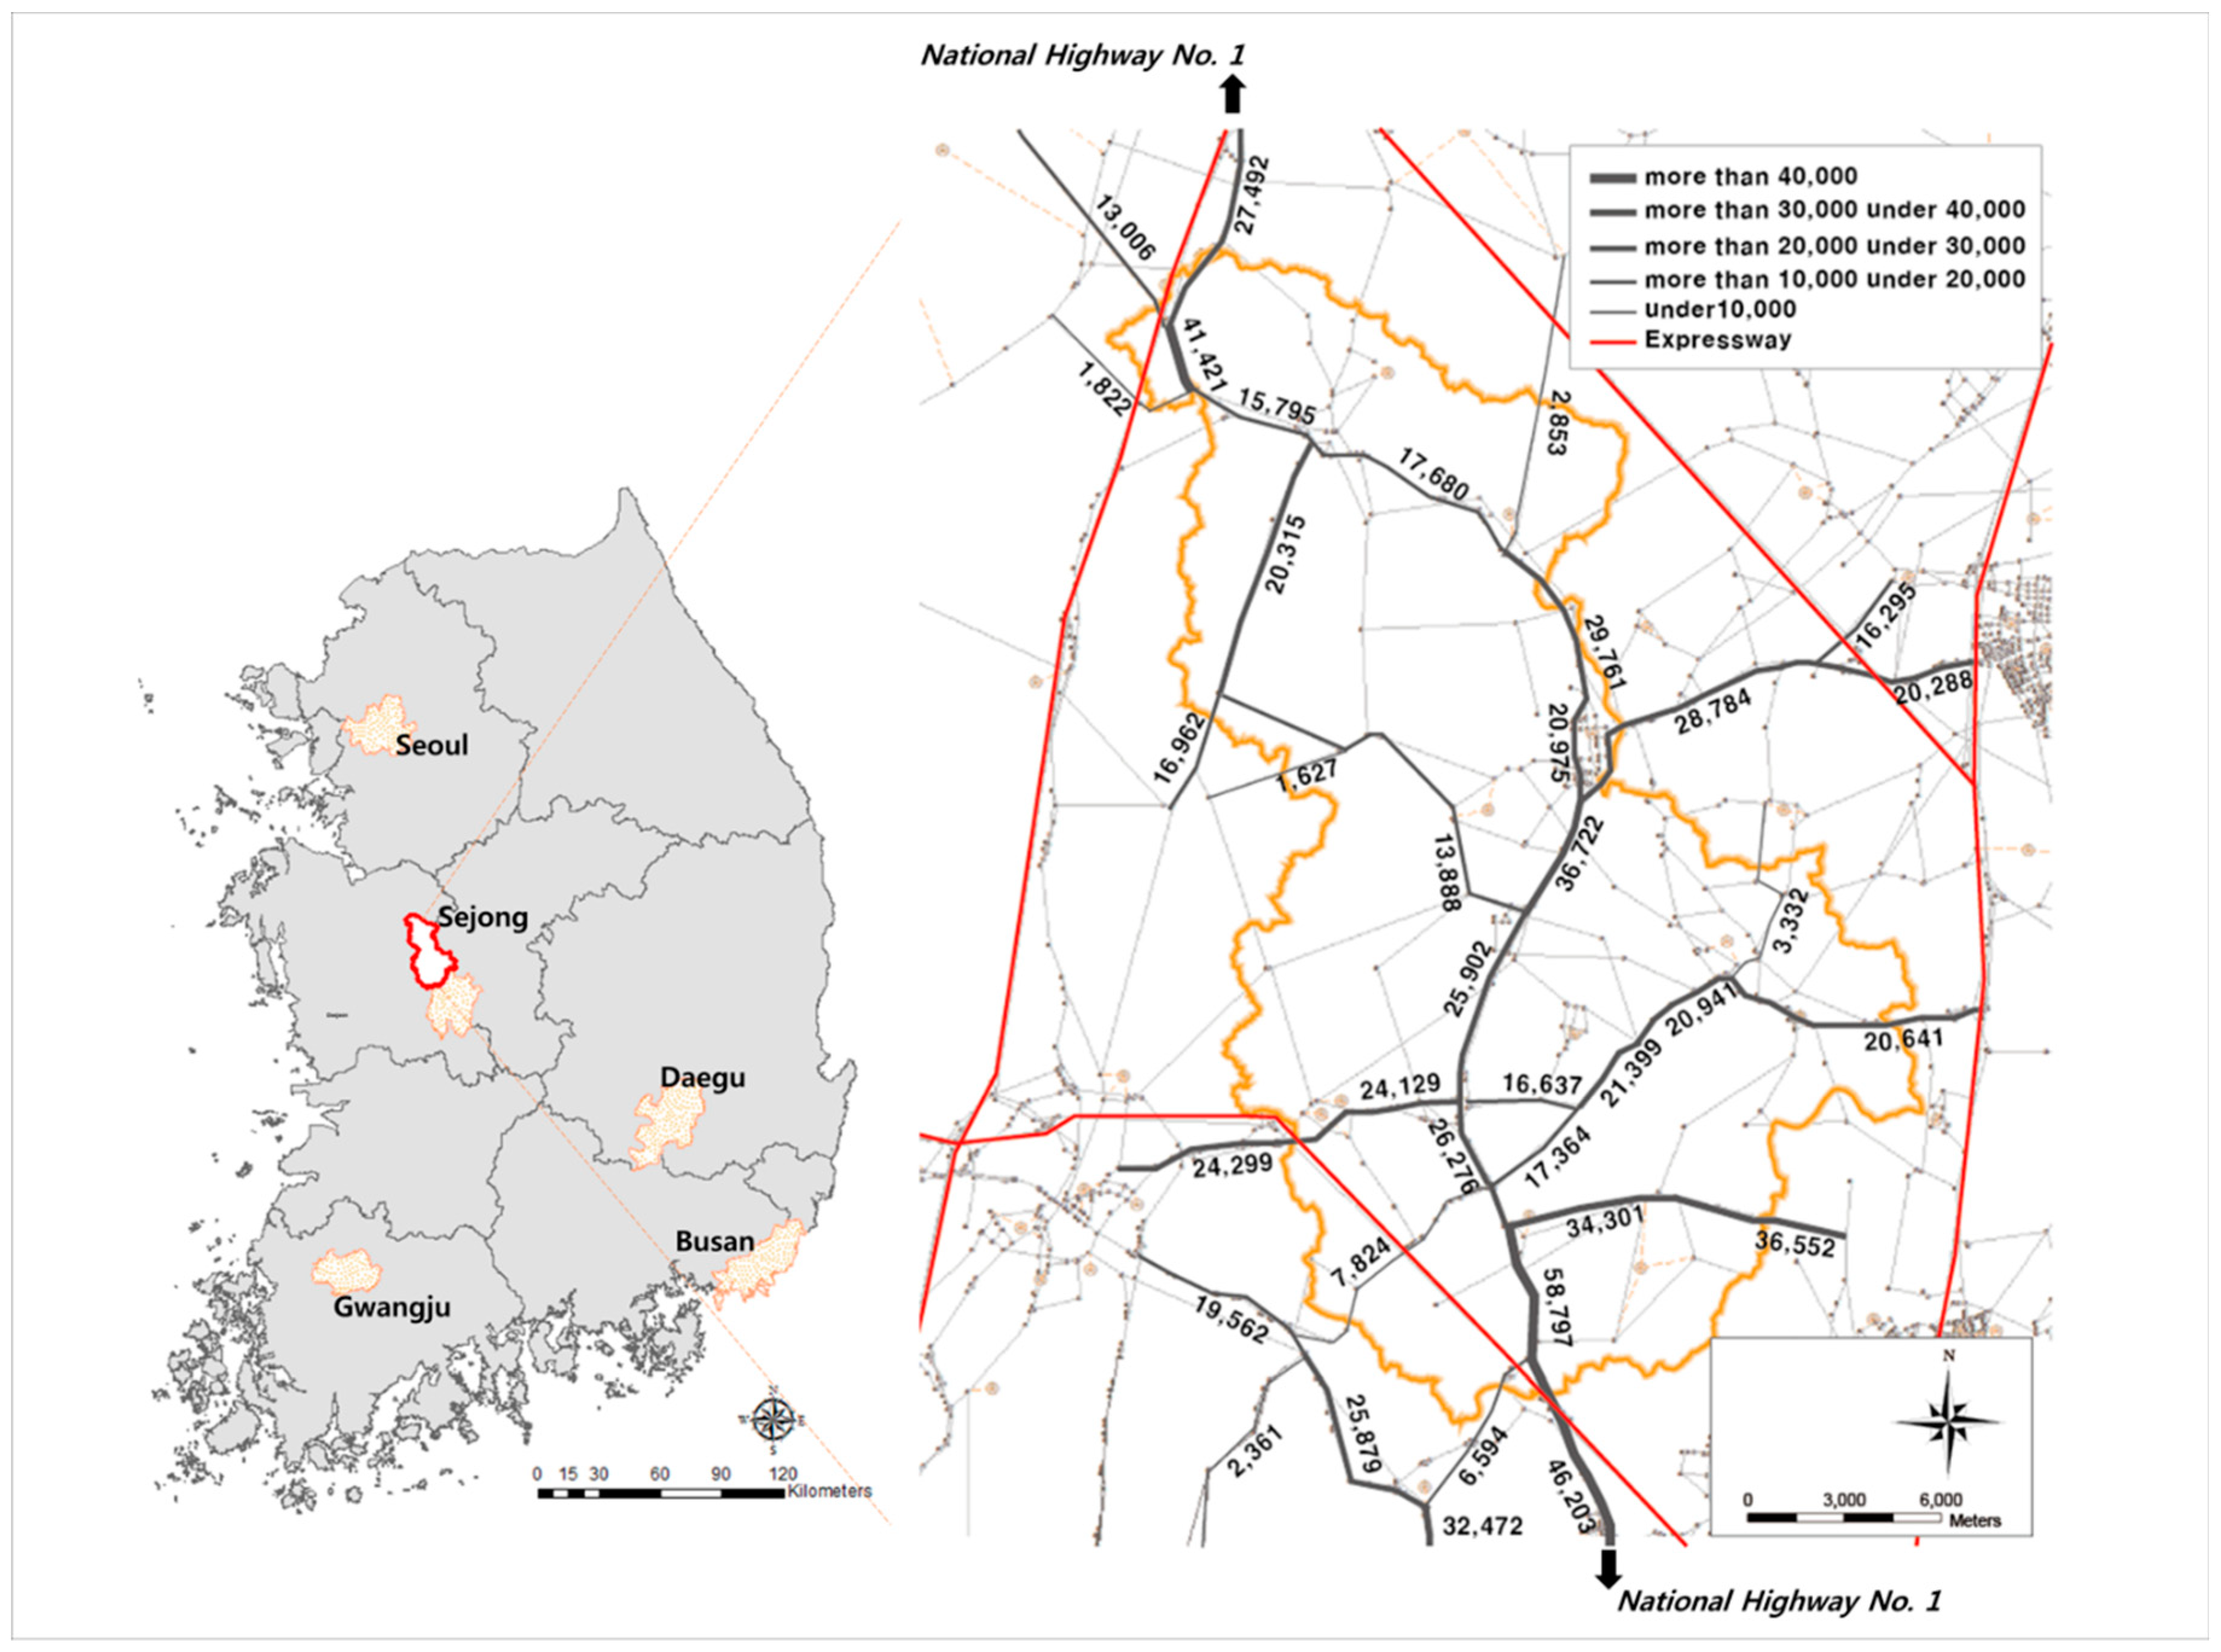
The focus of our study is Sejong city, which was chosen for balanced development by the government in July 2012, after which major central administrative agencies and research institutions were relocated to this city. National Highway No. 1 is the main route here. It constitutes the city’s main road and passes through the main zones within the urban area (
Figure 2). If a disaster were to occur to such a road network, it would be extremely challenging to evacuate the city and the consequence would be significant social losses, including the loss of life, and the stoppage of national work. Thus, it is essential to ascertain methods to minimize damage in the event of a disaster. In this study, a simulation analysis of the road network in Sejong city and the surrounding areas was conducted. Then, National Highway No. 1 was selected for an in-depth analysis in order to quantitatively calculate the resilience to loss and the asset value of the road network.
A simulation was conducted using the TransCAD 5.0 (Caliper Corporation, Newton, MA, USA) macro traffic simulation software program package to which a user equilibrium model-based multi-class assignment technique had been applied [
32]. The simulation evaluated the road network passing through Sejong city and the simulation environment was calibrated via a process that reflected the travel patterns on an actual road.
The analysis was conducted based on the Daejeon metropolitan city network and passenger trip O/D (Origin/Destination) data provided by the Korea transport database (KTDB) [
33]. In addition, satellite mapping and GIS data for the target area was collected. However, if the road network was not reflected in detail, the network in the target area was constructed via trial and error. The passenger trip origin and destination (O/D) is in the units of person-trips per day, while the units of the freight travel O/D are vehicles per day. This data was converted into passenger car units (PCUs) to reflect the occupancy and passenger car equivalents in order to apply the trip assignment model. The analysis was based on the peak O/D, which is expected to cause the biggest damage in a disaster situation.
Then, a homogeneous road section (link) was selected based on the calibrated road network. A homogeneous road section is a section that has similar traffic features in terms of the traffic flow, volume by section, and the same number of lanes throughout, in comparison with the surrounding development in terms of roads, traffic volume, signal crossroads, and road conditions. Sections were defined as homogeneous sections if there were no detours in the surrounding area [
34]. National Highway No. 1, which was the target path for in-depth analysis, was divided into 17 road sections (see Figure 6).
In terms of the types of disasters, it was assumed that there was an earthquake that resulted in traffic accidents and work zones. A tsunami was not considered as the likelihood is low due to the location and geography of the region. The simulation assumed a case in which the road network completely collapsed due to a very powerful earthquake, and another case where a weak earthquake damaged only one lane on the road network.
The focus of this paper is to calculate the quantitative performance loss and asset value due to changes in the performance of the road network in a disaster situation, specifically, an earthquake in the vicinity of Sejong city, Korea. Then, a method is presented to prioritize the roads (i.e., the critical paths) requiring maintenance while considering the performance loss and asset value. Finally, an analysis is conducted to investigate the effects of restoring high priority roads during a disaster.
If a road network completely collapses or is partially damaged due to a disaster, this impairs the mobility, accessibility, and other major functions of the road, which can prevent travel by road users. This causes users to migrate toward other non-damaged road networks, which results in increasing traffic volumes on those roads.
The quantitative resilience of the road network due to changes in the travel patterns was calculated as the damage to the road network was gradually restored. To accomplish this, an analysis was conducted on the calibrated road network using a micro simulation to reflect the traffic situation over time. Meanwhile, Torres-Vera and Canas [
35] conducted a vulnerability analysis on each of the pipelines in the urban area in four methods. Our study was analyzed road networks only among infrastructure in urban area.
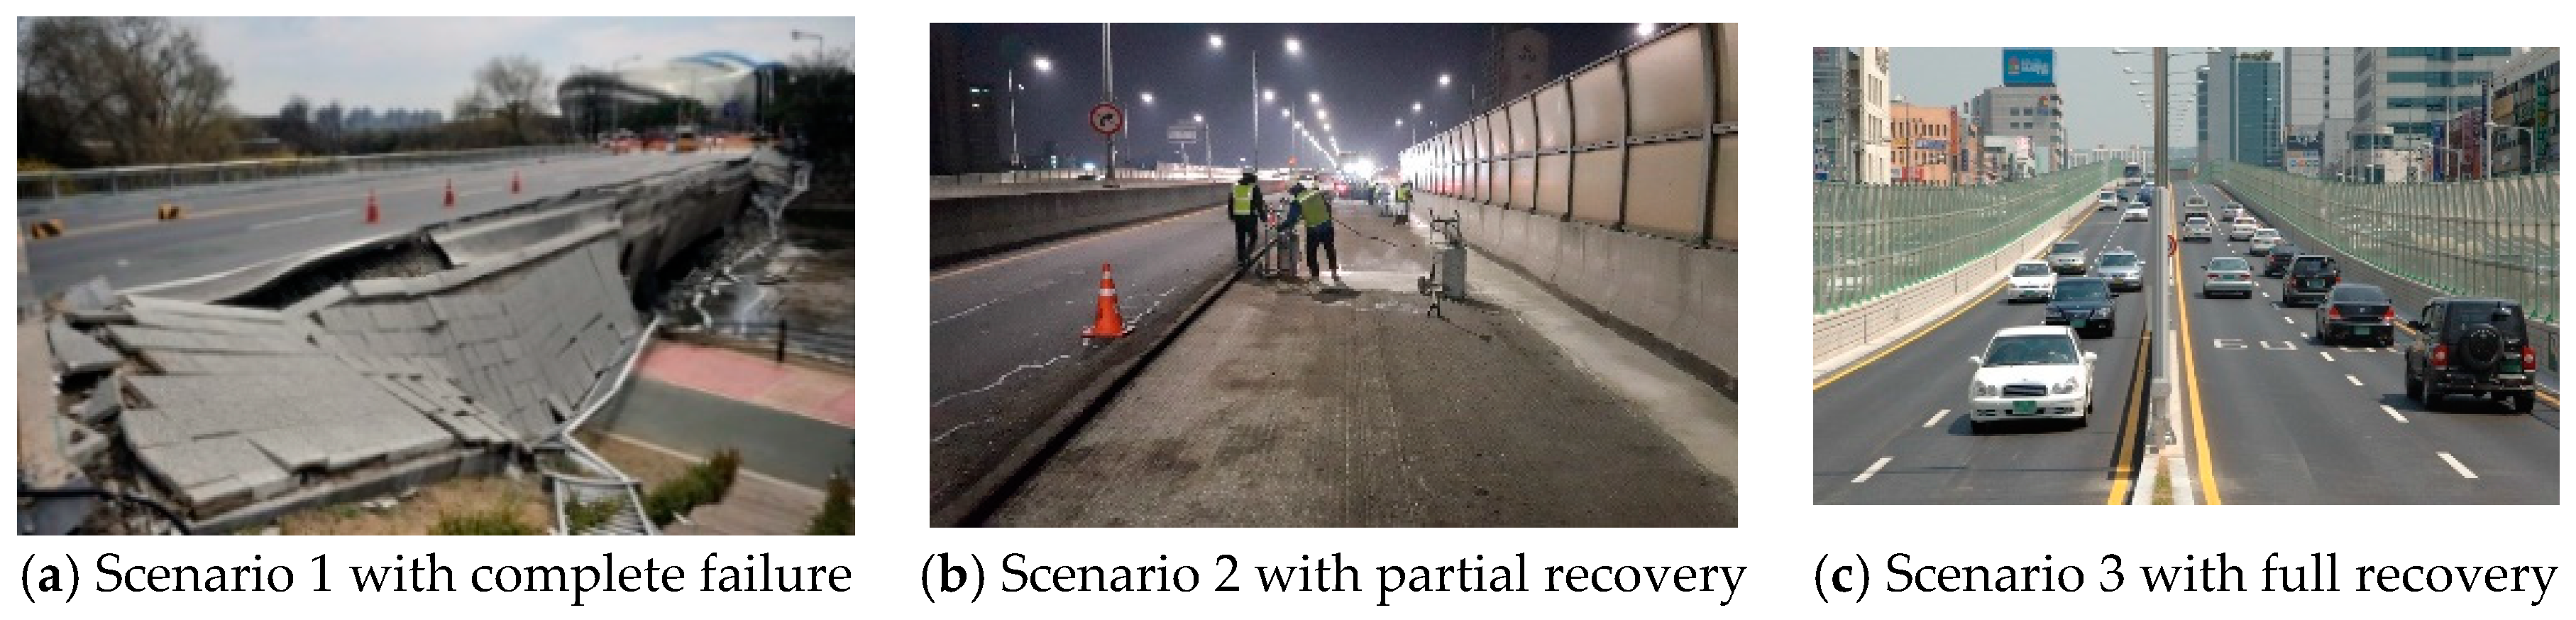
Our study set evaluated three scenarios, which are depicted in
Figure 3. The first involved the collapse of an entire road. The second considered a case when a single lane was restored after a certain amount of time, and the third considered a case in which all lanes were restored after certain elapsed time.
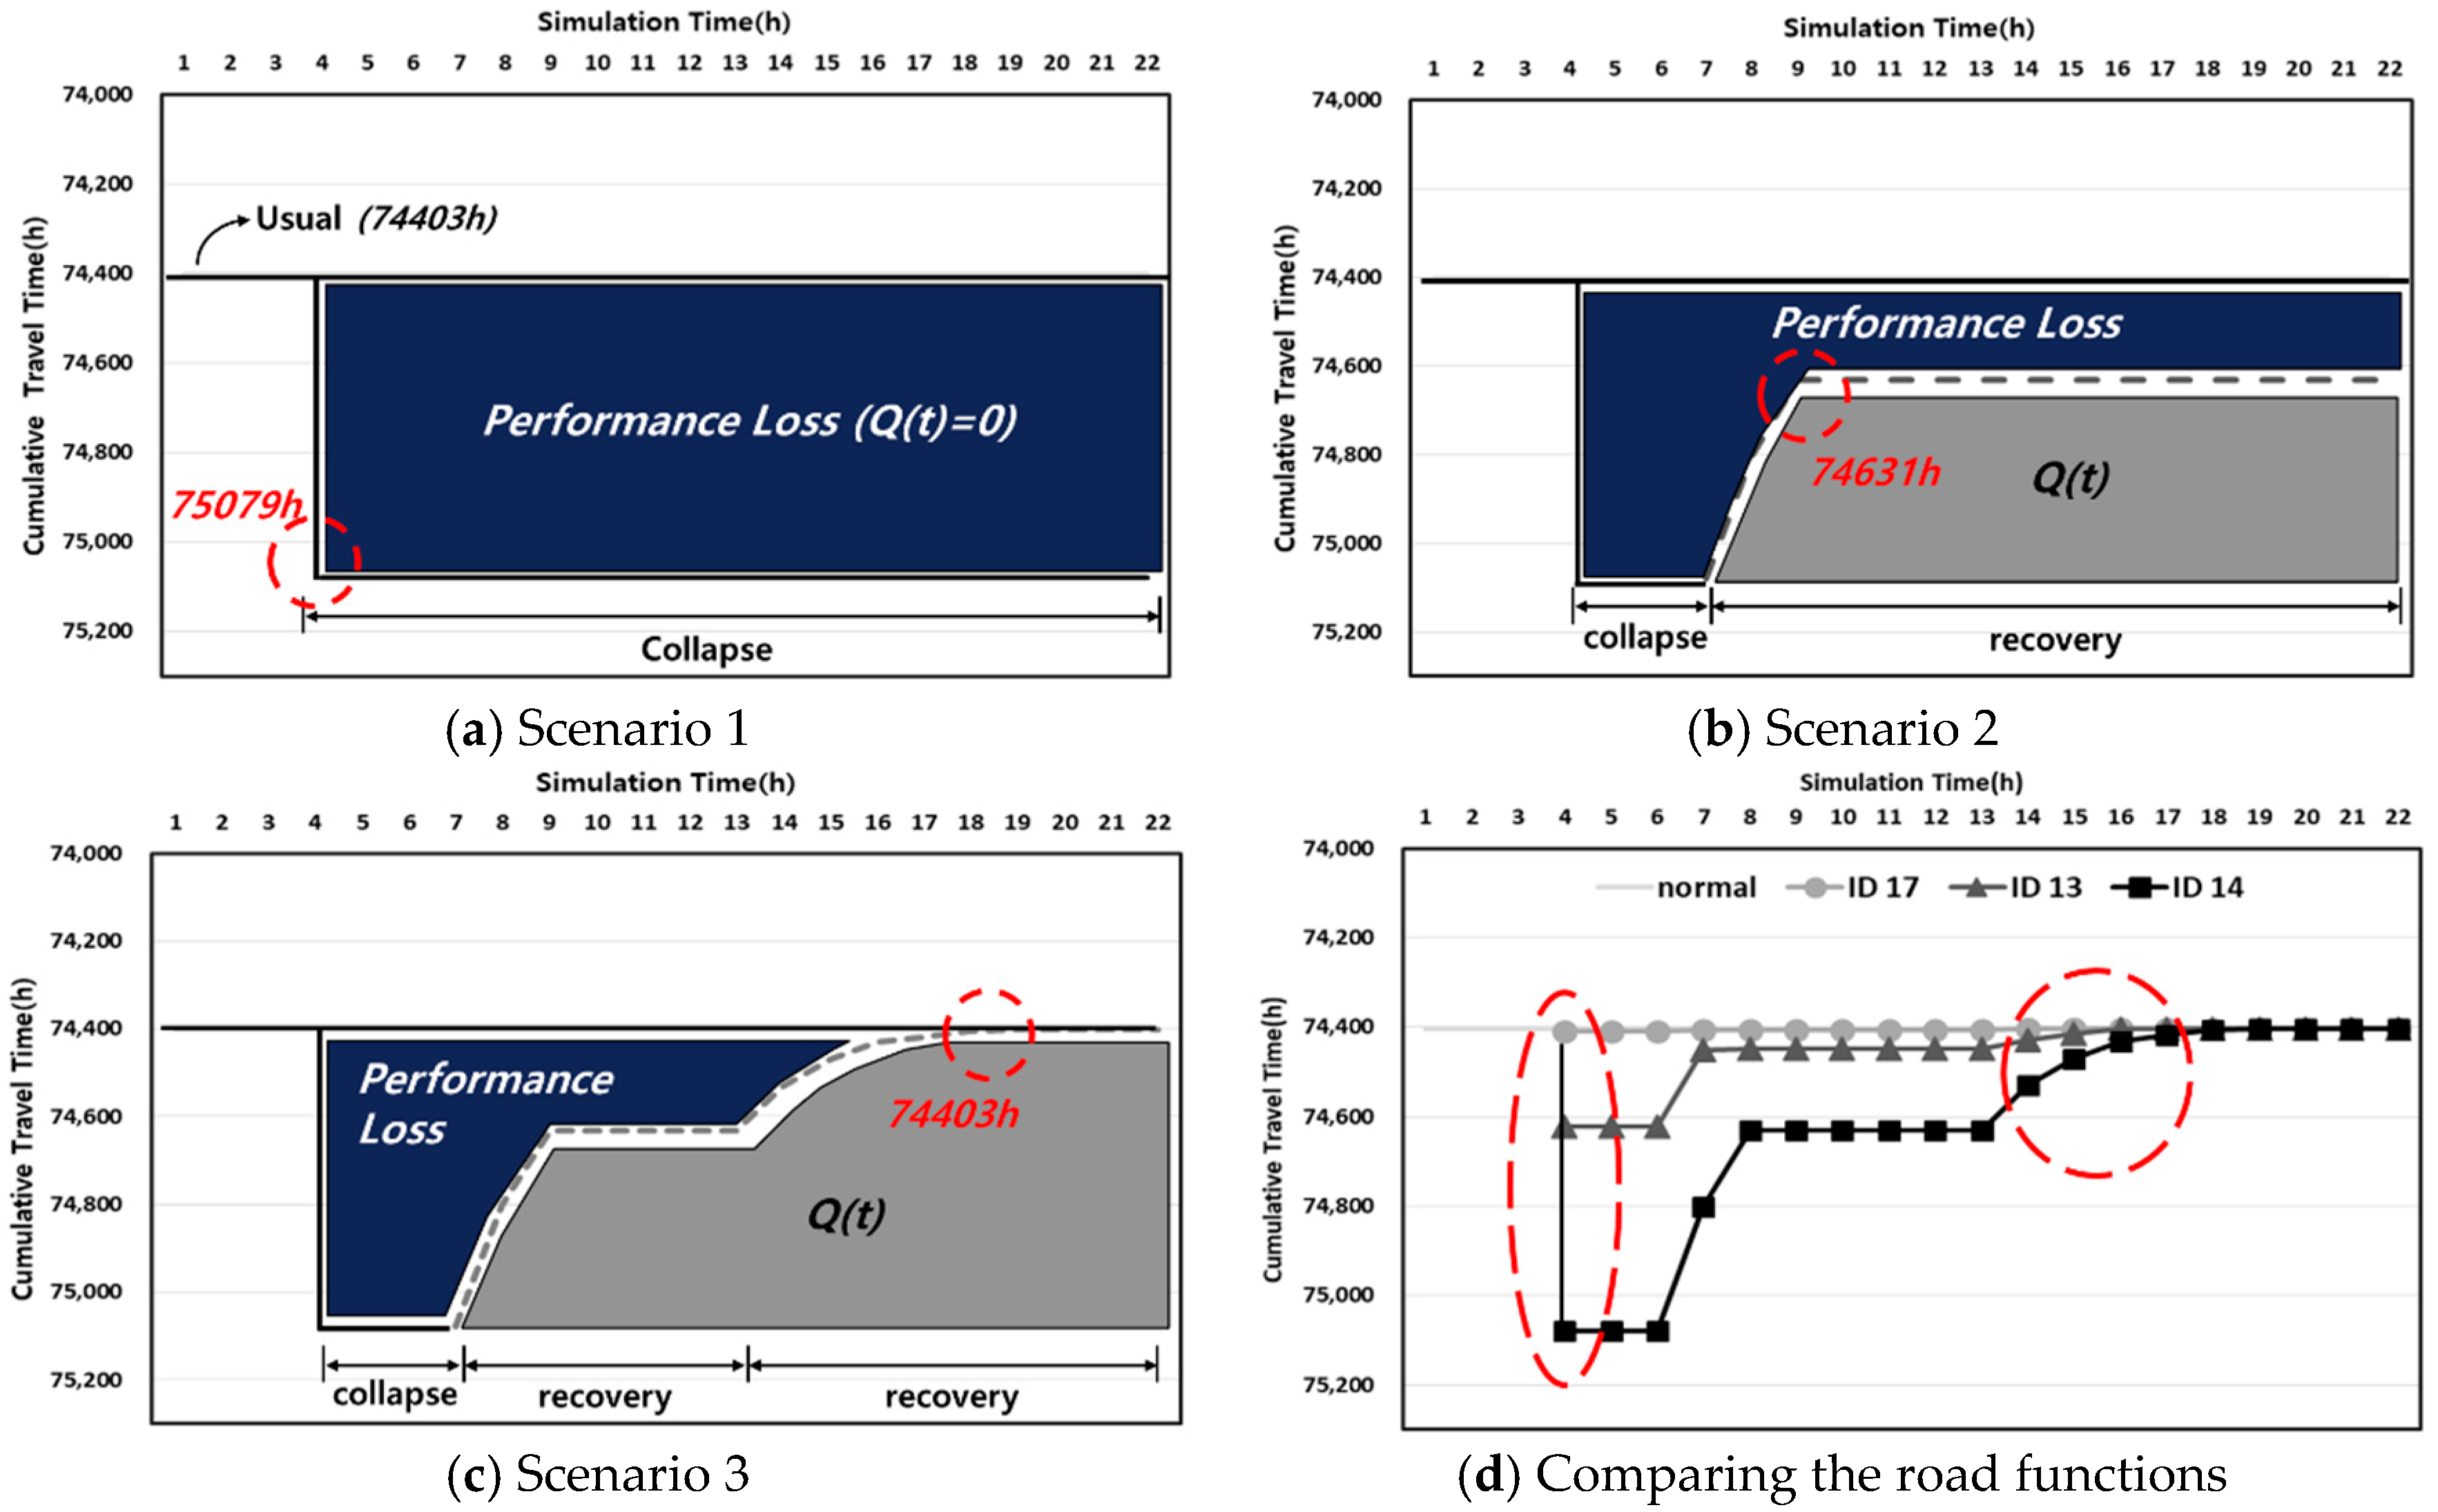
The simulation results for a specific section of road (ID 14) are shown in
Figure 4. In the figure, (a) shows the results for Scenario 1 in which the total travel time increased by approximately 680 h compared to the usual amount of time. In this figure, the area represents the performance that was lost when the road collapsed. Similarly; (b) shows the results for Scenario 2 in which the travel time decreased by approximately 450 h compared to (a), after the lane was restored. This demonstrates that even a limited amount of vehicle traffic has a large effect on the travel time; Lastly, in (c), it was confirmed that the performance of the road returned to normal after all lanes were restored.
Next, a simulation was conducted based on differences in the types of roads, such as a bridge, underground road, or detour to evaluate the performance restoration level depending on the capacity differences. The capacity was calculated as the average traffic volume per hour per section and was based on the macro-simulation results. Section ID 14, which is shown in (d) of
Figure 4, is a bridge where the traffic volume (2371 veh/h) is relatively higher for entry/exit into the nearby metropolitan city. Section ID 13 is a road corresponding to an underground road on National Highway No. 1, where the traffic volume (1286 veh/h) is at an average level. Lastly, the section with ID 17 is located in a suburban area of the city, around which there is a detour. Thus, the traffic volume (159 veh/h) in this section is relatively smaller than that in the other road sections (see Figure 6).
An analysis of the results highlights differences between the groups with respect to the scale of the initial performance reduction and the subsequent restoration scenarios. For the collapsed road section, it was ascertained that there were large differences in the scale of the performance reduction and the time required to restore the road to its original state by road section. In the case of the road section with a high traffic volume and no practical detour, such as on bridges and underground roads, a large amount of time was required to return the road to its original functional state. In general, it was also evident that the effects of disruptions due to the disaster on the road network on the travel time were significant.
3.2. Evaluation of Infrastructure Assets
The officially assessed land price of a lot in a road path was evaluated on the basis of the officially assessed individual land price provided by the MOLIT [
22]. The particular path was classified into 387 lots in total. By multiplying the arithmetic mean of the officially assessed individual land price of the lot within the path based on the area of the path, the asset value of each road section was computed. With these methods, the land asset value of all sections of the National Highway No. 1 (in-depth analysis target) was determined to be
$52,147 thousand based in 2016 dollars.
When the asset value evaluation was completed, the road pavement, bridges, and underground roads on National Highway No. 1 were evaluated as $42,338 thousand, $29,126 thousand, and $10,437 thousand, respectively.
Note that the asset value based on the values of each section increased for longer road lengths, which was because the evaluation was conducted on the basis of length. As the road sections were assessed as being relatively more important, it was confirmed that asset value was higher (
Table 2). The section located in the suburban area that had a high quantitative performance loss was evaluated as having a slightly lower asset value due to differences in the cost of land.
3.3. Determination of the Maintenance Priority
In this study, the maintenance priority of road sections was determined while considering the performance loss and asset value factor in the road network. Meanwhile, although there are various factors that affect road performance loss. In this study, only travel time and asset value were considered.
In the cluster analysis, the representative performance loss and asset values were separated into two groups (large and small) and classified into four clusters based on their respective characteristics. Cluster 1 included road sections with a large asset value that significantly affected the total network when disrupted in a disaster, and Cluster 4 included road sections that were defined as having a low priority of intensive control due to limited effects on the network and low asset values.
According to the analysis, the road sections (IDs 11, 12, 13, 14, and 15) in Cluster 1 contained major crossroads (nodes) that allowed traffic to enter/exit the area. These also included bridges and underground roads that fulfilled key functions within the network and had a very high asset values. These road sections required regular monitoring and maintenance to ensure they remained operational in the event of a disaster (
Figure 5).
The road sections (IDs 1, 2, 10, and 16) in Cluster 2 experienced a large performance loss because there were no detours in the area. However, as these road sections were located in suburbs, their asset value was relatively low compared to those in Cluster 3. Although the performance loss of the sections (IDs 3, 4, 5, and 6) in Cluster 3 were relatively low due to the presence of nearby detours, they had a high asset value. The sections belonging to Cluster 2 (ID 1, 2, 10, and 16) and Cluster 3 (ID 3, 4, 5, and 6) were assessed as either having a high performance resilience or low asset value or vice versa; thus, the priority of their restoration may vary depending on the decision of the road manager. The sections in Cluster 4 (ID 7, 8, 9 and 17) were assessed as having a low performance loss and asset value; thus, the priority of their restoration in the event of a disaster was low (
Figure 6).
4. Critical Path and Diminishing Marginal Utility
The occurrence of a disaster causes problems in many ways. Our study focuses on restoration of road infrastructure because it is aimed to select a critical path which is expected to cause severely damage due to disaster.
The decisions made by public agencies are also very important in restoring road networks after a disaster has occurred. In case of networked infrastructure, such as roads, railways, and the electrical grid, there are always critical paths (or links) for which there is relatively more user demand. While restoring specific roads and paths in one direction will gradually restore network performance, it is important to devise alternatives with relatively higher utility despite relying on the same efforts of public agencies (i.e., budget and time required for restoration).
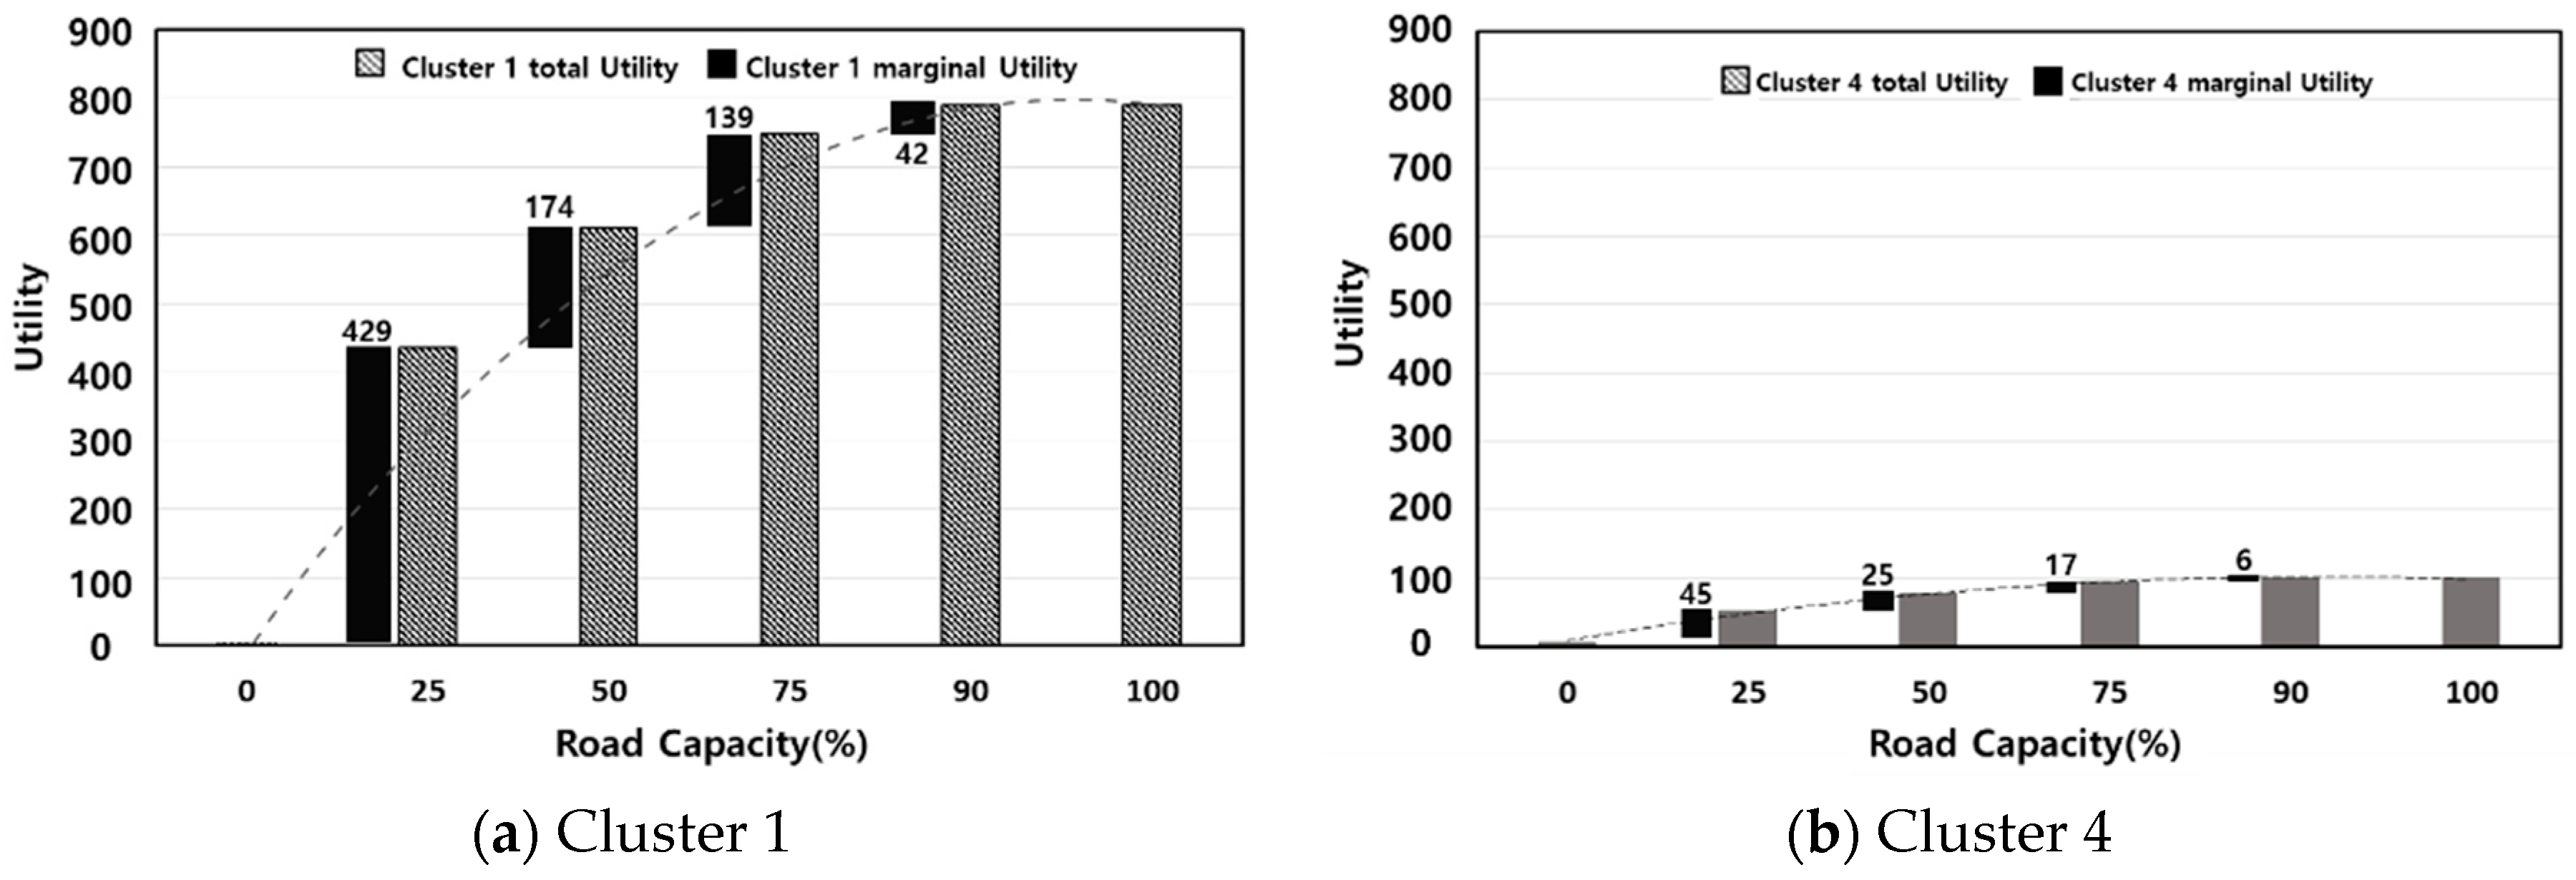
Under the premise that the budget (i.e., restoration capacity) of the target path remains the same, a scenario analysis was conducted for various network capacities: 0% (complete collapse), 25%, 50%, 75%, and 100% (complete restoration). The travel time in each case was evaluated based on the change in the total travel demand according to the maintenance priority by cluster. In these scenarios, the road sections belonging to clusters 1 and 4 were completely restored preferentially.
Figure 7 shows the analysis results for the various road network restoration scenarios. At full capacity, the total travel time on the road network was 74,403 h, while the cumulative travel time increased by 2.3% when the capacity deteriorated to 0%. Then, as the road capacity was restored, it decided to preferentially the road sections in Cluster 1 to save travel time. In this test, the preferential restoration of the road section that suffered a large performance loss versus the investment cost from the perspective of the road manager was confirmed to be desirable for travel time savings.
With the scenario in which an entire road section collapsed was selected as the base case, the results of an analysis of the effects of differences in the importance of various roads on the network utility are shown in
Figure 7, where the reduced travel time is shown versus the restoration level. Here, when the input cost increased to increase the road capacity, the utility of the travel time savings was positive.
However, it was confirmed that total increase in the utility gradually diminished as the input cost increased. The magnitude of the travel time saving versus the scale of the restoration cost input was very different depending on the importance of the particular road section. Initially, the travel time reduction was high although this gradually diminished as time passed. In other words, the increase in the magnitude of the utility differed from the input unit restoration cost, which demonstrates the law of diminishing marginal utility holds in this case. The total utility functions of clusters 1 and 4 are shown in Equations (6) and (7), respectively (
Figure 8).
5. Conclusions and Future Research
In this paper, we addressed the issues of road network resilience by considering the performance loss and asset value when natural disasters occur. We proposed a quantitative evaluation method to analyze the performance and asset value of a road network affected by a disaster in Sejong city. Based on the macro simulation and micro simulation utilizing GIS data and O/D data, we found that there were large differences in the scale of the performance reduction and the time required to restore the road to its original state for each road section. In particular for road sections with high traffic volumes and no practical detours, such as bridges and underground roads, a large amount of time was required to return the road section to its original functional state.
Evaluation asset value of road network (such as bridges, underground roads etc.) was analyzed through the written down replacement cost methods. Then, evaluation indicators (performance loss and asset value) of road networks were grouped through cluster analysis, method for selecting the critical paths requiring road network maintenance based on their relative priorities was presented. Finally, the effects of restoring two cluster sections with different road network performance losses on the total network were also elucidated.
As a result of analyzing the characteristics of each section, including the traffic volume, performance change, and time required for restoration, it was found that the damage caused by performance loss in the critical path (i.e., the paths along with the traffic volume and connectivity was high) was significant and much time was required for restoration needed. By comparing three types of representative road sections with different road capacities and functions, it was found that the time required for restoration was high, as was the asset value, in the case of a bridge where traffic volume was relatively high.
As a result of selecting critical paths based on the consideration of the performance loss and asset value, there was a need to control certain roads in order to maintain their usual performance due to a relatively higher asset value. It was also found that there was a need to restore road functions in priority order. From the perspective of a road manger, in order to restore road network performance to its original state after the occurrence of a disaster, it is preferable to restore road section in priority order to maximize the travel time efficiency compared to the investment cost. In addition, due to differences in the increases in the utility for the same input unit restoration cost, it was confirmed that the marginal utility did indeed diminish.
It should be noted that a limitation of our study is that only the travel time and capacity of the road section were used as indicators of the performance change in the road network. Thus, in the future, it will be necessary to conduct an analysis of other indicators, such as the travel speed, road length, pollution, driver’s health, driving safety, etc. Although the simulation was conducted using the same disaster type and scenario conditions when calculating the quantitative performance loss of the road network based on the road damage in the event of a disaster, the type of disaster and its scope, and intensity can vary greatly. Thus, in the future, a more in-depth study of various scenarios should be conducted.


