1. Introduction
Under the trend of industrial transformation and economic growth, Taiwan has entered the stage of the post-industrial society. The driving force of the economy has transformed from manufacturing products to providing services. Industries are dominated by professional staff with knowledge in different fields [
1]. According to studies by the Organisation for Economic Co-operation and Development (OECD), office workers have weekly working hours of at least 40 h on average. This number is still increasing, and more companies are willing to spend more money on furniture that could make their office environments more comfortable. They believe a good office environment can enhance the corporate image, boost work efficiency, and reduce employee turnover rate. Moreover, the office environment of a company is an ecosystem in which different types of people work together, and thus it can reflect the company’s culture, human resource strategy, and the operation process.
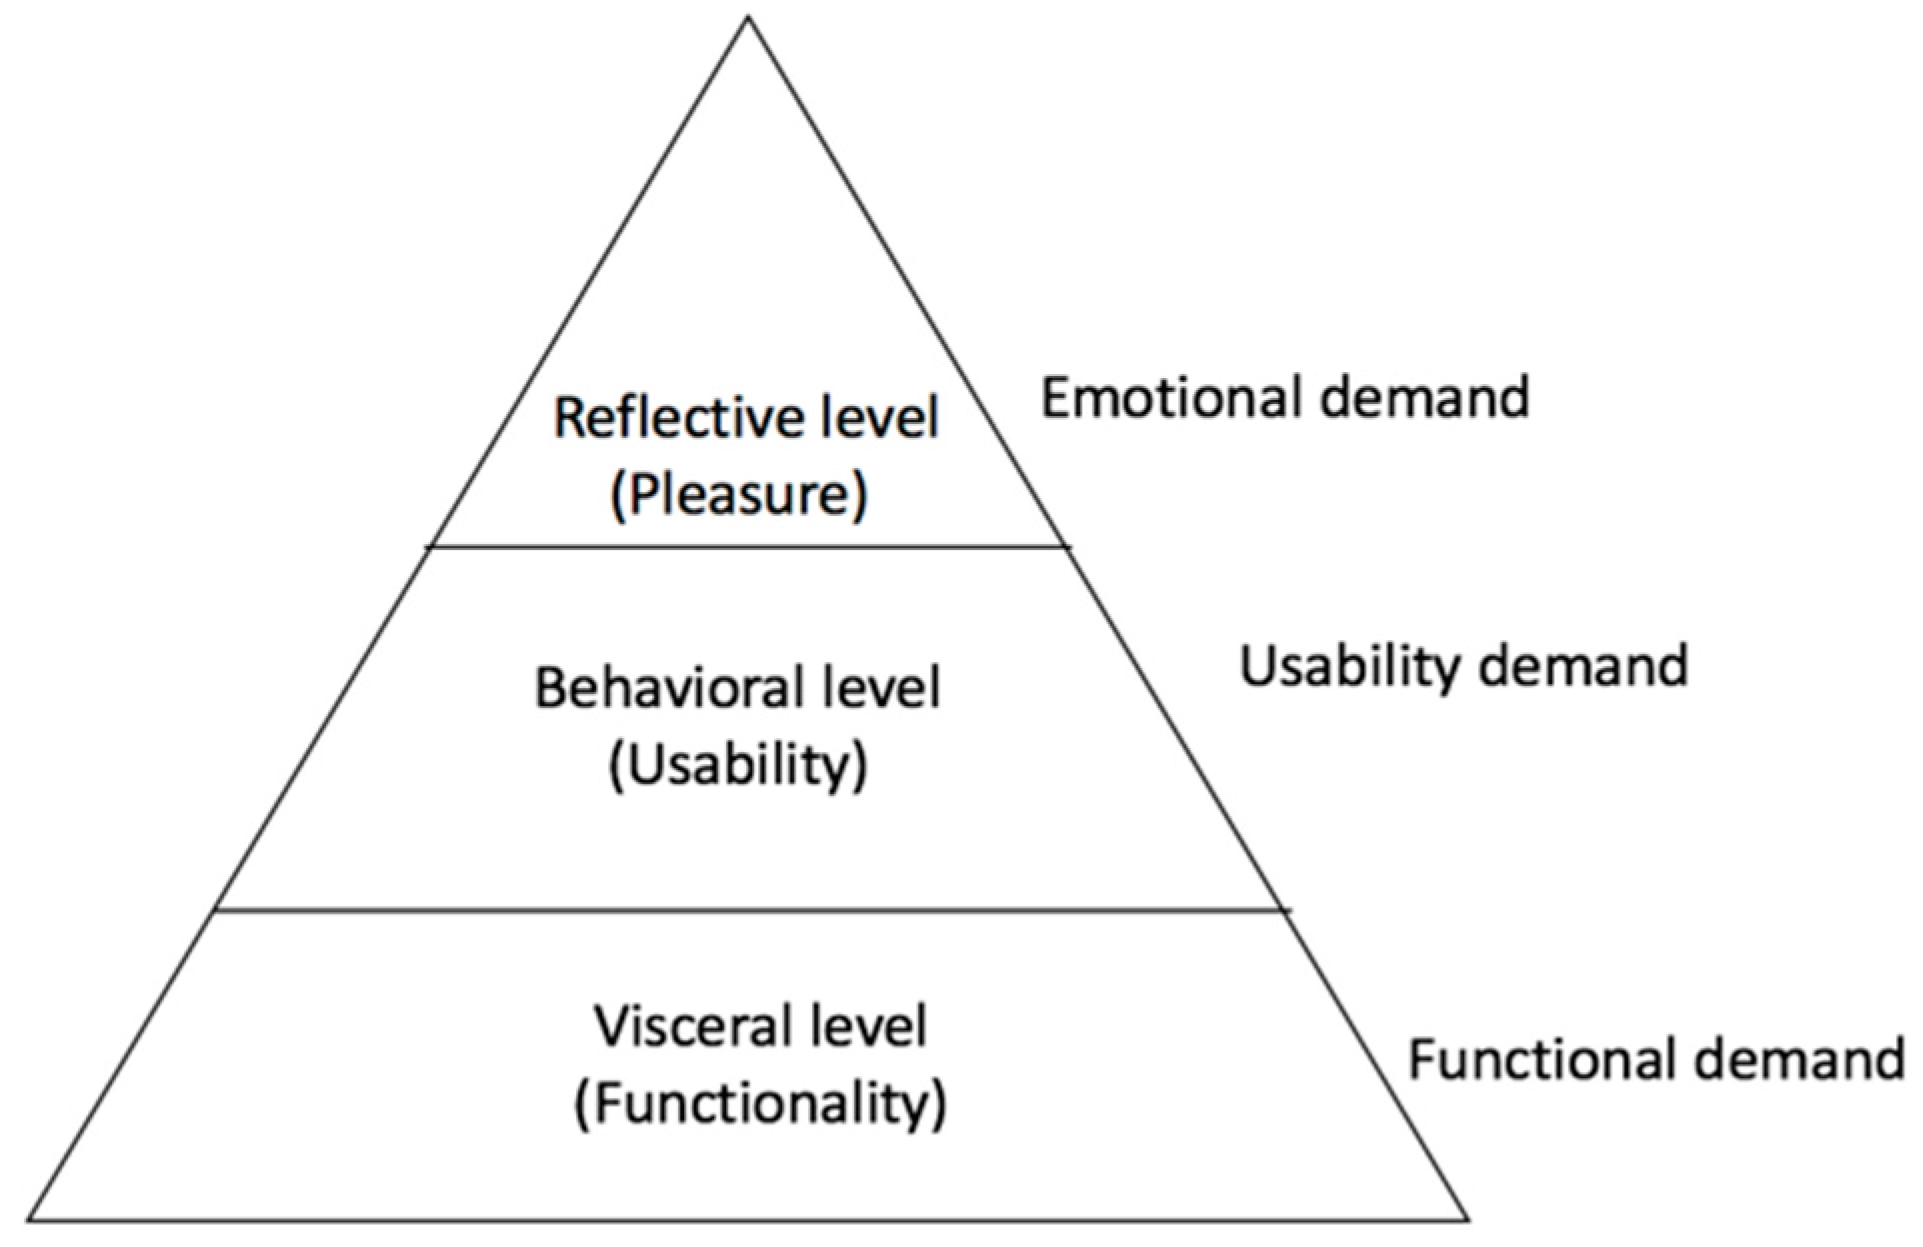
One of the different types of office furniture on which office workers spend lots of time is the office chairs. Office chairs affect a worker’s feeling of comfort in the office environment and can also present different company cultures and industry attributes. The comfort and ergonomics of a chair have been investigated by many scholars based on the theory of ergonomics. However, few studies can be found on the relationship between chair aesthetics and user preferences. With the changing consumer habits and living environments, a users’ acceptance of a product is affected by their feeling of comfort and uniqueness, in addition to the product’s functions and appearance. Modern office workers value their life quality more than ever before, and they expect more from a product. According to the three levels of processing (
Figure 1) proposed by Norman [
2], the office chairs that are available on the market can satisfy the requirements at the visceral level (functionality) and the behavioral level (usability). Users are gradually emphasizing the design taste and product appearance. In addition to enhancing manufacturing quality, designers are required to create new office chairs with styling aesthetics according to the preferences of different users.
The history of personality-related studies is long and has been highlighted in recent years. More and more schools and companies are using personality tests to determine whether an individual is suitable for an assignment or task. From the aspect of human resource management, the credibility of personality tests has been verified for use in assessments administered before educational training or before building up a team.
The key to successful product marketing on the consumer market is to precisely locate the target group. In addition to satisfying physical and functional demands of the target group, one of the important factors affecting the consumers’ purchase decision is the product attractiveness. Therefore, designers are required to enhance a product’s attractiveness for the target group so that the product can be successful. This means a designer should master the preferences and mental perceptions of the target group during the design process so that the product style can present features and emotions that are expected by the target group. The objective of this study is to investigate the attractiveness of different chair designs and the differences in office workers’ preferences for office chairs. The research groups are classified by including theory of personality traits into demographics. The personality traits of participants from different industries are analyzed so that the results can serve as a good reference for designers when designing new office chairs that meet users’ preferences and the expected chair style and functions. From the aspect of product designs, Chou [
3], Hsiao et al. [
4], and Ko et al. [
5] proposed different approaches for deconstructing a product by perception and real operations in order to determine the optimal design solution.
According to the records available in historical materials, the Chinese term ‘Yi’ (chair) can be dated back to the Tang dynasty. Prior to the Tang dynasty, most Chinese sat on the ground but did not sit on a chair. After Buddhism was introduced into China, Western chairs with armrests were introduced into China. Historical images and data indicated that chairs became popular during the flourishing age of the Tang dynasty and became common in the Song dynasty. A chair was viewed as a symbol of power in Chinese and Western cultures before the 16th century. Its imagery represents the user’s seniority and authority through features such as the seat back height, complexity of carvings and patterns, and presence or absence of armrests. These features reveal the identity of the chair user [
6].
During the development of chairs, there have been exchanges of chair styles between Chinese and Western cultures. Moreover, each region around the world also has its representative chairs due to different ways of living, cultures, and folkways. Nakashima et al. [
7] compared the differences between chairs according to their origins and eras and proposed that different style designs reflect the fashion culture of the local region at that time.
Chairs are made of wood, metal, or other sturdy materials. In some instances, a combination of several materials is used on different structures. For example, a chair might be composed of metal cabriole legs and plastic chair top and stile. If the apron is made of materials with a hard surface, it might be covered with leather or fabric with soft cushion pads or fillers. The seat back might be made of porous materials, or holes may be created in order to facilitate ventilation.
A chair pattern is embodied from a combination of functions and materials. Different materials might have similar functions, but the resulting styles might not be the same. The materials that are commonly used on chairs can be classified into five categories as shown in
Table 1 [
6].
A chair’s potential attractiveness factors including chair style, color, and material are included in the investigation of how a purchase decision is made by consumers. In the second stage of the experiment, a regression analysis is carried out on the personality trait scale in addition to the demographic variables such as gender and age. The purpose of the questionnaire survey is to determine the chair styles that are preferred by people of different personality traits so that designers can focus on strengthening the product style and features that are preferred by the target group. The elements of the office environment that are considered by different personality traits serve as a good reference for the interior design of an office space. Therefore, the objective of this study is threefold as follows:
Determine the attractiveness factors of an office chair.
Investigate via a questionnaire survey the evaluation of office chair attractiveness by users with different personality traits from the aspects of style, color, material, texture, and function.
Investigate users’ evaluation of the office chair style or functions they perceived and determine the importance of each attractiveness factor for the users.
This paper is organized into five sections.
Section 1 introduces the history of personality-related studies.
Section 2 reviews earlier studies that are based on Miryoku engineering and discusses the application of the quantification theory.
Section 3 describes the research methodology and process with details of the questionnaire design in this study.
Section 4 presents a case study and the investigation results.
Section 5 presents our conclusions from the investigation.
2. Literature Review
Earlier studies that are related to Miryoku engineering, evaluation grid method (EGM), and personality traits are reviewed in this study for integration into the proposed applications. The Miryoku engineering approach was proposed by Japanese scholars. The principal part of Miryoku engineering is to create preference-based designs for consumers in order to create a communication interface between a designer and his/her customers. Miryoku (attractiveness) is defined by the Japanese Kojien Dictionary as “attraction to human minds” and it is equipped with “must-have uniqueness”. The attractiveness could be defined as having “attraction”, “charm”, or “dazzling effect”. It deals with the capability of dazzling, attracting, inducing, infecting, and dynamic effects for conquering people’s minds. It is comprehensive, presenting the influence of social functions rather than a single action force that is generated locally [
8].
Attractiveness is one of the important driving forces for boosting human civilization, promoting social developments, activating life, and getting people motivated. It is closely linked to people’s feelings and carries important implications and motivations in life [
9]. Miryoku engineering is one of the branches of Kansei engineering, which is a type of ergonomic study of the relationship between mental perception and actual objects. Its objective is to quantify human emotion by engineering approaches. The term Miryoku engineering was proposed by Japanese scholars J. Sanui and M. Inui in 1985 by referring to the concept that was proposed by clinical psychologist G. A. Kelly [
10] in his book “The Psychology of Personal Constructs”. This subject has been included in the Japan Society of Kansei Engineering since 1998. Its theory is based on several fundamental models and designs. Japanese scholar M. Ujigawa [
11] and several other scholars initiated the study of Miryoku Engineering in 1991 with an attempt to create products, spatial techniques, and learning techniques with regard to attractiveness. A summary of individual perceptions and concepts is created in order to determine the optimal design concept that complies with consumer preferences. Therefore, this design concept is under the premise of consumer preferences. The subjective preference of a consumer comes from his/her value judgment system which includes various scopes such as sensory reception, mental decision-making, sociological influences, and art evaluation. During the process of creating a new product, questions regarding the product’s attractiveness will arise, as shown in
Table 2.
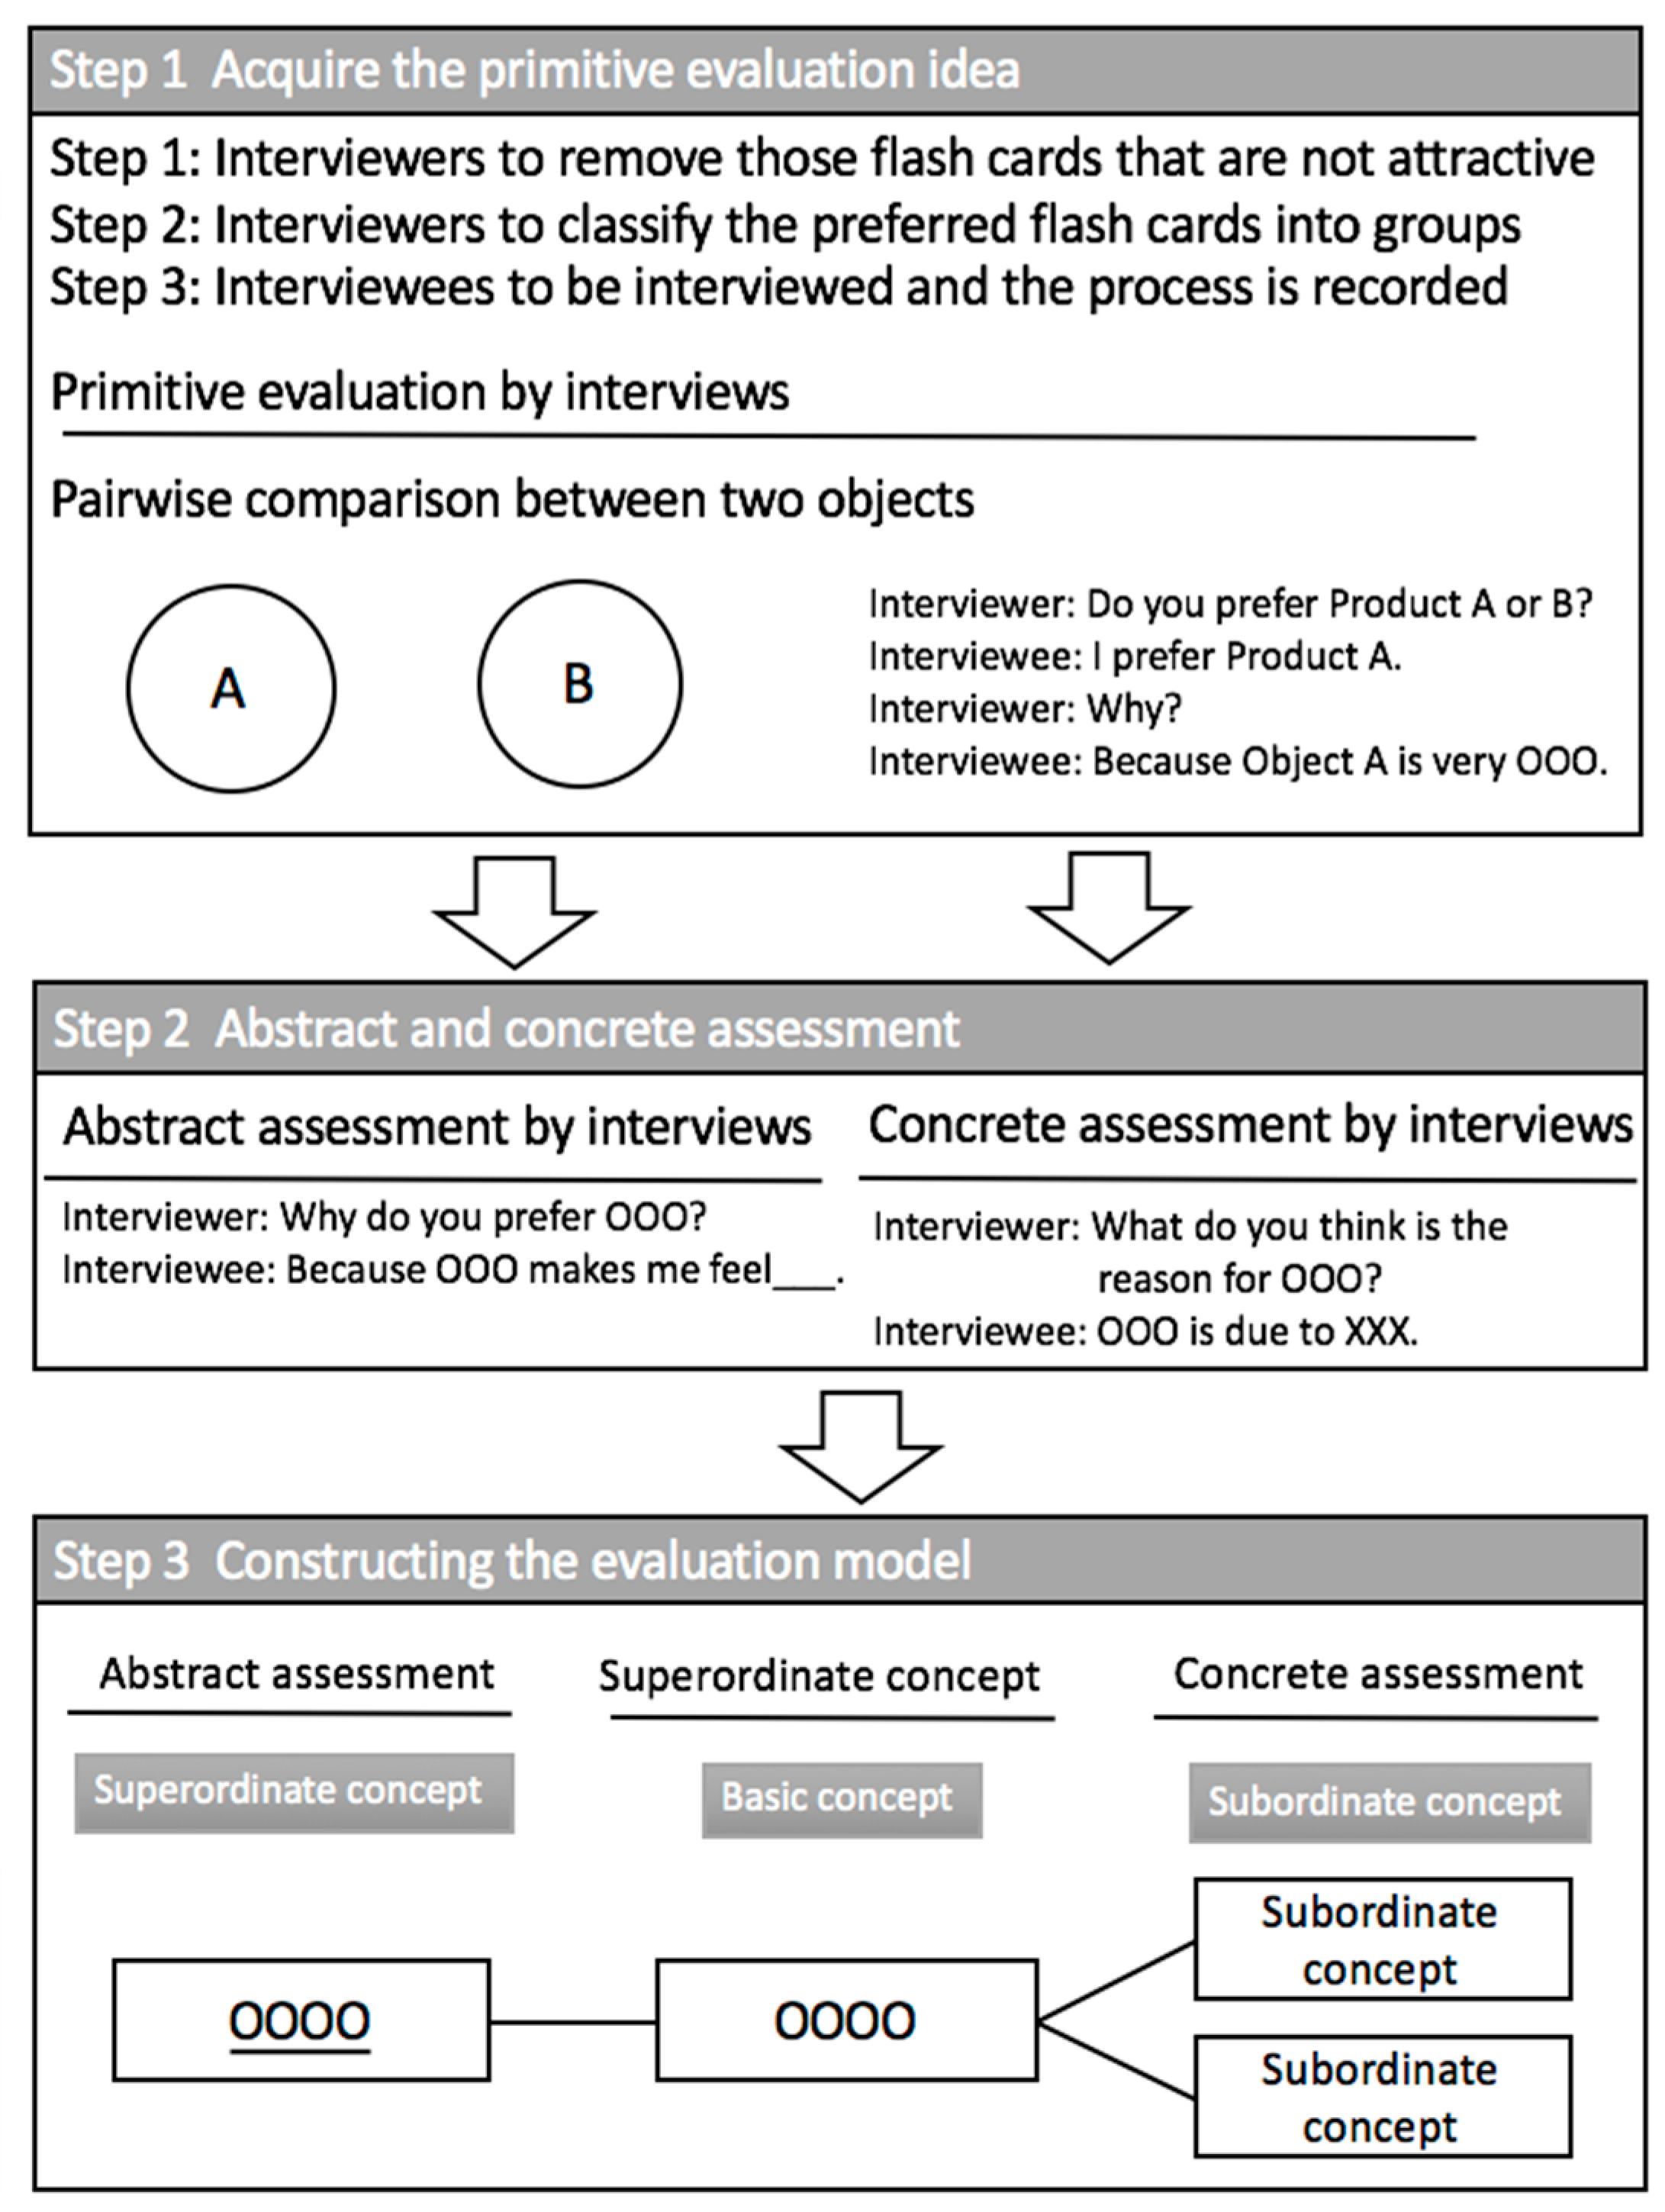
Evaluation grid method (EGM) originated from psychological studies and deals with summarizing the concepts that are perceived by individuals into various charts, as shown in
Figure 2. This approach aims to summarize the individual characteristics of the target object by identifying its similarities to or differences from other objects. This is realized by interviewing individuals and by collecting the results of pairwise comparisons between subjects A and B [
10]. Sanui [
12] contributed to the further development of this approach. He proposed a two-step investigation, first by asking the participants to answer whether they like a target object or not, and second by clarifying what the participants meant regarding the associated criteria with supplementary questions. The structural network of the attractiveness factors for consumer preferences can be materialized accordingly.
Among the relevant studies, the EGM has been proven to be an effective approach for analyzing a product’s attractiveness factors with a theoretical basis. Consumers’ perception of a product’s attractiveness can be determined by in-depth interviews. Various types of stimuli are provided under the scope of the target topic in order to generate apparent differences in the participants’ perceptions. By comparing the participants’ preferences, each participant’s original perception of the topic can be obtained. After that, the participants are guided to further analyze their perception and to transform their concepts into two categories, including concrete reasons and abstract perceptions. The ultimate goal is to understand the participants’ real ideas [
8].
The term “personality” is derived from Latin. It originally referred to the masks that are worn by drama actors. This is something that other people can see, and it represents the owner’s personal characteristics in other’s eyes. Some other scholars define personality as a person’s behaviors.
The theory of personality trait originated from the study by G. W. Allport in 1950s. He proposed that the personality trait is the basis of a person’s personality and is the fundamental composition of the mental structure. It represents the stable temperament and characteristics of a person that are developed on a physical basis. Allport [
13] viewed personality traits as compositions of the personality structure, with each type of personality trait having its own location in the personality structure. There are different types of relationship between these personality traits, and they can be classified into three categories as follows.
Cardinal trait: The personality trait that can best represent a person’s characteristics. It is the most dominant trait in the personality trait structure, and it affects every aspect of the person’s behaviors.
Central trait: The core component of a person’s temperament.
Secondary trait: This indicates a person’s preference or tendency of responses, such as preferring clothes of certain colors or enjoying cleaning up the room.
This section may be divided by subheadings. It should provide a concise and precise description of the experimental results, their interpretation, and the experimental conclusions that can be drawn.
A personality trait could be one person’s cardinal trait but another’s central trait. It could be just a secondary trait in the third person. Typically, the central trait is used to depict a person’s temperament. Other scholars proposed that the personality trait is the unique temperament that a person reveals when adapting to new people, things, and their environments [
14]. This unique temperament inside a person is called the personality trait. It is a person’s enduring and unique behavior pattern [
14,
15].
Eysenck [
16] classified personality traits into two categories which include (1) introversion/extroversion and (2) neuroticism/stability. The classification of personality traits that is proposed by L. R. Goldberg [
17] includes five categories, and his model has been examined and accepted by follow-up scholars as the five-factors model of personality traits. These five categories include openness to new experiences, conscientiousness, extraversion, agreeableness, and neuroticism [
18]. In 1992, Goldberg proposed a personality scale that is composed of 35 bipolar clusters and 100 trait adjectives for assessing personality traits. The 100 trait adjectives can be classified into those five factors, with each factor contains 20 adjectives. The reliability of this model is verified with the alpha values in the range of 0.82–0.97 [
17,
19].
Personality traits are often used for investigating consumers’ purchasing behaviors, job aptitude tests, and future developments of students. As users have different views on products, companies are required to enhance the value added to a product’s own functions. Product differentiation should be realized in order to enhance competitiveness. Lin [
20] investigated the relationship between personality traits and color preferences for groups of college students that are classified by their personality traits, values, zodiac signs, and blood types. Kuo [
21] classified products into symbolic, integral, and practical types for investigating the preferences of users with different personality traits. Shen [
22] investigated a group of people over 18 years old for their preference of product colors and their differences in making purchase decisions. Chang [
23] classified guesthouses into different groups and investigated people’s preference for guesthouses by a questionnaire survey. His results indicated the difference in the selection of guesthouses by consumers of different personality traits. Wu [
24] carried out a case study of the relationship between the design philosophy, personality trait, and the consumers’ purchase preference via a questionnaire survey. Terng [
25] investigated the correlation between the color preference of potential female wedding guests of different personality traits and their behavioral intentions. Hsueh [
26] investigated the relationship between personality trait, color preference, and shape preference by studying the purses used by females in order to understand the personality traits’ influence on shape and color preference.
The result of the literature review indicated a number of relevant studies on consumers’ personality traits and their preferences when making a selection. There are also studies on the correlation between an office worker’s personality trait and his/her job performance. It is known from these studies that various scales of personality traits have been widely used for demographic studies or corporate hiring applications. The results of these studies also verified the influence of personality traits on people’s behaviors and selection preferences. Personality traits are classified into several categories including openness to new experiences, conscientiousness, agreeableness, and neuroticism for further investigation in this study.
The quantification theory type I is used in this study for quantifying data. This approach is proposed by Japanese scholar C. Hayashi for the analysis of how a qualitative variable affects the target quantity by multiple regressions. It allows researchers to build a prediction model for analysis and is often used for the study of Kansei engineering. The goal is to determine the relationship between Kansei vocabularies and form elements. There are six types of quantification theory, and the quantification theory type I is a type of qualitative regression approach. The influence and weight of each vocabulary on each design parameter, such as style or color elements, can be determined by the analysis of quantification theory type I [
27].
A quantification theory is used to carry out the multiple regression analysis, principal component analysis, and discriminant analysis of data, including yes or no answers. The six quantification theories include type I, II, III, IV, V, and VI. The first four types from type I to type IV are commonly used. Among them, type I deals with regression analysis, type II deals with discriminant analysis, and type III could belong to either the principal component analysis or the factor analysis, depending on its application scenario. The purpose of quantification theory type I is to determine the approximate functional relationship between a specific variable (i.e., the target variable) and other qualitative items. The intensity of the influence of each qualitative item on the target variable can be determined by the multiple regression analysis. Each qualitative item is composed of several categories. It is also assumed that all of the test specimens are required, but only one is selected. This approach can be used to determine the regression equations and to predict the variance of data [
28].
3. Research Methodology and Process
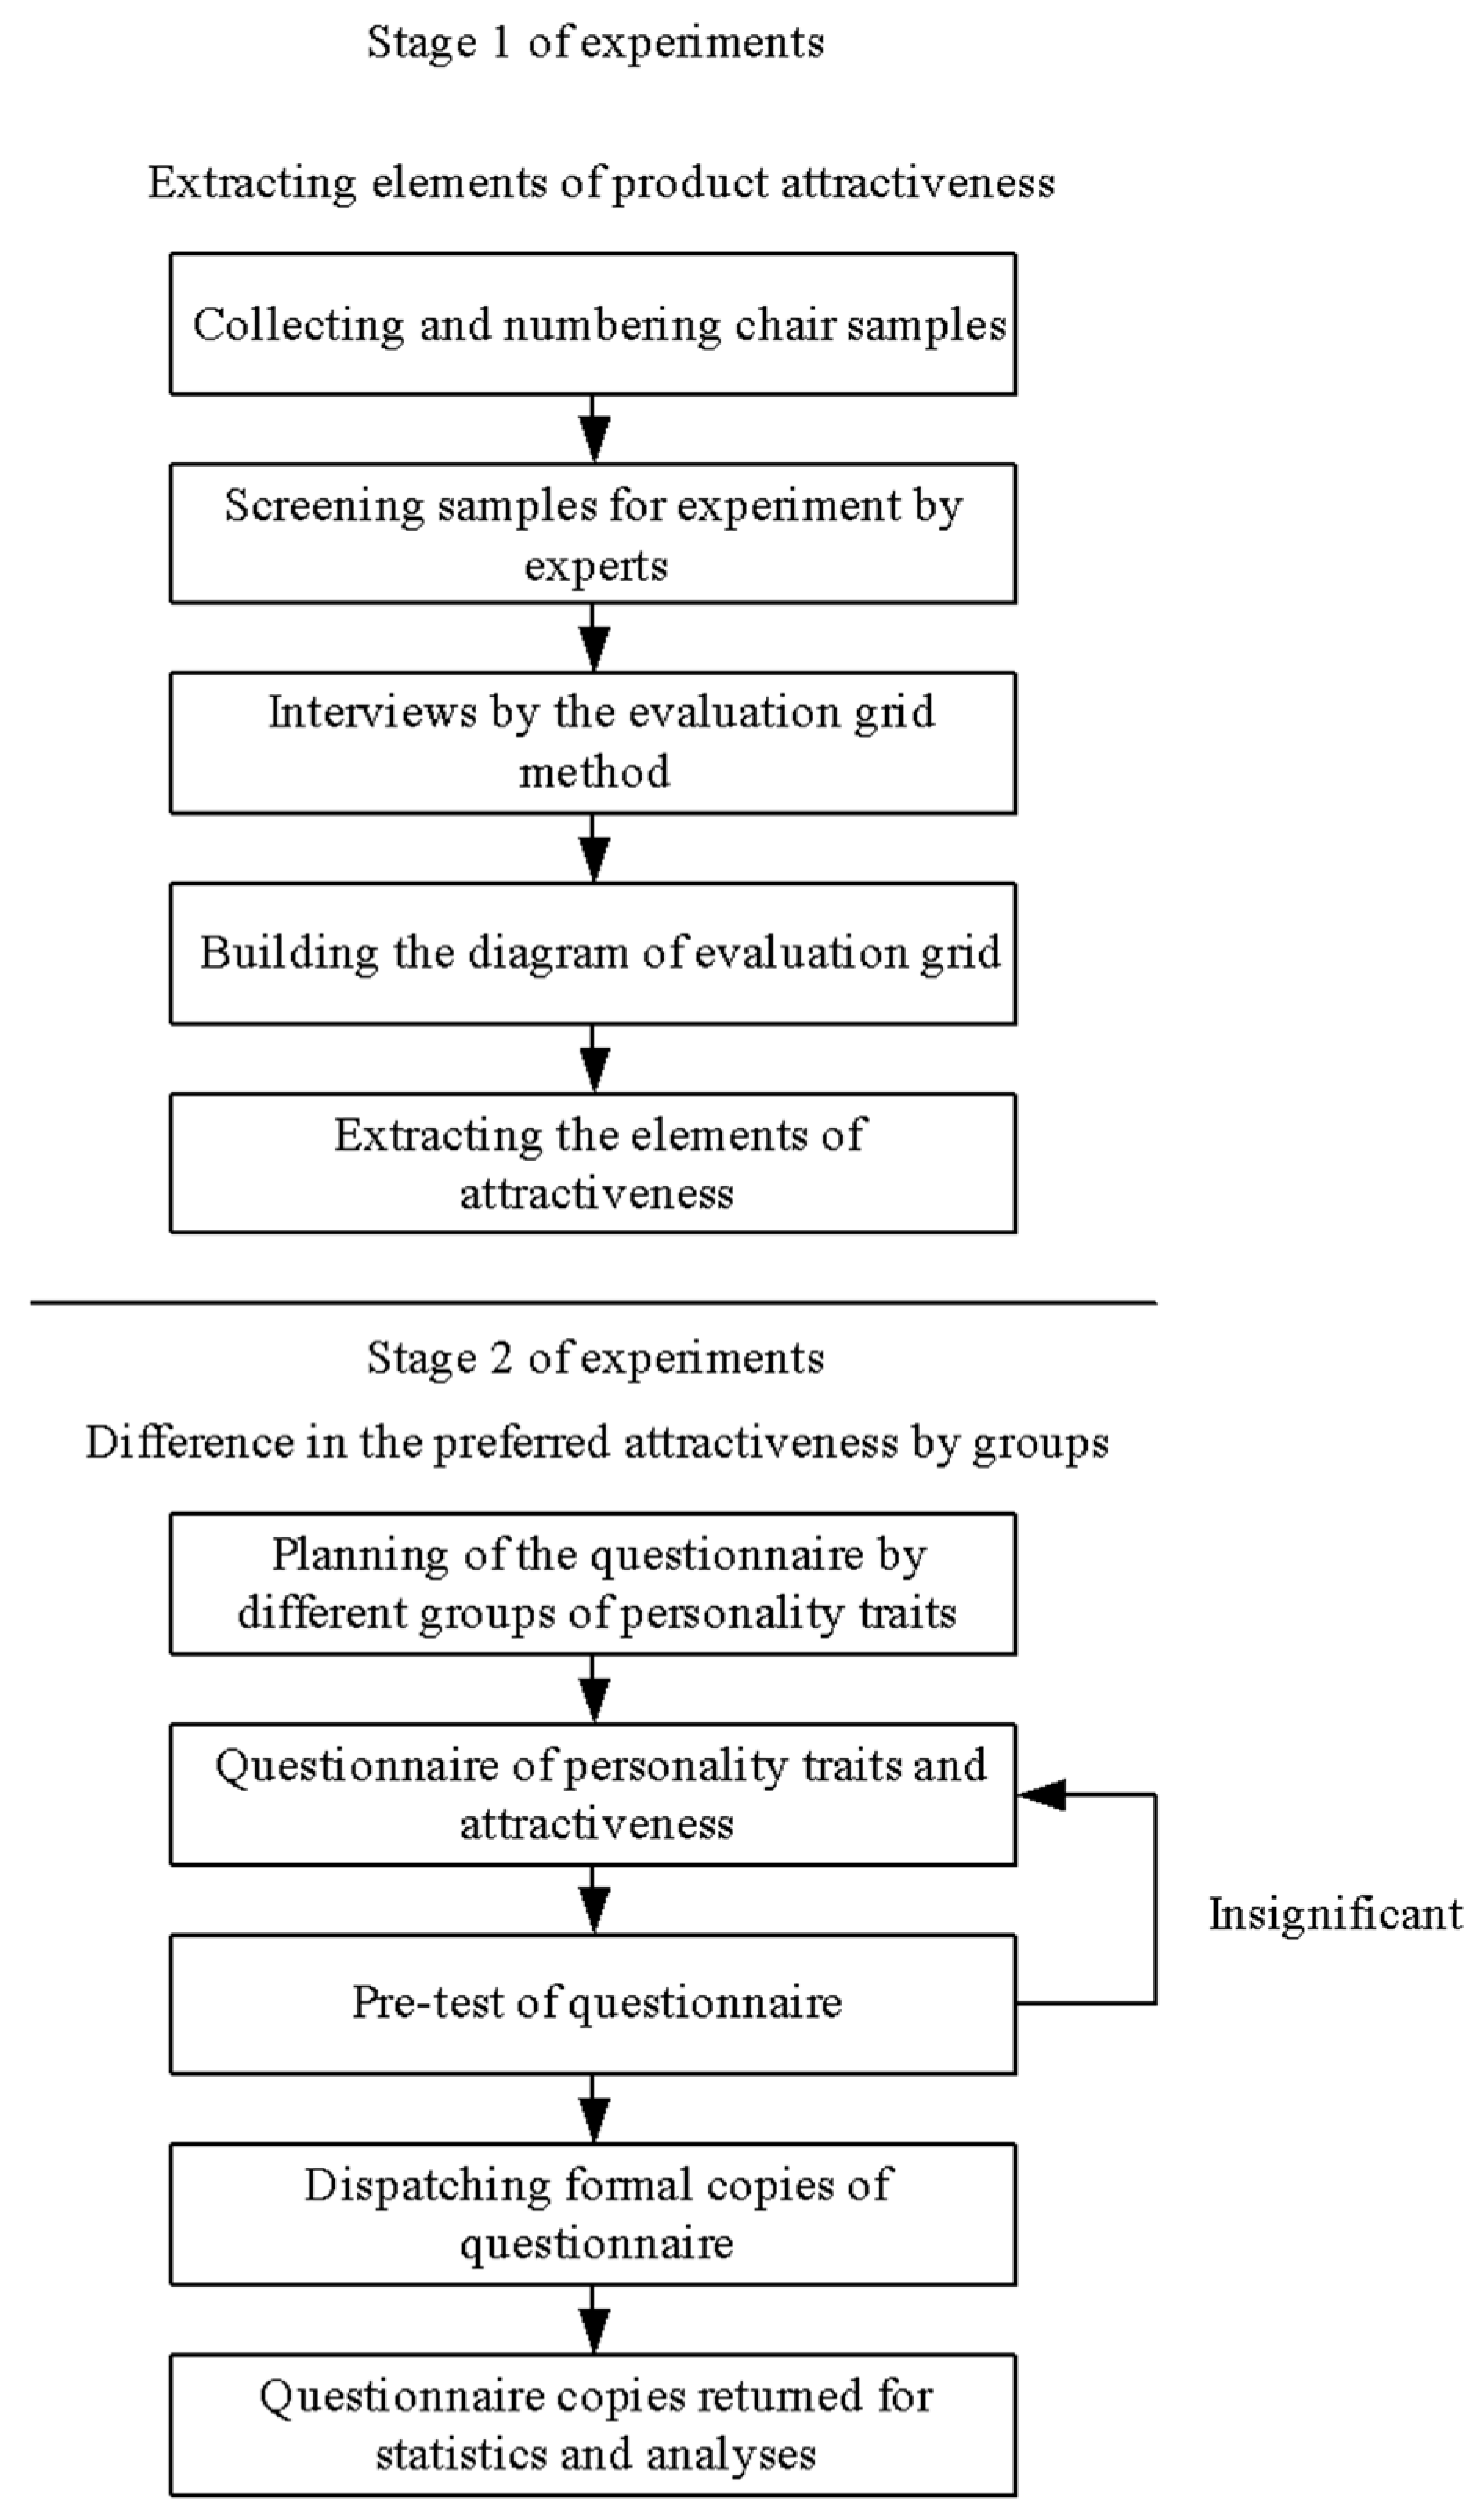
The research process in this study is divided into two stages. The approaches that are used during the investigation include EGM and quantification theory type I. The first step is to interview experts in the relevant fields by EGM for their opinion on the attractiveness factors of office chairs. After that, a questionnaire survey is carried out on a group of participants for their evaluation of the attractiveness of an office chair’s design elements. The results are analyzed by the quantification theory type I. The procedures of these two stages are shown in
Figure 3.
Experts who are familiar with office chair designs are invited for the interview in this study.
Table 3 indicates the criteria for qualifying those experts including furniture designers, furniture marketing personnel, and end users.
Based on the above criteria, 9 experts are invited for the interview in this study. Their background information is shown in
Table 4 and they are classified into three categories which include furniture designer, furniture marketing personnel, and end user.
The evaluation grid diagram that is obtained by interviewing Expert B1 is shown in
Figure 4. By summarizing the results of interviewing these 9 experts, a team of industrial designers applied the KJ Method to the items, including the abstract reasons, original assessments, and concrete reasons for further classification. The responses of approximate semantic meanings or participants of similar properties are classified into the same category. The items are renamed and the reference count of each factor is recorded.
The experiment in this study is carried out by qualitative interviews in the first stage and quantitative questionnaire surveys in the second stage. Experts are interviewed in the first stage by EGM for collecting the adjectives of an office chair’s attractiveness according to the experts’ opinions. These adjectives are included in the questionnaire with a scale of personality traits for a survey in order to determine the correlation between these adjectives and the design elements. The evaluation of office chairs by the participants of different personality traits is also analyzed. A total of 190 questionnaire copies were issued for the quantitative survey. Among them, 159 copies are online questionnaires and the other 31 copies are printed questionnaires. The survey was effective from 18 November 2016 to 2 December 2016. A total of 159 online copies and 30 printed copies were returned. After being reviewed and checked, the number of effective online copies is 92 and that of effective printed copies is 30. A total of 122 copies serve as the samples of this study.
3.1. Design of Questionnaire Contents
The questionnaire contents include vocabularies of concrete design elements and abstract office chair design items. Moreover, the end users are classified into different categories from the aspects of demographics and personality traits for the consideration of enhancing value and contribution of this study.
3.1.1. Demographic Variables
a. Gender
Participants are classified into male or female by gender and number 1 for male and number 2 for female.
b. Age
The age brackets of this study follow the definition by the Directorate General of Budget, Accounting and Statistics, Executive Yuan, Taiwan. The first age bracket is 21–30 years old during which most people’s first job starts, followed by 31–40, 41–50, and 51–65 which is the mandatory age for retirement.
c. Years of work experience
The years of work experience also follow the definition by the Directorate General of Budget, Accounting and Statistics, Executive Yuan, Taiwan as follows. The first segment is the freshman group with less than two years of experience, followed by 2–4 years, 4–6 years during which most office workers stabilize, and 6 years and above for the last segment.
d. Place of residence
The classification of the place of residence follows the definition by the National Development Council which divides Taiwan into four geographical areas including Northern, Central, Southern, and Eastern regions. Two more options including offshore islands and others are included due to the consideration that the participants might be from offshore islands or are non-ROC citizens.
e. Occupation
According to the classification by the Directorate General of Budget, Accounting and Statistics, Executive Yuan, there are 9 types of occupation. They include (1) agriculture, forestry, fishing and animal husbandry, (2) manufacturing, (3) government employees, (4) commerce/finance/insurance, (5) service industry, (6) food service industry, (7) broadcasting media industry, (8) arts and design industry, and (9) medical treatment and healthcare.
f. Monthly income
According to the classification by the Directorate General of Budget, the segments include NTD20,000 or below, NTD20,001–29,999, NTD30,000–39,999, NTD40,000–49,999, and NTD50,000 or above.
3.1.2. Personality Trait
In this study, the participants are classified into groups by their personality traits. A questionnaire survey was carried out by the personality trait questions and the attractiveness factors that were collected in the previous stage. Product features including material or color are also included for the questionnaire survey. A regression analysis is carried out to determine the preferences of different groups for office chairs.
The personality trait scale that was proposed by Wang [
18] by referring to the personality trait scale by Shen [
22] and the emotion scales by Chang [
14] is used in this study. The construct validity is examined and the questions are slashed or adjusted according to the updated personality trait scale for the experiment. During the process of factor analysis, Wang [
18] proposed that the openness and extraversion factors can be merged into one factor since the four-factor analysis is more stable than five-factor analysis. The variance explained for these four factors is 49.52%, and the coefficient of overall internal consistency is 0.83. There are a total of 33 questions which include outgoing and open (13 questions), neuroticism (7 questions), agreeableness (6 questions), and conscientiousness (7 questions).
3.1.3. Ranking of Preferences
The participants are asked to rank their preference of the 7 items at the abstract level as shown in
Box 1 according to their own experience and feelings. A score of 1 is used for the most favorite, with 7 for the least favorite, and so forth.
Box 1. Seven attractiveness factors to be ranked by respondents.
For an office chair, please rank these 7 attractiveness factors according to your own feeling. (1 for the most attractive and so forth.)
□ Slim, graceful, and easy-to-store
□ Simple, agile, and elegant
□ Comfortable, warm, and sturdy
□ Highly applicable
□ Special and unique
□ Vibrant and young
□ With the sense of design and texture
3.1.4. Questions for the Quantification Theory Type I
The convergent item at the abstract level serves as the main title of the quantification theory type I. There are 7 categories, and the first portion is the ranking of the importance at the middle level. This further corresponds to the single-choice questions for the vocabularies at the concrete level in the second portion as shown in
Table 5.
When carrying out the analysis by quantification theory type I, the personality traits are classified into five categories which include openness, conscientiousness, extraversion, agreeableness, and neuroticism. The objective is to determine the difference between the participants’ perceptions of office chairs with different personality traits.
4. Discussion
The experiment in this study is carried out in two stages which include the qualitative interview and quantization questionnaire. The interview in Stage 1 is carried out by the evaluation grid method. The attractiveness vocabularies proposed by the experts for an office chair are summarized. Based on the vocabularies and the personality trait scale, a questionnaire survey is carried out to verify the correlation between the attractiveness vocabularies and the design elements. The goal is to further understand the difference in the evaluation of office chairs by the groups of participants with different personality traits. A total of 190 questionnaire copies are dispatched for the quantization questionnaire. Among them, there are a total of 159 copies of the online questionnaire and 31 copies of the printed questionnaire. The questionnaire copies were dispatched between 18th November 2016 and 2nd December 2016. A total of 159 online copies and 30 printed copies were returned. After a thorough examination and screening, the count of valid online questionnaire copies was 92 and that of printed copies was 30. Therefore, the total number of valid specimens in this study is 122, and the composition is described as follows.
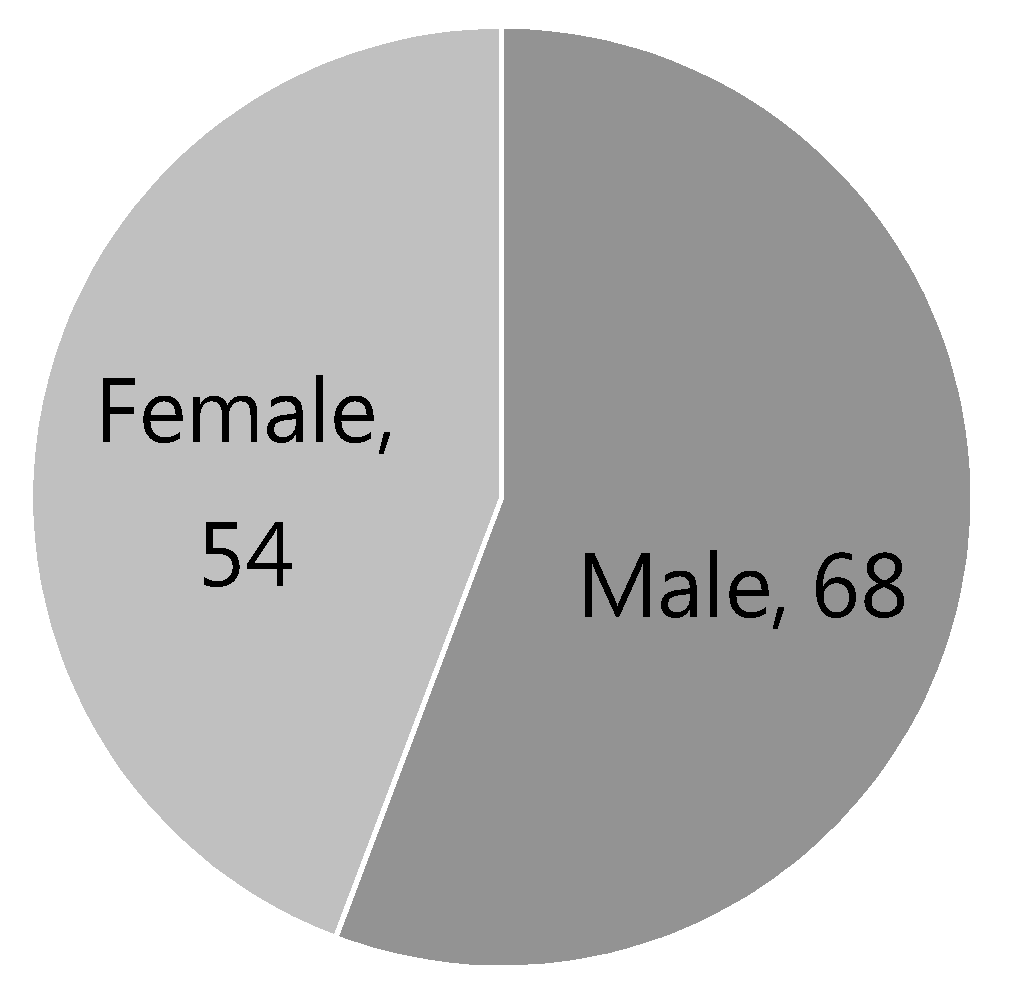
a. Gender
Among these 122 respondents, 68 of them are male and this accounts for 56%. On the other hand, 54 of them are female and this accounts for 44% as shown in
Figure 5.
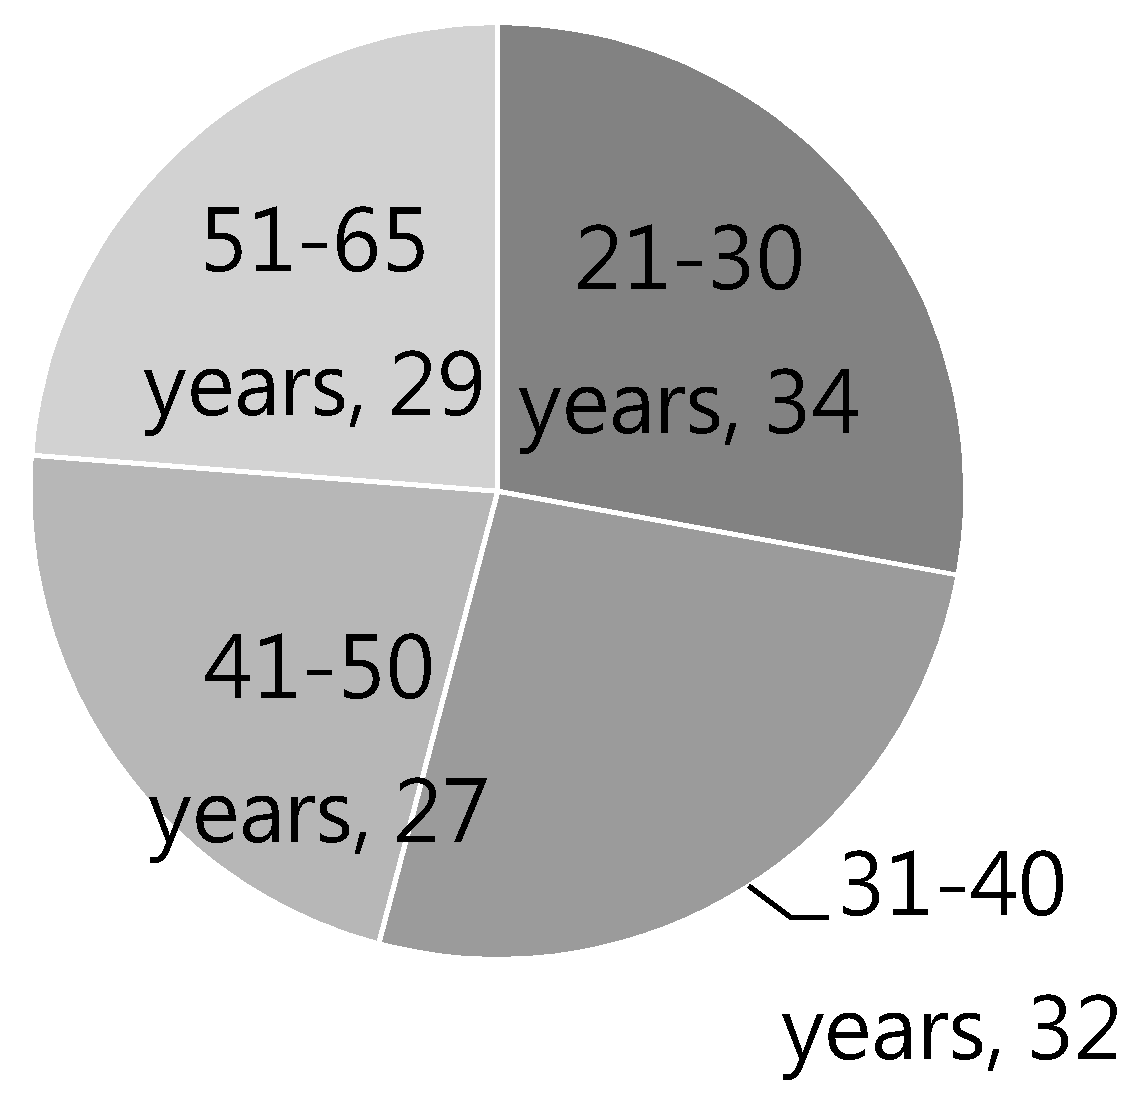
b. Age
There are four age brackets from 21–65 years old. The number of respondents between the ages of 21–30 is 34, that of respondents between 31–40 is 32, that of respondents between 41–50 is 27, and that of respondents between 51–65 is 29 as shown in
Figure 6.
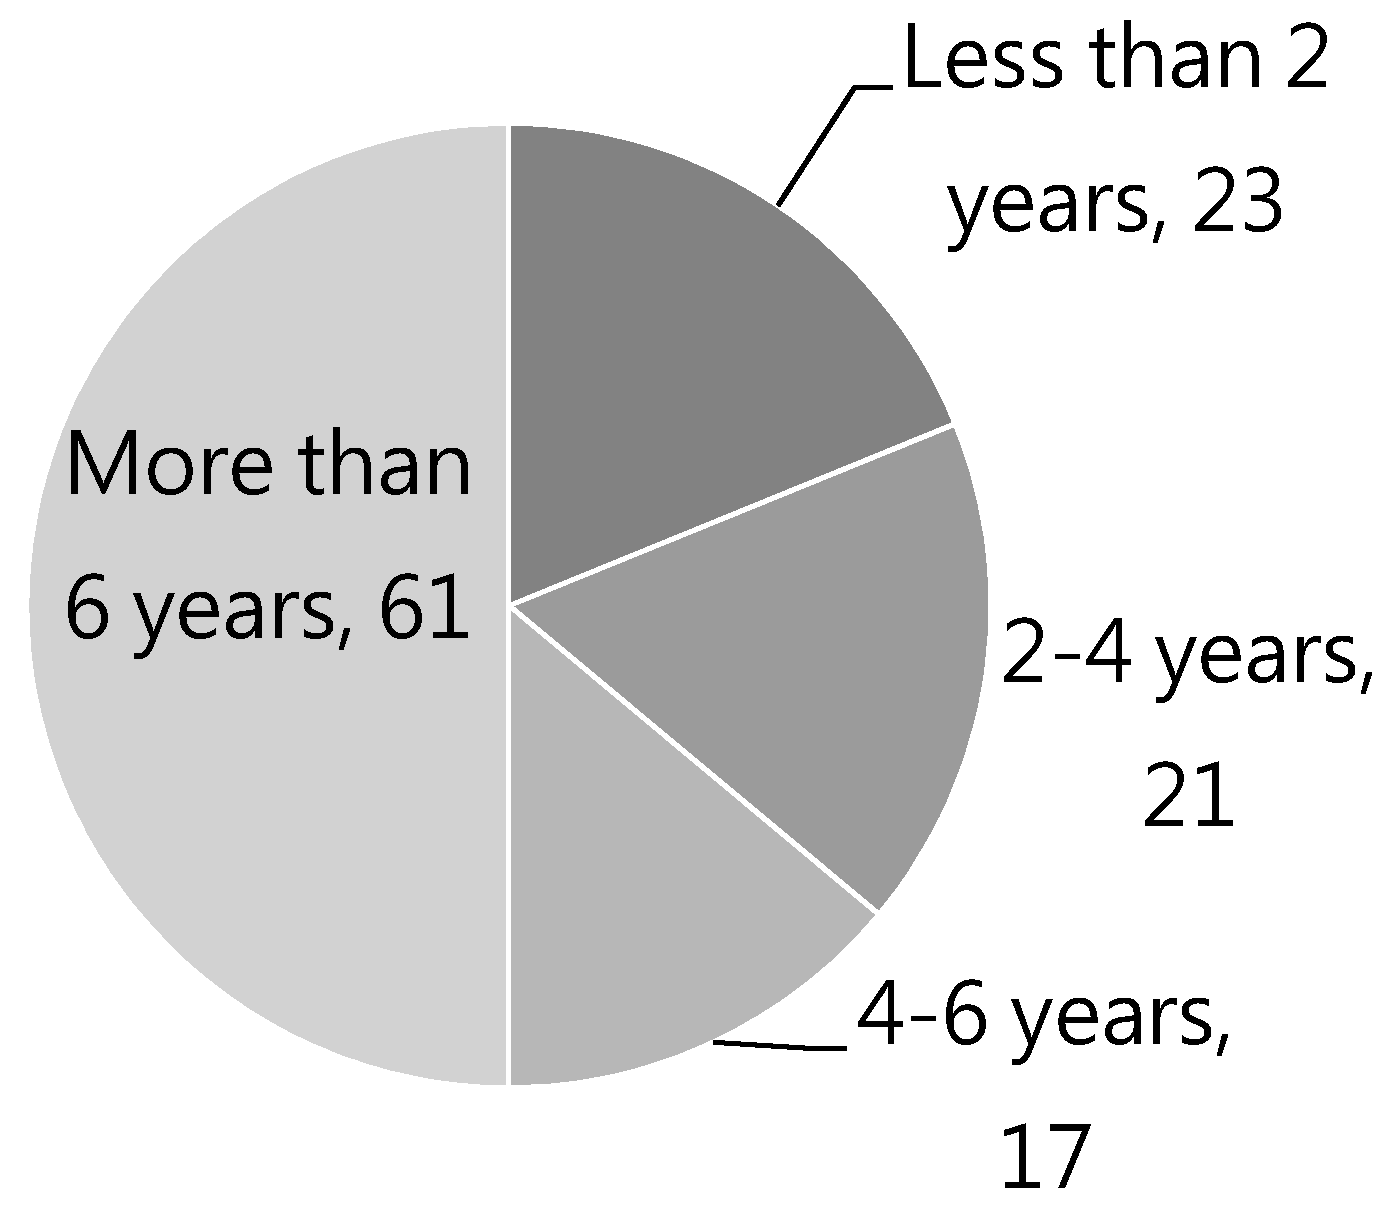
c. Years of work experience
By referring to the data from 1111 Job Bank, the years of work experience is divided into four segments which include less than 2 years, 2–4 years, 4–6 years, and more than 6 years. Among the respondents, 23 of them are less than 2 years, 21 of them with 2–4 years of work experience, 17 of them with 4–6 years, and 61 of them with more than 6 years of work experience as shown in
Figure 7.
d. Place of residence
The classification of the place of residence follows the definition by the National Development Council, which divides Taiwan into four geographical areas including Northern, Central, Southern, and Eastern regions. Since there is a limitation on the online respondents’ region, an option is included into the questionnaire so that respondents who do not live in Taiwan can also participate. After reviewing the returned questionnaire, the number of correspondents who live in Northern Taiwan is 37, 39 of them live in central Taiwan, 60 of them live in Southern Taiwan, and four of them live in Eastern Taiwan as shown in
Figure 8. No respondent chooses the option of
Others.
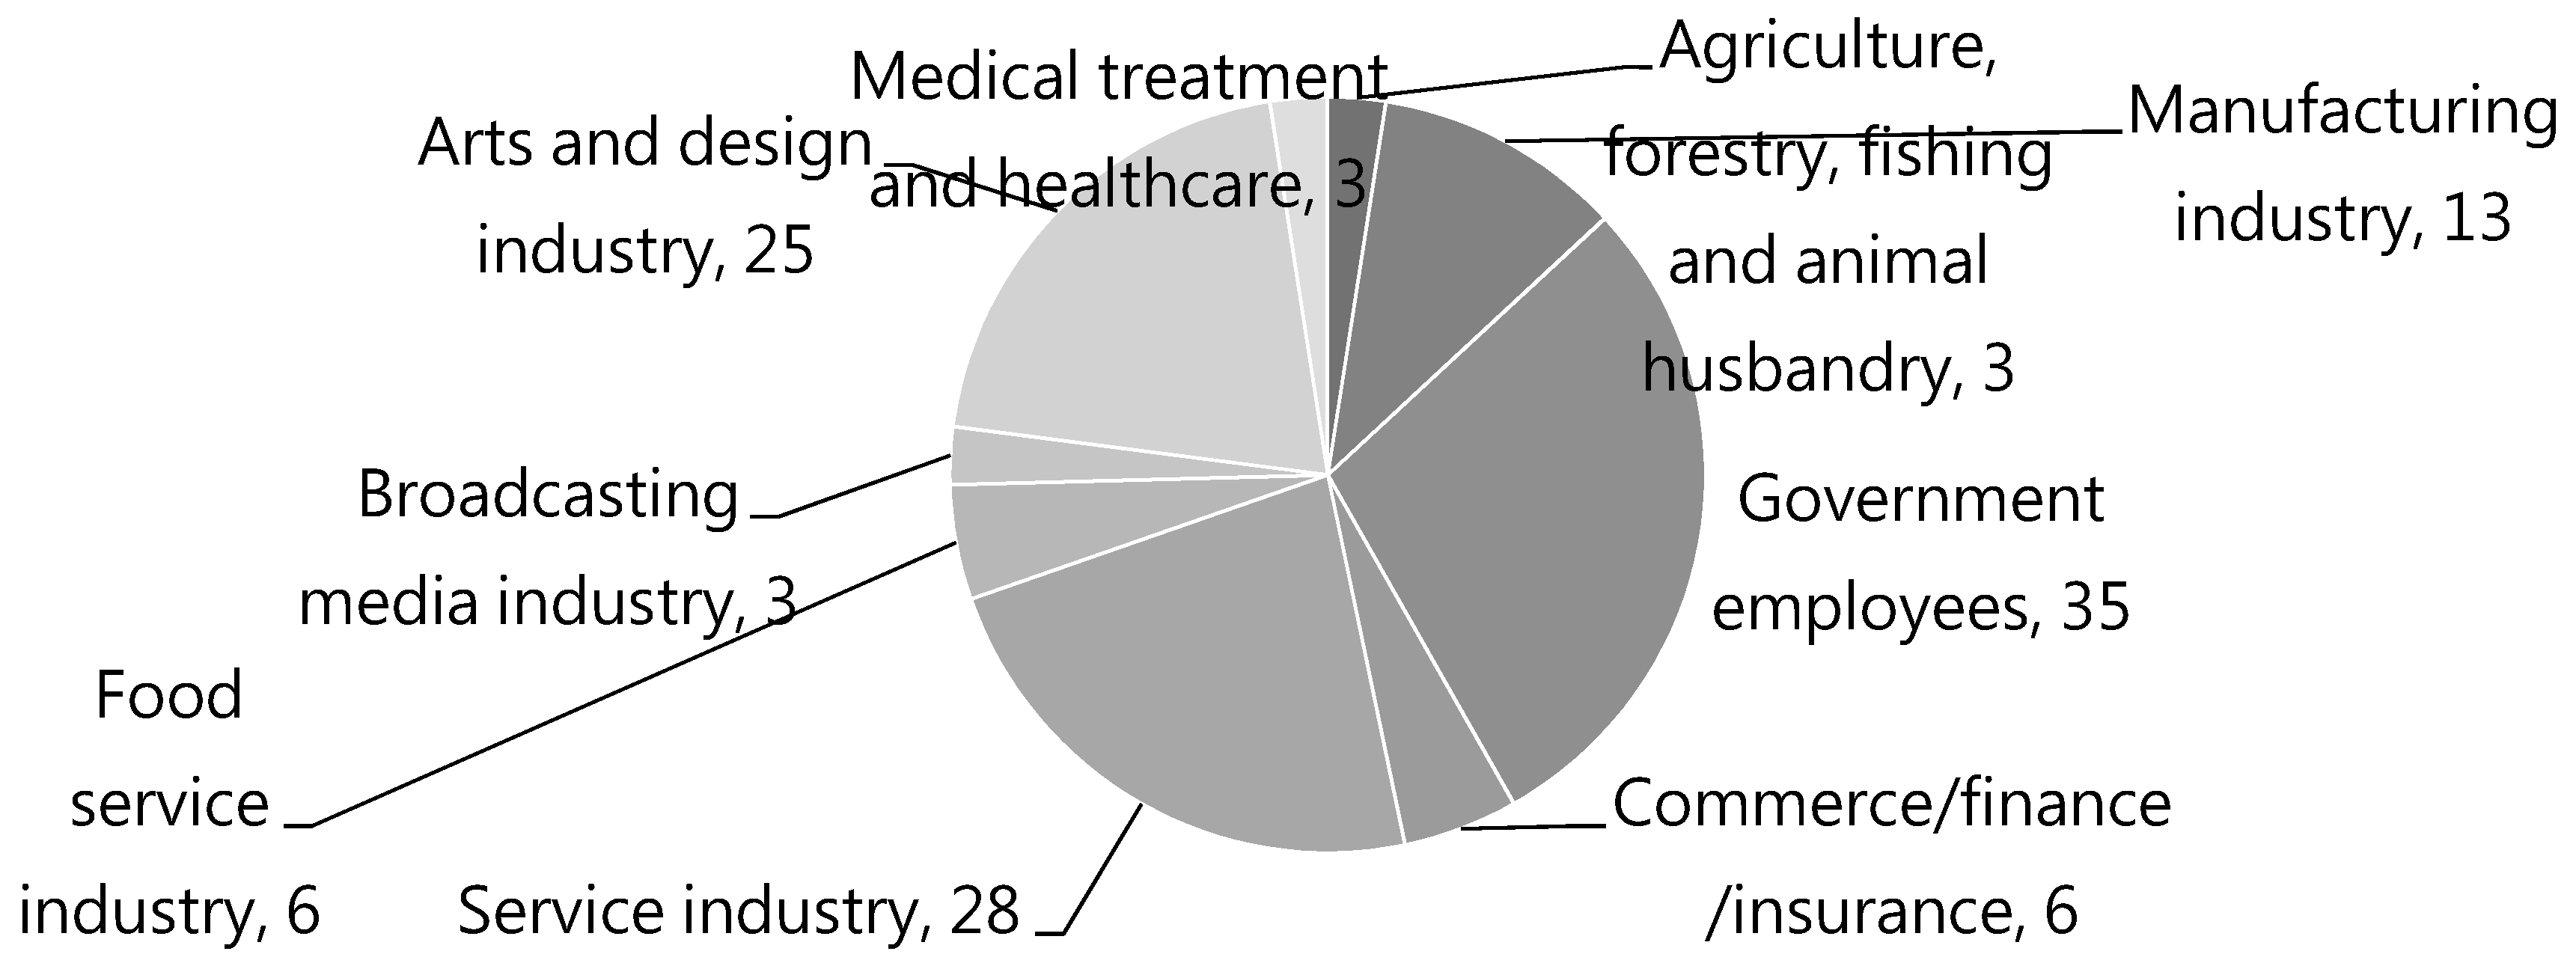
e. Occupation
By referring to the classification by the Directorate General of Budget, Accounting and Statistics, Executive Yuan, the respondents are classified into nine categories. The numbers of respondents are three in the agriculture, forestry, fishing and animal husbandry industry, 13 in the manufacturing industry, 35 as the government employees, six in the commerce/finance/insurance industry, 28 in the service industry, six in the food service industry, three in the broadcasting media industry, 25 in the arts and design industry, and three in the medical treatment and healthcare industry as shown in
Figure 9.
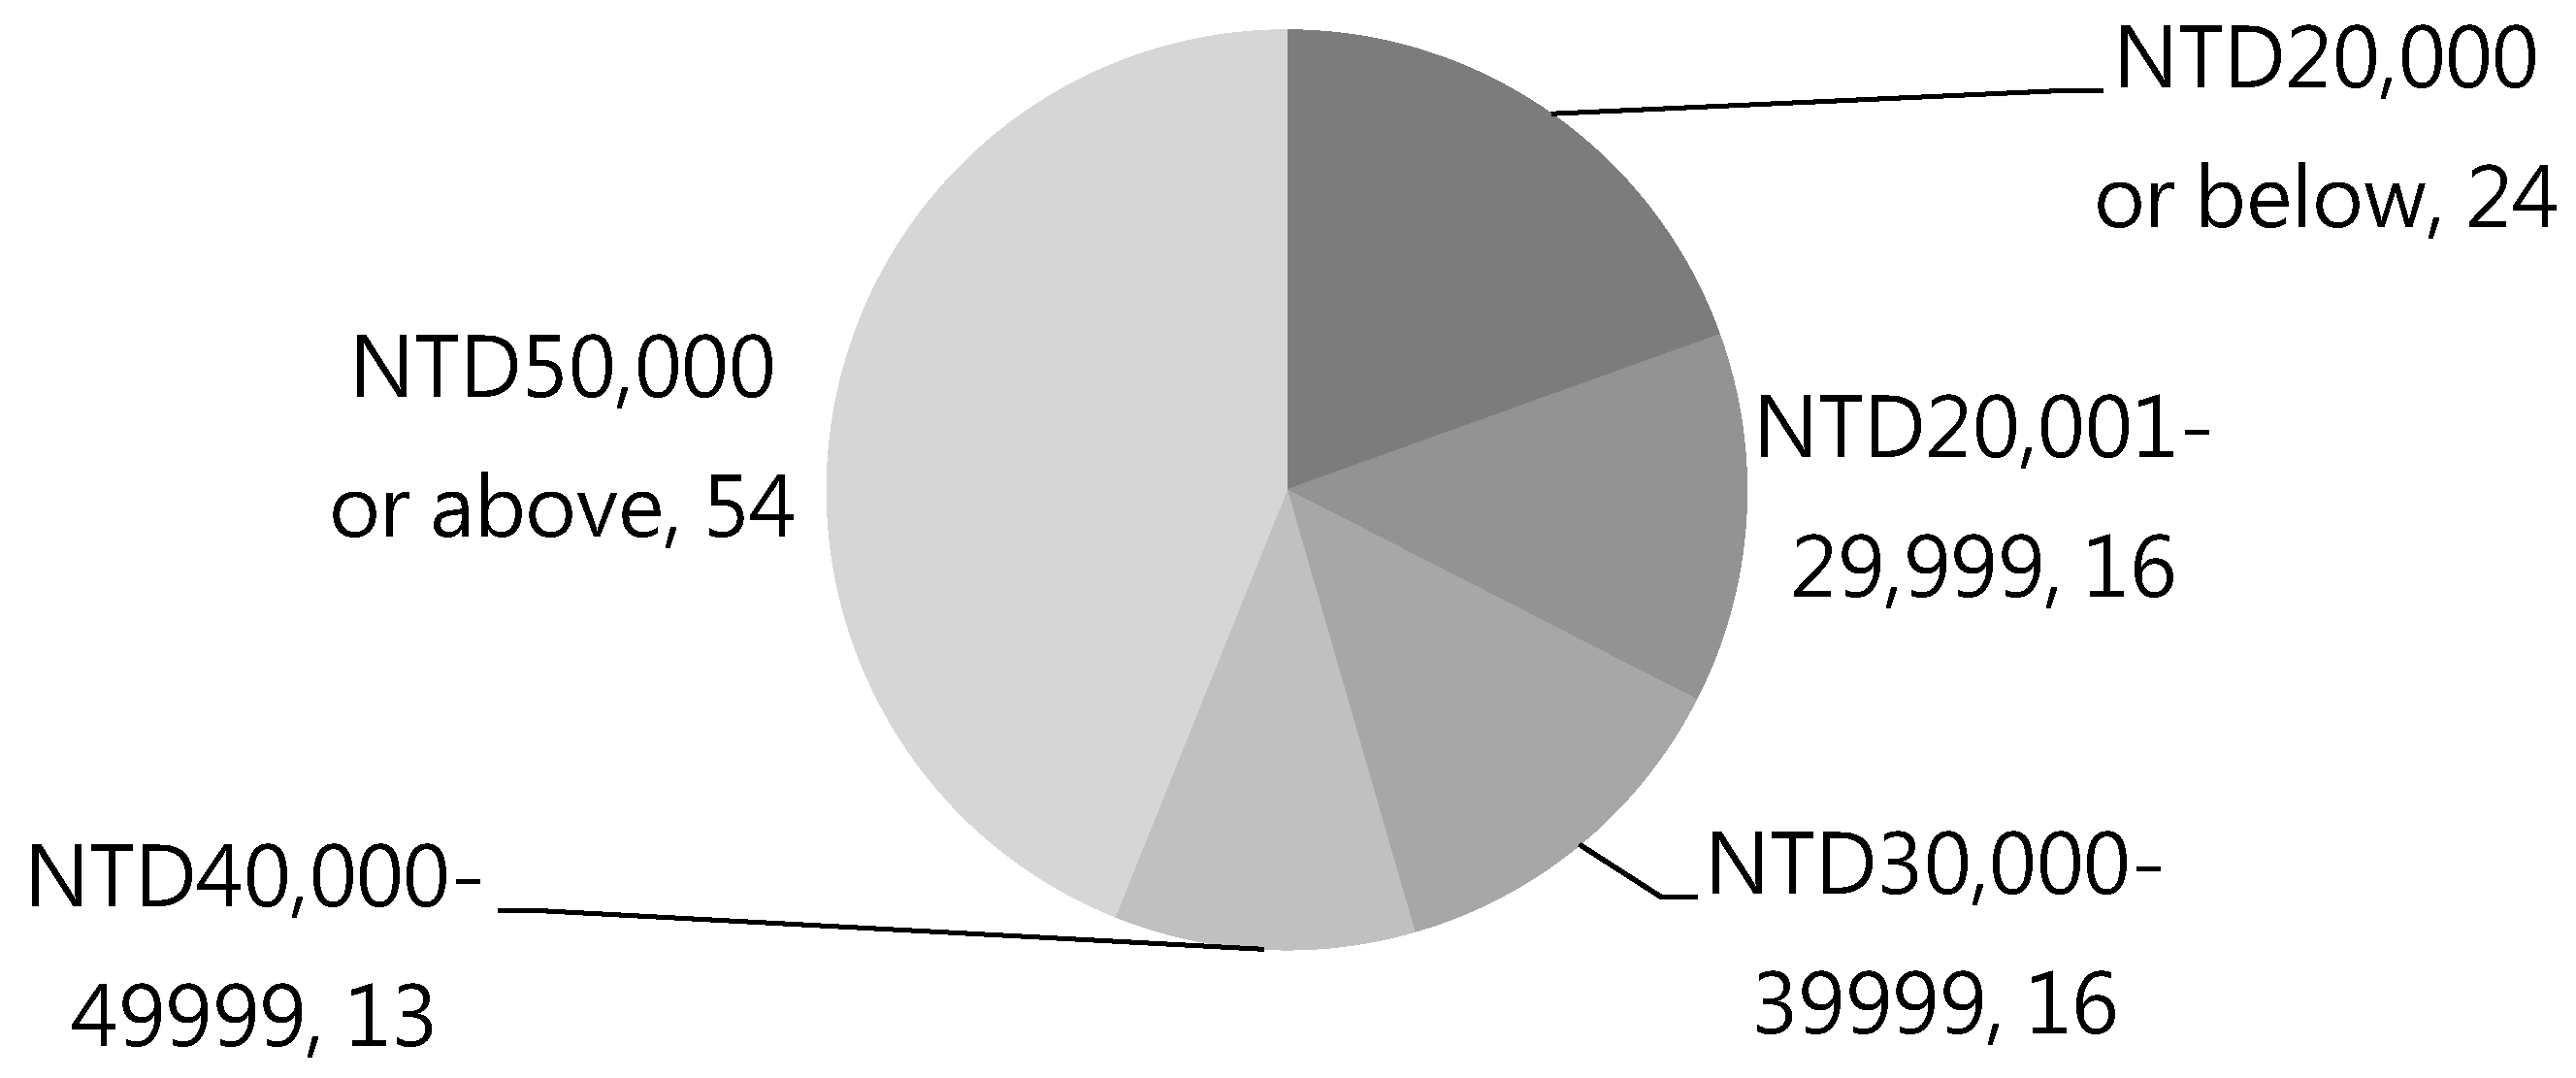
f. Monthly income
According to the statistics by 1111 Job Bank, the monthly income of the respondents is classified into five categories which are respectively NTD20,000 or below, NTD20,001–29,999, NTD30,000–39,999, NTD40,000–49,999, and NTD50,000 or above. Among the respondents, 24 of them have a monthly income of NTD20,000 or below, 16 of them in the range of NTD20,001–29,999, 16 of them in the range of NTD30,000–39,999, 13 of them in the range of NTD40,000–49,999, and 54 of them have a monthly income of NTD50,000 or above as shown in
Figure 10.
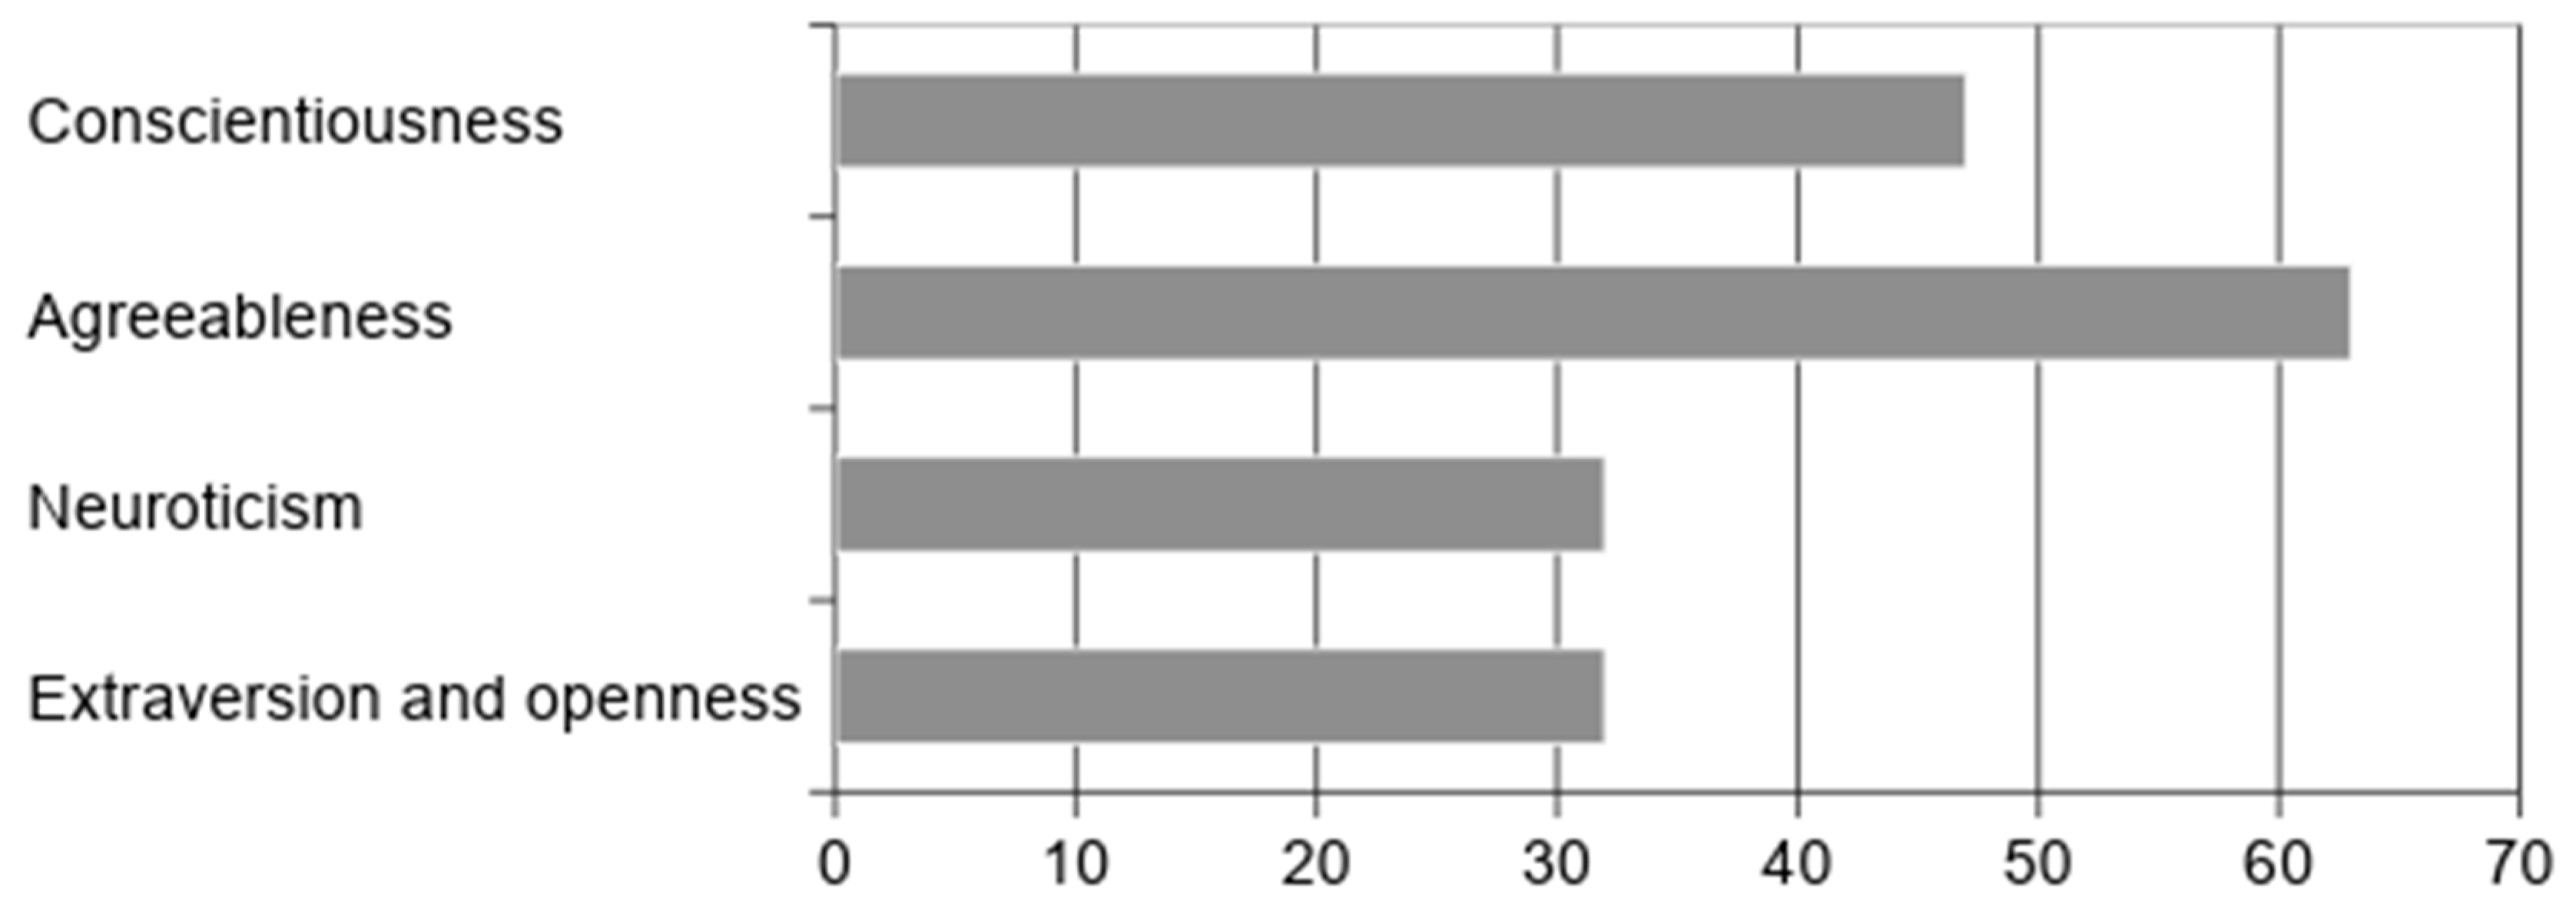
g. Personality trait
The classification by personality trait in this study follows the approach that is proposed by Wang [
18] in her study of the reliability and validity of five major types of personality traits. The types of extraversion and openness are merged into the same category. Therefore, there are a total of four categories which include extraversion and openness, neuroticism, agreeableness, and conscientiousness. The score of each respondent’s personality trait is assessed by a five-point scale.
Since the personality trait of each respondent is still unknown during the process of the questionnaire survey, the questionnaire results need to be analyzed in order to determine each respondent’s type of personality trait. To ensure a sufficient amount of specimens for the analysis by quantification theory type I, the most apparent personality trait of each respondent is recorded. If the number of a specific type of personality trait is not sufficient for analysis, the personality trait of the top 32 scores for all respondents is selected as the representative personality trait. As a result, the personality trait of a respondent might belong to two different categories.
The results of the analysis as shown in
Figure 11 indicated that the respondent counts of the extraversion and openness and the neuroticism types are insufficient for the quantification analysis. Therefore, the personality traits of the top 32 scores for the respondents with the extraversion and openness and the neuroticism types are selected as the representative personality traits.
After the analysis by quantification theory type I on these 122 questionnaire copies, the design elements of slim, graceful, and easy-to-store are summarized in
Box 1 and
Table 5. The categories include five design elements which are chair style, color, material, texture, and function. Several sub-categories can be derived from each of the design elements.
The items are ranked in
Table 6 according to the partial coefficient of correlation. The independent variables of each item are ranked in
Table 7 according to their scores. The plus or minus sign indicates whether they are positively correlated or negatively correlated. A negative sign indicates the item is more suitable. The overall ranking is determined by summing up the scores in the sub-categories for each of the variables.
The scores of the design elements under the “slim, graceful, and easy-to-store” category indicated that the top three design elements are texture, style, and color. Moreover, the top three sub-category items that present positive effects are, respectively, vegetation color scheme, chair style with simplicity, and cabriole legs and splat integral form. By reviewing the opinions of the participants, it was found in this study that an office chair is viewed as slim, graceful, and easy-to-store only if it is composed of the following elements:
- (1)
Texture: The partial coefficient of correlation of an office chair’s texture has the highest score. Among the sub-category items of texture, delicate metal processing has the highest score. It can be reasoned that the delicate metallic texture is a critical factor that makes people feel that an office chair is slim, graceful, and easy-to-store.
- (2)
Style: Among the style category, chair style with simplicity has the highest score. In our opinion, a slim, graceful, and easy-to-store office chair should present a style design with simplified and streamlined features, but without much decoration or complex style. Cabriole legs and splat integral form have the second highest score among the items within the style category, and presents positive correlation. It can be reasoned that the chair streamline is brief with cabriole legs and a splat integral form. This makes a chair more lightweight and portable when moving around.
- (3)
Color: The partial coefficient of correlation of an office chair’s color is ranked third. Among the sub-category items of colors, vegetation color scheme has the highest score, and it is also the highest among all sub-category items. Therefore, it can be reasoned that in order to create a design of a slim, graceful, and easy-to-store office chair, the vegetation color scheme will be considered first since it delivers a mild and stain-resistant image. It is not as heavy as black or as other dark color schemes.
By analyzing the data of the slim, graceful, and easy-to-store category for different personality traits as shown in
Table 8, it was found that the design element of color presents a highly positive correlation with the perception of slim, graceful, and easy-to-store for all of the participants. For participants with agreeableness and neuroticism personality traits, the item that can best present the perception of slim, graceful, and easy-to-store is the dark tone.
For participants with the openness personality trait, an office chair with a vegetation color scheme and small caster diameters can best present the perception of slim, graceful, and easy-to-store. For participants with the neuroticism personality trait, the required factors for a slim, graceful, and easy-to-store office chair include a soft and comfortable cushion, dark tone, and delicate metal processing. For participants with the agreeableness personality trait, an office chair is viewed as slim, graceful, and easy-to-store when it has bundled decorations included, thin metal cabriole legs, and is in dark tone. For participants with the conscientiousness personality trait, a slim, graceful, and easy-to-store office chair is required to have a comfortable armrest and should be in gray and/or red color scheme.
5. Conclusions
Via interviews and experiments, the attractiveness factors of office chairs and the differences in the evaluation of an office chair’s attractiveness as rated by users with different personality traits are investigated in this study. With regards to the demands of increasing quality of life, the design of office chairs can be improved by referring to the results that are obtained in this study.
The attractiveness factors of an office chair are determined by the EGM and by in-depth interviews. The correlation between various design elements such as style, color, material, texture, and function are also determined. A total of seven abstract categories and 27 concrete design items are summarized. By analyzing the samples, the concrete criteria and attractiveness evaluation of these seven categories are also clarified.
The evaluation of office chairs’ attractiveness by users with different personality traits is analyzed by interviews with experts and a questionnaire survey. The difference in the evaluation of office chairs for different personality traits is also investigated. However, since there are a limited number of images for those office chairs that are available on the market, some design elements might not have a corresponding chair image for the evaluation. In this case, participants are asked to choose a representative image depending on the importance of those design elements. A person’s personality trait might reflect his/her occupation and job role. The requirements for an office chair could also be different depending on the work environment or company orientation. After the target application scenario is confirmed, a furniture designer or interior designer is advised to refer to the proposed approach in this study so that he/she can determine the optimal design of office chairs by considering the personality traits of the target users.
At the current stage of this study, we inevitably encountered challenges and limitations during the research process and the results are still incomplete in several aspects. There are still other design factors for an office chair design and these factors could be further investigated. In order to improve the incompleteness of this study, researchers are advised to carry out follow-up studies from the several aspects which are described as follows:
Since the personality traits of the respondents are unknown during the stage of dispatching the questionnaire, the divide between the results of the returned questionnaires of the different groups is large. Due to the limited amount of resource and time, the most representative personality traits are selected from the overall results in order to meet the minimum required amount of specimens. However, data conflicts are occasionally observed due to the insufficient amount of test specimens so that analysis by the quantification theory type I failed to generate a confirmed result.
With the limited resource and time, the questionnaire survey was conducted with a combination of online questionnaire copies and some printed copies. The returned online questionnaire copies indicated inferior quality to the printed copies. Since we are not able to control the identity of the respondents or the circumstances of when they filled in the questionnaire, the obtained results are affected by these uncertain factors accordingly.
After the vocabularies obtained by the evaluation grid method were converged, some of the renamed abstract vocabularies were too vague for the respondents to generate a correct image relating to the vocabularies, and they did not focus on the right definition, so the results of the quantification theory type I are affected.
Since the respondents are limited to the Taiwan region, this study focuses on the perception of office chair designs for Taiwanese people. However, some office chairs of Western styles are quite different from the Eastern styles that are collected for this study. Most of the offices in Taiwan still offer old-style swivel office chairs, which could present very different perceptions to the respondents as compared to new Western style chairs.
Since most of the respondents are experts from the furniture-related industry, they use some vocabularies which are different from what common consumers use. Therefore, this leads to minor differences between their perceptions when filling in the questionnaire. Follow-up studies are advised to interview more experts from this industry and end users in order to determine the difference between their perceptions of office chairs.


