Review

Climate Change and Transport Infrastructures: State of the Art

Department of Civil, Construction and Environmental Engineering, Sapienza University of Rome, 00184 Rome, Italy
*
Author to whom correspondence should be addressed.
Sustainability 2018, 10(11), 4098; https://doi.org/10.3390/su10114098
Submission received: 18 September 2018 / Revised: 20 October 2018 / Accepted: 29 October 2018 / Published: 8 November 2018

Abstract

:
Transport infrastructures are lifelines: They provide transportation of people and goods, in ordinary and emergency conditions, thus they should be resilient to increasing natural disasters and hazards. This work presents several technologies adopted around the world to adapt and defend transport infrastructures against effects of climate change. Three main climate change challenges have been examined: Air temperatures variability and extremization, water bombs, and sea level rise. For each type of the examined phenomena the paper presents engineered, and architectural solutions adopted to prevent disasters and protect citizens. In all cases, the countermeasures require deeper prediction of weather and climate conditions during the service life of the infrastructure. The experience gained supports the fact that strategies adopted or designed to contrast the effects of climate change on transport infrastructures pursue three main goals: To prevent the damages, protect the structures, and monitor and communicate to users the current conditions. Indeed, the analyses show that the ongoing climate change will increase its impact on transport infrastructures, exposing people to unacceptable risks. Therefore, prevention and protection measures shall be adopted more frequently in the interest of collective safety.

1. Introduction

The results of the Fifth Assessment Report (AR5) edited by the Intergovernmental Panel on Climate Change (IPCC) show that human activities are changing the global climate system and the warming of the climate system is unequivocal [1]. This document highlights the effects of current global warming that can cause negative impacts for ecosystems and people in several areas of the planet. The report AR5, released in four parts between 2013 and 2014, focuses on the results of the climate predictions conducted under the Coupled Model Intercomparison Project (CMIP5) using the Representative Concentration Pathways (RCP) as anthropogenic forcing scenarios. According to activities of the World Climate Research Program (WCRP), the AR5 shows that for global-scale analysis the mean surface temperature will increase by at least 0.61 °C within the XXI century in respect to the period 1850–1900. In addition, extreme heat events (e.g., heat waves) will be more frequent on most emerging lands and the average global sea level may rise to a range of 0.45 to 0.82 m due to the increased heating of the oceans and mass loss from glaciers and ice caps [2]. These consequences will have social, economic and environmental effects, such as risk of disasters, water stress, food security, health risk, exploitation of natural resources, social and economic conflicts and migrations [3,4]. In addition, extreme climatic events that will not be prevented but only mitigated will occur more frequently and precipitation patterns will become more extreme [5]. Calamitous events as consequence of weather and climatic processes raise the need to foresee adaptation measures to climate change, which is already in place [6]. This concern has led the European Union to adopt in 2013 the EU Strategy on adaption to climate change [7]. It also includes action which will ensure more resilient and climate-proof transport infrastructures.
Changes in weather patterns directly impact transport infrastructures, which play a strategic role in emergency management. Indeed, they both ensure transport mobility and accommodate infrastructures which provide the essential needs of the population, as energy, telecommunications, water, wastewater, health and safety networks, sewage systems [8]. For these reasons, transport network is a lifeline [9], and its vulnerability from natural hazards exposes people to additional risks. In 2014, the European Environmental Agency [10] published the report “Adaptation of transport to climate change in Europe”, analyzing the importance of climate-proof transport infrastructure and operations. The main climate change challenges which interfere with transport infrastructures are extreme air temperatures (e.g., heat waves and harsh winter weathers), flooding, storms, and sea level rise (SLR) [11,12].
The aim of this paper is to present and discuss the effects of climate change on transport infrastructures and the counter-measures taken by road agency bodies at an international level. The examined solutions are useful to identify and improve the processes and technology currently and usually used in the road management strategy to reduce the vulnerability of transport systems and users and to boost the service of this strategic sector.

2. Research Methodology

In this study, the Systematic Literature Review defined by Kitchenham was performed [13]. It allows identification, analysis and interpretation of available data about a research question, area or investigated phenomenon. According to the evidence of Reference [11], the goal of the study is to identify and analyze research relevant to the influence of climate change on transport infrastructures: Manuscripts that contribute to the Systematic Literature Review are primary studies, while this manuscript is a secondary study.
Peer-reviewed articles on the impact of climate change with respect to urban transport infrastructures, published between 2007 and 2018, were included. The main search strategy was automatic and involved the following peer-reviewed databases: Scopus and Web of Science. Furthermore, a manual search activity was performed as consequence of the results obtained in the automatic process and involved papers published since 2004. This activity involved both peer-reviewed, and not, documents. Finally, classical sources, standards and regulations were considered, whatever their publication year.
Planning, Conduction, and Reporting results are the three main phases of the Systematic Literature Review. They include:
  • Planning: Identification of the need which justifies the Systematic Literature Review. Particularly, the research questions are:
    What are the physical conditions induced by the climate change which interfere with transport infrastructures?
    Which are the methods and the technological solutions investigated at international level?
    What are pros and cons of the best practices adopted by road agency bodies?
  • Conduction: Implementation of the search strategy which is compliant with the protocol defined in the previous phase;
  • Reporting results: Description of the results, answers to the goal of the study, and discussion of the results [14].
After the final application of the work selection strategy, a total of 108 documents were identified: A total of 72 are primary studies (i.e., peer-reviewed indexed research papers), 5 are secondary studies (i.e., reviews), and 15 are classical sources, standards and regulations. Overall, 100 documents are published not earlier than 2004.
These works permitted the authors to make a critical assessment of the state of the art and answer the research questions.

3. Temperature

In the next decades, the globally observed temperature trends will exacerbate warming especially in urban areas [15,16]. The increase in temperatures causes a greater vulnerability of common road pavements (with surface layer composed of asphalt concrete) and rail (track), increases the energy demand to operate buses, especially for auxiliaries [17], which is perceived by the fleets managers as one more items in the overall lists of operational costs [18,19], and worsens the public’s living conditions. The urban heat island (UHI) related to extreme heat events (EHE) is caused by the urban development, which has reduced natural surfaces, constructing impermeable and large obstacles [20]. Indeed, buildings absorb heat during the day and release it during the night, moreover they hinder the wind circulation (Figure 1).
Moreover, impermeabilization of anthropized areas (i.e., buildings and transport infrastructures) negatively affects the evapotranspiration, reducing the heat absorption from the air [21]. Modification of land use and increasing building density leads to new, severe urban climates and require planning schemes to improve urban livability [22] with cost-effective measures [23].
Urban Green Infrastructures (UGI) can provide important benefits and mitigate consequences of Urban Gray Infrastructures: The first ones include all types and spaces cover by vegetation, the second ones are all artificial structures and infrastructures which constitute the city (Figure 2).
Thermal properties of gray infrastructures negatively affect the UHI phenomenon: Physical analyses of the gray infrastructures allow the calculation of heat and temperature distributions. Trees, green open spaces, green roofs and vertical greens are therefore designed to increase evapotranspiration and decrease heating of the local urban atmosphere [25]. This approach requires multidisciplinary contributions: Design of UGI includes topographical, physical, meteorological, hydrological, botanical, and material-related skills [26]. The final solution requires the municipality to adopt a plan of installation and maintenance of vegetation, especially when the weather is very hot. UGIs give interesting results in Mediterranean or warm temperate climates, while this active approach gives lower cooling benefits in more severe, hot, dry climates.
Road pavements are public surfaces which could be designed and managed by the municipality to contrast the formation of UHIs [27]. These types of infrastructures cover about 40% of urban surfaces, as estimated by Akbari et al. [28]. Thermal characteristics of their surface materials significantly affect the phenomenon. Asphalt concrete, the most used road pavement material, and dark pavement materials, significantly contribute to UHI, as confirmed by Mohajerani et al. [29]. Low albedo of black surfaces is responsible of absorption of solar heat: Asphalt concrete absorbs 95% of solar energy, while cement concrete has minimum solar reflectance equal to 40% [30]. The different thermal characteristics of these materials are recognized by Doulos et al. [31] as a strategic challenge in cooling urban spaces. Comparison of air temperature above reflective concrete, porous asphalt, porous concrete, porous concrete pavers pavement, and conventional asphalt pavements [32] shows the difference between these materials in terms of heating an urban landscape. Thermal infrared images confirmed that the albedo significantly contributes to the urban microclimate [33]: If compared to bituminous pavements, the concrete ones have lower surface temperature, as confirmed by several researches (e.g., References [34,35]).
Other cooling solutions consist of:
  • Solar heating reflective coating layer (SHRCL) [36];
  • Using white materials (e.g., pigments, binders, light aggregates, white topping, reflective paints) for surface layer of road pavement [37];
  • Circulation of a fluid in the pavement to remove the excess heat [38,39].
Permeable pavements are a technology which joins the UGI and cool pavement approaches. Pavements are composed of porous materials and meteoric water moves inside of their voids: It can flow through the material changing the external weather conditions. When it rains, the voids fill up and store the water; when the pavement temperature increases, the water evaporates. The evaporation process subtracts heat to the pavement and therefore reduces its surface temperature. Vegetative permeable pavements add the transpiration benefits to the evaporation ones. The presence of vegetation into the modular blocks, which compose the pavement, allows plant transpiration from the road pavement to the atmosphere. Both non-vegetative and vegetative pavements are suitable for humid climates, where frequent rainfall powers the process [37]. Both pavements mitigate the UHI, but their implementation is limited by mechanical and functional characteristics of the materials. Indeed, for the same thickness, porous pavements have a service life lower than traditional structures [40]. Furthermore, the high level of discontinuity of vegetative modular pavements reduces their use to parking lots, sidewalks and low vehicle movement zones [41].
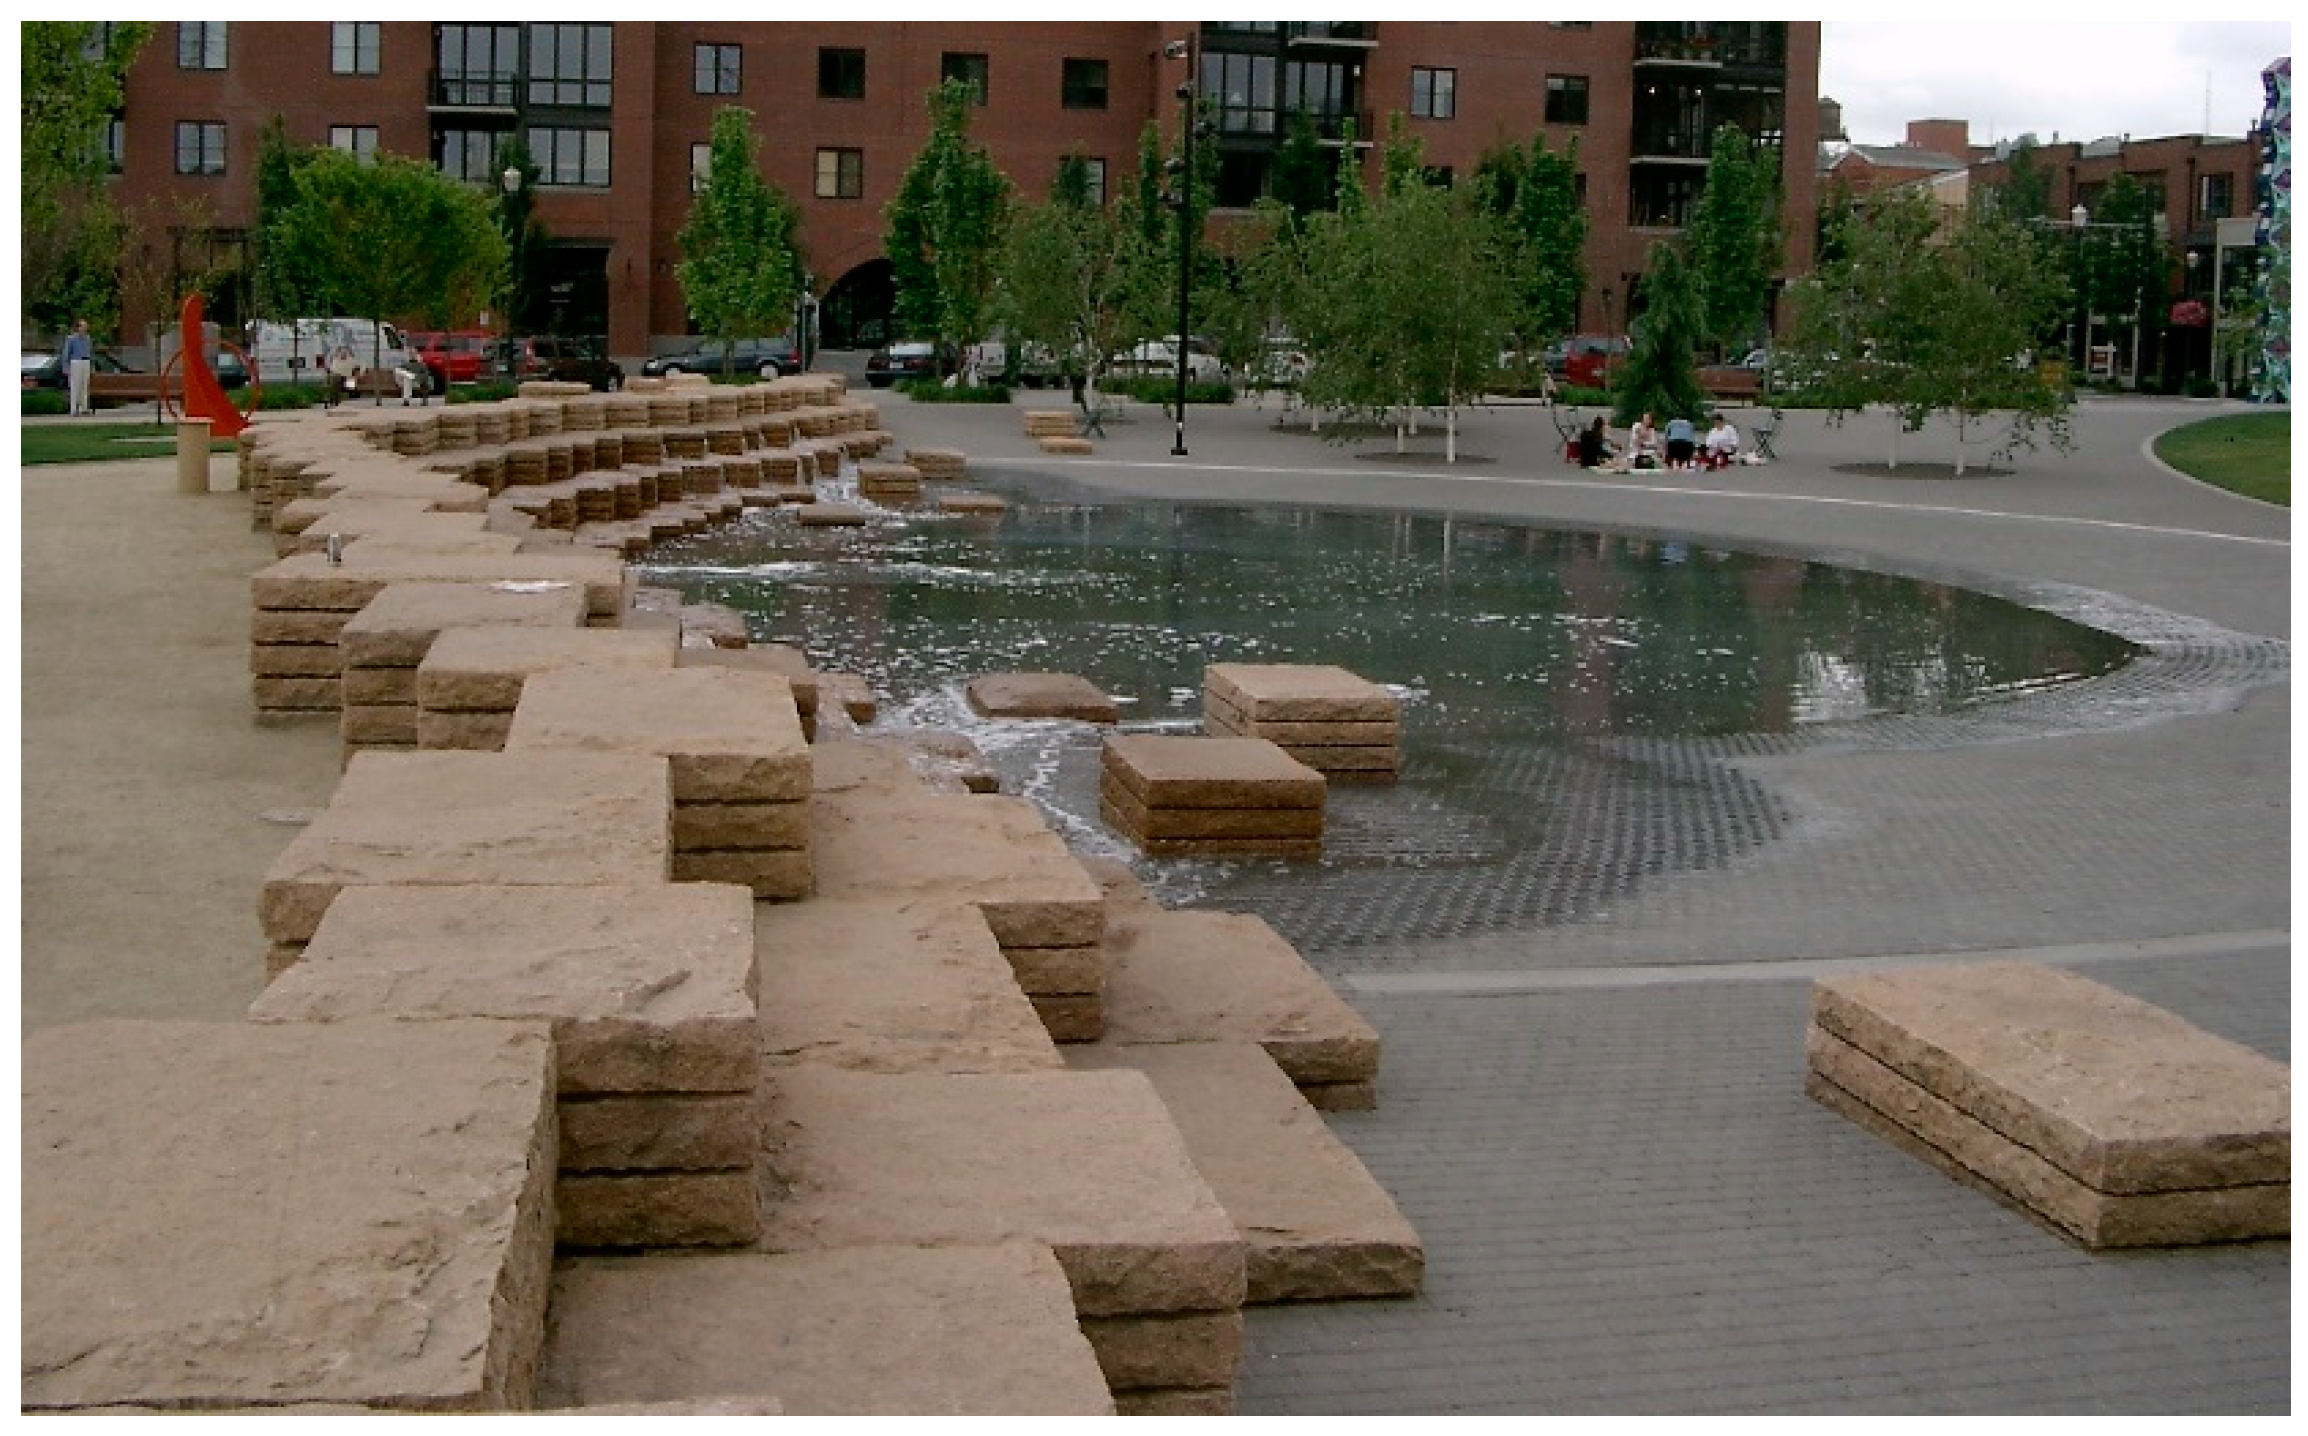
UGI, cool and permeable pavements are not effective in very hot climates, where passive countermeasure versus UHI should be adopted to improve the life of citizens. An example are the air-conditioned bus stops constructed by the Roads and Transport Authority (RTA) in 15 districts across the Emirate of Dubai [42]. In Dehli, people may wait the bus staying in a fresh environment: Fresh air chambers have been installed to improve the service life of bus users and pedestrians [43]. In the city of city of Chongqing (China), a hydraulic system sprays cool water to waiting bus passengers [44]. Wading pools offer refreshing opportunity to citizens (an example is Jamison Square Fountain in Portland, Figure 3).
Finally, water sprinkling on urban pavement improves the thermal environment, as confirmed by several studies [45,46]. This last solution is more effective in presence of permeable pavements [47].
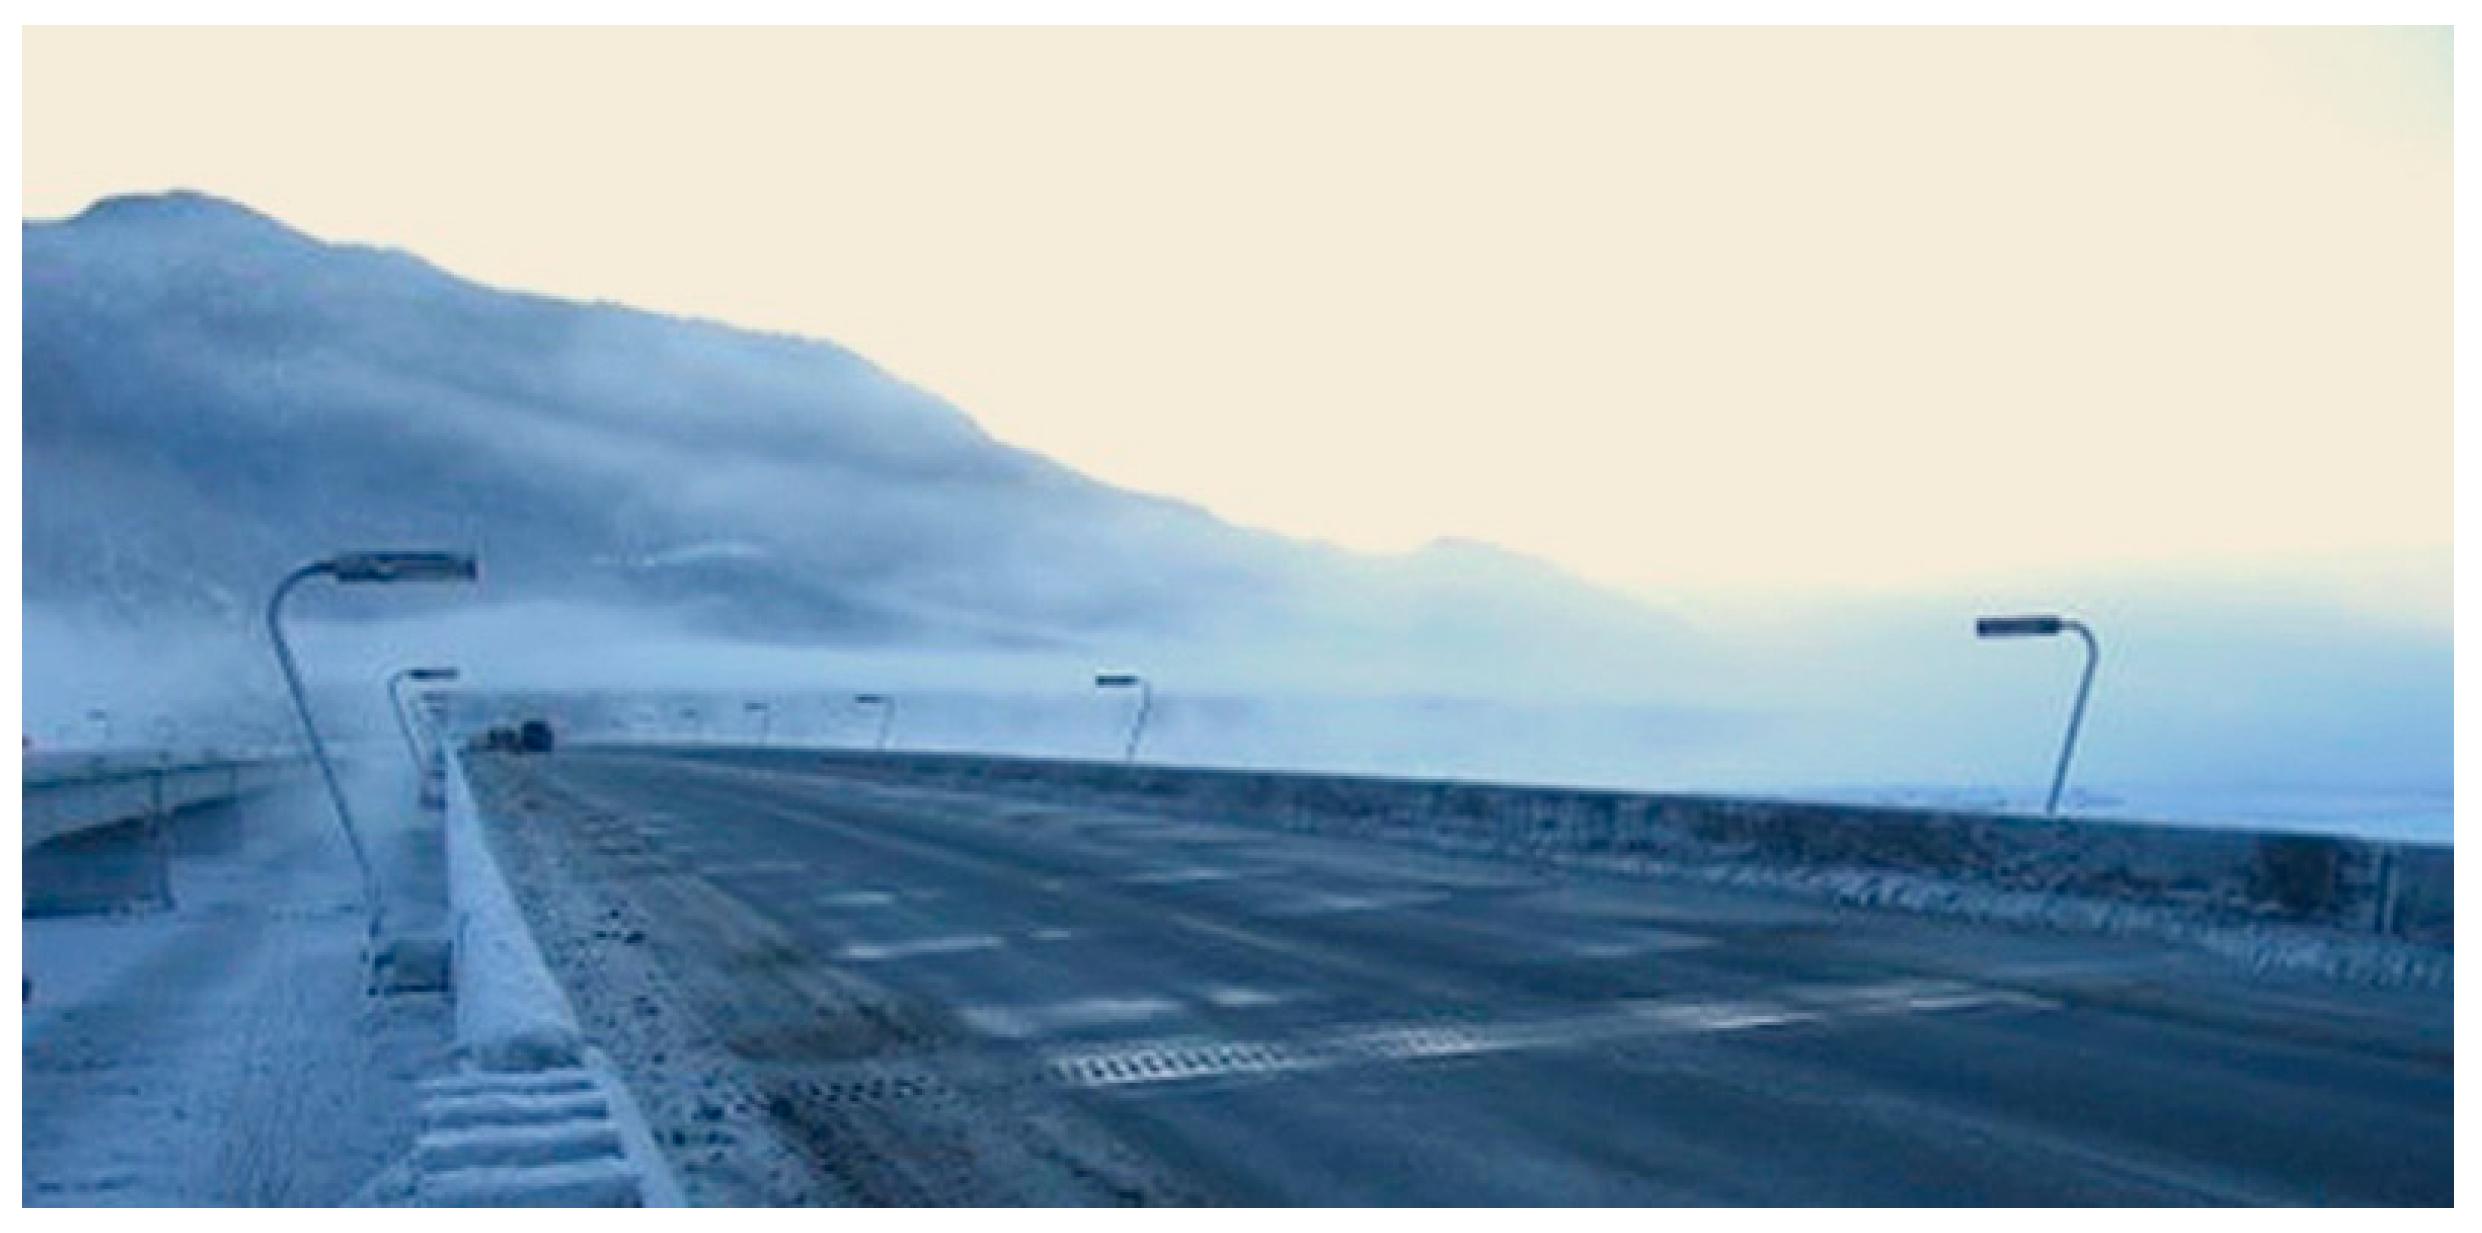
In addition to the gradual rise of average temperature, climatic variability and extremization shall be considered: E.g., during the last years in several States, heavy snowfalls have unexpectedly occurred and damaged the traffic system. Under the circumstances of the climate changes occurring throughout the world, in the last decades, winter season hazards have grown in many areas [48]. It is therefore critical studying the impact of cold winters on road services. The most important weather parameters to be considered are: Daily minimum temperature; daily sum of precipitation; relative humidity; new snowfall height; existing snow height. The use of anti-freezing agents spreading before snowfall and snowplowing after snowfall requires important and growing efforts [49], both economic and operative [50]. Fixed Automated Spray Technology Systems (FAST), in the areas most subject to the severe cold weathers, automatically spray liquid antifreeze (typically calcium chloride in aqueous solution) when it is needed [51,52]. Experience gained in North America and Europe gave conflicting results: These systems increase safety of transport but require complex installation and maintenance procedures [53] (Figure 4).
Road heating systems [55,56] and thermal energy storage [57] have been studied to accelerate ice and snow melting. Asphalt mixes modified with deicing agent Mafilon [58] performed higher snow melting speed respect to traditional asphalt mixtures [59]. Heated sidewalks are currently used to reduce winter hazards for pedestrians [60] and ensure the continuous availability of infrastructures to citizens (e.g., in Akita, Japan; Reykjavik, Iceland; Oslo and Trondheim in Norway; Montreal, Canada).
Asfour et al. [61] combined the effect of heating and porous approaches analyzing the effect of circulation of a warm fluid in a porous asphalt layer.
Therefore, the attention to temperature variation should be increased in the selection of road materials (e.g., asphalt cements and asphalt emulsions) to maintain pavement integrity during its service life.
Not only the materials choice, but also geometric design of roads is affected by meteorological conditions. For example, in presence of snow and ice, the maximum allowable cross slope is less than in ordinary conditions to meet the demands of safety and adherence. In locations with snow removal operations, the shape of shoulders should allow correct snowplowing. Indeed, in such conditions, shoulders and landscaped areas provide areas to dump snow without transporting it to local dumping sites as parks, parking roads and public properties [62].
The Italian Directive about installation and maintenance of traffic signal does not admit bumps when frequent snowing is probable [63]: The elevated obstacle, when snowplowing, could damage sweepers or could be damaged by them.

4. Floodings

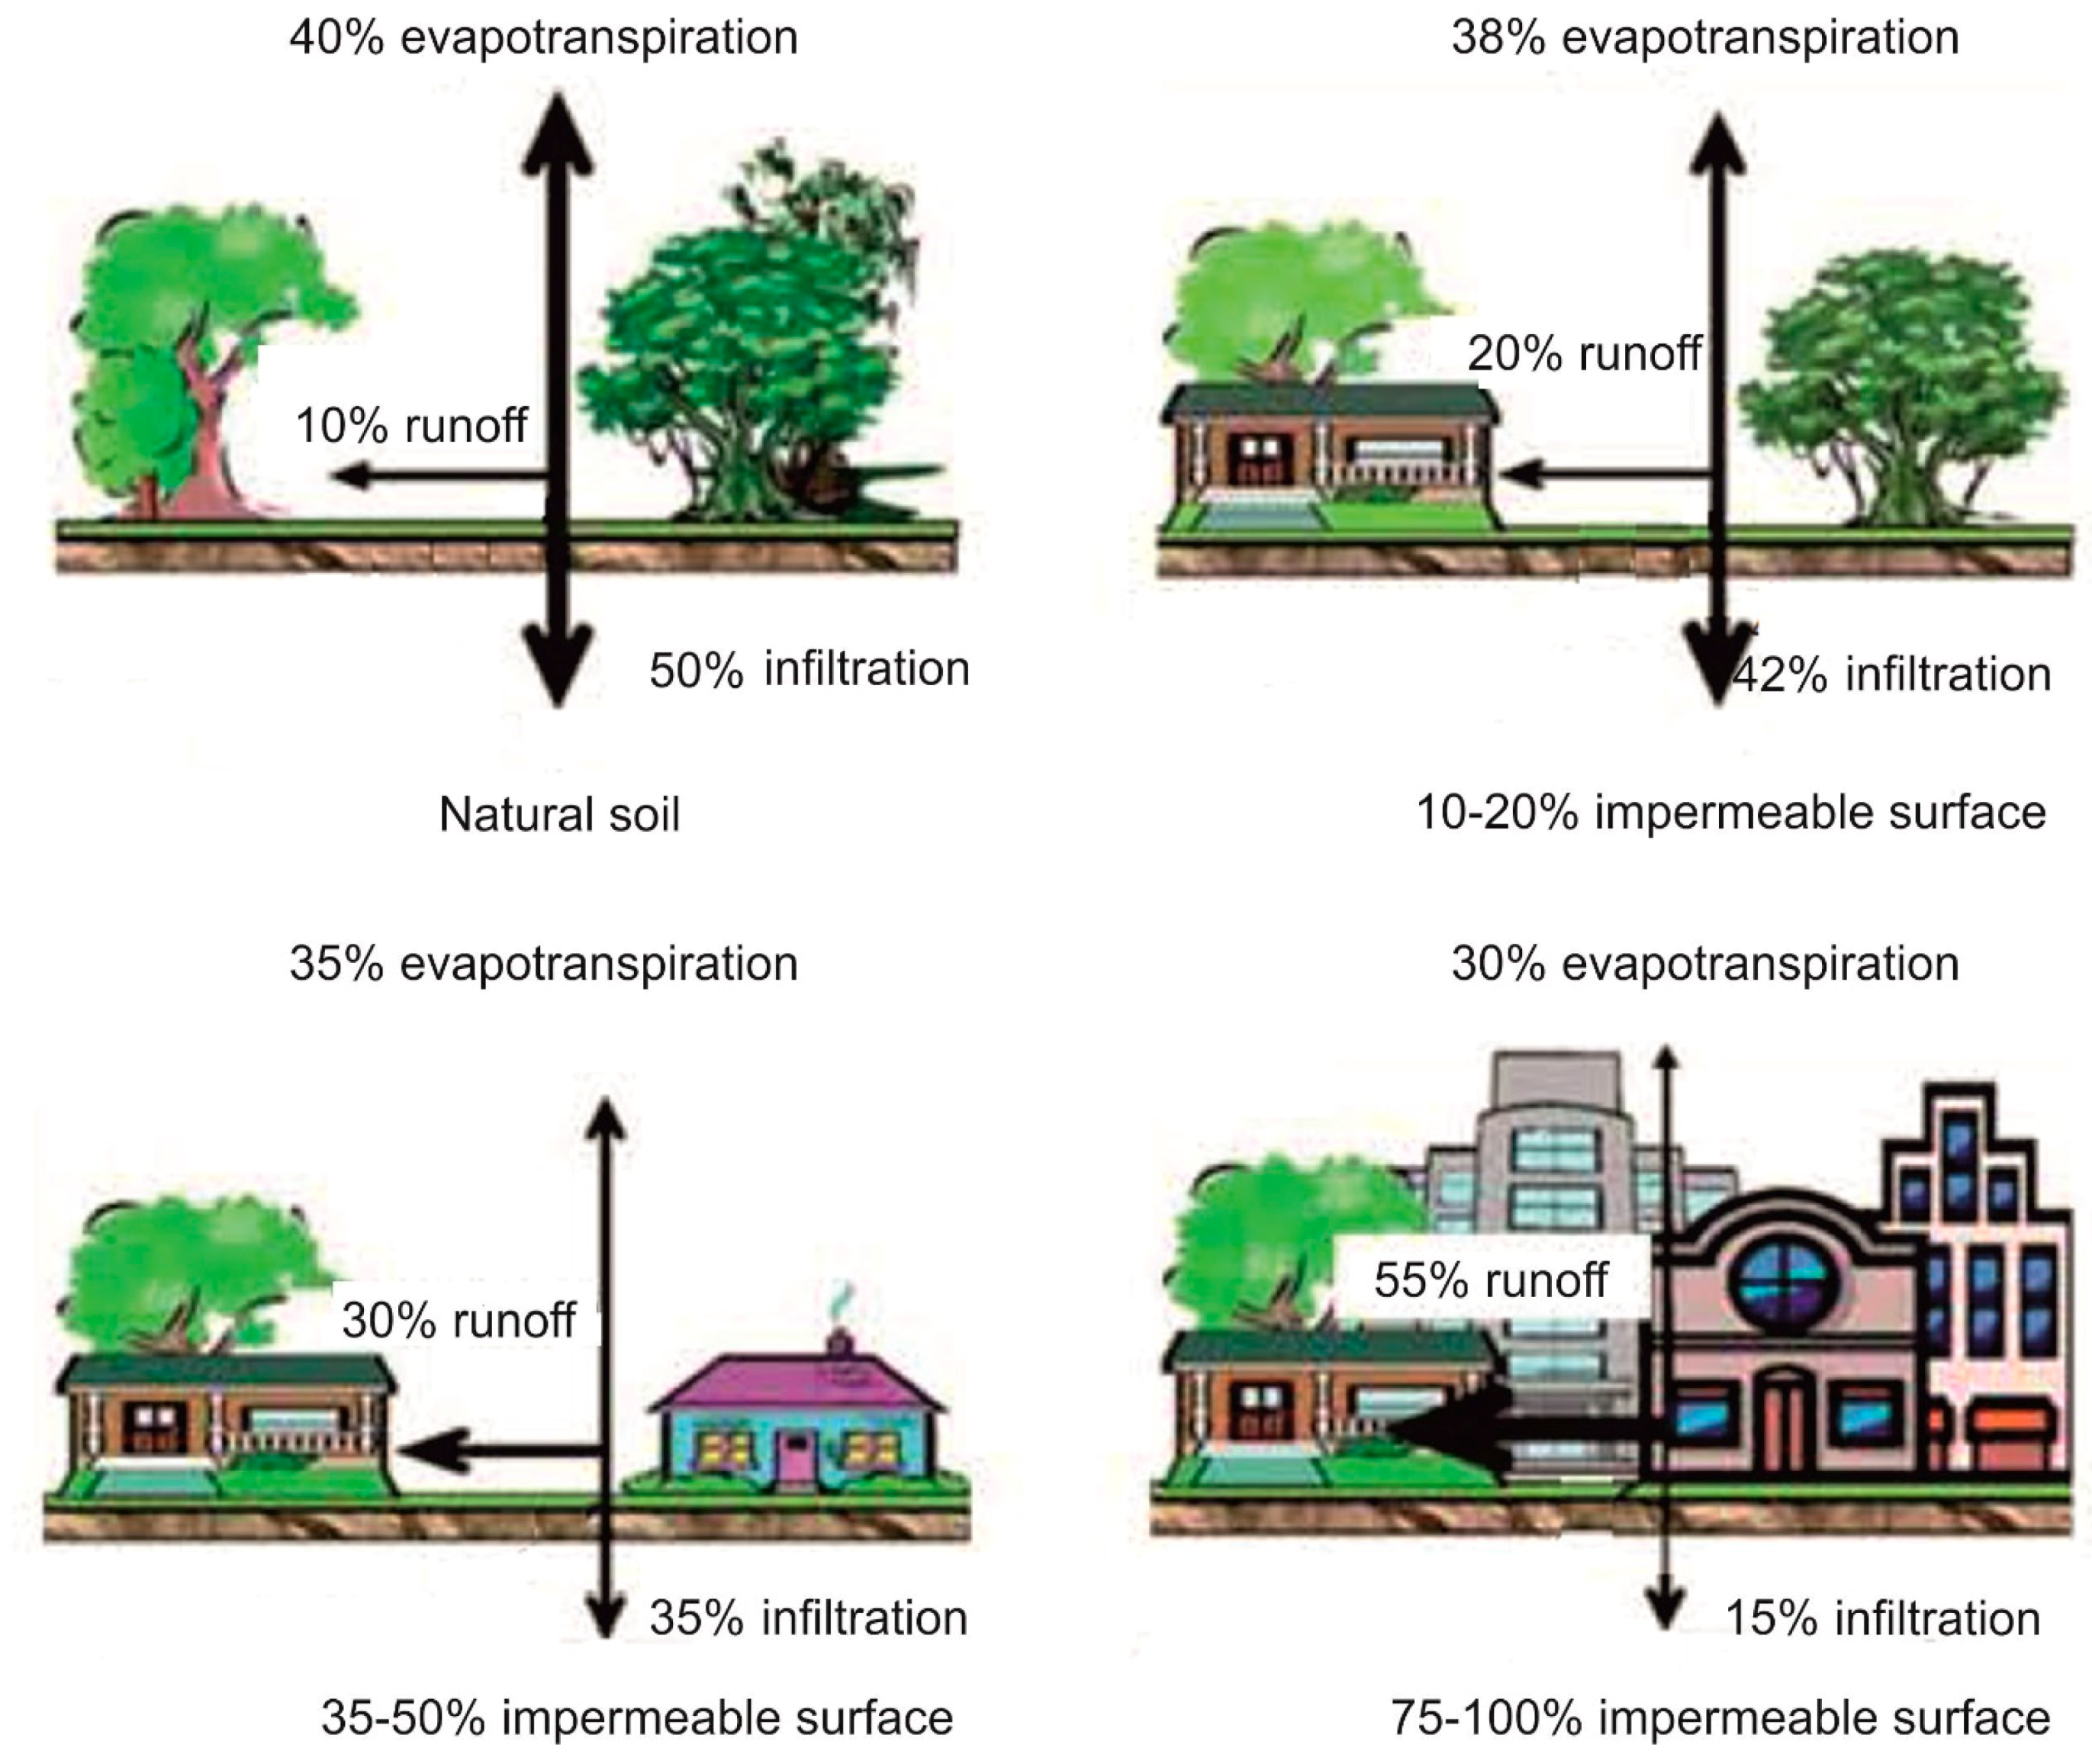
In recent years, often thunderstorms around the world have turned into real “water bombs”: It is the “flash flood” phenomenon, often a consequence of heat islands, heavy heat waves and long periods of drought, followed by storms and floods. The ongoing precipitation change should be handled and managed more and more frequently, especially in cities where the soil is almost completely impermeable, and water hardly infiltrates into the subsoil (Figure 5).
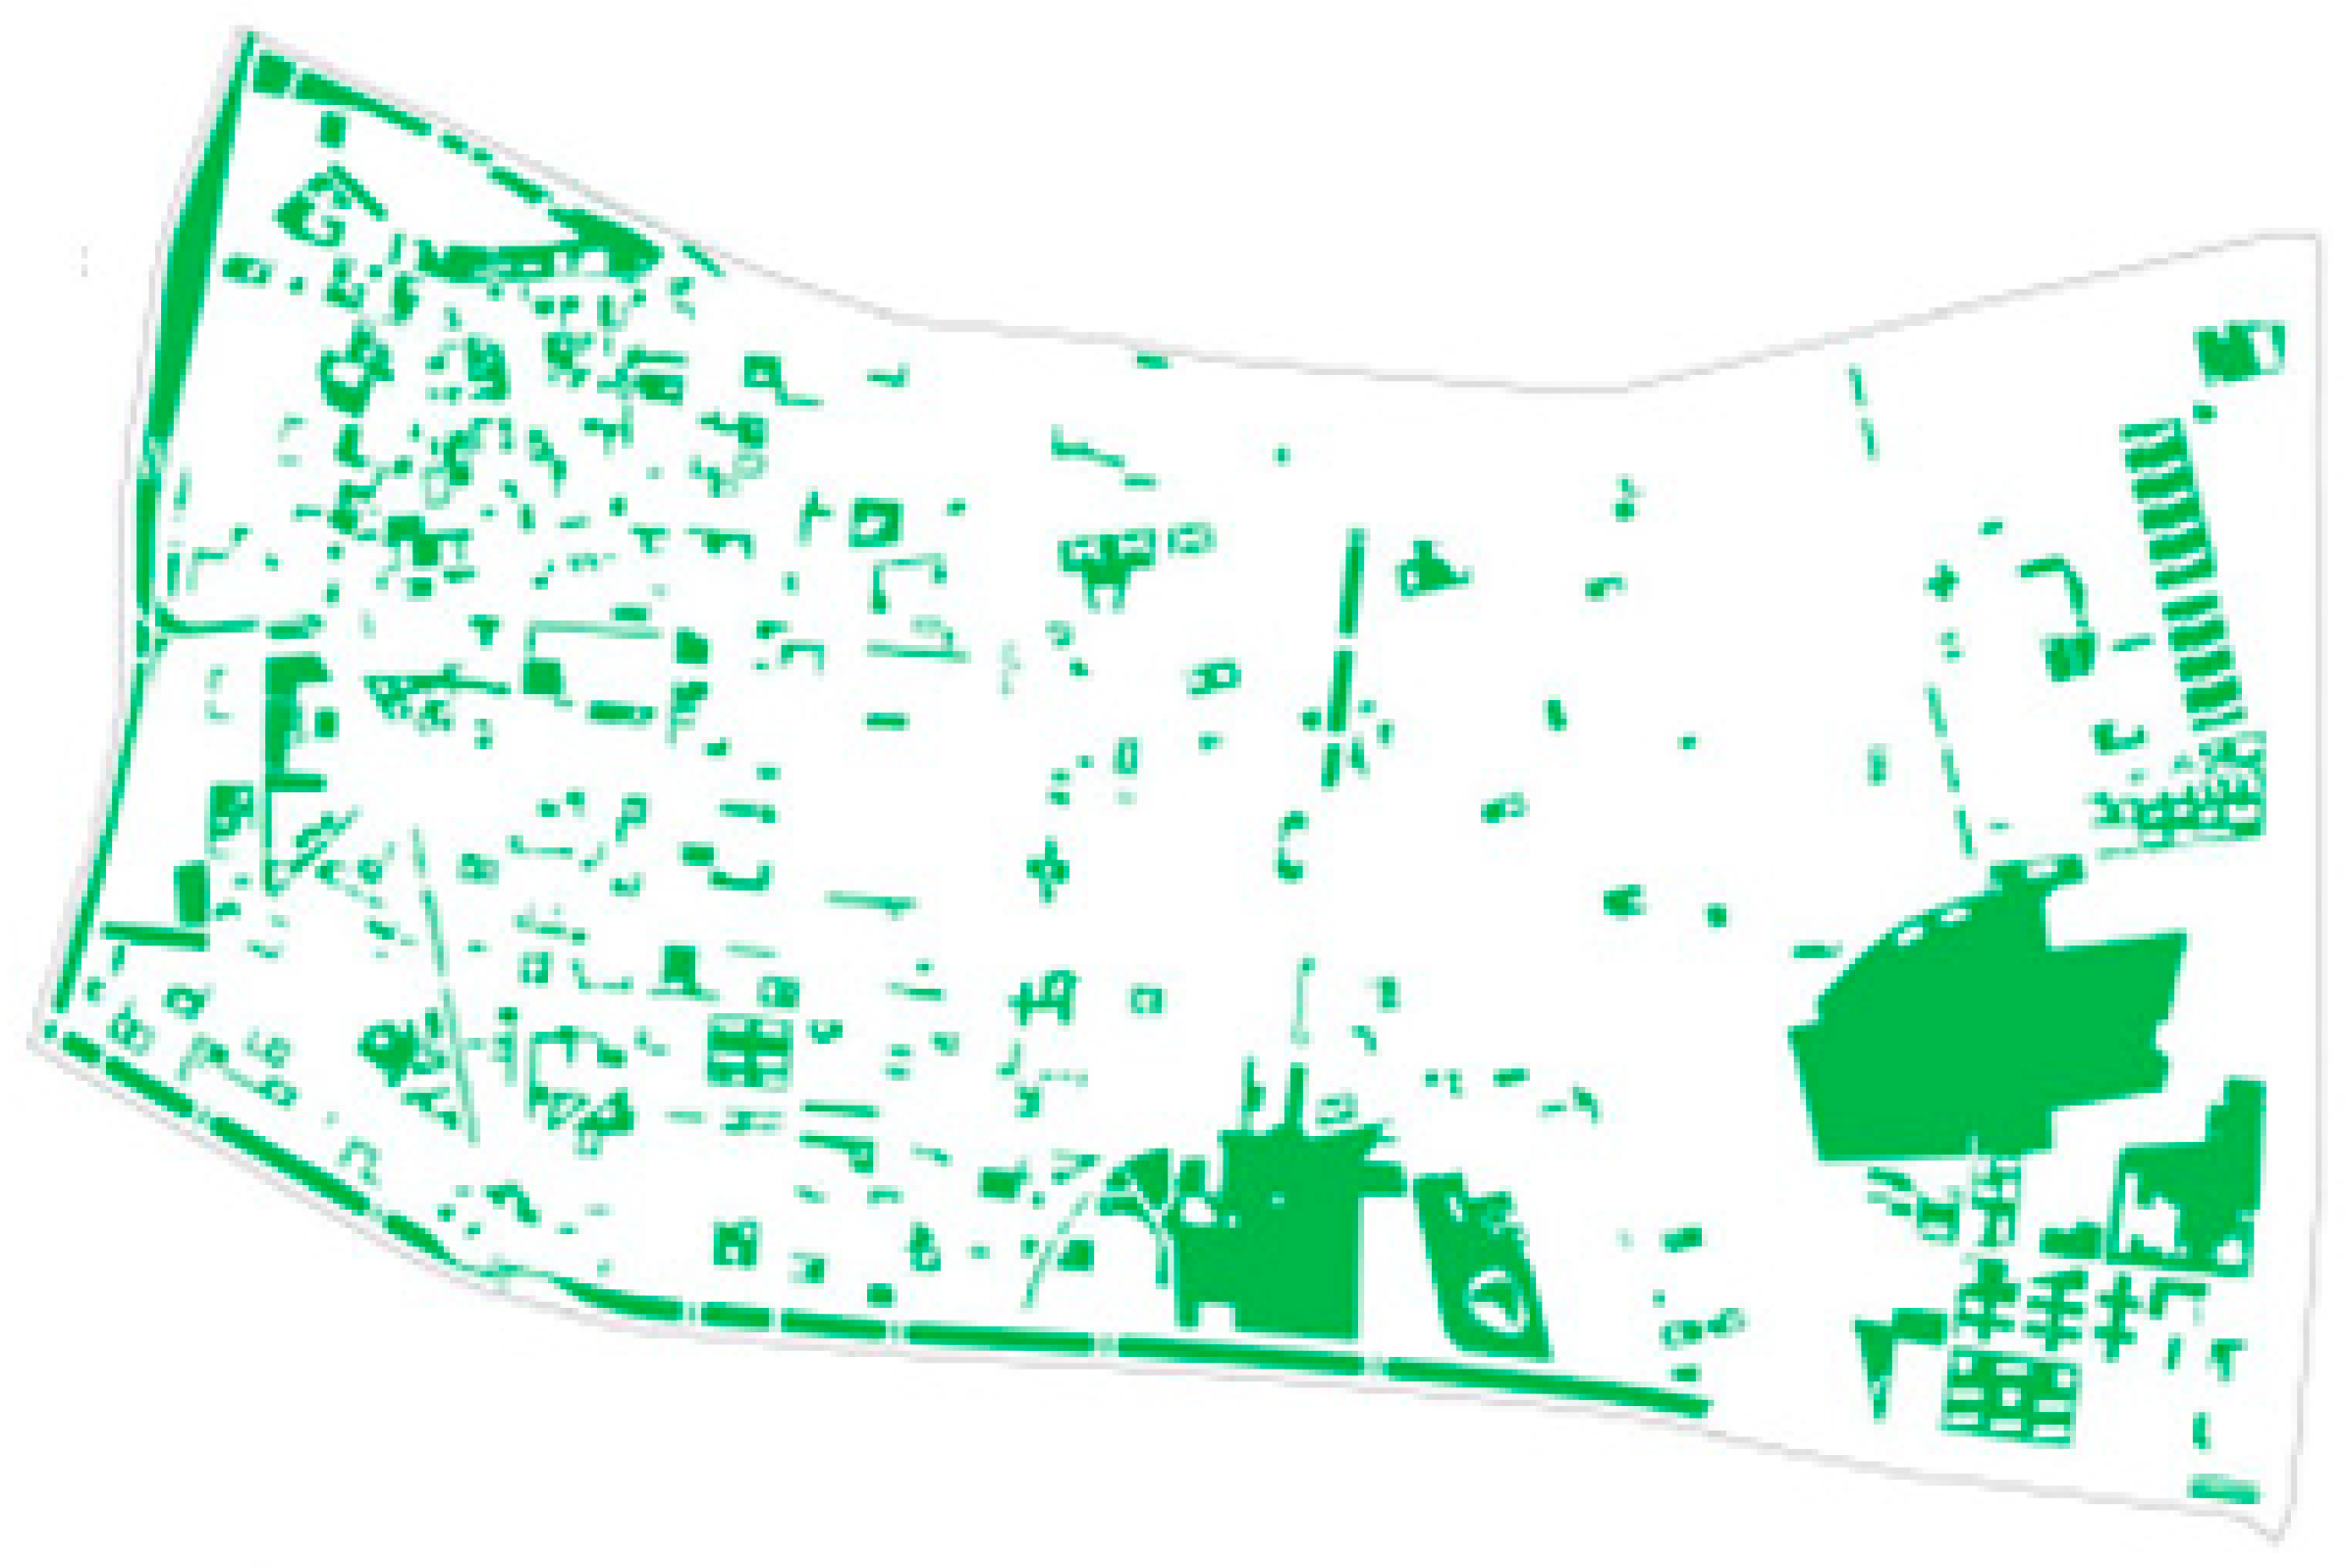
A recent study performed by Buroni (2017) on a 2,620,000 m2 quarter in Rome, shows more than 80% of the surface is impermeable (permeable areas are green in Figure 6). Permeable surfaces and green roofs are respectively only 18.8% and 0.8% of the total surface [64].
As consequence of this condition, 56% of total water rain runs off; 30% evapotranspires, 13% infiltrates into the subsoil, and 1% is retained by green roofs (Figure 7).
It is therefore important to find solutions to relieve the sewage system and make urban spaces less vulnerable to storm water [65]. Diversified interventions have been adopted to intercept, slow down and channel water: For example, water squares, large underground storage facilities, green roofs, planted areas, green dunes, substitution of waterproof surfaces with permeable surfaces [66,67]. They have the same goal: To prevent damage to people and things. Indeed, the variation in rainfall adversely affects soil stability, especially that is surrounding transport infrastructures. Hydro-geological risk of flooding involves ground infrastructures, while for underground infrastructures it is real the risk of flooding.
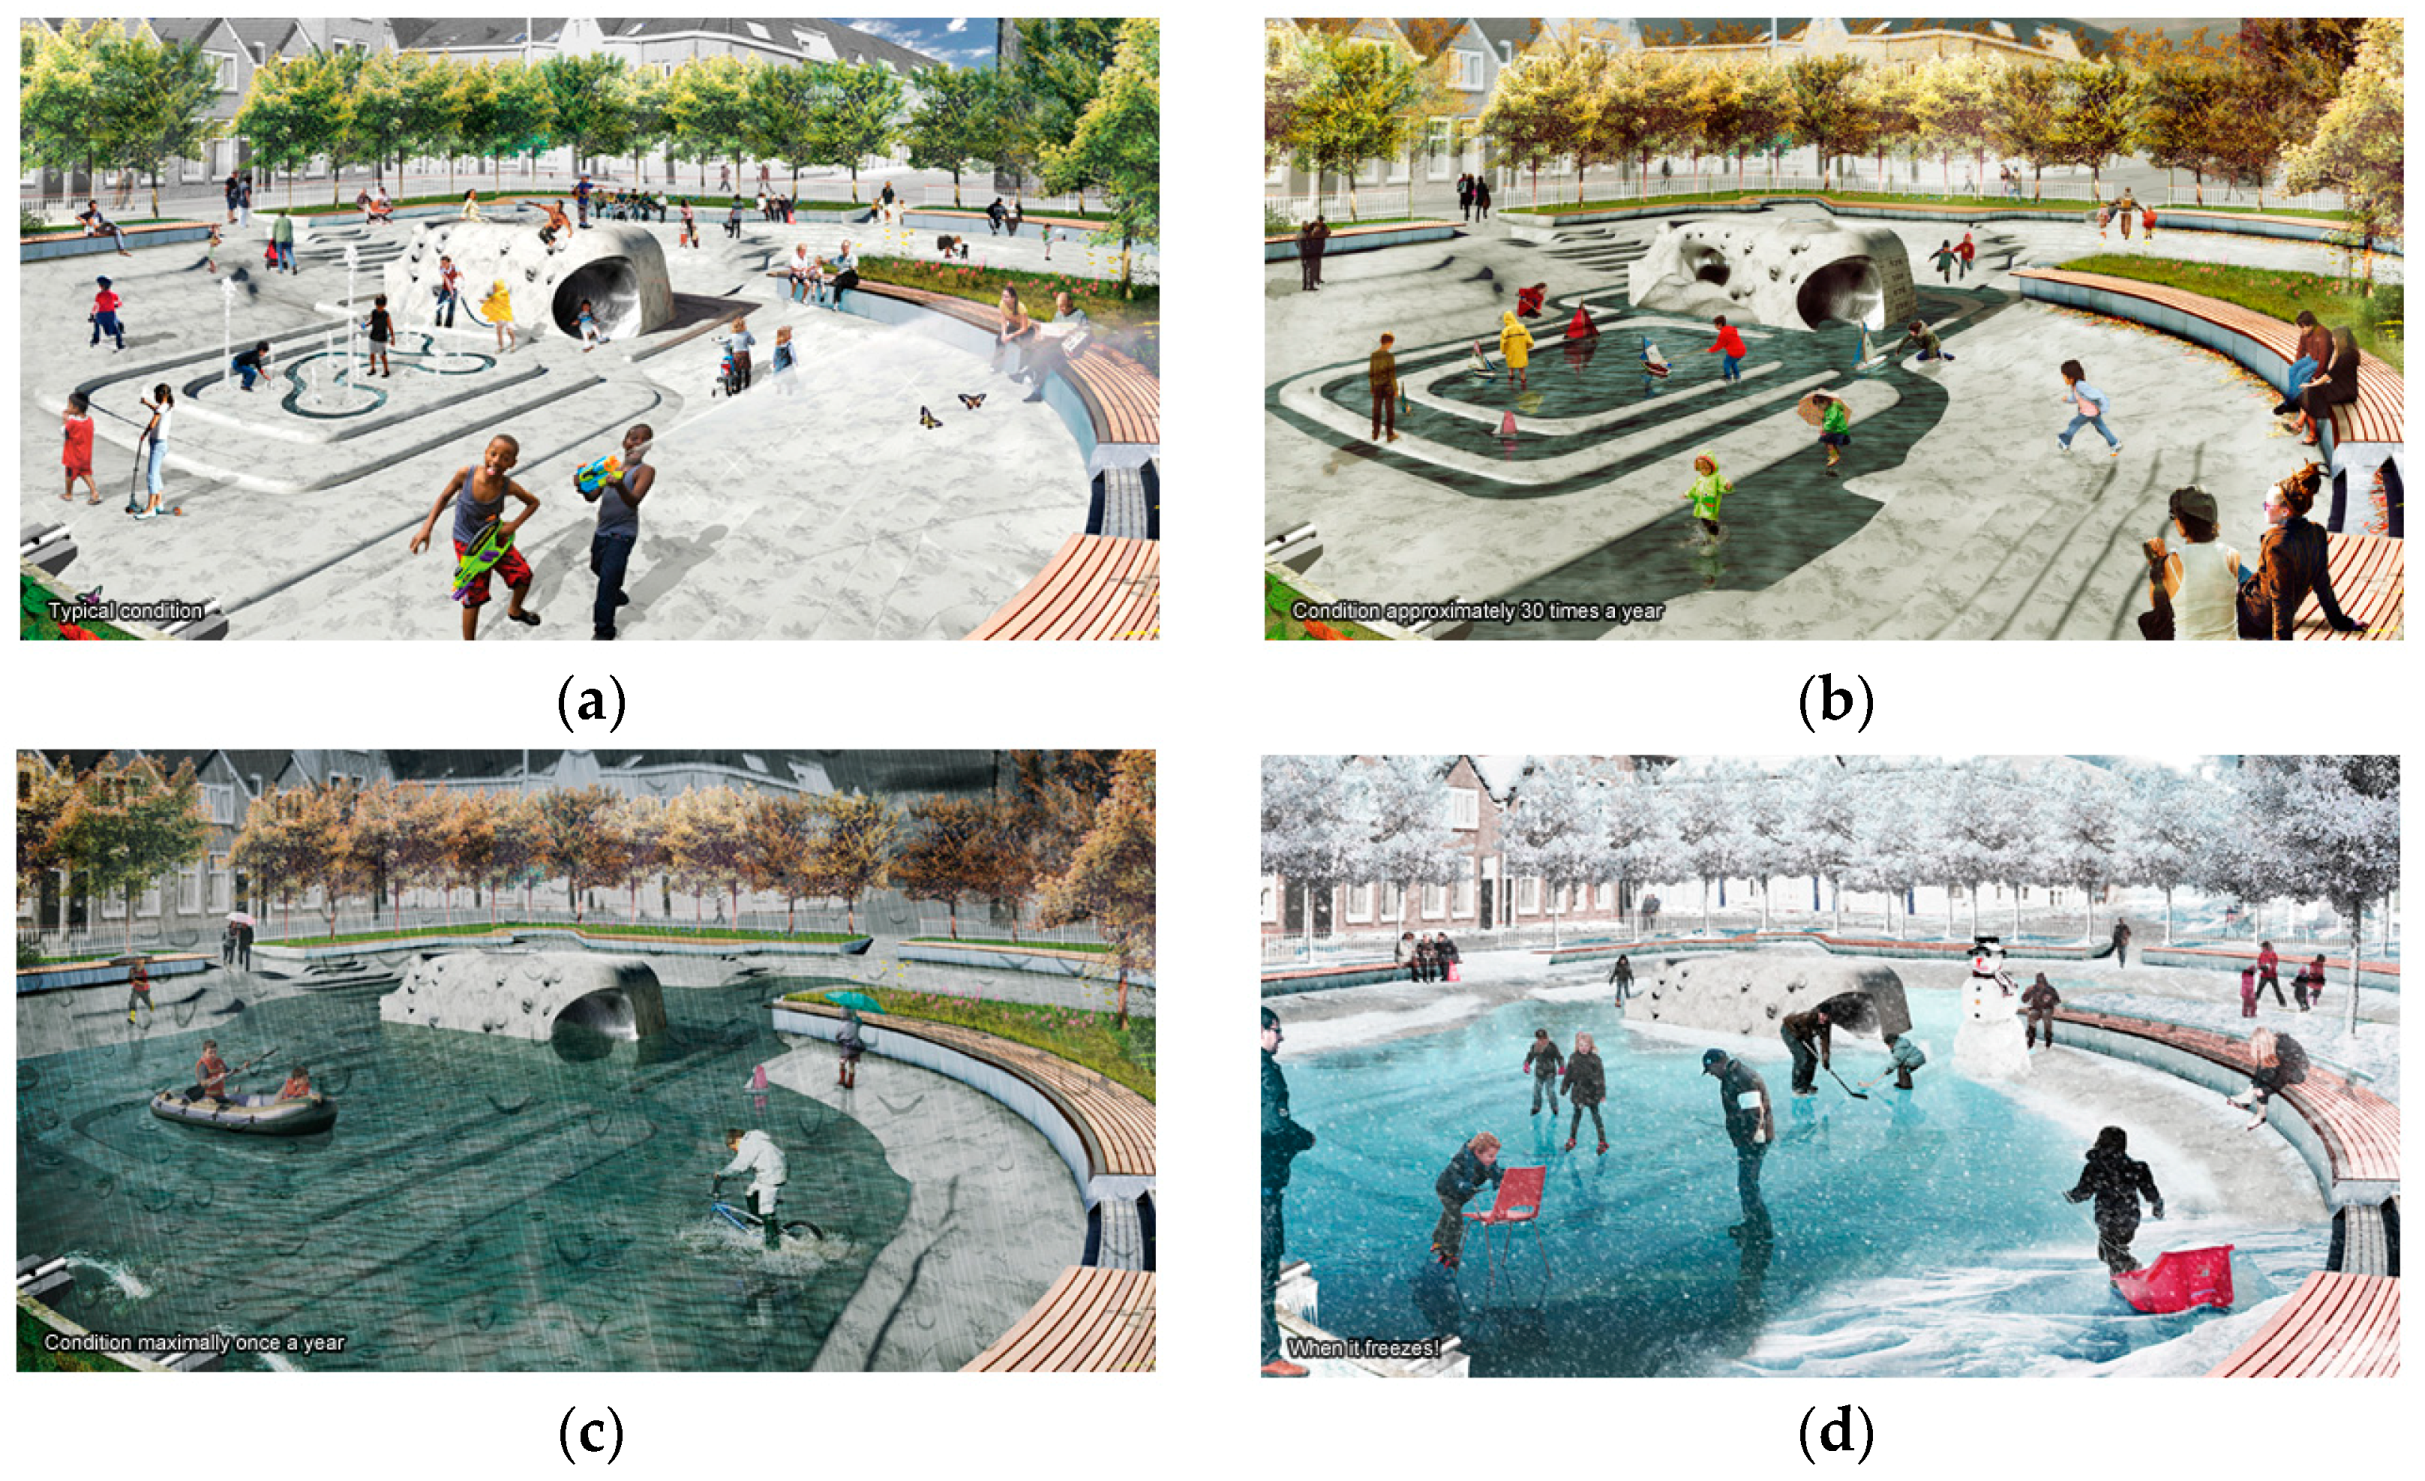
Different and interesting countermeasures are currently adopted to mitigate the risk from flooding. Water squares are versatile public multifunctional squares (for play and relaxation) that 90% of the time are “dry” and usable as any other traditional public space, while in the remaining 10% of the time (depending on the intensity of rain) they may be “flooded.” In fact, in the case of heavy rain, they become basins of rainwater collection and storage. They relieve pressure on the sewage system and give the opportunity to re-use water in times of increased drought. Some of the spaces of the square, regardless of the level of flooding, remain available to citizens (Figure 8).
The water logging at maximum levels of the square should never exceed 32 h for hygienic reasons. Indeed, hygiene is an important to be considered: Usual water is primarily filtered and then treated in a plant underneath the ground named a “water chamber.” It retains the major and most polluting agents, thus guaranteeing the health of the citizens. Examples of water squares are in Rotterdam, The Netherlands, where the Bellamyplein and the Benthemplein water squares can respectively retain 750 m3 (its area is 300 m2) and 1800 m3 (its area is 950 m2) of water [68]. The last one rises in one of the areas most exposed to risk of flooding in the city. It has three different docks used during the dry season for various activities, such as sports, outdoor theatre and relaxation. Two shallow basins collect rainwater from the immediate surroundings at any time, while the third deepest and largest basin is designed to accommodate water only if there is a real flood risk for the neighborhood, contributing to the security of the inhabitants. Their construction in 2012 and 2013 follows the construction of a large multifunctional building: It is an underground parking and a water storage whose capacity is 10,000 m3 [69]. The experience of Rotterdam complies with a recent approach to have a more flooding resilient and safe city of Singapore. The recent restoring of the Bishan-Ang Mo Kio Park aims to capture in Kallang River the storm water [70]. An old concrete drainage canal has been transformed into a natural channel with meanders, pools and riffles; therefore, surface runoff is managed, controlled and reduced [71]. Moreover, constructed wetlands have been installed throughout the city (e.g., Alexandra Canal, Larong Halus, Sengkang Riverside Park) to improve water filtration.
At the end of the 1990s, in the city of Barcelona, Spain, 15 water retention chambers have been built to store 477,000 m3 of water [72]. The construction of underground water-retention reservoirs reduced and controlled polluted flows; in recent years, storm water is treated and used for irrigation [73].
The Copenhagen Climate Plan (CPH 2025 Climate Plan) aims at increasing green roofs, canals and pocket parks to absorb cloud bursts [74].
Some years after Hurricane Sandy, New York City has started addressing the effects of climate change. The USA Housing and Urban Development Department awarded the innovative, 335 M$ project “Big U.” A structure will be built to provide a 10-mile long continual protection around Manhattan. Both infrastructural and coastal defense interventions are planned: Hydraulic works to slow the water flow; a green infrastructure circuit to store and direct excess water; lifting pumps and alternative routes to facilitate drainage [75]. The coastline defense will encircle the area in Lower Manhattan, protecting the city from floods and storm water [76].
For the city of New Orleans (USA), the Greater New Orleans Urban Water Plan (UWP) has the goals to increase safety, provide economic opportunity, and improve quality of life [77]. Its implementation plan consists of pervious pavements, bioretention and infiltration, plants, and subsurface storage to manage flooding caused by rainfall events [78].
Conventional urban constructions (e.g., roads, buildings and parking lots) get worse natural flooding characteristics, but recent studies and experiences show it is possible to balance the city’s developments and its natural water system. Indeed, road pavements could have a water-retaining function [79]. In 1998, Osaka applied, for the first time, this technology to roads. The innovative surface has a water storage capacity is 3–5 l/m2. During a sunny day, the water evaporates, absorbs the heat and lowers surface temperature: People feel lower heat. This approach ensures both water storm management and reduction of UHI effect.
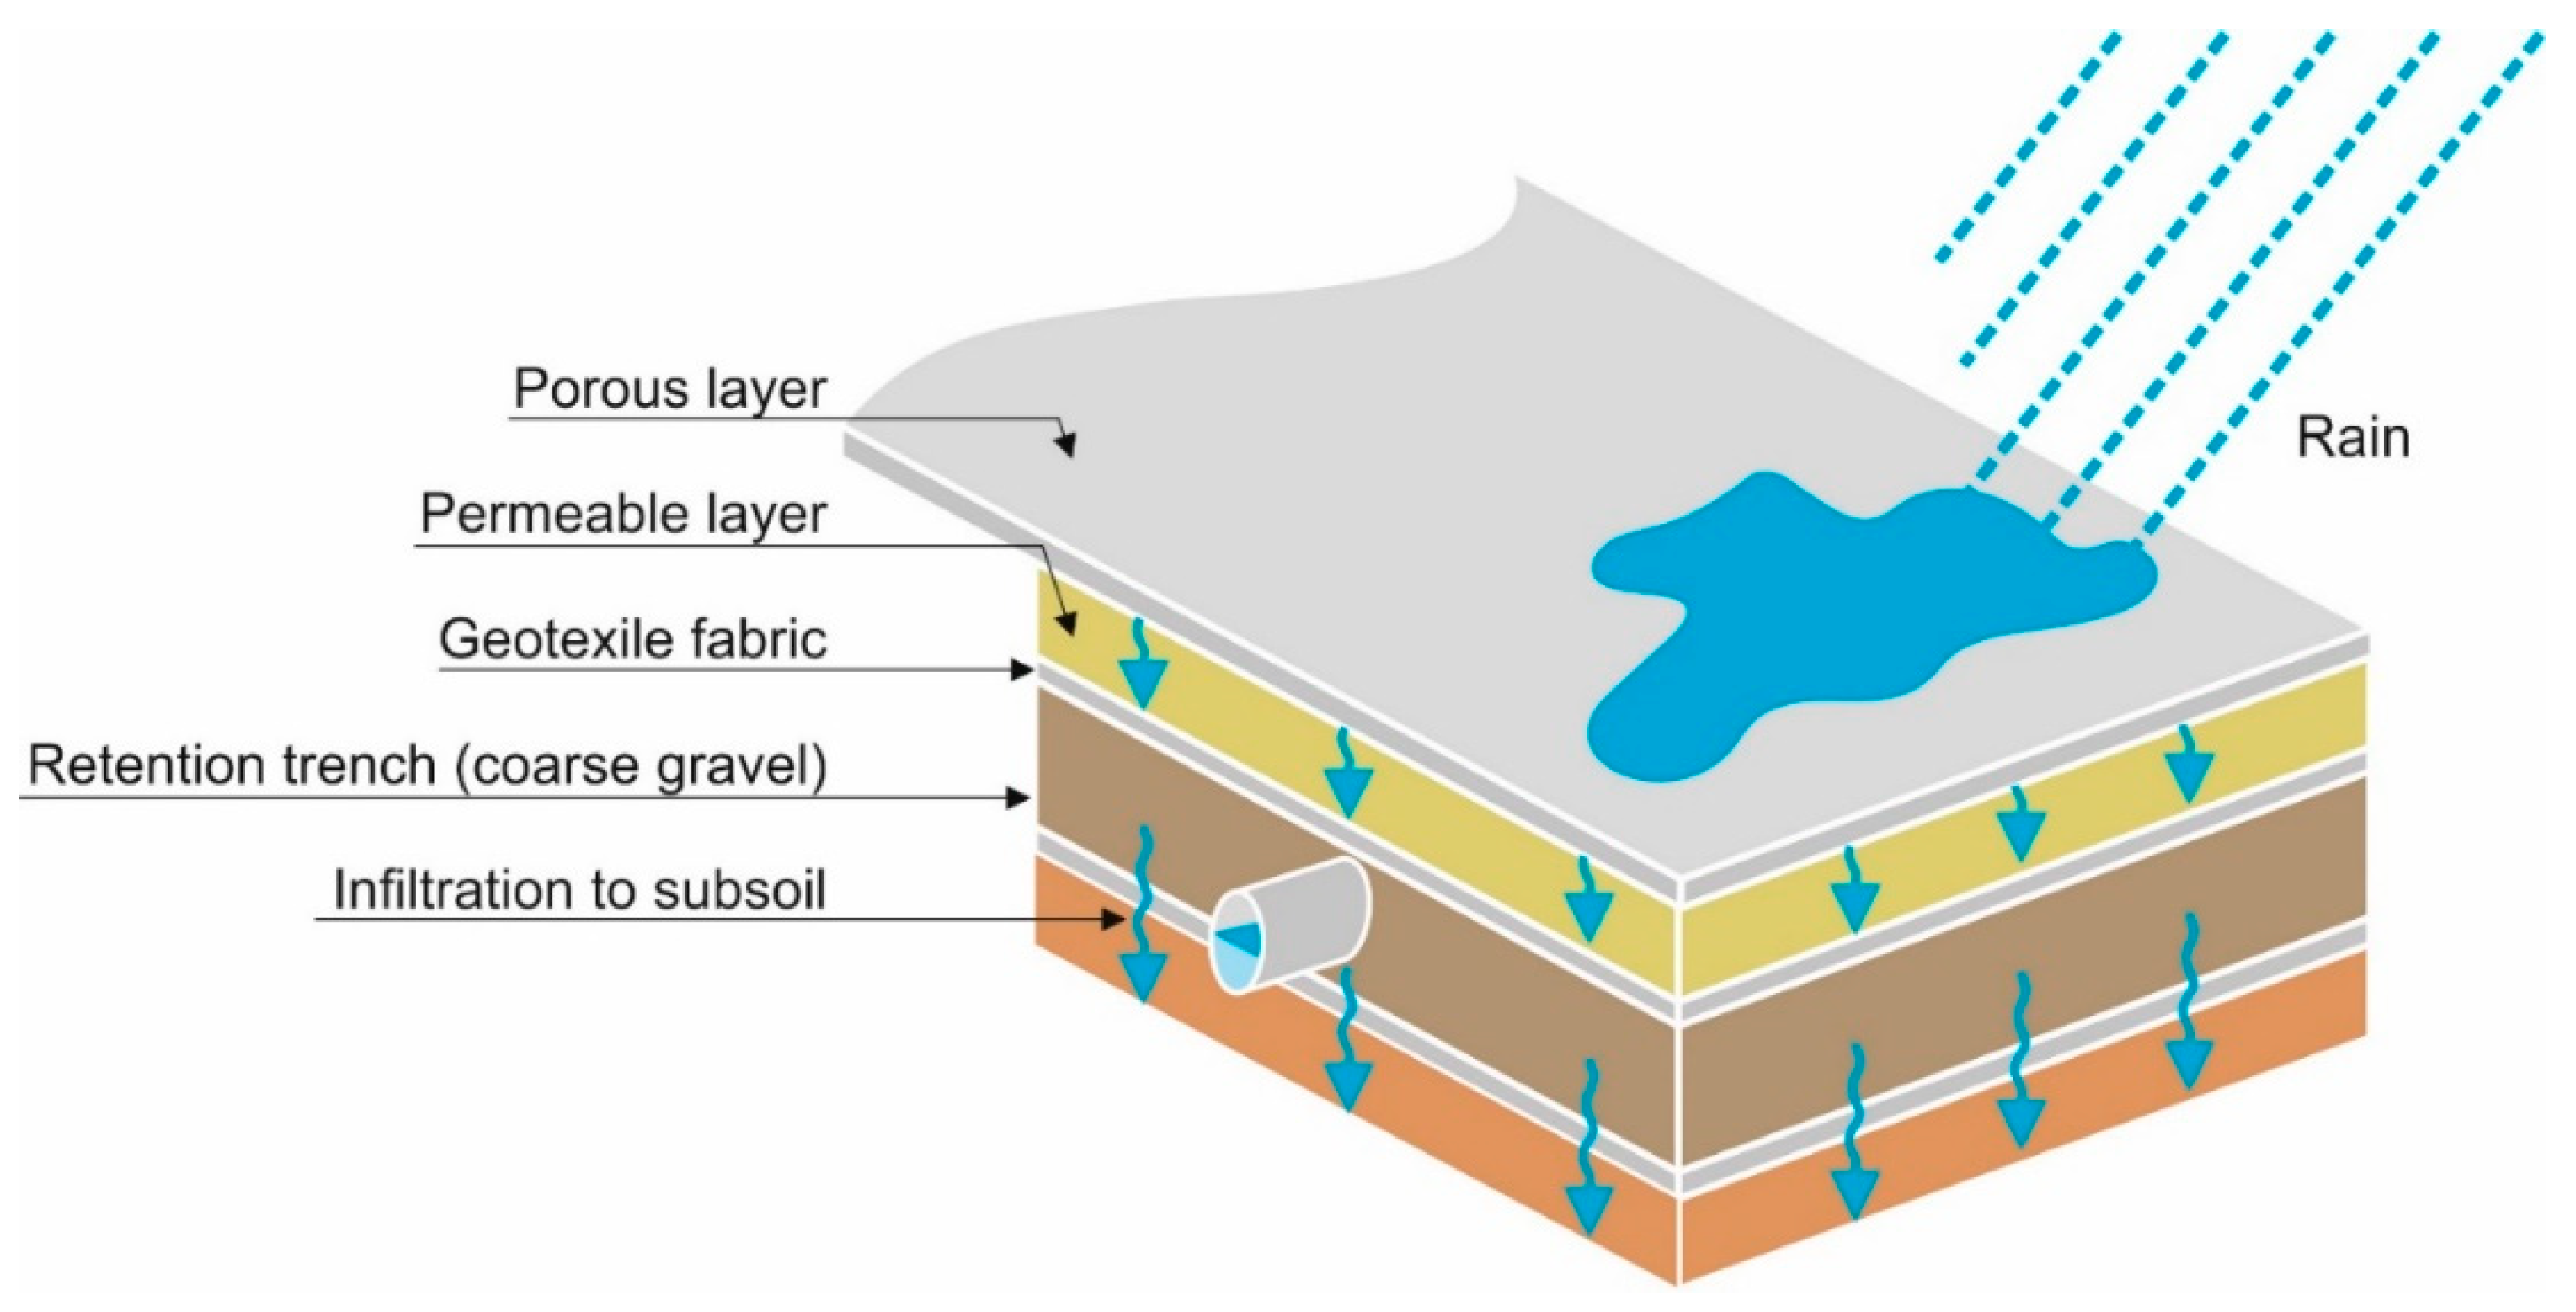
A different approach for road pavement construction leads to the porous pavements (Figure 9), which naturally refill underground aquifers rather than transport polluted storm water to treatment facilities [80,81].
The bio-physical principles behind these pavement characteristics are retention, filtration and restoration of water content to natural soils: They reduce runoff [82]. Typical porous road pavements have the wearing course of asphalt concrete: It is one of the most permeable materials, as confirmed by Valinski et al. [82]. Vegetated biofilters (also called bioretention systems, raingardens and bioswales) are used to mitigate the impact of storm water on transport infrastructures [83]: They are an effective system for flood prevention and removal of various pollutants from storm water. They are largely used in Southern California and Southern Australia [84]. The plan “ForwardDallas!” focuses on storm water management by means of grassy wales, biofilters, porous pavements and green streets around the Trinity River Corridor [85]. Bassani et al. [86] compared pollutant removal capacity of two urban storm water systems: Porous pavements and vegetated biofilters composed of organic materials. Microbial population present in both structures ensures retention of pollutants [80,87]. The second one uses the natural ability of certain plants, called hyperaccumulators, to bioaccumulate, degrade or render harmless contaminants in soils, water, or air, such as lead or other toxic materials [88]. Their efficiency is related to the speed of storm water filtration. The greater efficiency is the layer permeability and the filtration rate, the lower is the pollutant removal performance [89]. The performance of biofiltration systems can be improved laying lowly permeable materials in vegetated biofilters and selecting proper plants [89]. Moreover, the performances of porous surfaces and/or with pollutant removal capacities are seriously affected by the pavement slope [90] and clogging dynamics [91]: Therefore, geometrical and service conditions cannot be overlooked to ensure a constant efficiency.
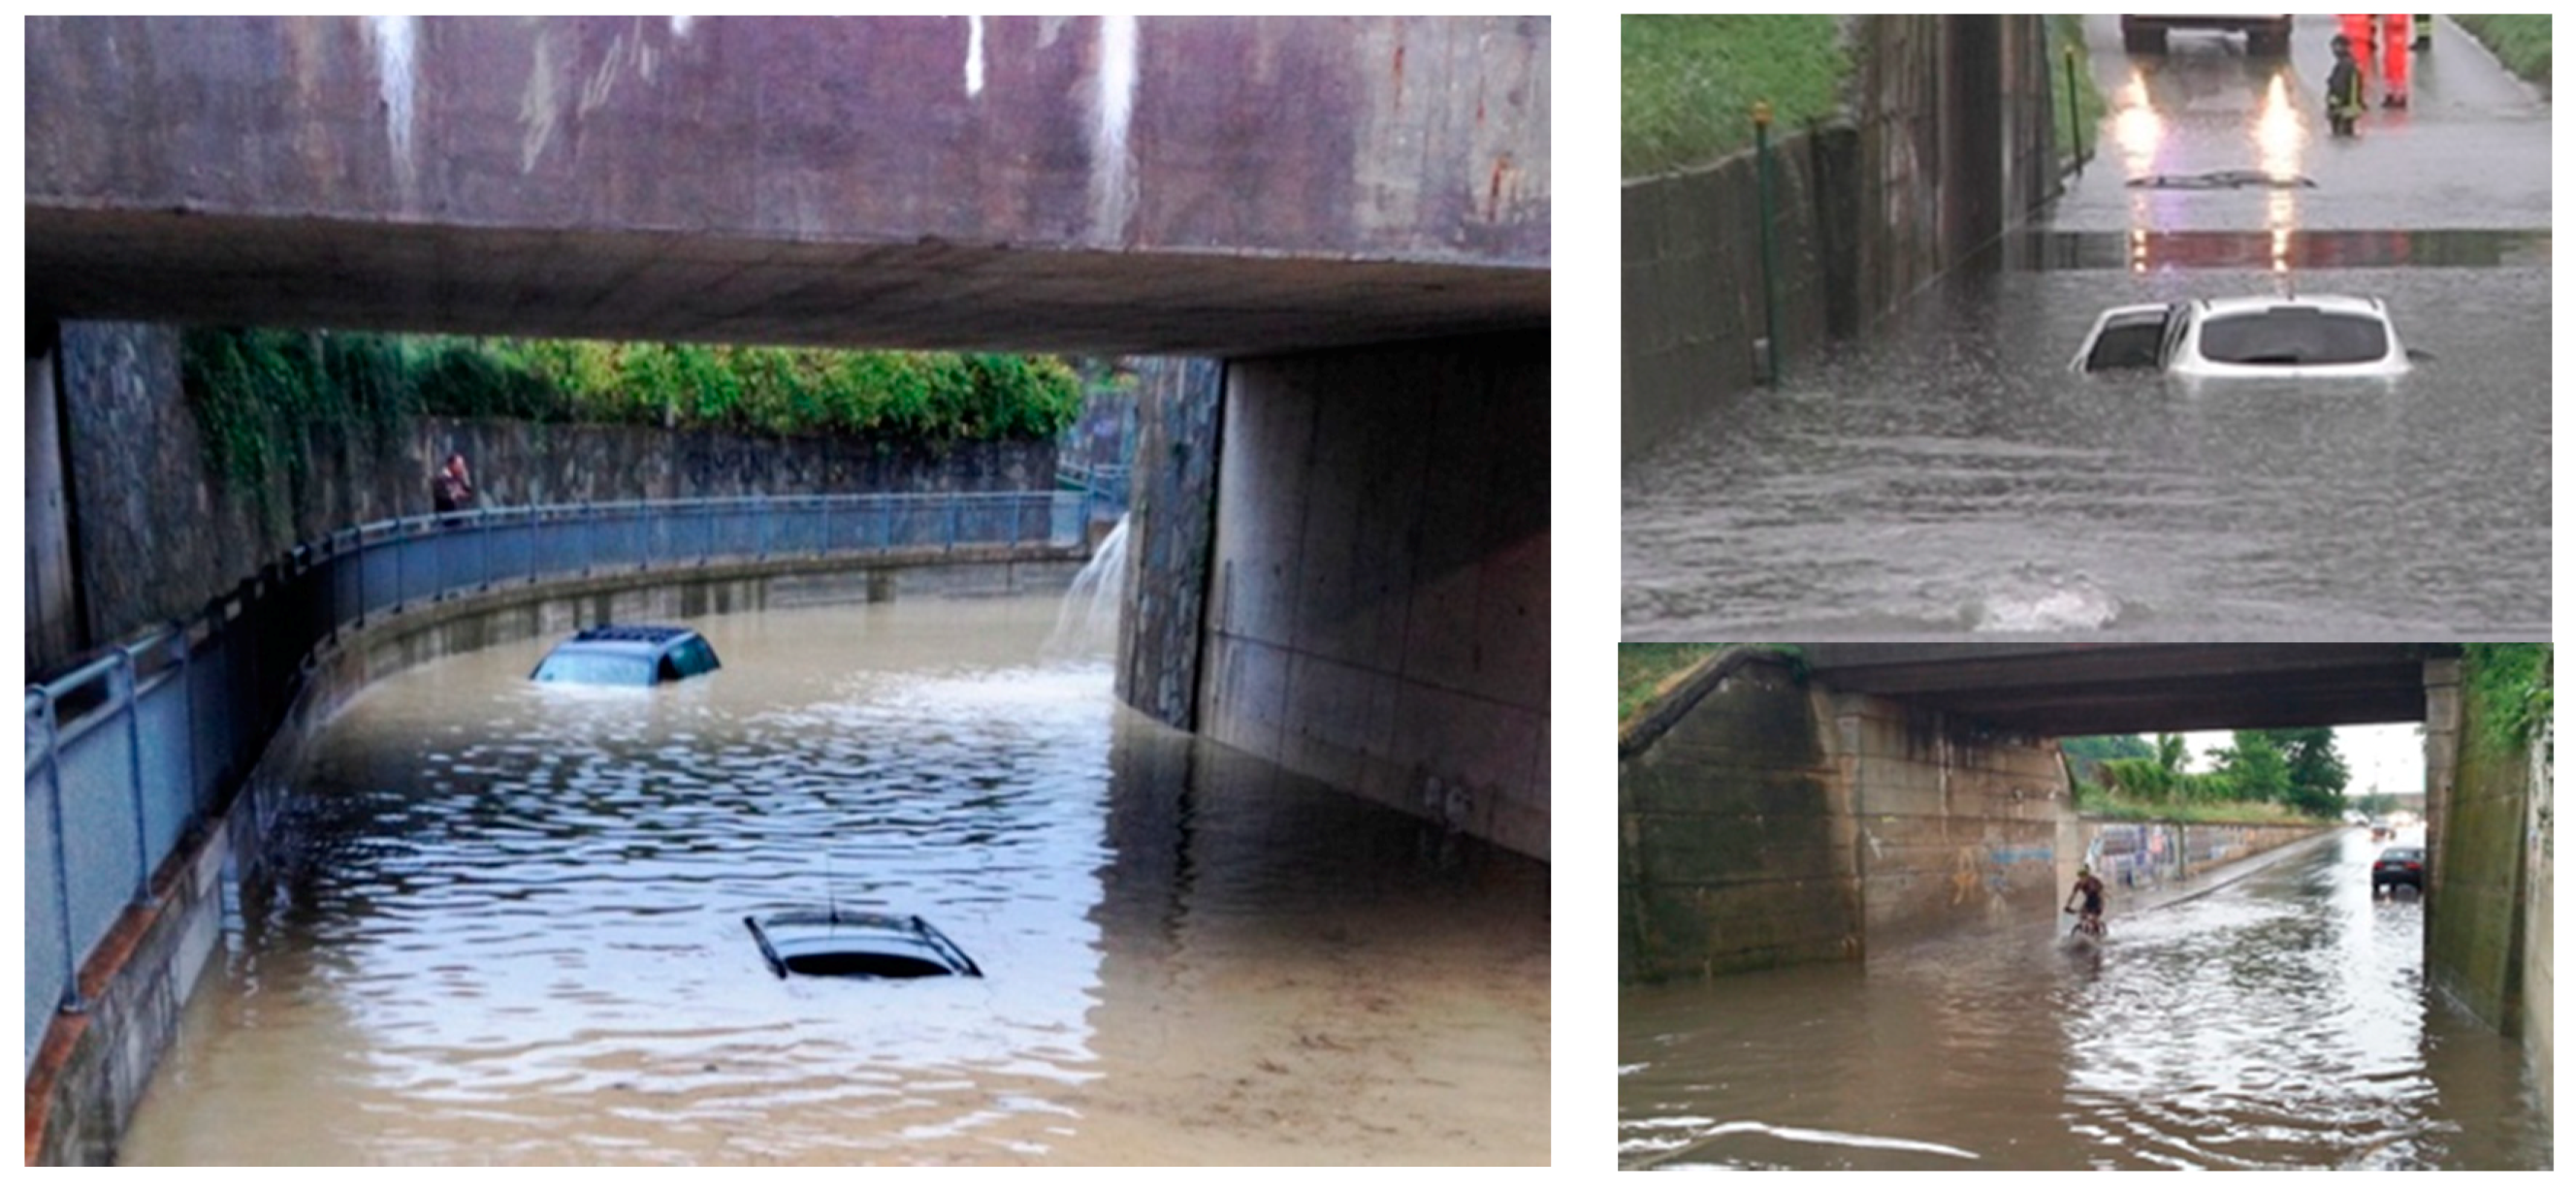
Underpasses are one of the road sections most vulnerable to flooding (Figure 10).
Indeed, underpasses are often susceptible to flooding: Traffic lights prevent the vehicle circulation when the road is flooded. In Italy, the Abruzzo Region started a pilot project to mitigate this water risk for pedestrians and occupants of vehicles. Five road underpasses located in Pescara, Giulianova, Montesilvano, Francavilla al Mare and Tortoreto have piezometric and on/off level capacitive sensors which continuously check whether the critical threshold has been reached and the traffic should be inhibited. The system logic also minimizes the activation time of the alert message, optimizing system performance [92]. Furthermore, the system has a webcam to monitor the situation in the underpass, from the activation of the alert to its end. Two information panels with a variable message complete the system. These traffic inhibition systems should be operative under any conditions, even when power outages occur: At this scope, they should be provided with emergency generators and/or uninterruptible power supply (UPS) systems. In other cases, water pumps are installed to control the water level and reduce damages caused by flood [93,94].
Sidewalks of pedestrian underpasses are often over hanged in respect to the carriageway to avoid hydraulic risks for citizens; this countermeasure helps people also when there is no flooding risk, because it reduces the difference in level they should climb.

5. Sea Level Rise

Sea Level Rise (SLR) poses risks for road and rail infrastructures located along the coasts and port infrastructures. It is a serious risk, because most of the world’s biggest cities have grown up around natural harbors [95]. Thermal expansion of seawater and ice sheets and glacier melt are the major mechanisms which cause SLR [96]. The study carried out by Neumann et al. [97] for the Tampa site (Florida) highlights the importance of considering dynamic ice sheet melting when estimating the area of influence of the coastal threat from climate change.
Risks from SLR involve ample and urbanized areas around the world: e.g., the Red River Delta, Vietnam [98], New York [99], Shanghai [100] and the Chinese deltas [101], Venice and its Lagoon [102].
In 2012, the Organization for Economic Co-Operation and Development [103] listed the 20 world port cities with the highest number of people at risk from coastal flooding. Most of them are on coastal deltas and in 2070, the top 10 of them will host 400 million inhabitants. Most of them (e.g., Shanghai and Guangzhou, China; Mumbai and Kolkata, India; Ho Chi Minh City, Vietnam; Osaka-Kobe, Japan) are in the Asian continent, but it is not possible to overlook New York, Miami and New Orleans in America, as well as Alexandria, Lagos and Abidjam in Africa.
Adaptation strategies and actions to cope with SLR are decisive for managing the SRL risk and protecting vulnerable population. Abandonment of coastal cities and retreating inland, armoring defense (e.g., dikes and sea walls), beach nourishment, and structure elevation are the most frequent planned countermeasures. Road corridors should be protected by engineered structures such as levees to prevent human and social risks. Instantaneous sea level monitoring by remote sensing and ground sensors are often installed to prevent the flooding risk [104,105].
In Italy, the MOSE mobile gates will help to maintain the harbor and other existing activities in the Lagoon of Venice, and protect the historical city from flooding. It is composed of rows of retractable paratroopers placed at the so-called port mouths (the entrances connecting the lagoon with the open sea) of Lido, Malamocco and Chioggia (Figure 11).
The MOSE shall be able to temporarily isolate the Venice lagoon from the Adriatic Sea during high tide events. It has been designed to protect the area against up to a 3-m high tidal level and it will be operative for tidal levels greater than 110 cm.
A total of 55% of the Netherlands is situated below mean sea level: Its polder land is protected by dikes, dams and storm surge barriers. The current standards prescribe that hydraulic defenses should be re-assessed every 6 years, to verify their efficacy [106].
In the next decades, upgrading and raising coastal defenses will be a strategic activity to ensure life in urban environment [107]. For example, the Italian strategy on adaption to climate change [108] listed some options for adapting ports to climate change: They include elevating roads and warehouses at risk of flooding, increasing the height of the walls surrounding the warehouses, rearranging the port space, avoiding locating the warehouses far from vulnerable areas, and regularly dredging the bottom of the port areas.

6. Discussion

Urban transport infrastructures are a “community good”: They satisfy collective and primary needs, as well as they guarantee that everyone enjoys their fundamental rights through their utilization. Since the effects of climate change and the adaptation of the urban infrastructure system to it have an impact on, and concern entire communities and their wellbeing, every procedure adopted to estimate and evaluate these effects must be implemented along with technical, economical, and social impact assessment. Field and laboratory investigations are carried out to evaluate the technical performances of countermeasures adopted to mitigate the effects of climate changes. The economic valuation applied to the effects of climate change on infrastructures and related adaptation measures can be utilized at different levels: Estimation of the economic value of the impact produced by climate change; estimation of the economic value of the impact produced by the adaptation measures; evaluation of alternative adaptation measures. Regarding the social issue, all issues that directly and/or indirectly influence the members of any given community are considered as impacts. With the term impact, any effect perceived (interpreted or judged with the aim of establishing a value or a choice) and, above all, stated “directly” by the members of the involved community is considered. In this perspective, it is not the effect of climate change or the ensuing adaptation measures that are taken into account for assessment and evaluation, but how the members of the community involved perceive, interpret and judge their impact.
Therefore, a comprehensive sustainability approach leads to different conclusions for balancing often-conflicting objectives of economical, technical and social issues:
  • White or clear surface pavement materials, and permeable pavements can effectively undermine the urban heat island phenomenon; moreover, urban green infrastructures (UGI) can provide important benefits and mitigate consequences of urbanization. At this purpose, the Italian Decree about “Miminum Environmental Criteria” for urban environment [109] requires “cool” pavements (e.g., white stones, permeable concrete blocks, paving grids for grass parking lots, green walls) to prevent UHI. In very hot climates, passive countermeasure versus UHI should be adopted to improve the lives of citizens: e.g., air-conditioned bus stops, fresh air chambers, spraying cool water, wading pools. The technical performances of permeable pavement in terms of durability, and the economic, social and environmental consequences of passive countermeasures need further research;
  • The most efficient and technically feasible storm water management strategies are: Permeable paving in areas with low traffic volumes and/or not heavy traffic loads; modular interlocking block pavements that contribute to reducing runoff; in severe conditions, water squares, underground water chambers, floodable parking are floodable multifunctional spaces useful to manage urban hydrological findings. The mechanical performances of permeable pavements, and their decay of effectiveness during the service life are the most critical issues to be investigated; moreover, environmental, social, and operational costs of floodable areas should be analyzed;
  • Onerous armoring structures (e.g., dikes and sea walls) are the only defenses to SLR: Otherwise, citizens should leave coastal cities and retreat inland. Environment-friendly materials, construction and maintenance procedures have to be investigated.
Until now, the sustainability performances of countermeasures adopted to mitigate the effects of climate changes are evaluated using traditional valuation procedures (i.e., monetary approaches, non-monetary multicriteria approaches, mixed approaches that combine monetary and non-monetary inputs and outputs). Nevertheless, these criteria have proven to have several limitations regarding fact-finding and analysis. A first limitation regards an incomplete calculation of the socio-economic effects. In fact, the assessment and evaluation of the economic effects often considers only certain components (sectors or groups) of the involved community. Secondly, the valuations are not stated directly by members of the community. They are formulated by a valuation expert who interprets the community members’ viewpoint. Thirdly, not every single member of the community is consulted. This implies that the will of the entire community is not stated: The resulting economic judgement has neither general validity nor does it express general interest.
Therefore, inclusive procedures aimed at formulating a shared economic value of the social impact of climate change and the adaptation measures related to urban infrastructures need to synthetize a value that reflects the importance of an infrastructure system that could be damaged by climate change or needs to be adapted because of it.

7. Conclusions

Natural hazards and climate change affect planning, design, construction, maintenance, safety, and performance of transport infrastructures throughout their service life. Climate change impacts on the transport systems in three different sensitivity aspects: Infrastructure, transport operations and transport demand. Transport is a lifeline for the current industrialized society: When the movement of people, goods or services is hindered, vulnerability of the urban environment and population increases. Therefore, potential impacts of climate change on transport cannot be overlooked.
Increasing air temperature and extremization of weather phenomena expose transport infrastructures to severe risks related to hydro-geological events, flooding, storms, sea-level rise and other extreme weather events.
The strategies adopted or designed to contrast the effects of climate change on transport infrastructures pursue three main goals: To prevent the damages, protect the structures, and monitor and communicate to users the current conditions.
Engineered technologies provide more opportunities to counter temperatures and flooding externalities: Materials, structures and vegetation may contribute to different, but consistent objectives: Guaranteeing continuity and safety to transport services. For the sea rise level, available strategies are less variable: Only barriers (e.g., dikes and sea walls) can defense transport infrastructures, and people. In these scenarios, information on atmospheric and other physical conditions plays a strategic role. It may be integrated with intelligent transport systems, such as automated traffic-control and traveler-advisory systems, to transmit data on water levels and temperature, output from early warning systems, flood hazard mapping for storms, and safety-related messages.

Funding

This research received no external funding.

Acknowledgments

The Authors thank Marco Veronesi and acknowledge his work. Veronesi drew Figure 1, Figure 2, Figure 9, and Figure 11. The Authors thank Maria Vittoria Corazza, researcher at Department of Civil, Construction and Environmental Engineering, Sapienza University of Rome, because she shot the photo in Figure 3. The authors thank Engineer Buroni because she drew Figure 6 and allowed the use of data needed for Figure 5 and Figure 7. The authors thank the office ‘De Urbanisten’ because it is the source of Figure 8a–d.

Conflicts of Interest

The authors declare no conflict of interest.

References and Note

  1. Intergovernmental Panel on Climate Change. Climate Change 2014: Synthesis Report; Contribution of Working Groups I, II and III to the Fifth Assessment Report of the Intergovernmental Panel on Climate Change; Core Writing Team, Pachauri, R.K., Meyer, L.A., Eds.; IPCC: Geneva, Switzerland, 2014. [Google Scholar]
  2. Paltsev, S.; Monier, E.; Scott, J.; Sokolov, A.; Reilly, J. Integrated economic and climate projections for impact assessment. Clim. Chang. 2015, 131, 21–33. [Google Scholar] [CrossRef]
  3. Raleigh, C.; Jordan, L.; Salehyan, I. Assessing the Impact of Climate Change on Migration and Conflict; The Social Development Department, the World Bank Group: Washington, DC, USA, 2008. [Google Scholar]
  4. Beniston, M. Climate change and its impacts: Growing stress factors for human societies. Int. Rev. Red Cross 2010, 92, 557–568. [Google Scholar] [CrossRef]
  5. Zhang, Y.; Moran, M.S.; Nearing, M.A.; Ponce Campos, G.E.; Huete, A.R.; Buda, A.R.; Bosch, D.D.; Guneter, S.A.; Kitchen, S.G.; McNab, W.H.; et al. Extreme precipitation patterns and reductions of terrestrial ecosystem production across biomes. J. Geophys. Res. 2013, 118, 148–157. [Google Scholar] [CrossRef] [Green Version]
  6. Cooter, E.; Eder, B.K.; Rosenzweig, C.; Lynn, B.; Goldberg, R.; Knutson, C.; Hayes, M.; Wilhite, D.; Decarolis, J.; Barnett, T. Effects of Climate Change on Weather and Water; Air & Waste Management Association: Pittsburgh, PA, USA, 2005; pp. 32–35. [Google Scholar]
  7. European Commission. Communication from the Commission to the European Parliament, the Council, the European Economic and Social Committee and the Committee of the Regions. An EU Strategy on Adaptation to Climate Change; COM/2013/0216; European Commission: Brussels, Belgium, 2013. [Google Scholar]
  8. Organization for Economic Co-operation and Development. Infrastructure to 2030. Volume 2: Mapping Policy for Electricity, Water and Transport; OECD: Paris, France, 2007. [Google Scholar]
  9. Cirianni, F.; Fonte, F.; Leonardi, G.; Scopelliti, F. Analysis of Lifelines Transportation Vulnerability. Procedia Soc. Behav. Sci. 2012, 53, 29–38. [Google Scholar] [CrossRef]
  10. European Environmental Agency. Adaptation of Transport to Climate Change in Europe: Challenges and Options across Transport Modes and Stakeholders; European Environmental Agency: Copenhagen, Denmark, 2014. [Google Scholar]
  11. European Commission. Impacts of Climate Change on Transport: A Focus on Road and Rail Transport Infrastructures; European Commission: Brussels, Belgium, 2012. [Google Scholar]
  12. Frazer, L. Paving Paradise: The Peril of Impervious Surfaces. Environ. Health Perspect. 2005, 113, 456–462. [Google Scholar] [CrossRef] [PubMed]
  13. Kitchenham, B. Procedures for performing systematic reviews. Keele UK Keele Univ. 2004, 33, 1–26. [Google Scholar]
  14. Van Wee, B.; Banister, D. How to Write a Literature Review Paper? Transp. Rev. 2016, 36, 278–288. [Google Scholar]
  15. Akbari, H.; Kolokotsa, D. Three decades of urban heat islands and mitigation technologies research. Energy Build. 2016, 133, 834–852. [Google Scholar] [CrossRef]
  16. Norton, B.A.; Coutts, A.M.; Livesley, S.J.; Harris, R.J.; Hunter, A.M.; Williams, N.S.G. Planning for cooler cities: A framework to prioritise green infrastructure to mitigate high temperatures in urban landscapes. Landsc. Urban Plan. 2015, 134, 127–138. [Google Scholar] [CrossRef]
  17. Corazza, M.V.; Guida, U.; Musso, A.; Tozzi, M. From EBSF to EBSF_2: A Compelling Agenda for the Bus of the Future. A decade of research for more attractive and sustainable buses. In Proceedings of the 2016 IEEE 16th International Conference on Environment and Electrical Engineering (EEIC), Florence, Italy, 7–10 June 2016. [Google Scholar]
  18. Corazza, M.V.; Guida, U.; Musso, A.; Tozzi, M. A new generation of buses to support more sustainable urban transport policies: A path towards “greener” awareness among bus stakeholders in Europe. Res. Transp. Econ. 2016, 55, 20–29. [Google Scholar] [CrossRef]
  19. Musso, A.; Corazza, M.V. Visioning the bus system of the future: stakeholders’ perspective. Transp. Res. Rec. 2015, 2533, 109–117. [Google Scholar] [CrossRef]
  20. Carter, J.G.; Handley, J.; Butlin, T.; Gill, S. Adapting cities to climate change—Exploring the flood risk management role of green infrastructure landscapes. J. Environ. Plan. Manag. 2018, 61, 1535–1552. [Google Scholar] [CrossRef]
  21. Oke, T. The energetic basis of the urban heat island. Q. J. R. Meteorol. Soc. 1982, 108, 1–24. [Google Scholar] [CrossRef]
  22. Coutts, A.M.; Beringer, J.; Tapper, N.J. Impact of increasing urban density on local climate: Spatial and temporal variations in the surface energy balance in Melbourne, Australia. J. Appl. Meteorol. Clim. 2007, 46, 477–493. [Google Scholar] [CrossRef]
  23. Pomerantz, M. Are cooler surfaces a cost-effect mitigation of urban heat islands? Urban Clim. 2018, 24, 393–397. [Google Scholar] [CrossRef] [Green Version]
  24. UK Green Building Council. Demystifying Green Infrastructure; UK Green Building Council: London, UK, 2015. [Google Scholar]
  25. Dimoudi, A.; Nikolopoulou, M. Vegetation in the urban environment: Microclimatic analysis and benefits. Energy Build. 2003, 35, 69–76. [Google Scholar] [CrossRef]
  26. Zhou, W.; Wang, J.; Cadenasso, M.L. Effects of the spatial configuration of trees on urban heat mitigation: A comparative study. Remote. Sens. Environ. 2017, 195, 1–12. [Google Scholar] [CrossRef]
  27. Santamouris, M. Using cool pavements as a mitigation strategy to fight urban heat island—A review of the actual developments. Renew. Sustain. Energy Rev. 2013, 26, 224–240. [Google Scholar] [CrossRef]
  28. Akbari, H.; Menon, S.; Rosenfeld, A. Global cooling: Increasing world-wide urban albedos to offset CO2. Clim. Chang. 2009, 94, 275–286. [Google Scholar] [CrossRef]
  29. Mohajerani, A.; Bakaric, J.; Jeffrey-Bailey, T. The urban heat island effect, its causes, and mitigation, with reference to the thermal properties of asphalt concrete. J. Environ. Manag. 2017, 197, 522–538. [Google Scholar] [CrossRef] [PubMed]
  30. Al-Obaidi, K.M.; Ismail, M.; Abdul Rahman, A.M. Passive cooling techniques through reflective and radiative roofs in tropical houses in Southeast Asia: A literature review. Front. Arch. Res. 2014, 3, 283–297. [Google Scholar] [CrossRef]
  31. Doulos, L.; Santamouris, M.; Livada, I. Passive cooling of outdoor urban spaces: The role of materials. Energy 2004, 77, 231–249. [Google Scholar] [CrossRef]
  32. Coseo, P.; Larsen, L. Cooling the Heat Island in Compact Urban Environments: The Effectiveness of Chicago’s Green Alley Program. Procedia Eng. 2015, 118, 691–710. [Google Scholar] [CrossRef]
  33. Baldinelli, G.; Bonafoni, S. Analysis of albedo influence on surface urban heat island by spaceborne detection and airborne thermography. In New Trends in Image Analysis and Processing—ICIAP 2015 Workshops; Lecture Notes in Computer Science; Springer: Basel, Switzerland, 2015; Volume 9281, pp. 95–102. [Google Scholar]
  34. Georgakis, C.; Santamouris, M. Experimental investigation of air flow and temperature distribution in deep urban canyons for natural ventilation purposes. Energy Build. 2006, 38, 367–376. [Google Scholar] [CrossRef]
  35. Wu, Z.; Wang, Y.; Kong, F.; Sun, R.; Chen, L.; Zhan, W. Analysis of the thermal characteristics of selected urban surfaces in a typical residential area based on infrared thermography. Shengtai Xuebao/Acta Ecol. Sin. 2016, 36, 5421–5431. [Google Scholar]
  36. Sha, A.; Liu, Z.; Tang, K.; Li, P. Solar heating reflective coating layer (SHRCL) to cool the asphalt pavement surface. Constr. Build. Mater. 2017, 139, 355–364. [Google Scholar] [CrossRef]
  37. Santamouris, M.; Kolokotsa, D. Urban Climate Mitigation Techniques; Routledge: Abdigon, UK, 2016; ISBN 9781317658634. [Google Scholar]
  38. De Bondt, A.H.; Jansen, R. Generation and Saving of Energy via Asphalt Pavement Surfaces. Fachbeitrag in OIB—de Bondt, 2006. Available online: https://www.google.com/url?sa=t&rct=j&q=&esrc=s&source=web&cd=1&ved=2ahUKEwi_uqvqqLDeAhVBzlMKHRlOCxkQFjAAegQIABAC&url=https%3A%2F%2Fooms.nl%2Fglobal%2Fciviel%2F_ooms%2Fafbeeldingen%2Fresearch%2520development%2Fadb_rj_savingofenergy_2006.pdf&usg=AOvVaw0XpC_W_lCSAbNn7g5nJraX (accessed on 20 October 2018).
  39. Mallick, R.B.; Bao-Liang, C.; Bhowmick, S. Reduction of urban heat island effect through harvest of heat energy from asphalt pavements. In Proceedings of the 2nd International Conference on Countermeasures to Urban Heat Island, Berkeley, CA, USA, 21–23 September 2009. [Google Scholar]
  40. Santero, N.J.; Harvey, J.; Horvath, A. Environmental policy for long-life pavements. Transp. Res. Part D Transp. Environ. 2011, 16, 129–136. [Google Scholar] [CrossRef]
  41. Wang, D.C.; Wang, L.C.; Cheng, K.Y.; Lin, J.D. Benefit Analysis of Permeable Pavement on Sidewalks. Int. J. Pavement Res. Technol. 2010, 3, 207–215. [Google Scholar]
  42. Parahoo, S.K.; Harvey, H.L.; Abdelrahim Radi, G.Y. Satisfaction of Tourists with Public Transport: An Empirical Investigation in Dubai. J. Travel Tour. Mark. 2014, 31, 1004–1017. [Google Scholar] [CrossRef]
  43. Lall, N. Delhi bus stops provide a breath of fresh air. The Times of India, 27 December 2016. [Google Scholar]
  44. Cooling off at the bus stop. Shenzen Daily, 2013. Available online: https://www.google.com/url?sa=t&rct=j&q=&esrc=s&source=web&cd=19&cad=rja&uact=8&ved=2ahUKEwijvZXuqbDeAhWN3VMKHb1vCvkQFjASegQIBxAB&url=http%3A%2F%2Fwww.szdaily.com%2Fcontent%2F2013-07%2F10%2Fcontent_8282108.htm&usg=AOvVaw1I6vzNPpq2YPO6b4xfo_Iy (accessed on 20 October 2018).
  45. Yamagata, H.; Nasu, M.; Yoshizawa, M.; Miyamoto, A.; Minamiyama, M. Heat island mitigation using water retentive pavement sprinkled with reclaimed wastewater. Water Sci. Technol. 2008, 57, 763–771. [Google Scholar] [CrossRef] [PubMed]
  46. Yoshioka, M.; Tosaka, H.; Nakagawa, K. Experimental and Numerical Studies of the Effects of Water Sprinkling on Urban Pavement on Heat Island Mitigation. In Proceedings of the Fall Meeting 2007, San Francisco, CA, USA, 10–14 December 2007. [Google Scholar]
  47. Li, H.; Harvey, J.T.; Holland, T.J.; Kayhanian, M. The use of reflective and permeable pavements as a potential practice for heat island mitigation and stormwater management. Environ. Res. Lett. 2013, 8, 015023. [Google Scholar] [CrossRef] [Green Version]
  48. Jacobsen, J.K.; Leiren, M.; Saarinen, J. Natural hazard experiences and adaptations: A study of winter climate-induced road closures in Norway. Nor. J. Geogr. 2016, 70, 292–305. [Google Scholar] [CrossRef] [Green Version]
  49. Hoffmann, P.; Osterle, H.; Gersterngarbe, F.W. Les effects du changement climatique sure le service hivernal en Allemagne/The effects of climate change on winter service in Germany. Routes-Roads 2014, 361, 31–35. [Google Scholar]
  50. Andersson, A.K.; Chapman, L. The impact of climate change on winter road maintenance and traffic accidents in West Midlands, UK. Accid. Anal. Prev. 2011, 43, 284–289. [Google Scholar] [CrossRef] [PubMed]
  51. Muthumani, A.; Huang, J.; Shi, X. Fixed automated spray technology: Current practices and a case study. In Proceedings of the 94th Annual Meeting Transportation Research Board, Washington, DC, USA, 11–15 January 2015. [Google Scholar]
  52. Shi, X.; El Ferradi, N.; Strong, C.K. Fixed Automated Spray Technology for Winter Maintenance: The State of the Practice in North America. In Proceedings of the TRB 86th Annual Meeting Compendium of Papers, Washington, DC, USA, 21–25 January 2007. [Google Scholar]
  53. Ye, Z.; Wu, J.; El Ferradi, N.; Shi, X. Anti-icing for key highway locations: Fixed automated spray technology. Can. J. Civ. Eng. 2013, 40, 11–18. [Google Scholar] [CrossRef]
  54. Boshung. Available online: https://boschung.com/en/highway-road/fixed-de-icing (accessed on 25 September 2017).
  55. Li, Y.; Wu, H.; Wang, G.; Zhu, B.; Shi, B. Experimental Study on the Electrical Road Heating System for Snow Melting. J. Beijing Univ. Technol. 2006, 3, 218–222. [Google Scholar]
  56. Li, Y.; Hu, S.; Wu, H.; Li, J.; Hou, L. Modeling and Analyzing on the Electric Heating Cable System for Deicing and Melting Snow on Road Surface. J. Beijing Univ. Technol. 2008, 12, 014. [Google Scholar]
  57. Gao, Q.; Yu, M.; Liu, X. Technique and Analysis of Snow-Ice Melting System on Road by Thermal Energy Storage. J. Beijing Univ. Technol. 2007, 5, 170–174. [Google Scholar]
  58. Luo, S.; Yang, X. Performance evaluation of high-elastic asphalt mixture containing deicing agent Mafilon. Constr. Build. Mater. 2015, 94, 494–501. [Google Scholar] [CrossRef]
  59. Li, F.; Wang, Z. Experiment on Road Performance of Asphalt Mixture with Automatic Long-term Snowmelt Agent. J. Highw. Transp. Res. Dev. (Engl. Ed.) 2012, 6, 11–17. [Google Scholar] [CrossRef]
  60. Morita, K.; Tago, M. Snow-Melting on Sidewalks with Ground-Coupled Heat Pumps in a Heavy Snowfall City. In Proceedings of the World Geothermal Congress 2005, Antalya, Turkey, 24–29 April 2005. [Google Scholar]
  61. Asfour, S.; Bernardin, F.; Mauduit, C.; Toussaint, E.; Piau, J.M. Hydrothermal study of roads with de-freezing surface, obtained by the circulation of a warm fluid in a bonding porous asphalt layer. In 8th RILEM International Symposium on Testing and Characterization of Sustainable and Innovative Bituminous Materials; RILEM Bookseries; Springer: Basel, Switzerland, 2016; Volume 11, pp. 545–556. [Google Scholar]
  62. McMahon, P. An Analysis of Factors Contributing to “Walking Along Roadway” Crashes: Research Study and Guidelines for Sidewalks and Walkways; DIANE Publishing: Darby, MT, USA, 2002. [Google Scholar]
  63. Italian Ministry of Transportation. Direttiva sulla Corretta e Uniforme Applicazione delle Norme del Codice della Strada in Materia di Segnaletica e Criteri per l’Installazione e la Manutenzione; Italian Ministry of Transportation: Rome, Italy, 2006.
  64. Buroni, C. Progetto di rigenerazione urbana del quartiere Prenestino-Centocelle a Roma. Master’s Thesis, Building Engineering, Sapienza University, Rome, Italy, 2017. [Google Scholar]
  65. Papa, R.; Galderisi, A.; Vigo Majello, M.C.; Saretta, E. Smart and resilient cities. A systemic approach for developing cross-sectoral strategies in the face of climate change. J. Land Use Mobil. Environ. 2015, 8, 19–49. [Google Scholar]
  66. Yang, N.; Soraya, M. Water by design: A shifting paradigm in urban built environment. In Proceedings of the SB 13 Singapore—Realizing Sustainability in the Tropics, Singapore, 9–10 September 2013. [Google Scholar]
  67. Silva, M.M.; Costa, J.P. Flood Adaptation Measures Applicable in the Design of Urban Public Spaces: Proposal for a Conceptual Framework. Water 2016, 8, 284. [Google Scholar] [CrossRef]
  68. De Urbanisten. Available online: http://www.urbanisten.nl/wp/?portfolio=waterpleinen (accessed on 6 November 2018).
  69. Verhoeven. Rotterdam Climate Proof. 2015. Available online: http://www.rotterdamclimateinitiative.nl/documents/2015-en-ouder/Documenten/ROTTERDAM%20CLIMATE%20PROOF%20ADAPTATION%20PROGRAMME%202013.pdf (accessed on 20 October 2018).
  70. Dreiseitl, H.; Wanschura, B.; Laloushek, W. Water Management in Singapore’s Bishan Ang-Mo Kio Park. In Proceedings of the 3rd GRF One Health Summit 2015 Session Water and Health, Davos, Switzerland, 4–7 October 2015. [Google Scholar]
  71. Irvine, K.; Chua, L.; Eikass, H.S. The Four National Taps of Singapore: A Holistic Approach to Water Resources Management from Drainage to Drinking Water. J. Water Manag. Model. 2014. [Google Scholar] [CrossRef] [Green Version]
  72. Velasco, M.; Russo, B.; Cabello, A.; Termes, M.; Sunyer, D.; Malgrat, P. Assessment of the effectiveness of structural and nonstructural measures to cope with global change impacts in Barcelona. Flood Risk Manag. 2016, 11, 55–68. [Google Scholar] [CrossRef]
  73. Saurí, D.; Palau-Rof, L. Urban Drainage in Barcelona: From Hazard to Resource? Water Altern. 2017, 10, 475–492. [Google Scholar]
  74. Copenhagen Municipality. CPH 2025 Climate Plan; Copenhagen Municipality: Copenhagen, Denmark, 2012. [Google Scholar]
  75. Bouw, M. Designing with Risk: Balancing Global Risk and Project Risks. In Climate Change Adaption in North America; Climate Change Management Book Series (CCM); Springer: Basel, Switzerland, 2017; pp. 193–208. [Google Scholar]
  76. Solecki, W.; Pelling, M.; Dorsch, M.; Garschagen, M.; Krains, S. Risk Management Regimes Transitions in Megacities. In Proceedings of the 4th International Climate Change Adaption Conference, Rotterdam, The Netherlands, 10–13 May 2016. [Google Scholar]
  77. Visschedijk, A. Implementation of the Greater New Orleans Urban Water Plan: Identifying and Overcoming Socio-Institutional Constraints. Master’s Thesis, TU Delft, Delft, The Netherlands, 2014. [Google Scholar]
  78. Fields, B.; Thomas, J.; Wagner, J.A. Living with Water in the Era of Climate Change: Lessons from the Lafitte Greenway in Post-Katrina New Orleans. J. Plan. Educ. Res. 2016, 37, 309–321. [Google Scholar] [CrossRef]
  79. Booth, D.B.; Leavitt, J. Field Evaluation of Permeable Pavement Systems for Improved Stormwater Management. J. Am. Plan. Assoc. 2007, 65, 314–325. [Google Scholar] [CrossRef]
  80. Scholz, M.; Grabowiecki, P. Review of permeable pavement systems. Build. Environ. 2007, 42, 3830–3836. [Google Scholar] [CrossRef]
  81. Imran, H.M.; Akib, S.; Karim, M.R. Permeable pavement and stormwater management systems: A review. Environ. Technol. 2013, 34, 2649–2656. [Google Scholar] [CrossRef] [PubMed]
  82. Valinski, N.A.; Chandler, D.G. Infiltration performance of engineered surfaces commonly used for distributed stormwater management. J. Environ. Manag. 2015, 160, 297–305. [Google Scholar] [CrossRef] [PubMed] [Green Version]
  83. Mitchell, G.F.; Riefler, R.G.; Russ, A. Vegetated Biofilter for Post Construction Storm Water Manangement for Linear Transportation Projects; Report No. USFHWA/OH-2010/7; Ohio Research Institute for Transportation and the Environment: Athens, GA, USA, 2010. [Google Scholar]
  84. Ambrose, R.F.; Winfrey, B.K. Comparison of stormwater biofiltration systems in Southeast Australia and Southern California. Wiley Interdiscip. Rev. Water 2015, 2, 131–146. [Google Scholar] [CrossRef]
  85. Economides, C. Green Infrastructure: Sustainable Solutions in 11 Cities across the United States; Columbia University Water Centre: New York, NY, USA, 2014. [Google Scholar]
  86. Bassani, M.; Comino, E.; Rosso, M.; Garcia, A.; Ricci, R.; Bertola, F.; Canonico, F.; Tefa, L.; Ciurca, F. Pervious concrete pavements and vegetated boxes as bio-filters and retention systems of pavement storm water: Environmental and engineering performance assessment. In Proceedings of the 1st International Congress on Transport Infrastructure and Systems, Rome, Italy, 10–12 April 2017. [Google Scholar]
  87. Newman, A.P.; Coupe, S.J.; Smith, H.G.; Puehmeier, T.; Bond, P. The microbiology of permeable pavements. In Proceedings of the 8th International Conference on Concrete Block Paving, San Francisco, CA, USA, 6–8 November 2006. [Google Scholar]
  88. Faiz, A.; Shah, B.; Faiz, S. Climate resilient slope stabilization for transport infrastructures. In Proceedings of the 1st International Congress on Transport Infrastructure and Systems, Rome, Italy, 10–12 April 2017. [Google Scholar]
  89. Read, J.; Fletcher, T.D.; Wevill, T.; Deletic, A. Plant traits that enhance pollutant removal from stormwater in biofiltration systems. Int. J. Phytoremediat. 2010, 12, 34–53. [Google Scholar] [CrossRef]
  90. Sañudo-Fontaneda, L.A.; Rodriguez-Hernandez, J.; Vega-Zamanillo, A.; Castro-Fresno, D. Laboratory analysis of the infiltration capacity of interlocking concrete block pavements in car parks. Water Sci. Technol. 2013, 67, 675–681. [Google Scholar] [CrossRef] [PubMed] [Green Version]
  91. Yong, C.; McCarthy, D.; Deletic, A. Predicting physical clogging of porous and permeable pavements. J. Hydrol. 2013, 481, 48–55. [Google Scholar] [CrossRef]
  92. Regione Abruzzo. Sistemi di Allerta per la Protezione dei Sottopassi Carrabili. POR FESR Abruzzo 2007–2013—Asse IV—Attività 3.1.d) e Programma IPA Adriatic—Progetto–ADRIARadNet. 2015.
  93. Ganiron, T.U. Perception on the Effectivity of Flood Control Pump Station in Lagusnilad underpass in Lawton”. Bachelor’s Thesis, Civil Engineering Department, FEATI University, Manila, Philippines, 2004. [Google Scholar]
  94. Ganiron, T.U. An Analysis of the Public Perception of Floods in Manila City. Int. J. Disaster Recovery Bus. Contin. 2014, 5, 1–14. [Google Scholar] [CrossRef]
  95. Rahman, S.; Rahman, M.A. Climate extremes and challenges to infrastructure development in coastal cities in Bangladesh. Weather Clim. Extremes 2015, 7, 96–108. [Google Scholar] [CrossRef]
  96. Cazenave, A.; Nerem, S.R. Present-day sea level change: Observations and causes. Rev. Geophys. 2004, 42. [Google Scholar] [CrossRef] [Green Version]
  97. Neumann, J.E.; Price, J.; Chinowsky, P.; Wright, L.; Ludwig, L.; Streeter, R.; Jones, R.; Smith, J.B.; Perkins, W.; Jantarasami, L.; et al. Climate change risks to US infrastructure: Impacts on roads, bridges, coastal development, and urban drainage. Clim. Chang. 2015, 131, 97–109. [Google Scholar] [CrossRef]
  98. Neumann, J.E.; Emanuel, K.A.; Ravela, S.; Ludwig, L.C.; Verly, C. Risks of coastal storm surge and the effect of sea-level rise in the Red River Delta, Vietnam. Sustainability 2015, 7, 6553–6572. [Google Scholar] [CrossRef]
  99. Kemp, A.C.; Hill, T.D.; Vane, C.H.; Cahill, N.; Orton, P.M.; Talke, S.A.; Parnell, A.C.; Sanborn, K.; Hartig, E.K. Relative sea-level trends in New York City during the past 1500 years. Holocene 2017, 27, 1169–1186. [Google Scholar] [CrossRef]
  100. Seavitt, C. Yangtze River Delta Project. Scenar. J. Scenar. 03 Rethink. Infrastruct, 2013. Available online: https://scenariojournal.com/article/yangtze-river-delta-project/ (accessed on 20 October 2018).
  101. Cheng, H.Q.; Chen, J.Y. Adapting cities to sea level rise: A perspective from Chinese deltas. Adv. Clim. Chang. Res. 2017, 8, 130–136. [Google Scholar] [CrossRef]
  102. Pirazzoli, P.A.; Umgiesser, G. The projected “MOSE” barriers against flooding in Venice (Italy) and the expected global sea-level rise. J. Mar. Environ. Eng. 2006, 8, 247–261. [Google Scholar]
  103. Organization for Economic Co-operation and Development. Environmental Outlook to 2050; OECD Publishing: Paris, France, 2012. [Google Scholar]
  104. Schumann, G.J.P. Remote Sensing in Flood Monitoring and Management. Remote. Sens. 2015, 7, 17013–17015. [Google Scholar] [CrossRef]
  105. Chen, N.; Du, W.; Song, F.; Chen, Z. FLCNDEMF: An Event Metamodel for Flood Process Information Management under the Sensor Web Environment. Remote. Sens. 2015, 7, 7231–7256. [Google Scholar] [CrossRef] [Green Version]
  106. Klijin, F.; de Bruijin, K.M.; Knoop, J.; Kwadijk, J. Assessment of the Netherlands’ Flood Risk Management Policy under Global Change. Ambio 2012, 41, 180–192. [Google Scholar] [CrossRef] [PubMed]
  107. Jonkman, S.N.; Hillen, M.M.; Nicholls, R.J.; Kanning, W.; van Ledden, M. Costs of adapting coastal defences to sea-level rise—New estimates and their implications. J. Coast. Res. 2013, 29, 1212–1226. [Google Scholar] [CrossRef]
  108. Italian Ministry of the Environment. Strategia Nazionale di Adattamento ai Cambiamenti Climatici; Italian Ministry of the Environment: Rome, Italy, 2015.
  109. Italian Ministry of the Environment. Adozione dei Criteri Ambientali Minimi per l’Affidamento di Servizi di Progettazione e Lavori per la Nuova Costruzione, Ristrutturazione e Manutenzione di Edifi ci per la Gestione dei Cantieri della Pubblica Amministrazione e Criteri Ambientali Minimi per le Forniture di Ausili per l’Incontinenza; Italian Ministry of the Environment: Rome, Italy, 2015.
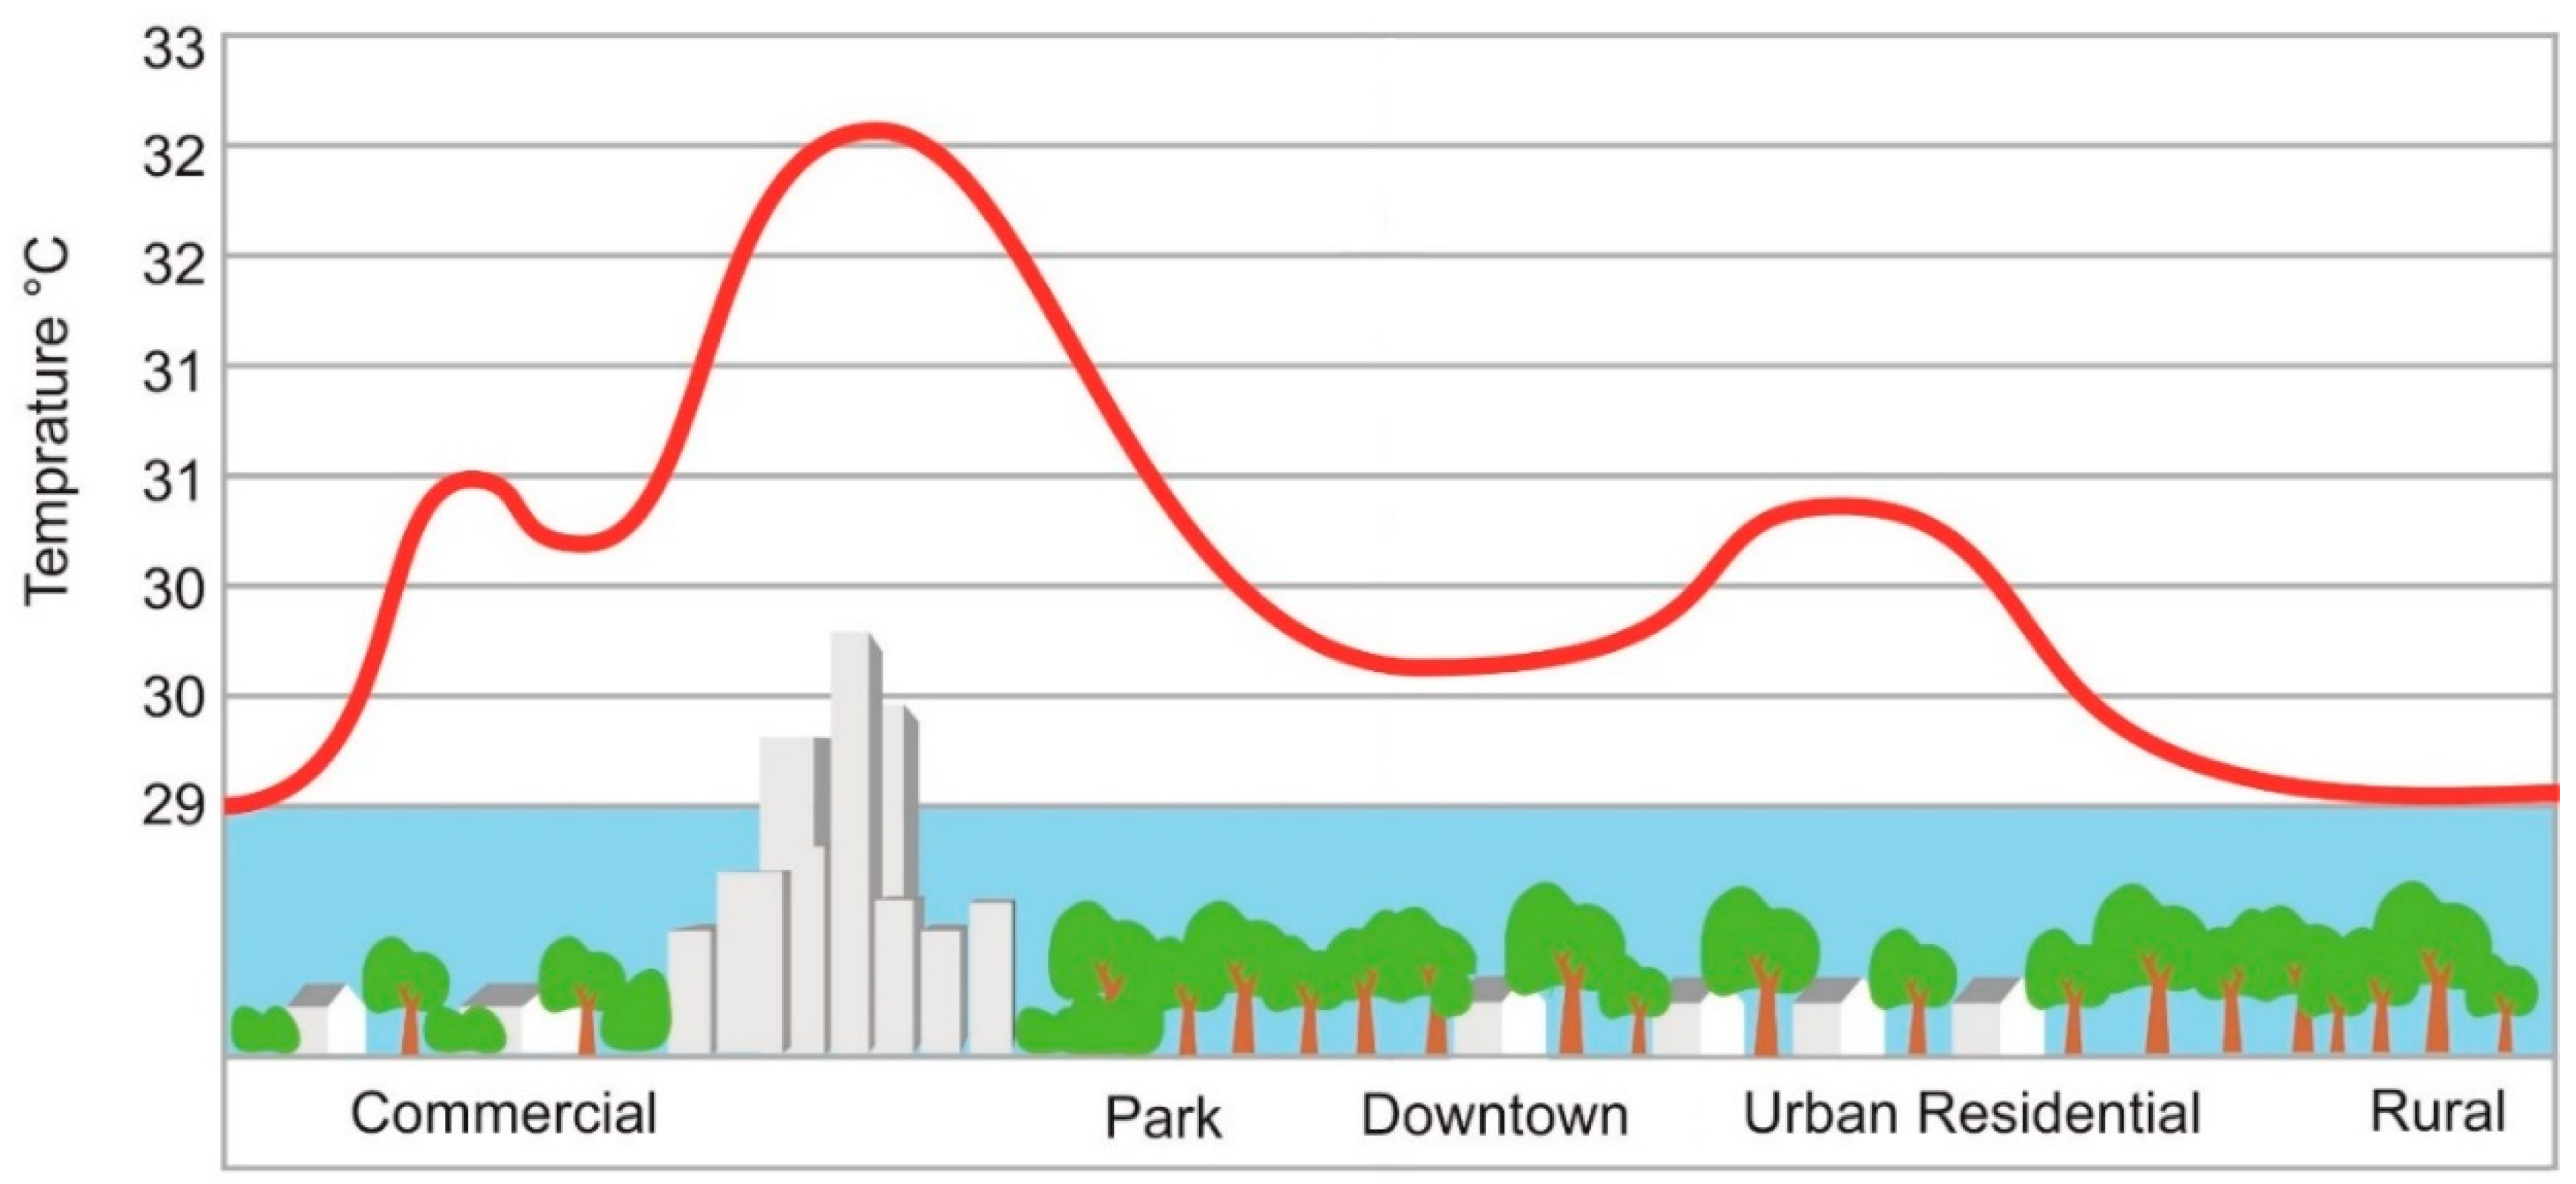
Figure 1. Urban heat island temperature profile.
Sustainability 10 04098 g001
Figure 2. Urban green and gray infrastructures (adapted from Reference [24]).
Sustainability 10 04098 g002
Figure 3. Example of a wading pool (courtesy of M.V. Corazza).
Sustainability 10 04098 g003
Figure 4. Example of Fixed Automated Spray Technology Systems (FAST) [54].
Sustainability 10 04098 g004
Figure 5. Water balance (Data from Reference [64], draw by authors).
Sustainability 10 04098 g005
Figure 6. Permeability map of a quarter in Rome (With permission from Author of [64]).
Sustainability 10 04098 g006
Figure 7. Rain water balance of a quarter in Rome (Data from Reference [64], draw by authors). (a) Type of surfaces; (b) water balance.
Sustainability 10 04098 g007
Figure 8. Water square conditions (With permission from Author of [68]). (a) Typical condition; (b) after a heavy rainfall (30 times a year); (c) most severe condition (once a year); (d) when it freezes, it becomes an ice rink.
Sustainability 10 04098 g008
Figure 9. Porous pavement: Water management.
Sustainability 10 04098 g009
Figure 10. Examples of flooded underpasses.
Sustainability 10 04098 g010
Figure 11. MOSE layouts.
Sustainability 10 04098 g011