Determinants of Firm’s Export Performance in China’s Automobile Industry

 ,
,  ,
,
Abstract
1. Introduction
Problem Statement
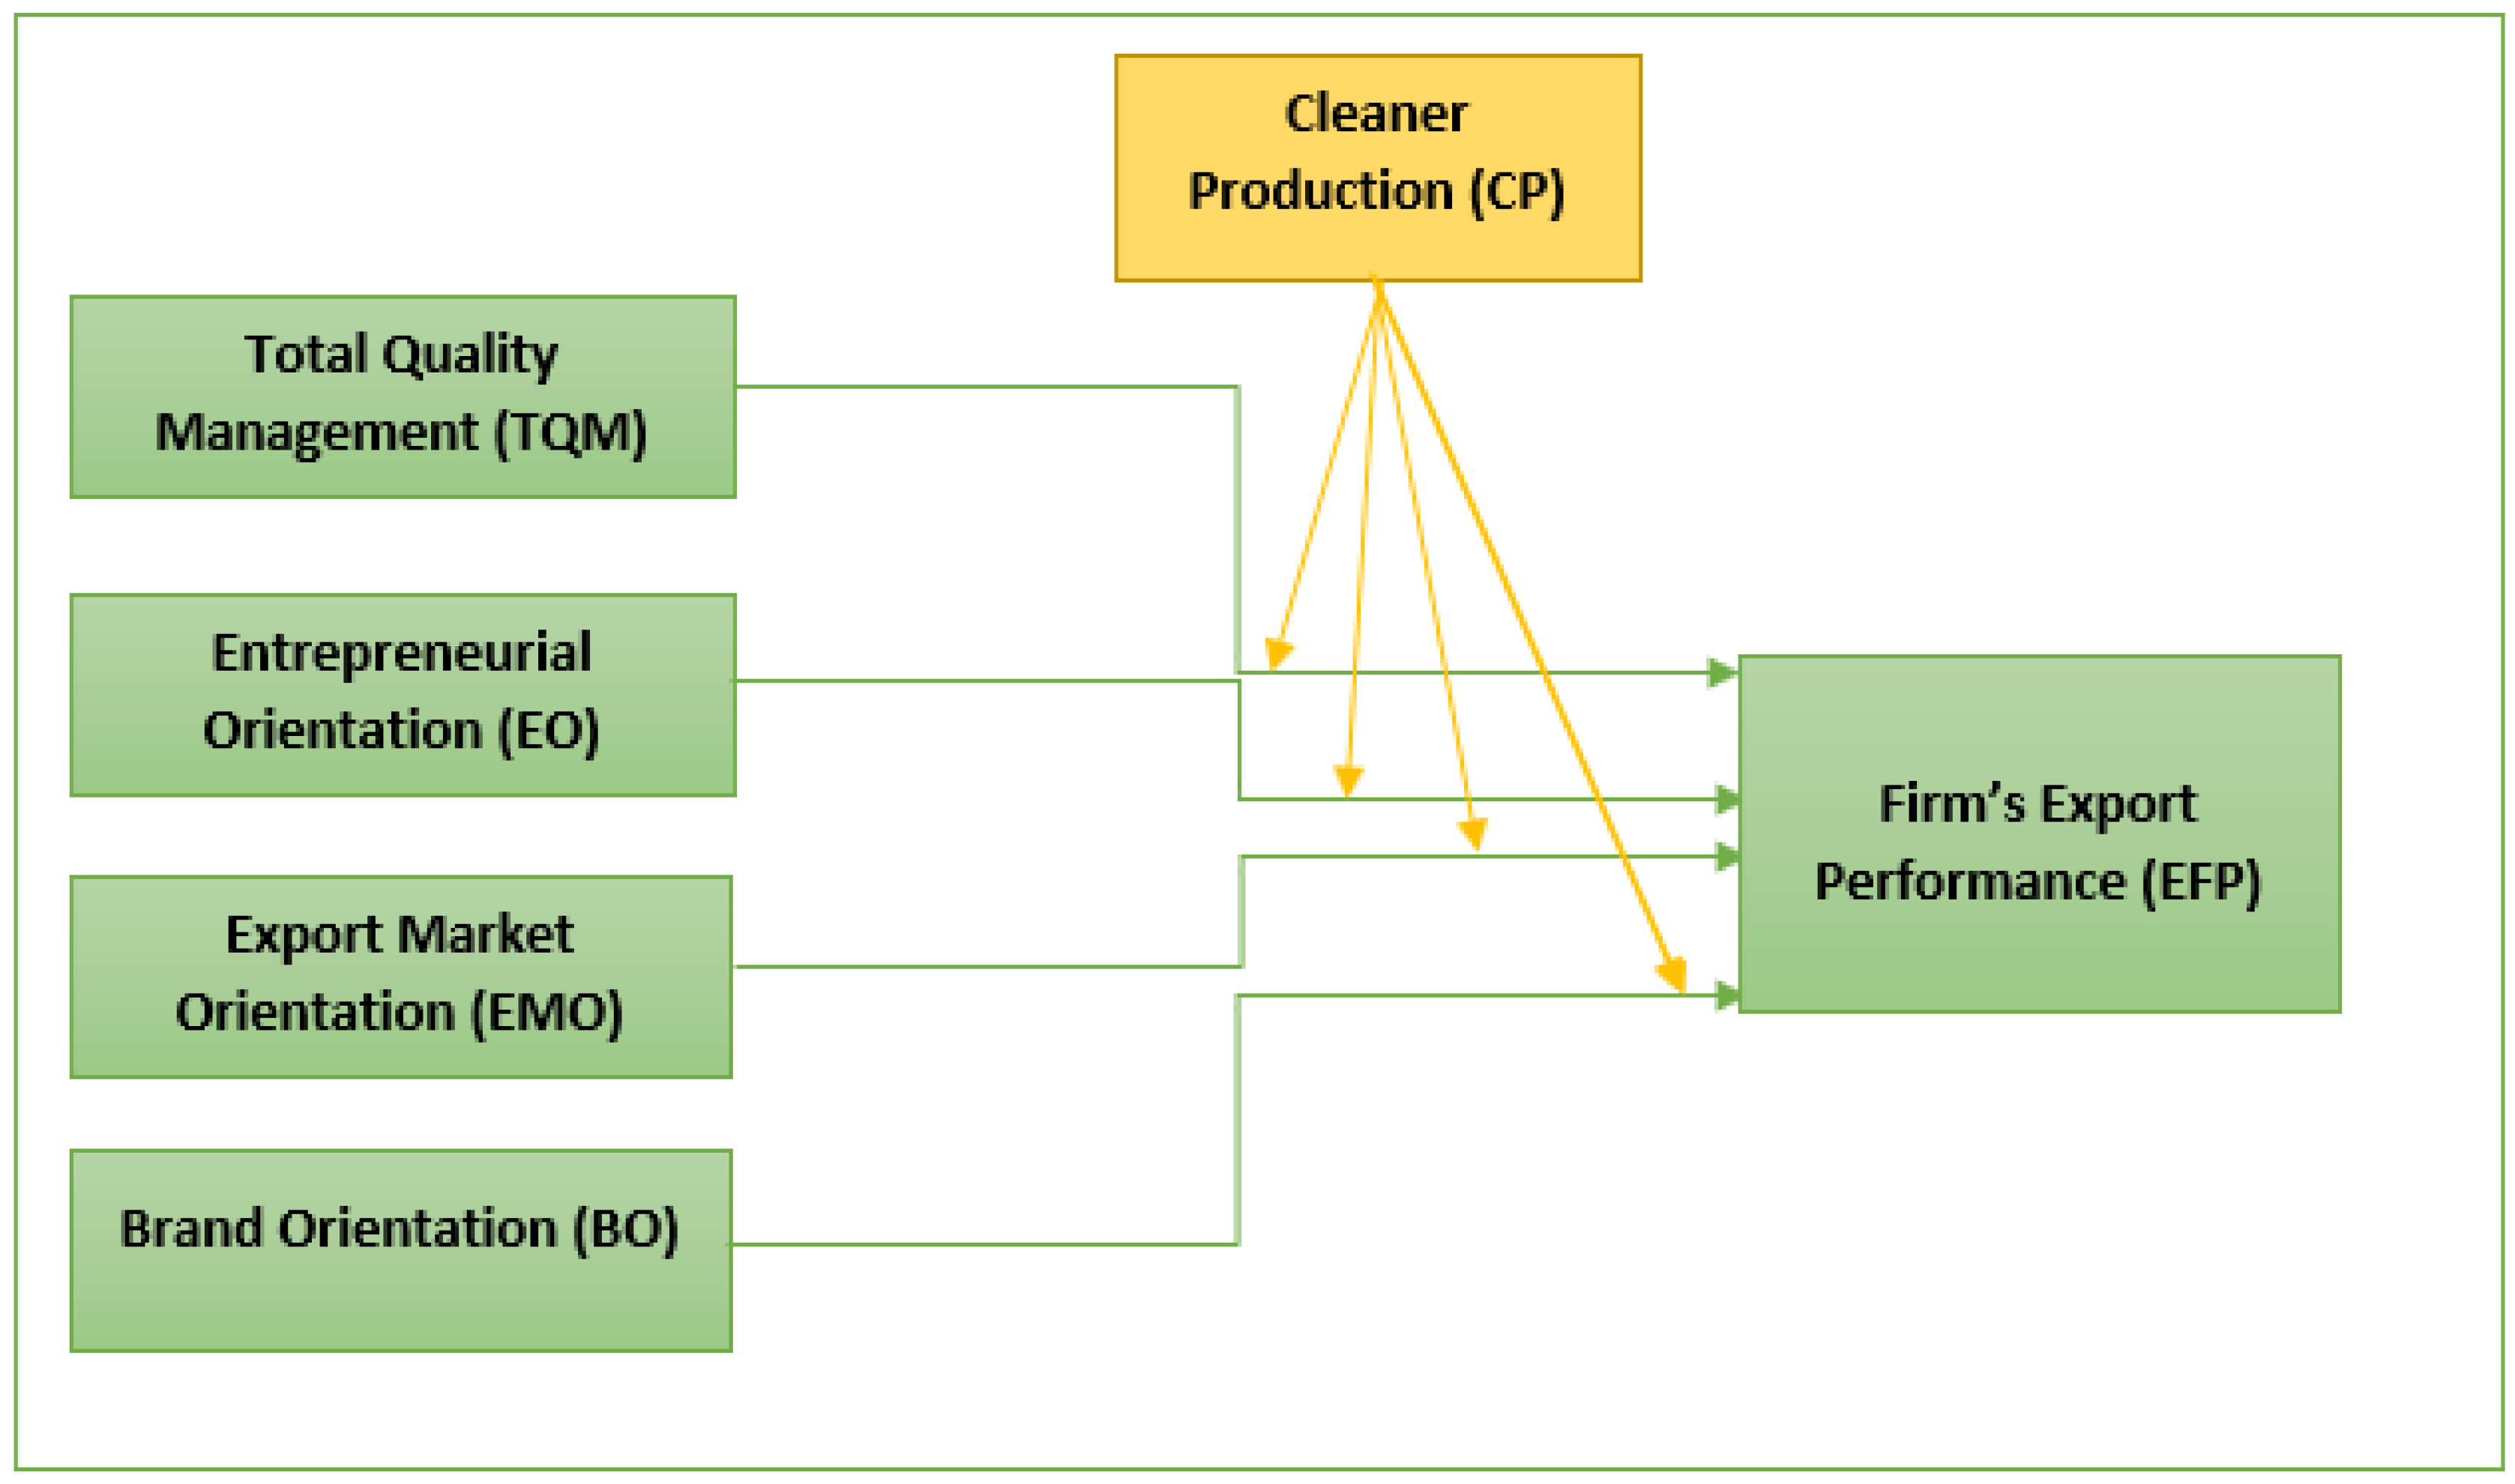
- To evaluate the role of total quality management (TQM) on firm export performance (FEP).
- To evaluate the role of entrepreneurial orientation (EO) on firm export performance (FEP).
- To investigate the role of export market orientation (EMO) on firm export performance (FEP).
- To investigate the role of brand orientation (BO) on firm export performance (FEP).
- To investigate the moderating role of clearance production (CP) on variables of interest.
2. Literature Review
2.1. Total Quality Management (TQM) and Firm Export Performance (FEP)
2.2. Entrepreneurial Orientation (EO) and Firm Export Performance (FEP)
2.3. Export Market Orientation (EMO) and Firm Export Performance (FEP)
2.4. Brand Orientation (BO) and Firm’s Export Performance (FEP)
2.5. Moderating Role of Clearance Production (CP)
2.6. Theoretical Framework
3. Research Methodology
4. Data Analysis and Discussion
4.1. Goodness of Fit
4.2. Structural Model
5. Research Findings and Discussion
5.1. Conclusions
5.2. Limitations and Future Recommendations
Author Contributions
Funding
Conflicts of Interest
Appendix A. Scale of the Study
References
- Sachon, M.R.J.; Zhang, D.; Zhang, Y.; Castillo, C. The Chinese Automotive Industry in 2016; Universidad de Navarra: Pamplona, Spain, 2016. [Google Scholar]
- Chen, Y.; Lawell, C.-Y.L.; Wang, Y. The Chinese Automobile Industry and Government Policy; Working Paper; University of California at Davis: Davis, CA, USA, 2017. [Google Scholar]
- Dana, L.P.; Hamilton, R.T.; Wick, K. Deciding to export: An exploratory study of Singaporean entrepreneurs. J. Int. Entrep. 2009, 7, 79–87. [Google Scholar] [CrossRef]
- Dana, L.P.; Wright, R.W. International entrepreneurship: Research priorities for the future. Int. J. Glob. Small Bus. 2009, 3, 90–134. [Google Scholar] [CrossRef]
- Dana, L.P.; Etemad, H. A strategic response model for the internationalisation of small or medium-sized Australian enterprises. Bond Manag. Rev. 1994, 4, 31–42. [Google Scholar]
- Cavusgil, S.T.; Zou, S. Marketing strategy-performance relationship: An investigation of the empirical link in export market ventures. J. Mark. 1994, 58, 1–21. [Google Scholar] [CrossRef]
- Shoham, A. Export performance: A conceptualization and empirical assessment. J. Int. Mark. 1998, 59–81. [Google Scholar]
- Crick, D.; Dana, L.-P. 14. A comparative, exploratory investigation into the perceptions of internationalizing firms in Singapore and the UK. In Emerging Paradigms in International Entrepreneurship; Edward Elgar Publishing: Cheltenham, UK, 2004; p. 319. [Google Scholar]
- Dana, L.P.; Dana, T.E.; Spence, M. Public policy and international expansion of high-technology SMEs: A research agenda. Int. J. Entrep. Innov. Manag. 2004, 4, 116–123. [Google Scholar] [CrossRef]
- Dana, L.P.; Hamilton, R.T.; Pauwels, B. Evaluating offshore and domestic production in the apparel industry: The small firm’s perspective. J. Int. Entrep. 2007, 5, 47. [Google Scholar] [CrossRef]
- Dana, L.P.; Paulin, C. Internationalisation of the New Zealand nutraceutical industry. J. Int. Bus. Entrep. Dev. 2008, 3, 171–187. [Google Scholar] [CrossRef]
- Dana, L.P. Handbook of Research on European Business and Entrepreneurship: Towards a Theory of Internationalization; Edward Elgar Publishing: Cheltenham, UK, 2008. [Google Scholar]
- Dana, L.P.; Grimwood, S.; William, G. Export incentives and international entrepreneurship in New Zealand firms. J. Int. Bus. Entrep. Dev. 2009, 4, 1–21. [Google Scholar] [CrossRef]
- Etemad, H.; Wilkinson, I.; Dana, L.P. Internetization as the necessary condition for internationalization in the newly emerging economy. J. Int. Entrep. 2010, 8, 319–342. [Google Scholar] [CrossRef]
- Chen, J.; Sousa, C.M.P.; He, X. The determinants of export performance: A review of the literature 2006–2014. Int. Mark. Rev. 2016, 33, 626–670. [Google Scholar] [CrossRef]
- İpek, İ. The Resource-Based View within the Export Context: An Integrative Review of Empirical Studies. J. Glob. Mark. 2017, 31, 157–179. [Google Scholar] [CrossRef]
- Lages, L.F.; Silva, G.; Styles, C. Relationship capabilities, quality, and innovation as determinants of export performance. J. Int. Mark. 2009, 17, 47–70. [Google Scholar] [CrossRef]
- Abeykoon, M.; de Alwis, A. The Impact of Total Quality Management Practices on Export Performance of Apparel Exporters of Sri Lanka. Kelaniya J. Hum. Resour. Manag. 2016, 10, 104–127. [Google Scholar] [CrossRef]
- Sadikoglu, E.; Olcay, H. The effects of total quality management practices on performance and the reasons of and the barriers to TQM practices in Turkey. Adv. Decis. Sci. 2014, 2014, 537605. [Google Scholar] [CrossRef]
- Ng, P.K.; Jee, K.S. Innovating TQM, CE and KM for productive manufacturing in a Malaysian firm. Total Qual. Manag. Bus. Excell. 2012, 23, 1089–1105. [Google Scholar] [CrossRef]
- De Clercq, D.; Zhou, L. Entrepreneurial strategic posture and performance in foreign markets: The critical role of international learning effort. J. Int. Mark. 2014, 22, 47–67. [Google Scholar] [CrossRef]
- Anderson, B.S.; Eshima, Y. The influence of firm age and intangible resources on the relationship between entrepreneurial orientation and firm growth among Japanese SMEs. J. Bus. Ventur. 2013, 28, 413–429. [Google Scholar] [CrossRef]
- Eggers, F.; Kraus, S.; Hughes, M.; Laraway, S.; Snycerski, S. Implications of customer and entrepreneurial orientations for SME growth. Manag. Decis. 2013, 51, 524–546. [Google Scholar] [CrossRef]
- Laukkanen, T.; Nagy, G.; Hirvonen, S.; Reijonen, H.; Pasanen, M. The effect of strategic orientations on business performance in SMEs: A multigroup analysis comparing Hungary and Finland. Int. Mark. Rev. 2013, 30, 510–535. [Google Scholar] [CrossRef]
- Reijonen, H.; Hirvonen, S.; Nagy, G.; Laukkanen, T.; Gabrielsson, M. The impact of entrepreneurial orientation on B2B branding and business growth in emerging markets. Ind. Mark. Manag. 2015, 51, 35–46. [Google Scholar] [CrossRef]
- Boso, N.; Oghazi, P.; Cadogan, J.W.; Story, V.M. Entrepreneurial and market-oriented activities, financial capital, environment turbulence, and export performance in an emerging economy. J. Small Bus. Strateg. 2016, 26, 1. [Google Scholar]
- Ajayi, B. The Impact of Entrepreneurial Orientation and Networking Capabilities on the Export Performance of Nigerian Agricultural SMEs. J. Entrep. Innov. Emerg. Econ. 2016. [Google Scholar] [CrossRef]
- Cadogan, J.W.; Boso, N.; Story, V.M.; Adeola, O. Export strategic orientation–performance relationship: Examination of its enabling and disenabling boundary conditions. J. Bus. Res. 2016, 69, 5046–5052. [Google Scholar] [CrossRef]
- Styles, C.; Gray, S.; Kropp, F.; Lindsay, N.J.; Shoham, A. Entrepreneurial, market, and learning orientations and international entrepreneurial business venture performance in South African firms. Int. Mark. Rev. 2006, 23, 504–523. [Google Scholar]
- Samson, A.; Mahmood, R. Fostering Export Performance in SMEs: The Roles of Export Market Orientation and Learning Orientation in Turbulent Environment. Int. J. Econ. Perspect. 2015, 9, 28. [Google Scholar]
- Yovovich, B. What is your brand really worth. Adweek’s Mark. Week 1988, 8, 18–24. [Google Scholar]
- Merrilees, B.; Rundle-Thiele, S.; Lye, A. Marketing capabilities: Antecedents and implications for B2B SME performance. Ind. Mark. Manag. 2011, 40, 368–375. [Google Scholar] [CrossRef]
- Reijonen, H.; Laukkanen, T.; Komppula, R.; Tuominen, S. Are growing SMEs more market-oriented and brand-oriented? J. Small Bus. Manag. 2012, 50, 699–716. [Google Scholar] [CrossRef]
- Gromark, J.; Melin, F. The underlying dimensions of brand orientation and its impact on financial performance. J. Brand Manag. 2011, 18, 394–410. [Google Scholar] [CrossRef]
- Foltean, F.S.; Feder, E.S. The Complementary Effect of Export Market Orientation and Entrepreneurial Orientation on the International Performance of SMEs. In Proceedings of the 2014 Global Marketing Conference at Singapore, Singapore, 15–18 July 2014; pp. 2070–2079. [Google Scholar]
- Leonidou, L.C.; Fotiadis, T.A.; Christodoulides, P.; Spyropoulou, S.; Katsikeas, C.S. Environmentally friendly export business strategy: Its determinants and effects on competitive advantage and performance. Int. Bus. Rev. 2015, 24, 798–811. [Google Scholar] [CrossRef]
- Severo, E.A.; de Guimarães, J.C.F.; Dorion, E.C.H.; Nodari, C.H. Cleaner production, environmental sustainability and organizational performance: An empirical study in the Brazilian Metal-Mechanic industry. J. Clean. Prod. 2015, 96, 118–125. [Google Scholar] [CrossRef]
- Zeng, S.; Meng, X.; Yin, H.; Tam, C.M.; Sun, L. Impact of cleaner production on business performance. J. Clean. Prod. 2010, 18, 975–983. [Google Scholar] [CrossRef]
- Molina-Azorín, J.F.; Claver-Cortés, E.; Pereira-Moliner, J.; Tarí, J.J. Environmental practices and firm performance: An empirical analysis in the Spanish hotel industry. J. Clean. Prod. 2009, 17, 516–524. [Google Scholar] [CrossRef]
- González, P.; Sarkis, J.; Adenso-Díaz, B. Environmental management system certification and its influence on corporate practices: Evidence from the automotive industry. Int. J. Oper. Prod. Manag. 2008, 28, 1021–1041. [Google Scholar] [CrossRef]
- Kaličanin, Đ.; Veljković, S.; Bogetić, Z. Brand orientation and financial performance nexus. Industrija 2015, 43, 155–173. [Google Scholar] [CrossRef]
- Hernandez-Perlines, F. Moderating effect of absorptive capacity on the entrepreneurial orientation of international performance of family businesses. J. Fam. Bus. Manag. 2018, 8, 58–74. [Google Scholar] [CrossRef]
- Kayabasi, A.; Kayabasi, A.; Mtetwa, T.; Mtetwa, T. Impact of marketing effectiveness and capabilities, and export market orientation on export performance: Evidence from Turkey. Eur. Bus. Rev. 2016, 28, 532–559. [Google Scholar] [CrossRef]
- Mac, L.; Evangelista, F. The relative impact of market orientation and entrepreneurship on export performance: Do we really know enough? J. Glob. Mark. 2016, 29, 266–281. [Google Scholar] [CrossRef]
- Amin, M.; Thurasamy, R.; Aldakhil, A.M.; Kaswuri, A.H.B. The effect of market orientation as a mediating variable in the relationship between entrepreneurial orientation and SMEs performance. Nankai Bus. Rev. Int. 2016, 7, 39–59. [Google Scholar] [CrossRef]
- Baron, R.M.; Kenny, D.A. The moderator–mediator variable distinction in social psychological research: Conceptual, strategic, and statistical considerations. J. Personal. Soc. Psychol. 1986, 51, 1173. [Google Scholar] [CrossRef]
- Weerawardena, J.; Coote, L. An empirical investigation into entrepreneurship and organizational innovation-based competitive strategy. J. Res. Mark. Entrep. 2001, 3, 51–70. [Google Scholar] [CrossRef]
- Spanjol, J.; Qualls, W.J.; Rosa, J.A. How many and what kind? The role of strategic orientation in new product ideation. J. Prod. Innov. Manag. 2011, 28, 236–250. [Google Scholar] [CrossRef]
- Barney, J. Firm resources and sustained competitive advantage. J. Manag. 1991, 17, 99–120. [Google Scholar] [CrossRef]
- Belén Escrig-Tena, A. TQM as a competitive factor: A theoretical and empirical analysis. Int. J. Qual. Reliab. Manag. 2004, 21, 612–637. [Google Scholar] [CrossRef]
- Tena, A.B.E.; Llusar, J.C.B.; Puig, V.R. Measuring the relationship between total quality management and sustainable competitive advantage: A resource-based view. Total Qual. Manag. 2001, 12, 932–938. [Google Scholar] [CrossRef]
- Yunis, M.; Jung, J.; Chen, S. TQM, strategy, and performance: A firm-level analysis. Int. J. Qual. Reliab. Manag. 2013, 30, 690–714. [Google Scholar] [CrossRef]
- Barney, J.; Wright, M.; Ketchen, D.J., Jr. The Resource-Based View of the Firm: Ten Years after 1991; Elsevier: Amsterdam, The Netherlands, 2001. [Google Scholar]
- Teece, D.J. Explicating dynamic capabilities: The nature and microfoundations of (sustainable) enterprise performance. Strateg. Manag. J. 2007, 28, 1319–1350. [Google Scholar] [CrossRef]
- Brouthers, K.D.; Nakos, G.; Dimitratos, P. SME entrepreneurial orientation, international performance, and the moderating role of strategic alliances. Entrep. Theory Pract. 2015, 39, 1161–1187. [Google Scholar] [CrossRef]
- Wiklund, J.; Shepherd, D. Knowledge-based resources, entrepreneurial orientation, and the performance of small and medium-sized businesses. Strateg. Manag. J. 2003, 24, 1307–1314. [Google Scholar] [CrossRef]
- Radulovich, L.; Javalgi, R.; Scherer, R.F. Intangible Resources Influencing the International Performance of Professional Service SMEs in an Emerging Market: Evidence from India. Int. Mark. Rev. 2018. [Google Scholar] [CrossRef]
- Ketchen, D.J., Jr.; Hult, G.T.M.; Slater, S.F. Toward greater understanding of market orientation and the resource-based view. Strateg. Manag. J. 2007, 28, 961–964. [Google Scholar] [CrossRef]
- Singh, H.; Saufi, R.A.; Hassan, A.A.G. Export market orientation strategy, external environment, and export performance of SMEs in Malaysia. Prabandhan Indian J. Manag. 2017, 10, 32–49. [Google Scholar] [CrossRef]
- Hirvonen, S.; Laukkanen, T. Brand orientation in small firms: An empirical test of the impact on brand performance. J. Strateg. Mark. 2014, 22, 41–58. [Google Scholar] [CrossRef]
- Urde, M. Brand orientation: A mindset for building brands into strategic resources. J. Mark. Manag. 1999, 15, 117–133. [Google Scholar] [CrossRef]
- Miemczyk, J.; Howard, M.; Johnsen, T.E. Dynamic development and execution of closed-loop supply chains: A natural resource-based view. Supply Chain Manag. Int. J. 2016, 21, 453–469. [Google Scholar] [CrossRef]
- de Guimaraes, J.C.F.; Severo, E.A.; de Vasconcelos, C.R.M. The influence of entrepreneurial, market, knowledge management orientations on cleaner production and the sustainable competitive advantage. J. Clean. Prod. 2018, 174, 1653–1663. [Google Scholar] [CrossRef]
- Pfau, L.D. Total quality management gives companies a way to enhance position in global marketplace. Ind. Eng. 1989, 21, 17. [Google Scholar]
- Berry, T.H. Managing the Total Quality Transformation; McGraw-Hill: New York, NY, USA, 1991. [Google Scholar]
- Shafiq, M.; Lasrado, F.; Hafeez, K. The effect of TQM on organisational performance: Empirical evidence from the textile sector of a developing country using SEM. Total Qual. Manag. Bus. Excell. 2017. [Google Scholar] [CrossRef]
- Bou-Llusar, J.C.; Escrig-Tena, A.B.; Roca-Puig, V.; Beltrán-Martín, I. An empirical assessment of the EFQM Excellence Model: Evaluation as a TQM framework relative to the MBNQA Model. J. Oper. Manag. 2009, 27, 1–22. [Google Scholar] [CrossRef]
- Corredor, P.; Goñi, S. TQM and performance: Is the relationship so obvious? J. Bus. Res. 2011, 64, 830–838. [Google Scholar] [CrossRef]
- Yusr, M.M. Innovation capability and its role in enhancing the relationship between TQM practices and innovation performance. J. Open Innov. Technol. Mark. Complex. 2016, 2, 1. [Google Scholar] [CrossRef]
- Mahmood, K.; Mahmood Ahmad Qureshi, I.; Nisar, A. An empirical study on measurement of performance through TQM in Pakistani aviation manufacturing industry. Int. J. Qual. Reliab. Manag. 2014, 31, 665–680. [Google Scholar] [CrossRef]
- Ahmad, M.; Zakuan, N.; Ahmad, J.; Takala, J. Meta-analysis of the TQM impact on business performance amongst regions and countries. Int. J. Ind. Syst. Eng. 2015, 20, 155–164. [Google Scholar] [CrossRef]
- Hassan, M.U.; Hassan, S.; Shaukat, S.; Nawaz, M.S. Relationship between TQM Elements and Organizational Performance: An Empirical Study of Manufacturing Sector of Pakistan. Pak. J. Commer. Soc. Sci. 2013, 7, 01–18. [Google Scholar]
- Ho, T.C.; Ahmad, N.H.; Ramayah, T. Competitive Capabilities and Business Performance among Manufacturing SMEs: Evidence from an Emerging Economy, Malaysia. J. Asia-Pac. Bus. 2016, 17, 37–58. [Google Scholar] [CrossRef]
- Kot, S. Sustainable Supply Chain Management in Small and Medium Enterprises. Sustainability 2018, 10, 1143. [Google Scholar] [CrossRef]
- Lumpkin, G.T.; Dess, G.G. Clarifying the entrepreneurial orientation construct and linking it to performance. Acad. Manag. Rev. 1996, 21, 135–172. [Google Scholar] [CrossRef]
- Zahra, S.A.; Covin, J.G. Contextual influences on the corporate entrepreneurship-performance relationship: A longitudinal analysis. J. Bus. Ventur. 1995, 10, 43–58. [Google Scholar] [CrossRef]
- Covin, J.G.; Slevin, D.P. Strategic management of small firms in hostile and benign environments. Strateg. Manag. J. 1989, 10, 75–87. [Google Scholar] [CrossRef]
- Hurley, R.F.; Hult, G.T.M. Innovation, market orientation, and organizational learning: An integration and empirical examination. J. Mark. 1998, 62, 42–54. [Google Scholar] [CrossRef]
- Miller, D.; Friesen, P.H. Archetypes of strategy formulation. Manag. Sci. 1978, 24, 921–933. [Google Scholar] [CrossRef]
- Felzensztein, C.; Ciravegna, L.; Robson, P.; Amorós, J.E. Networks, entrepreneurial orientation, and internationalization scope: Evidence from Chilean small and medium enterprises. J. Small Bus. Manag. 2015, 53, 145–160. [Google Scholar] [CrossRef]
- Feder, E.-S. International market, entrepreneurial and learning orientations as drivers of firm performance. Stud. Univ. Babes-Bolyai 2015, 60, 3. [Google Scholar]
- Fernández-Mesa, A.; Alegre, J. Entrepreneurial orientation and export intensity: Examining the interplay of organizational learning and innovation. Int. Bus. Rev. 2015, 24, 148–156. [Google Scholar] [CrossRef]
- Monteiro, A.P.; Soares, A.M.; Rua, O.L. Linking intangible resources and export performance: The role of entrepreneurial orientation and dynamic capabilities. Bal. J. Manag. 2017, 12, 329–347. [Google Scholar] [CrossRef]
- Kohli, A.K.; Jaworski, B.J. Market orientation: The construct, research propositions, and managerial implications. J. Mark. 1990, 1–18. [Google Scholar] [CrossRef]
- Kohli, A.K.; Jaworski, B.J.; Kumar, A. MARKOR: A measure of market orientation. J. Mark. Res. 1993, 467–477. [Google Scholar] [CrossRef]
- Narver, J.C.; Slater, S.F. The effect of a market orientation on business profitability. J. Mark. 1990, 20–35. [Google Scholar] [CrossRef]
- Slater, S.F.; Narver, J.C. The positive effect of a market orientation on business profitability: A balanced replication. J. Bus. Res. 2000, 48, 69–73. [Google Scholar] [CrossRef]
- Cadogan, J.W.; Paul, N.J.; Salminen, R.T.; Puumalainen, K.; Sundqvist, S. Key antecedents to “export” market-oriented behaviors: A cross-national empirical examination. Int. J. Res. Mark. 2001, 18, 261–282. [Google Scholar] [CrossRef]
- Chang, Y.-S.; Fang, S.-R. Enhancing Export Performance for Business Markets: Effects of Interorganizational Relationships on Export Market Orientation (EMO). J. Bus. Bus. Mark. 2015, 22, 211–228. [Google Scholar] [CrossRef]
- Singh, H.; Mahmood, R. Determining the effect of export market orientation on export performance of small and medium enterprises in Malaysia: An exploratory study. Adv. Manag. Appl. Econ. 2013, 3, 223. [Google Scholar]
- Lin, K.H.; Huang, K.-F.; Peng, Y.-P. Impact of export market orientation on export performance: A relational perspective. Balt. J. Manag. 2014, 9, 403–425. [Google Scholar] [CrossRef]
- Navarro, A.; Acedo, F.J.; Losada, F.; Ruzo, E. Integrated model of export activity: Analysis of heterogeneity in managers’ orientations and perceptions on strategic marketing management in foreign markets. J. Mark. Theory Pract. 2011, 19, 187–204. [Google Scholar] [CrossRef]
- Cadogan, J.W.; Diamantopoulos, A.; Mortanges, D. A measure of export market orientation: Scale development and cross-cultural validation. J. Int. Bus. Stud. 1999, 30, 689–707. [Google Scholar] [CrossRef]
- Boso, N.; Annan, J.; Adeleye, I.; Iheanachor, N.; Narteh, B. Examining the Paths from Export Strategic Orientations to Export Performance: The Mediating Role of Export Resource Transformation Capability. Thunderbird Int. Bus. Rev. 2016, 60, 207–230. [Google Scholar] [CrossRef]
- Jing, Z.; Zhu, M. Market orientation, product innovation and export performance: Evidence from Chinese manufacturers. J. Strateg. Mark. 2016, 25, 377–397. [Google Scholar]
- Anees-ur-Rehman, M.; Saraniemi, S.; Ulkuniemi, P.; Hurmelinna-laukkanen, P. The strategic hybrid orientation and brand performance of B2B SMEs. J. Small Bus. Enterp. Dev. 2017, 24, 585–606. [Google Scholar] [CrossRef]
- Mutlu, H.M.; Aksoy, H. Strategic Orientations, Firm Capabilities, and Export Performance: An Empirical Analysis in Turkey. Int. J. Econ. Pract. Theor. 2014, 4, 214–221. [Google Scholar]
- Yin Wong, H.; Merrilees, B. The performance benefits of being brand-orientated. J. Prod. Brand Manag. 2008, 17, 372–383. [Google Scholar] [CrossRef]
- Simboli, A.; Taddeo, R.; Morgante, A. Analysing the development of Industrial Symbiosis in a motorcycle local industrial network: The role of contextual factors. J. Clean. Prod. 2014, 66, 372–383. [Google Scholar] [CrossRef]
- Simboli, A.; Raggi, A.; Rosica, P. Life cycle assessment of process eco-innovations in an SME automotive supply network. Sustainability 2015, 7, 13761–13776. [Google Scholar] [CrossRef]
- Yu, F.; Han, F.; Cui, Z. Evolution of industrial symbiosis in an eco-industrial park in China. J. Clean. Prod. 2015, 87, 339–347. [Google Scholar] [CrossRef]
- Puente, M.R.; Arozamena, E.R.; Evans, S. Industrial symbiosis opportunities for small and medium sized enterprises: Preliminary study in the Besaya region (Cantabria, Northern Spain). J. Clean. Prod. 2015, 87, 357–374. [Google Scholar] [CrossRef]
- Silva, A.S.; Medeiros, C.F.; Vieira, R.K. Cleaner Production and PDCA cycle: Practical application for reducing the Cans Loss Index in a beverage company. J. Clean. Prod. 2017, 150, 324–338. [Google Scholar] [CrossRef]
- Cardoso de Oliveira Neto, G.; de Souza, S.M.; Baptista, E.A.; Cardoso Correia, A.J. Implementing cleaner production in an automotive company: An application of material input per unit of service tool to measure environmental and economic advantages. Acta Sci. Technol. 2017, 39. [Google Scholar] [CrossRef]
- Telukdarie, A.; Buckley, C.; Koefoed, M. The importance of assessment tools in promoting cleaner production in the metal finishing industry. J. Clean. Prod. 2006, 14, 1612–1621. [Google Scholar] [CrossRef]
- Orsato, R.J.; Wells, P. U-turn: The rise and demise of the automobile industry. J. Clean. Prod. 2007, 15, 994–1006. [Google Scholar] [CrossRef]
- Orth, C.M.; Baldin, N.; Zanotelli, C.T. Solid waste generation in the production process of an automobile industry: A contribution to its reduction. Gestão Prod. 2014, 21, 447–460. [Google Scholar] [CrossRef]
- Kaenzig, J.; Friot, D.; Saadé, M.; Margni, M.; Jolliet, O. Using life cycle approaches to enhance the value of corporate environmental disclosures. Bus. Strateg. Environ. 2011, 20, 38–54. [Google Scholar] [CrossRef]
- Pandey, A.; Brent, A.C. Application of technology management strategies and methods to identify and assess cleaner production options: Cases in the South African Automotive industry. S. Afr. J. Ind. Eng. 2008, 19, 171–182. [Google Scholar] [CrossRef]
- Khan, Z. Cleaner production: An economical option for ISO certification in developing countries. J. Clean. Prod. 2008, 16, 22–27. [Google Scholar] [CrossRef]
- Taylor, B. Encouraging industry to assess and implement cleaner production measures. J. Clean. Prod. 2006, 14, 601–609. [Google Scholar] [CrossRef]
- Getzner, M. The quantitative and qualitative impacts of clean technologies on employment. J. Clean. Prod. 2002, 10, 305–319. [Google Scholar] [CrossRef]
- Dorion, E.C.H.; Olea, P.M.; Camargo, M.E.; Nodari, C.; da Cruz, M.R. Cleaner production: Cases of the metal-mechanic automotive cluster of Serra Gacha, Brazil. Afr. J. Bus. Manag. 2012, 6, 10232–10237. [Google Scholar]
- Hernández-Perlines, F.; Rung-Hoch, N. Sustainable entrepreneurial orientation in family firms. Sustainability 2017, 9, 1212. [Google Scholar] [CrossRef]
- Oliveira, J.A.; Oliveira, O.J.; Ometto, A.R.; Ferraudo, A.S.; Salgado, M.H. Environmental Management System ISO 14001 factors for promoting the adoption of Cleaner Production practices. J. Clean. Prod. 2016, 133, 1384–1394. [Google Scholar] [CrossRef]
- Dentchev, N.; Baumgartner, R.; Dieleman, H.; Jóhannsdóttir, L.; Jonker, J.; Nyberg, T.; Rauter, R.; Rosano, M.; Snihur, Y.; Tang, X. Embracing the variety of sustainable business models: Social entrepreneurship, corporate intrapreneurship, creativity, innovation, and other approaches to sustainability challenges. J. Clean. Prod. 2016. [Google Scholar] [CrossRef]
- Pipatprapa, A.; Huang, H.H.; Huang, C.H. The role of quality management & innovativeness on green performance. Corp. Soc. Resp. Environ. Manag. 2017, 24, 249–260. [Google Scholar]
- Automobiles & Motorcycles directory. China Company Database, 2017. Available online: http://chinacompanydatabase.com/ (accessed on 28 July 2018).
- Krejcie, R.V.; Morgan, D.W. Determining sample size for research activities. Educ. Psychol. Meas. 1970, 30, 607–610. [Google Scholar] [CrossRef]
- Saunders, M.; Lewis, P.; Thornhill, A. Research Methods for Business Students; Pearson Education Limited: Harlow, UK, 2009; Volume 5. [Google Scholar]
- Calantone, R.J.; Tamer Cavusgil, S.; Schmidt, J.B.; Shin, G.C. Internationalization and the dynamics of product adaptation—An empirical investigation. J. Prod. Innov. Manag. 2004, 21, 185–198. [Google Scholar] [CrossRef]
- Chenhall, R.H. Reliance on manufacturing performance measures, total quality management and organizational performance. Manag. Account. Res. 1997, 8, 187–206. [Google Scholar] [CrossRef]
- Ibeh, K.I. Furthering export participation in less performing developing countries: The effects of entrepreneurial orientation and managerial capacity factors. Int. J. Soc. Econ. 2004, 31, 94–110. [Google Scholar] [CrossRef]
- Tajeddini, K.; Ratten, V. The moderating effect of brand orientation on inter-firm market orientation and performance. J. Strateg. Mark. 2017, 1–31. [Google Scholar] [CrossRef]
- Hair, J.F., Jr.; Hult, G.T.M.; Ringle, C.; Sarstedt, M. A Primer on Partial Least Squares Structural Equation Modeling (PLS-SEM), 2nd ed.; SAGE: Thousand Oaks, CA, USA, 2016. [Google Scholar]
- Hair, J.F.; Hult, G.T.M.; Ringle, C.M.; Sarstedt, M. A Primer on Partial Least Squares Structural Equation Modeling (PLS-SEM), 1st ed.; SAGE: Los Angeles, CA, USA, 2014. [Google Scholar]
- Hair, J.F.; Anderson, R.E.; Babin, B.J.; Black, W.C. Multivariate Data Analysis: A Global Perspective; Pearson: Upper Saddle River, NJ, USA, 2010; Volume 7. [Google Scholar]
- Nunnally, J.C.; Bernstein, I.H. Psychometric Theory, 1st ed.; McGraw-Hill: New York, NY, USA, 1978. [Google Scholar]
- Cohen, J.; Cohen, P.; West, S.G.; Aiken, L.S. Applied Multiple Regression/Correlation Analysis for the Behavioral Sciences; Routledge: Abingdon, UK, 2013. [Google Scholar]
- Cwynar, A.; Cwynar, W.; Wais, K.; Parda, R. Loan Perception and Loan-Related Attitude of Poles: Evidence from the Field. Forum Sci. Oeconomia 2016, 4, 37–58. [Google Scholar]
- Sulphey, M.; Alkahtani, N.S. Economic security and sustainability through social entrepreneurship: The current Saudi scenario. J. Secur. Sustain. Issues 2016, 6, 3. [Google Scholar] [CrossRef]
- Rafinda, A.; Rafinda, A.; Witiastuti, R.S.; Suroso, A.; Trinugroho, I. Board diversity, risk and sustainability of bank performance: Evidence from India. J. Secur. Sustain. Issues 2018, 7, 793–806. [Google Scholar] [CrossRef]
- Imran, M.; Hamid, S.; Aziz, A. The influence of TQM on export performance of SMEs: Empirical evidence from manufacturing sector in Pakistan using PLS-SEM. Manag. Sci. Lett. 2018, 8, 483–496. [Google Scholar] [CrossRef]
- Imran, M.; Aziz, A.; Hamid, S.; Shabbir, M.; Salman, R.; Jian, Z. The mediating role of total quality management between entrepreneurial orientation and SMEs export performance. Manag. Sci. Lett. 2018, 8, 519–532. [Google Scholar] [CrossRef]
- Faizan, R.; Nair, S.L.S.; Haque, A.U. The Effectiveness of Feminine and Masculine Leadership Styles in Relation to Contrasting Genders’ Performances. Pol. J. Manag. Stud. 2018, 17, 78–91. [Google Scholar]
- Cadogan, J.W.; Diamantopoulos, A.; Siguaw, J.A. Export market-oriented activities: Their antecedents and performance consequences. J. Int. Bus. Stud. 2002, 33, 615–626. [Google Scholar] [CrossRef]


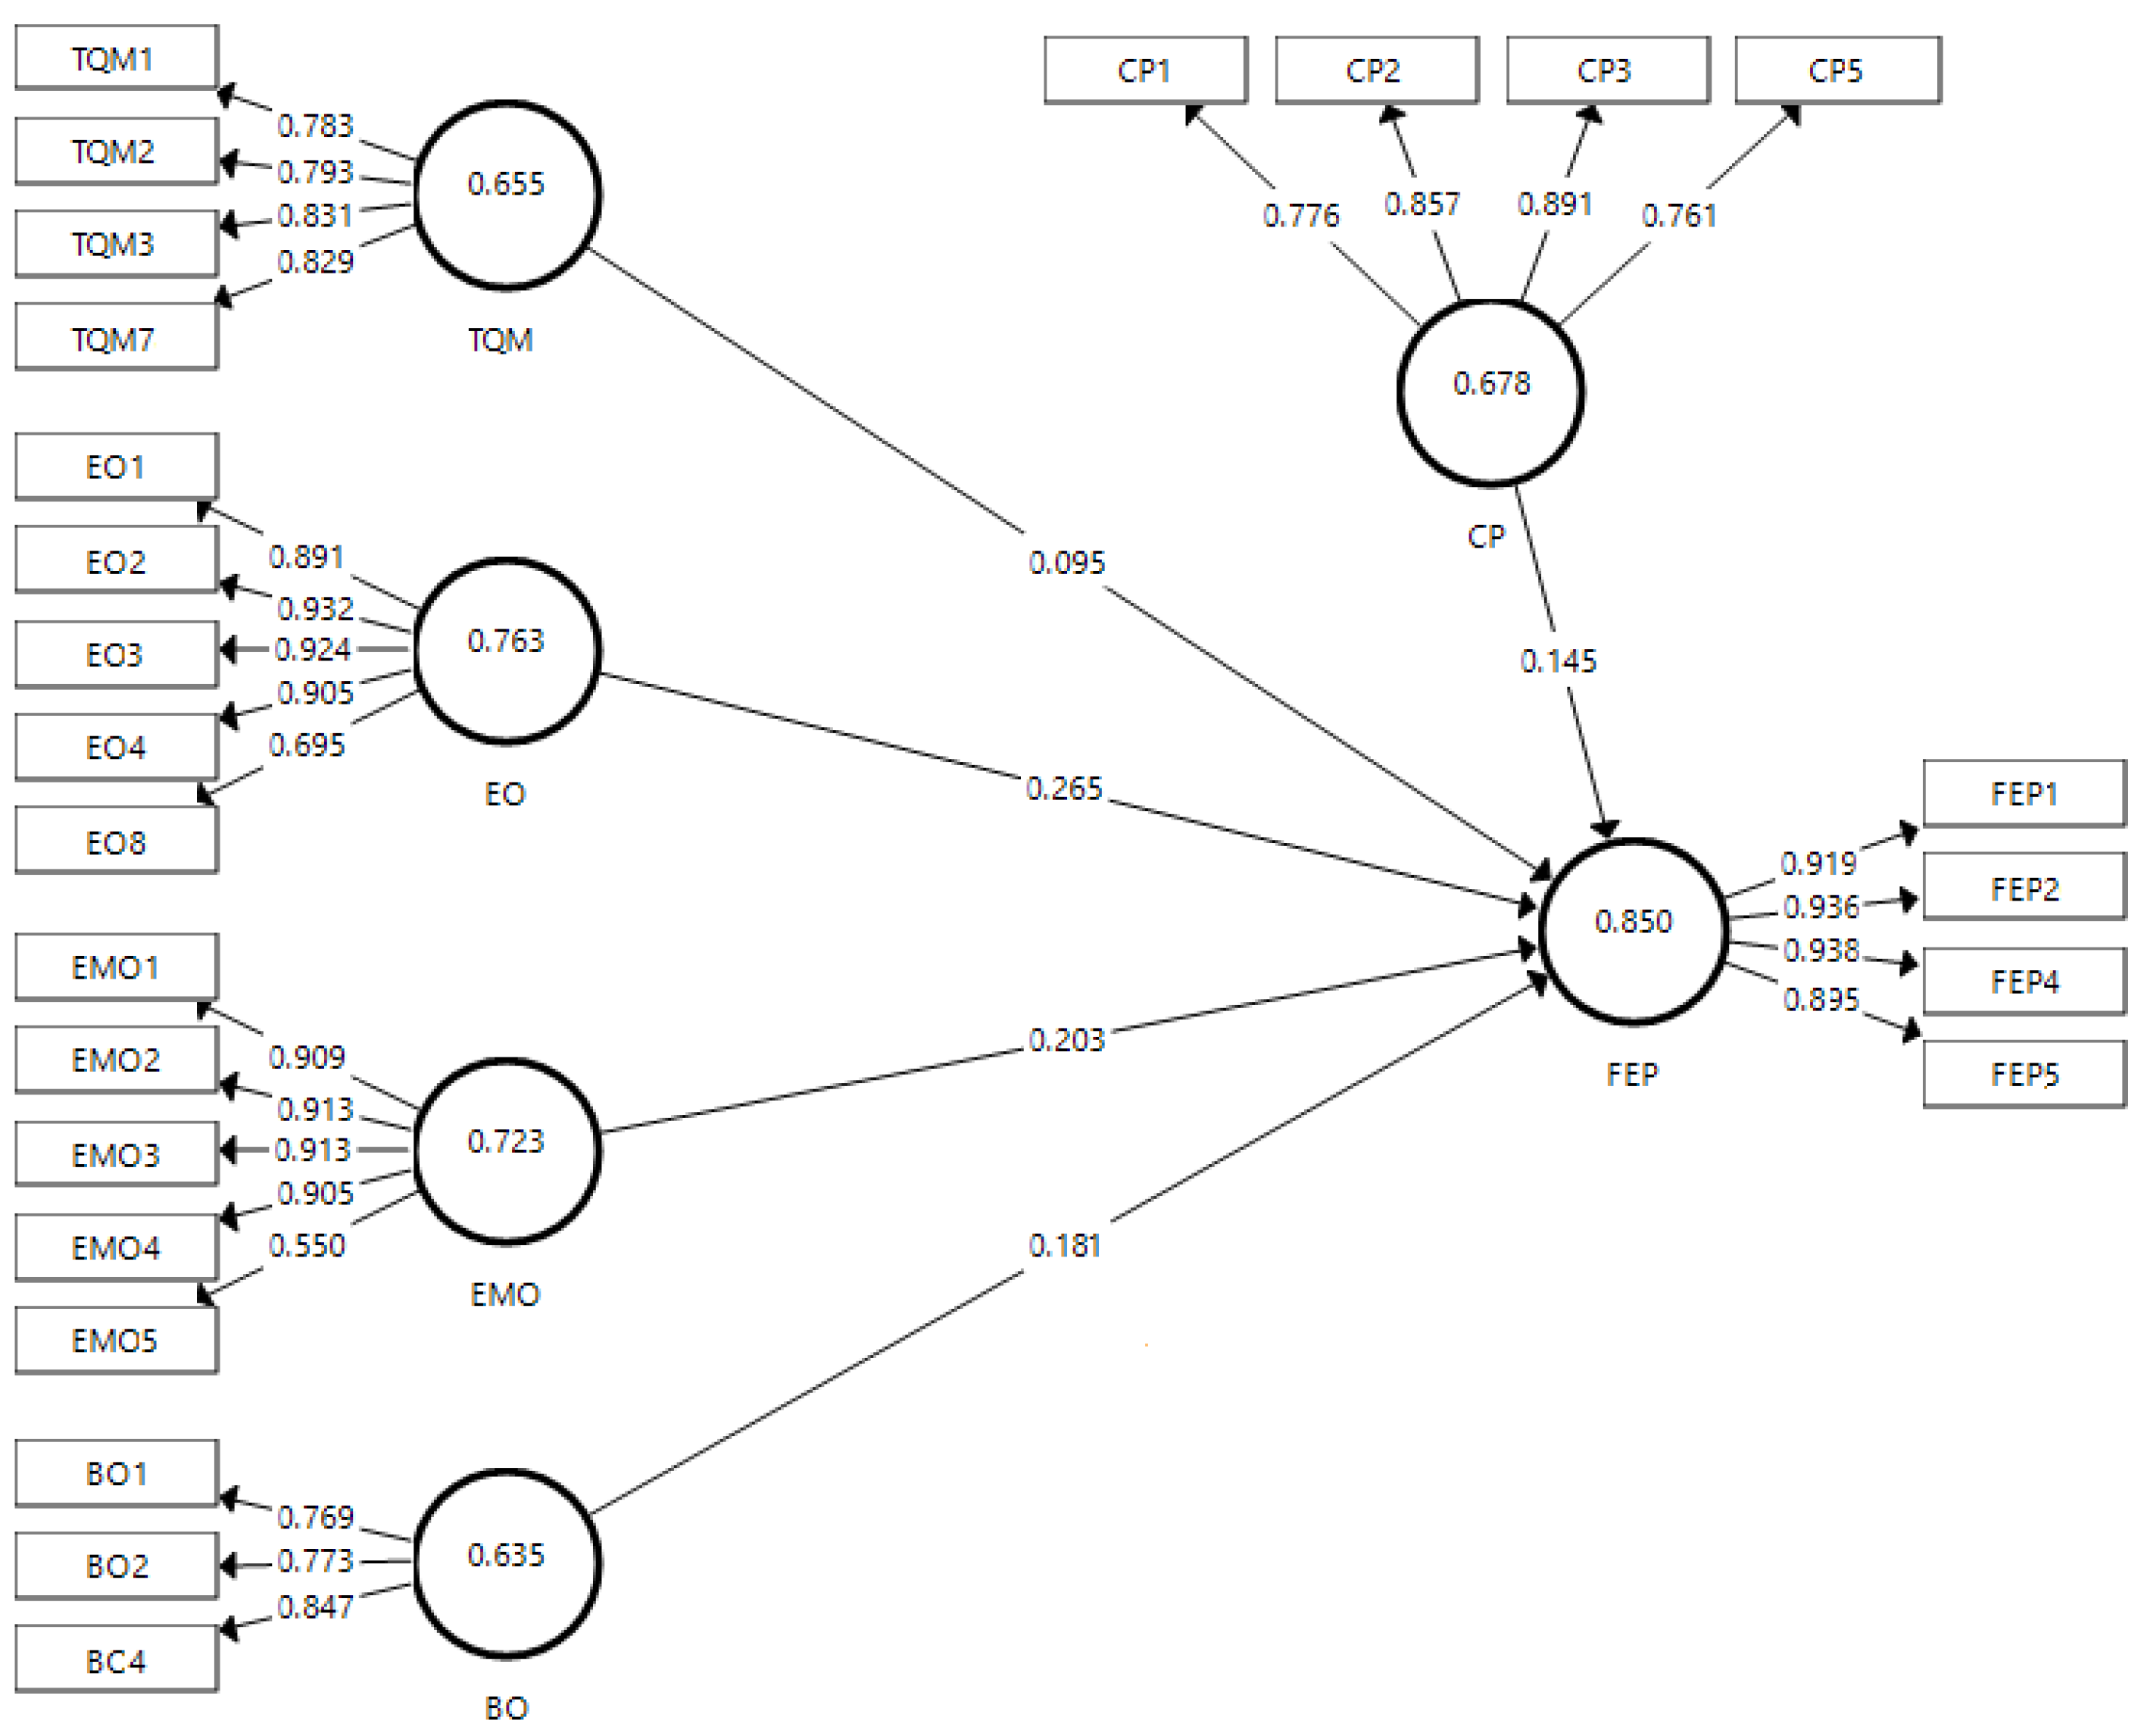
| Constructs | Cronbach Alpha | Composite Reliability | AVE |
|---|---|---|---|
| TQM | 0.824 | 0.883 | 0.655 |
| EO | 0.919 | 0.941 | 0.763 |
| EMO | 0.897 | 0.927 | 0.823 |
| BO | 0.722 | 0.839 | 0.635 |
| CP | 0.840 | 0.893 | 0.678 |
| FEP | 0.941 | 0.958 | 0.850 |
| Constructs | BO | CP | EMO | EO | FEP | TQM |
|---|---|---|---|---|---|---|
| BO | ||||||
| CP | 0.607 | |||||
| EMO | 0.877 | 0.574 | ||||
| EO | 0.896 | 0.535 | 0.798 | |||
| FEP | 0.754 | 0.582 | 0.695 | 0.708 | ||
| TQM | 0.630 | 0.812 | 0.568 | 0.547 | 0.569 |
| Goodness of Fit Statistics | Saturated Model | Estimated Model | Recommended Values |
|---|---|---|---|
| SRMR | 0.073 | 0.073 | <0.10 |
| NFI | 0.824 | 0.824 | >0.5 |
| rms Theta | 0.183 | <0.12 |
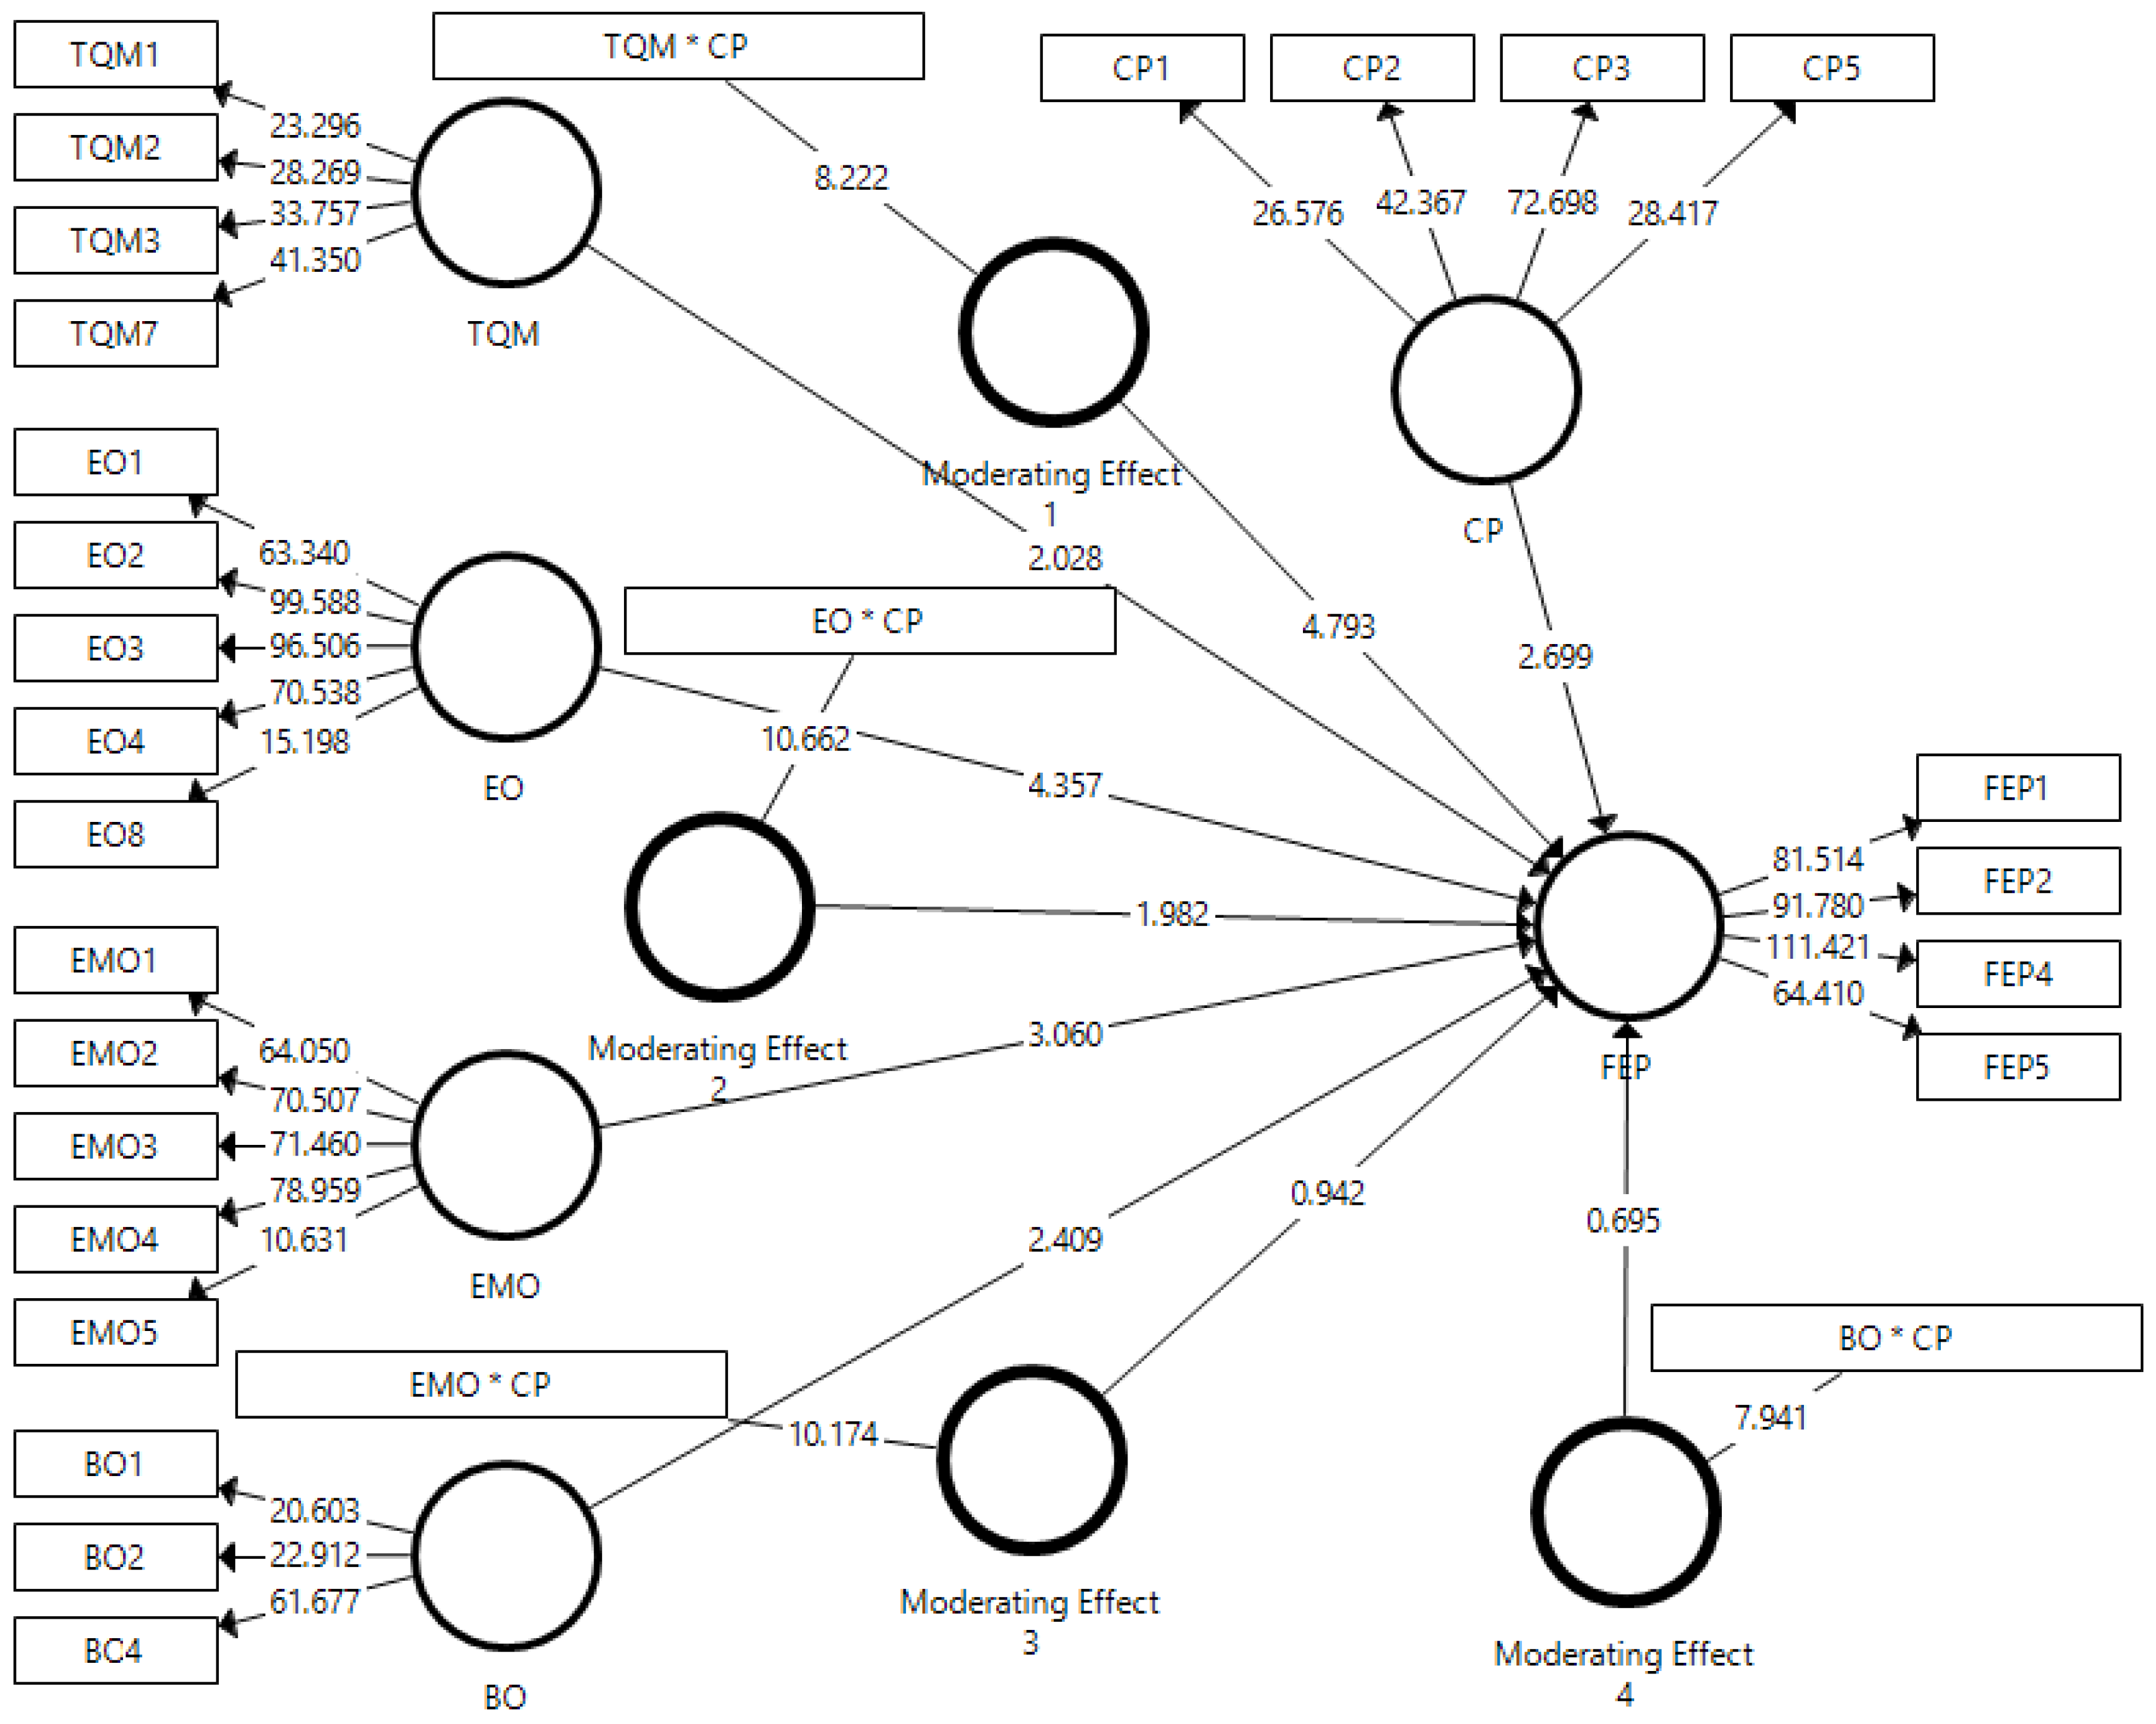
| Relationship | Beta | Standard Deviation | T Values | p Values |
|---|---|---|---|---|
| H1: TQM -> FEP | 0.115 | 0.057 | 2.028 ** | 0.043 |
| H2: EO -> FEP | 0.273 | 0.063 | 4.357 ** | 0.000 |
| H3: EMO -> FEP | 0.218 | 0.071 | 3.060 ** | 0.002 |
| H4: BO -> FEP | 0.158 | 0.066 | 2.409 ** | 0.016 |
| H5: CP -> FEP | 0.152 | 0.056 | 2.699 ** | 0.007 |
| Relationship | Beta | Standard Deviation | T Values | p Values |
|---|---|---|---|---|
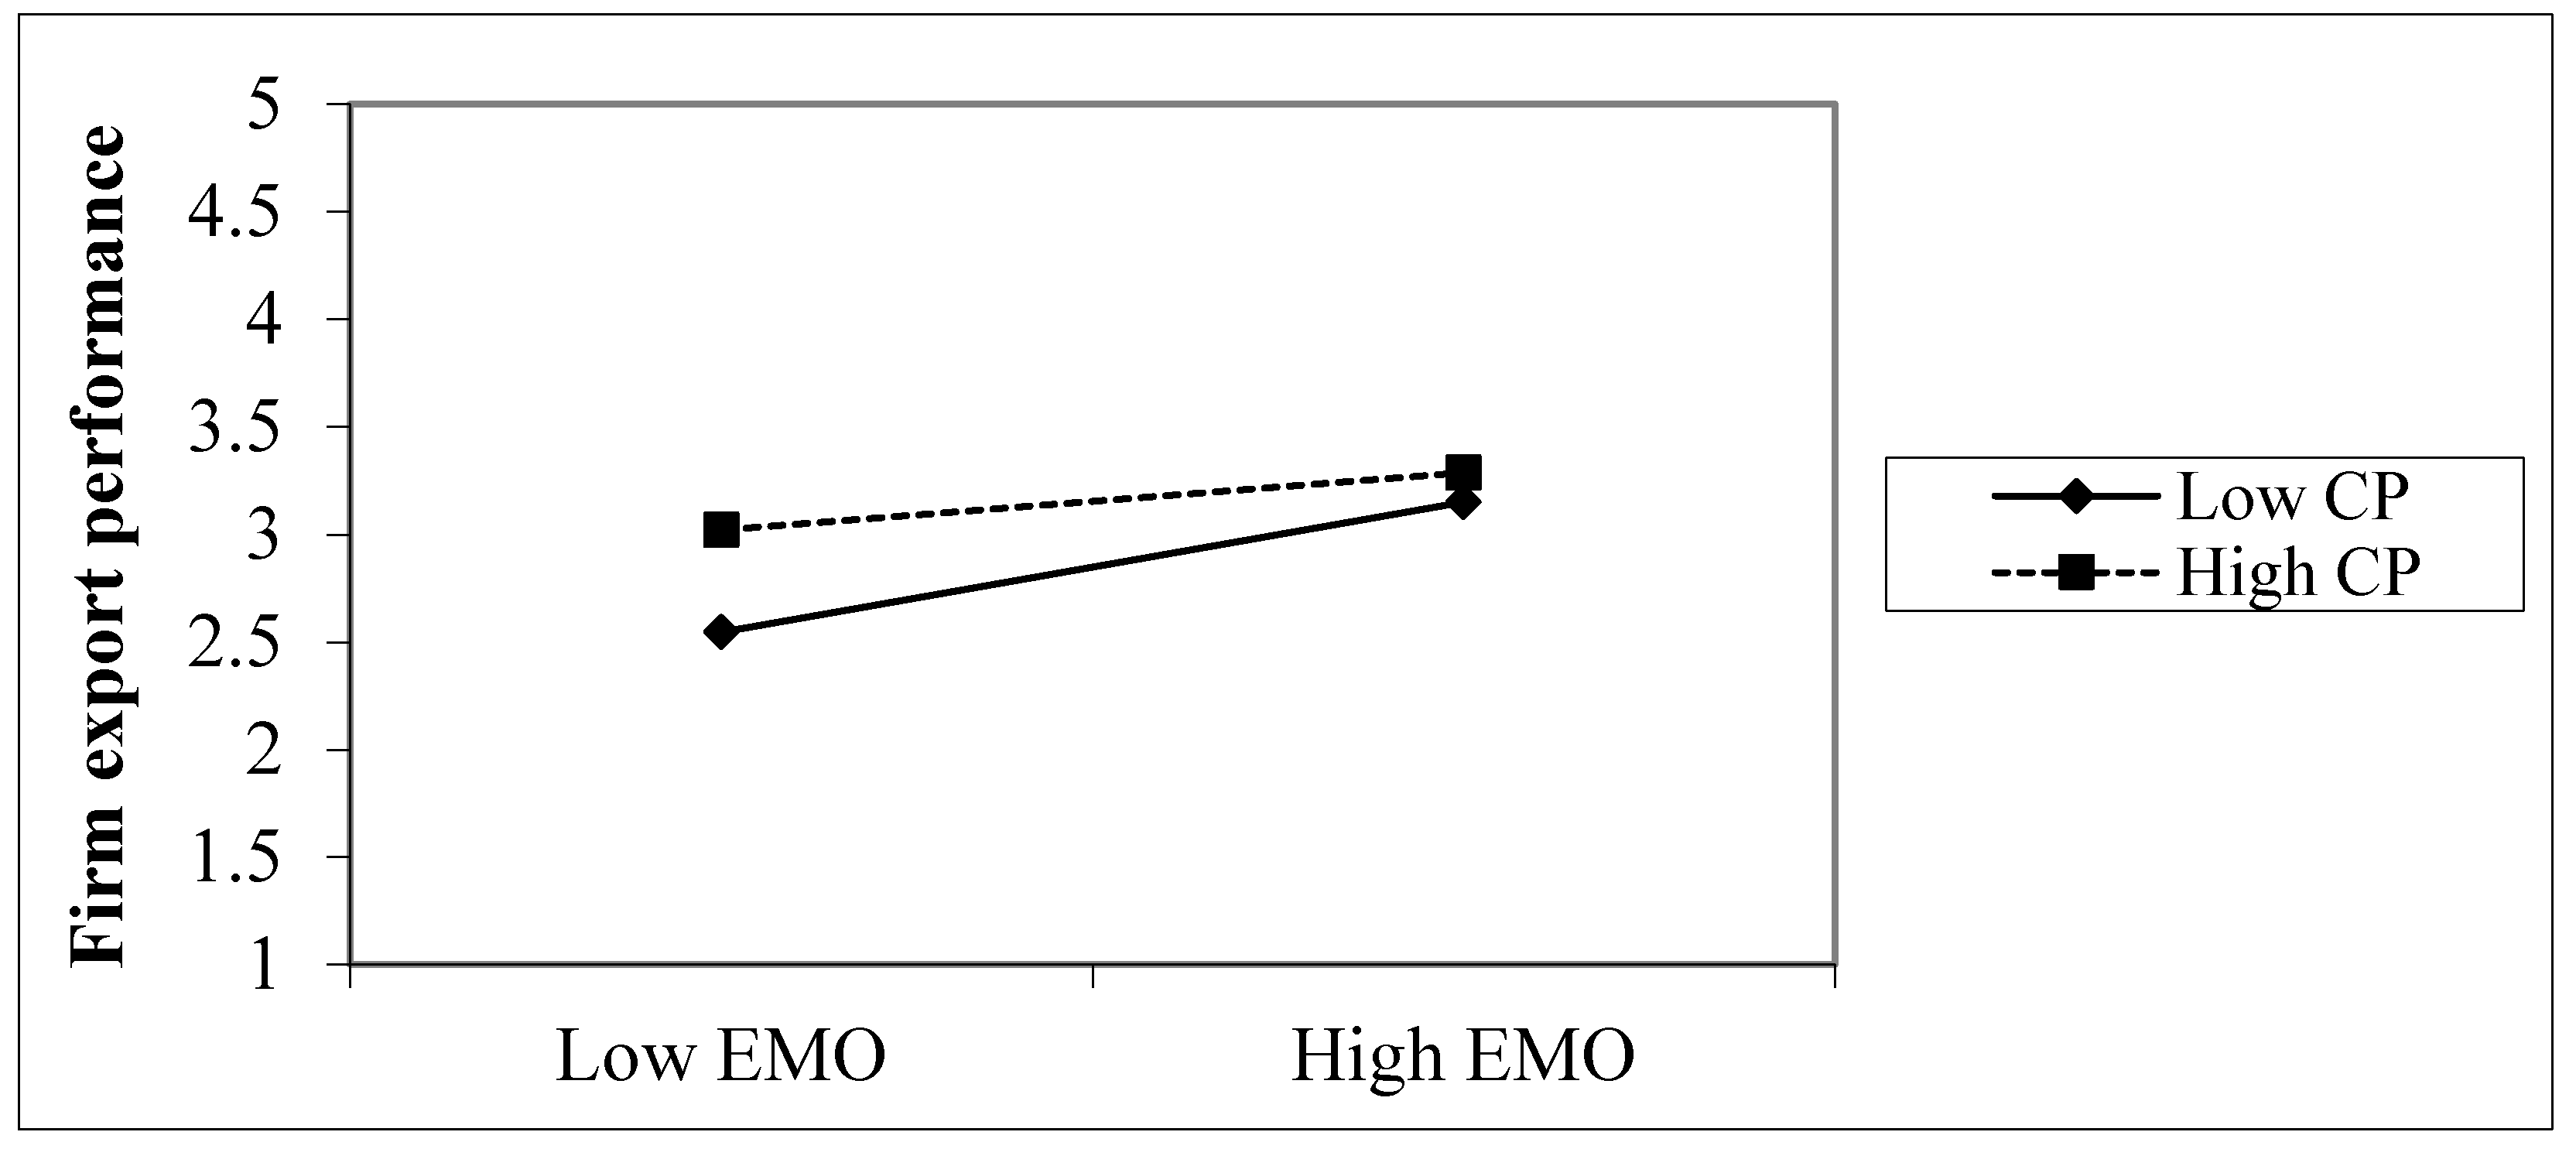
| H6: TQM * CP -> FEP | 0.270 | 0.056 | 4.793 ** | 0.000 |
| H7: EO * CP -> FEP | 0.105 | 0.053 | 1.982 ** | 0.048 |
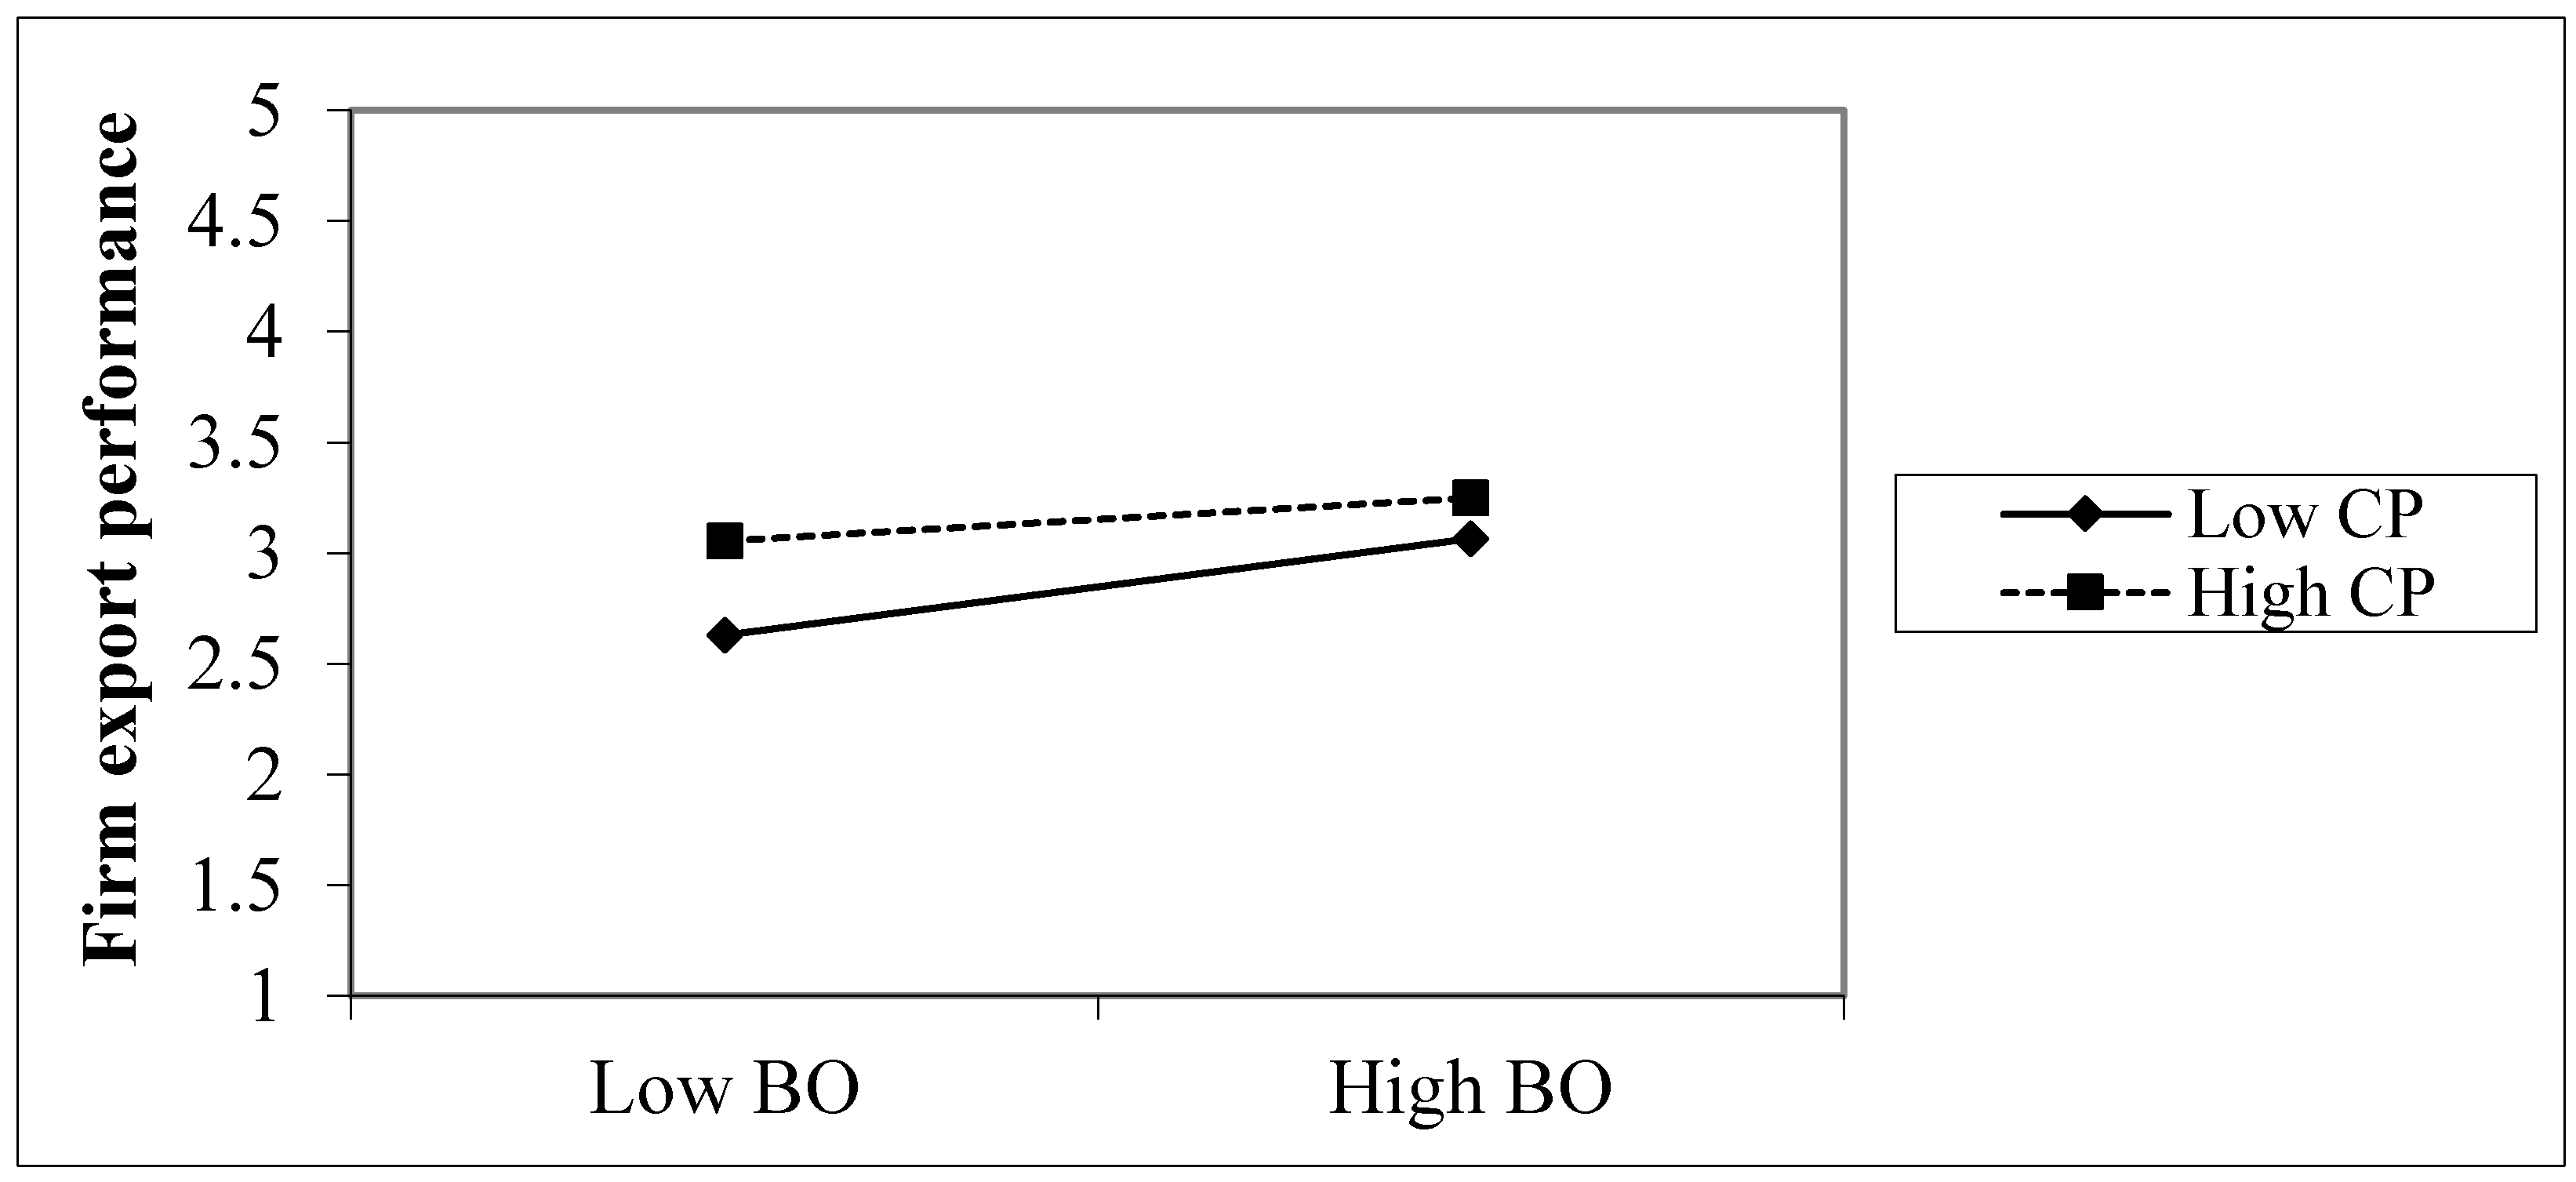
| H8: EMO * CP -> FEP | −0.085 | 0.091 | 0.942 ns | 0.347 |
| H9: BO * CP -> FEP | −0.061 | 0.087 | 0.695 ns | 0.487 |
| Exogenous Variable | f2 | R2 | Q2 |
|---|---|---|---|
| FEP | |||
| EO | 0.059 | 0.547 | 0.433 |
| TQM | 0.010 | ||
| EMO | 0.034 | ||
| BO | 0.025 | ||
| CP | 0.023 |
© 2018 by the authors. Licensee MDPI, Basel, Switzerland. This article is an open access article distributed under the terms and conditions of the Creative Commons Attribution (CC BY) license (http://creativecommons.org/licenses/by/4.0/).
Share and Cite
Imran, M.; Jian, Z.; Haque, A.u.; Urbański, M.; Nair, S.L.S. Determinants of Firm’s Export Performance in China’s Automobile Industry. Sustainability 2018, 10, 4078. https://doi.org/10.3390/su10114078
Imran M, Jian Z, Haque Au, Urbański M, Nair SLS. Determinants of Firm’s Export Performance in China’s Automobile Industry. Sustainability. 2018; 10(11):4078. https://doi.org/10.3390/su10114078
Chicago/Turabian StyleImran, Muhammad, Zhaoquan Jian, Adnan ul Haque, Mariusz Urbański, and Sree Lekshmi Sreekumaran Nair. 2018. "Determinants of Firm’s Export Performance in China’s Automobile Industry" Sustainability 10, no. 11: 4078. https://doi.org/10.3390/su10114078
APA StyleImran, M., Jian, Z., Haque, A. u., Urbański, M., & Nair, S. L. S. (2018). Determinants of Firm’s Export Performance in China’s Automobile Industry. Sustainability, 10(11), 4078. https://doi.org/10.3390/su10114078