Article

Biocement Fabrication and Design Application for a Sustainable Urban Area

1
Interdisciplinary Program of EcoCreative, Ewha Womans University, Seoul 03760, Korea
2
Department of Industrial Design, Ewha Womans University, Seoul 03760, Korea
3
Department of Life Science, Ewha Womans University, Seoul 03760, Korea
*
Authors to whom correspondence should be addressed.
Sustainability 2018, 10(11), 4079; https://doi.org/10.3390/su10114079
Submission received: 17 September 2018 / Revised: 28 October 2018 / Accepted: 2 November 2018 / Published: 7 November 2018
(This article belongs to the Special Issue Sustainable Materials and Manufacturing)

Abstract

:
Recently, designers have begun to pursue sustainability through the fabrication of materials from living organisms such as bacteria, fungi, and algae in order to address environmental issues. Based on the potential of materials from living organisms, this study has explored a sustainable design application using biocement formed thorough microbially-induced calcite precipitation (MICP), which produces minerals by bacterial metabolic activity. Since most of the studies on MICP thus far have focused on limited fields such as engineering, biotechnology, and geo-technology, this study has focused more on improving the application of biocement in design. We optimized MICP conditions using two parameters (i.e., concentration of urea-CaCl2 and bacterial cell density) through water percolation testing, compressive strength testing, and X-ray diffraction (XRD) analysis. Then, based on the optimized conditions, material compatibility testing and scalability testing were performed, and design application research was conducted as well. As a result, biocement has been identified as a potential sustainable design material, based on its 40% compressive strength compared to conventional concrete, improved material finish, aesthetic aspects, and environmental impact. This paper contributes to the development of biocement applications in the environmental design field through multidisciplinary research ranging from biological experiments to design applications.

1. Introduction

We are facing a serious global situation in which natural resources are being depleted, as well as environmental issues such as damage to the planet’s biodiversity, with concerns about sustainability continuing to grow. Faced with this global crisis, one of the greatest challenges of this century is changing our infrastructure to be environmentally sustainable.
Driven by environmental responsibility, designers have begun to recognize environmental issues, leading them to reprioritize their goals and change their materials for a more resilient and sustainable future [1,2]. One innovative approach for improving sustainability is the convergence of design and biology [3,4]. Designers are beginning to use living organisms such as bacteria, algae, and fungi to fabricate sustainable materials and manufacturing methods with reduced environmental impact. This interdisciplinary research between biology and design has already been applied in a variety of areas, from manufacturing to architecture, in order to overcome the environmental crisis in the design field [3,5].
Concrete is one of the main materials used in the construction industry because of its relatively low cost and high strength [6]. This industry is growing worldwide at 0.8–1.2% per year, and consumption is expected to increase to 3.7–4.4 billion tons in 2050 [7].
However, concrete consumes high energy and is an environmentally unfriendly material that negatively impacts the environment at all stages of its manufacturing process [8]. The cement industry, which accounts for the major composite of concrete, is one of the largest producers of carbon dioxide (CO2), contributing to 10% of global CO2 emissions from the manufacturing process requiring the burning of fossil fuels to generate extremely high temperatures (1500 °C) as well as the chemical process for cement creation decomposing calcium carbonate into calcium oxide and CO2 [6]. Additionally, cement’s main ingredients need to be produced and mined on a massive scale and transported considerable distances, increasing energy consumption, greenhouse gas emissions, and landscape mutilation [9]. Considering all stages of its production cycle from mining to final disposal, cement is not a sustainable material and greatly affects the environment.
With this concern for the environmental impact from cement manufacturing, microbially-induced calcite precipitation (MICP) is currently being explored extensively as a bio-based technique in multidisciplinary fields such as geotechnical and material engineering, as well as in environmental applications [8,10,11,12]. However, there are still some challenges toward application of MICP in practice [13].
MICP is one of the biomineralization processes that can produce minerals via various metabolic activities by almost all kinds of bacteria, with the hydrolysis of urea by ureolytic bacteria being one of the most popular and easily controlled reactions used to precipitate minerals in a short period of time [14,15].
Sporosarcina pasteurii (formerly Bacillus pasteurii), which is a gram-positive, aerobic, and ureolytic bacterial species, is used in this study due to its unique features: non-pathogenicity, high stability, higher urease activity than other urease bacteria, and ability to tolerate high alkaline conditions over pH 8.5 [12,16,17]. In the MICP process, S. pasteurii plays a major role in creating a high alkaline environment through urease activity, and may serve as a nucleation site for CaCO3 precipitation on its surface [11]. By this process occurring in the pores of unbounded sand, the sand particles adhere together with calcium carbonate. This cementitious material is called “biocement” and is used as an alternative sustainable material, since it is produced by a biological process that does not involve burning fuels or using harmful chemical processes [9].
Enzyme urease is produced by S. pasteurii and catalyzes the hydrolysis of urea into ammonia (NH3) and carbonic acid (H2CO3), as shown in Equations (1) and (2). NH3 and H2CO3 are converted into ammonium (NH4+), bicarbonate ions (HCO3), and hydroxide ions (OH) by reaction with water, as shown in Equations (3) and (4). The production of hydroxide ions (OH) increases the pH value in the surrounding area (4). As pH increases, bicarbonate ions (HCO3) are converted into carbonate ions (CO32−) (5), which makes bacterial cell surfaces more negative and attracts positively charged calcium ions (Ca2+) from the environment to deposit onto the cell surface (6) [12,14,18,19].
CO ( NH 2 ) 2 + H 2 O u r e a s e NH 2 COOH + NH 3
NH2COOH + H2O → NH3 + H2CO3
H2CO3 ↔ HCO3− + H+
2NH3 + 2H2O ↔ 2NH4− + 2OH
HCO3− + H+ + 2OH ↔ CO32− + 2H2O
Ca2+ + Cell ↔ Cell − Ca2+
Ca2+ + CO32− ↔ CaCO3
Bacteria may play a major role in creating a high alkaline environment through metabolic activities, and serve as nucleation sites for CaCO3 precipitation on their surfaces [20]. During this process, calcium carbonate is usually precipitated into three polymorphic forms, the order of their usual stability being calcite, aragonite, and vaterite [11].
The potential benefits of biocement have led designers to begin to apply it to their work [21,22]. However, since MICP is a complex chemical mechanism with many environmental influences [23,24,25], the complexity of the MICP procedure creates barriers for applying biocement in the design field. Furthermore, most of the studies on MICP thus far have generally focused on narrow fields, such as geo-technology, due to engineering barriers. Therefore this research has focused on the applicability of biocement in the design for sustainability as follows:
(1)
Study of MICP to improve the strength of biocement through water permeability analysis and compressive strength testing.
(2)
Aesthetic and scalability study using biocement.
(3)
Design of an eco-friendly building module using biocement.
We have explored biocement applications by considering ecological aspects. Biocement was applied as a mediator between two issues: decreasing wild bee populations due to habitat loss and continued expansion of urbanization [26].
Pollinators, especially wild bees, play a vital role in the reproduction of many plant species in the planet’s ecosystems [27]. However, they are currently under threat, mainly due to urbanization causing the decline of nest density of wild bees through the loss of ecological features in cities. The surfaces of urbanized buildings are usually made of solid concrete where wild bees cannot build nests [26]. This is fatal to wild bees because they build individual nests in small tunnels or holes of dead wood, ground, and sandy banks for their larvae.
Urban areas will continue to expand and become more diverse, meaning that pollinators will continue to come into contact with urbanization—even more so than now [28]. Many studies have found that urban habitats can contain abundantly high pollinator richness and have demonstrated positive effects on wild bees [29]. If we invite pollinators into our buildings and cities, each building can both create conditions conducive to our life and simultaneously provide pollination services and opportunities for ecosystems [30,31].
In this study, we applied biocement as a building skin to pursue urban biodiversity by securing the habitat of wild bees. This study has obtained biocement with 40% strength of conventional concrete and has high water impermeability, and it is expected that biocement can be applied in environmentally friendly exterior materials. The concept of this design work is to achieve sustainability through interdisciplinary research in ecology, design, and biology. This study contributes to the expansion of biocement applications and shows the potential convergence between design, biology, and ecosystem engineering for sustainable environment initiatives.

2. Material and Methods

2.1. Strain and Cultivation

Sporosarcina pasteurii KCTC 3558 was shipped in a freeze-dried state from Korean Collection of Type Cultures (KCTC). The main culture was inoculated 1% from subculture, and was aerobically grown in 100 mL NH4-YE liquid medium (ATCC 1376) on a shaking incubator (N-BIOTEK, South Korea) with 150 rpm at 30 °C for 9–10 h to the late exponential phase (OD600 2.5). The NH4-YE medium (ATCC 1376) contained yeast extract 20 g/L, (NH4)2SO4 10 g/L, and 0.13 M Tris buffer (pH 9.0) [32]. The culture was cooled and stored at 4 °C before being used for MICP.

2.2. Sand Characteristics

The sand from Jumunjin beach located at Gangneung, South Korea (grain size of 250 to 500 μm) was used for MICP [33]. In addition, waste marble powder and color sand were used for biocement compatibility tests. The waste marble powder (<300 μm) was obtained from the Marble Sculpture workshop at the Department of Sculpture of Ewha Womans University in Seoul, South Korea. Color sand (250–400 μm; Uniart Korea, South Korea) was used as a color source.

2.3. Urease Activity Test

Sporosarcina pasteurii and two reference strains of Escherichia coli and Actinobacillus succinogenes were aerobically cultivated overnight in a 5 mL BHI medium [12] at 150 rpm and 30 °C. Then, 1 mL of 10g/L urea was added to each culture, with cultures then being further cultivated for 10 h. The pH change by urease activity was measured by Litmus paper.

2.4. MICP (Microbially Induced Calcite Precipitation)

Solutions. For MICP, 8 mL cementation solution, 10 mL bacterial culture, and 10 mL fixative solution were added to the 15 g sand. The sand was contained in a 10 mL plastic syringe, and the solutions were added to the top surface containing sand (Figure 1). Three various cementation solutions were prepared, in which the concentrations of urea (0.12 M, 0.4 M, or 1.5 M) and CaCl2 (0.055 M, 0.2 M, or 0.75 M) were varied. In addition, the solution contained 25 mM NaHCO3, 150 mM NH4Cl, and 7.5 g/L brain heart infusion (BHI; Merck, Darmstadt, Germany), and was set to pH 7 (Table 1) [15,21,34]. Two densities (1X, 10X) of bacterial solution were prepared, for which 1X refers to the bacterial culture and 10X refers to the 10-fold concentrated bacterial resuspension in NH4-YE medium. The fixative solution was 55 mM CaCl2 [21] (Table 1).
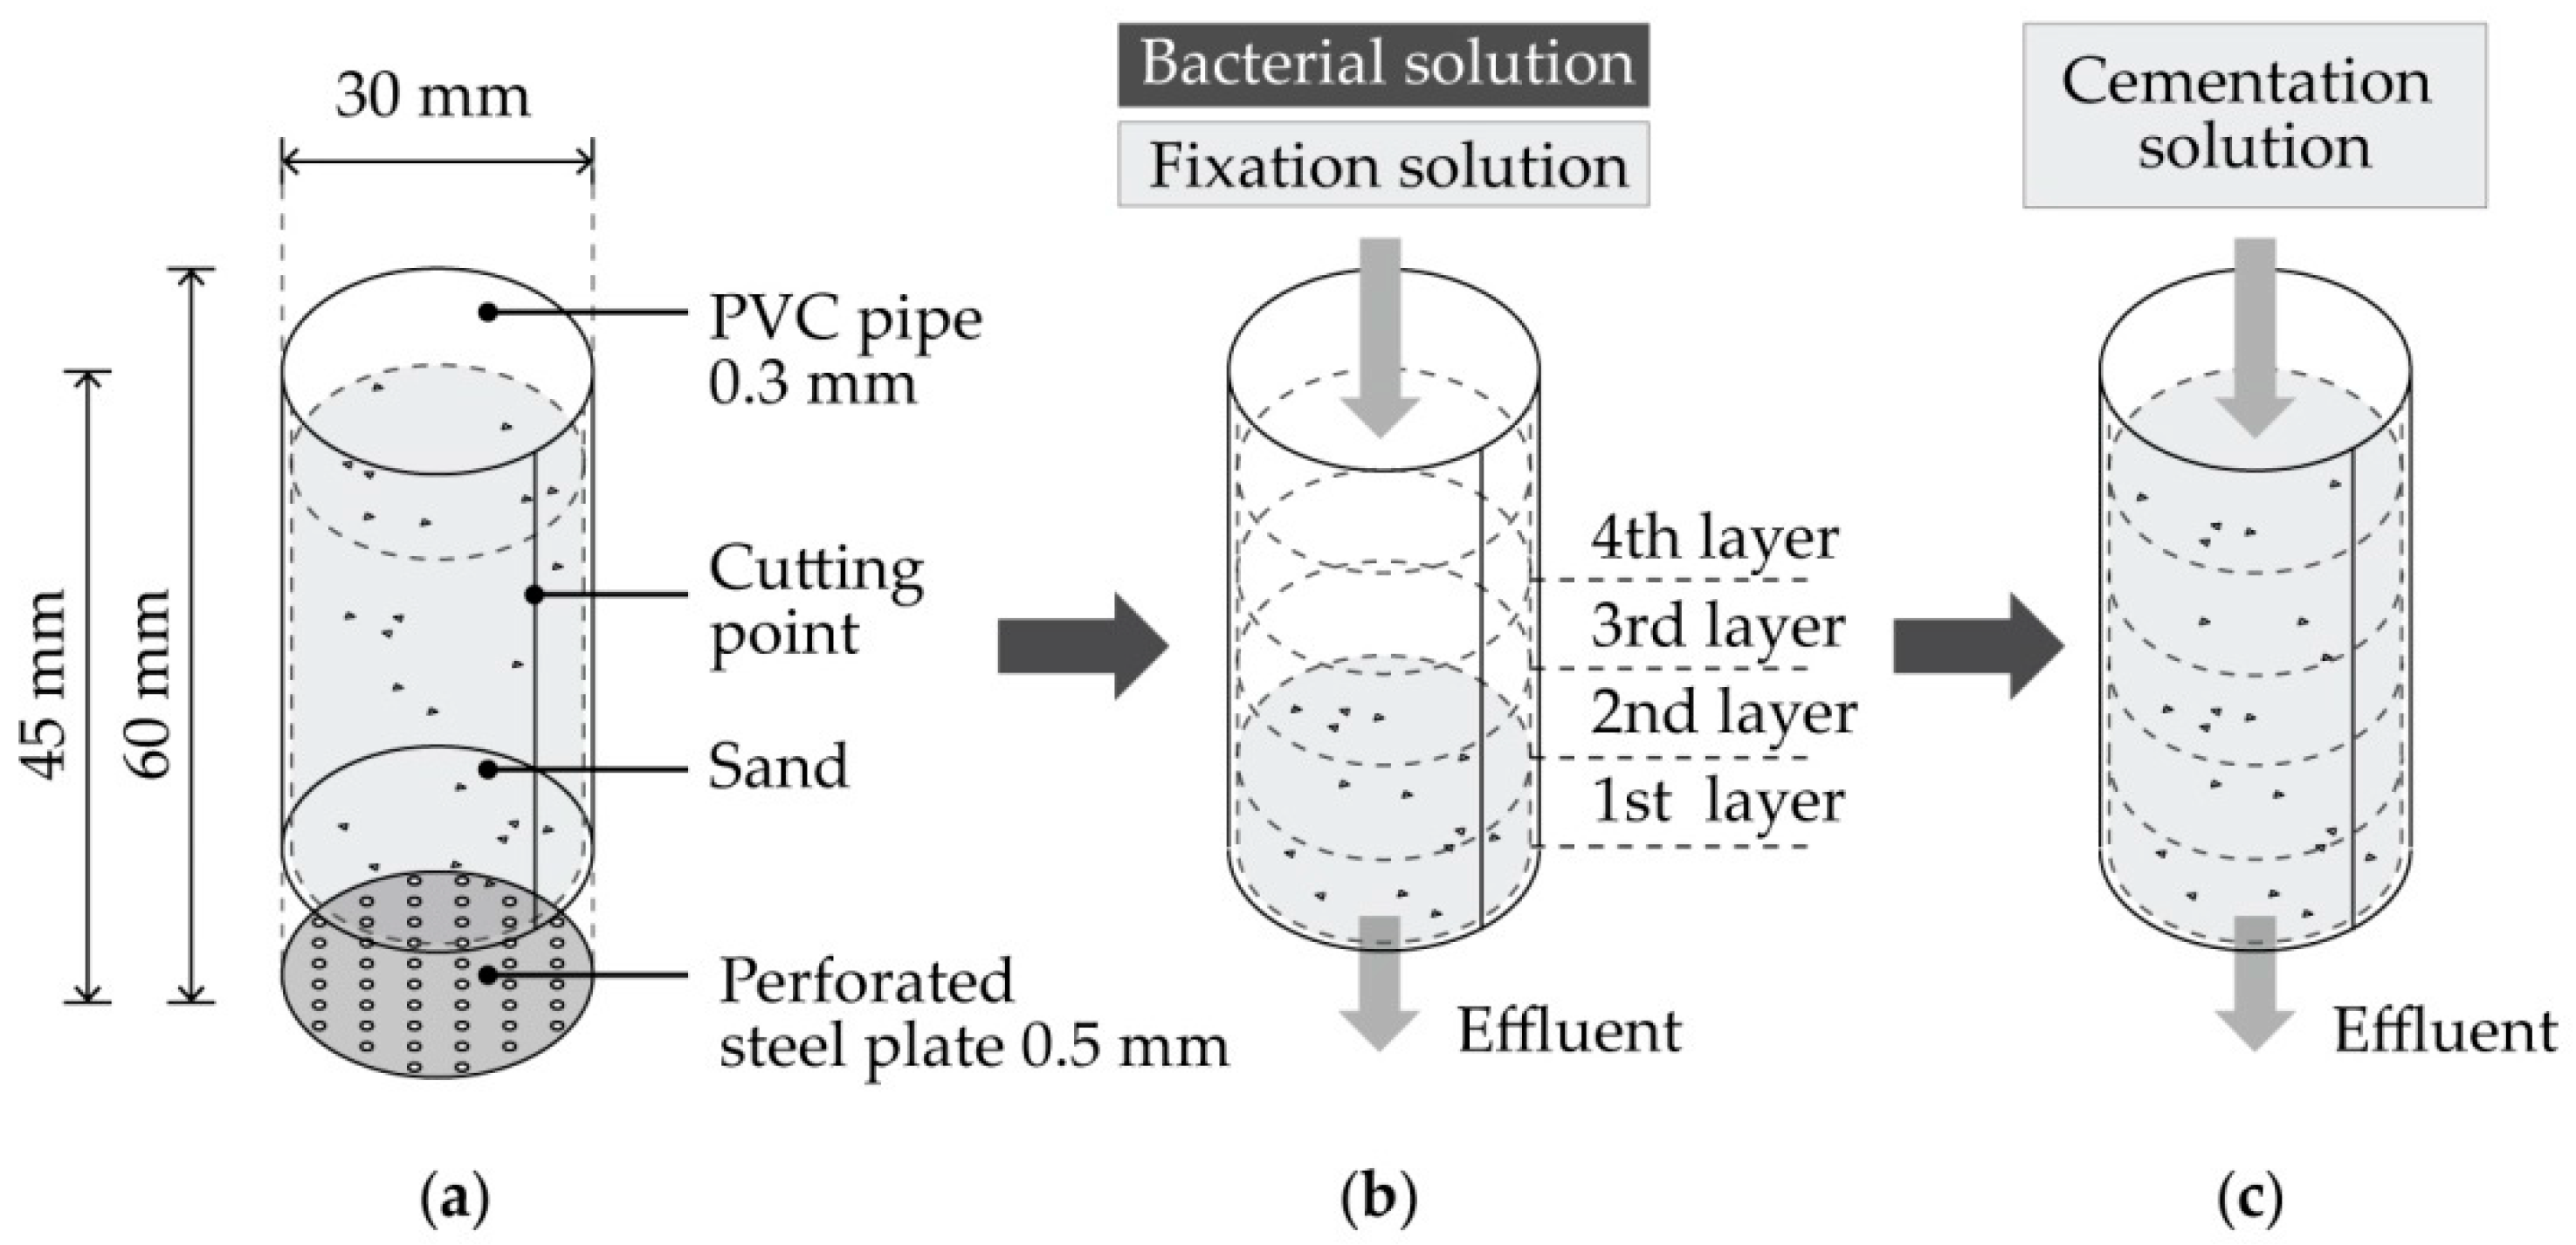
Module and process for MICP. The biocement mold was fabricated with a non-porous, non-reactive PVC (polyvinyl chloride) cylinder pipe (0.3 mm in thickness, 30 mm in diameter, and 60 mm in height) (Figure 2). The bottom of the mold was covered by a perforated steel plate (0.5 mm in thickness) with a 0.5 mm diameter for effluent. The sand was poured into the PVC pipe at a height of 10 mm, then 10 mL of bacterial solution (OD600 2.5) was added on top of the sand and mixed for a homogeneous bacterial distribution (Figure 2) [38]. Then, 10 mL of fixation solution was poured onto the top of the sand and mixed with the sand. The above procedure was repeated every 10 mm of height in order to make a 60 mm high sand column. When the sand reached 60 mm, 10 mL of cementation solution was added on top, where it was allowed to drain out (Figure 2). Then, the mold was covered with a perforated plate and rotated 180 degrees from the top to the bottom. The 10 mL of cementation solution was poured onto the top one final time. The cementation solution was applied twice a day for 20 days to the point that it could not pass through the coagulated surface. After 20 days, the biocement sample was rinsed with distilled water twice and dried at 60 ℃ (Table 2).

2.5. Evaluation of Biocement

2.5.1. Water Percolation and Sand Loss

Water was poured into the pipe until the top edge of the biocement mold was filled. The amount of water that passed through the biocement sample for five minutes was measured. All samples were dried at 60 °C, and the biocement sample was weighed in order to compare the weight before and after water penetration. Then the samples were cut at the 30 mm height to confirm the internal durability of the biocement (Figure 2).

2.5.2. X-ray Diffraction (XRD) Analysis

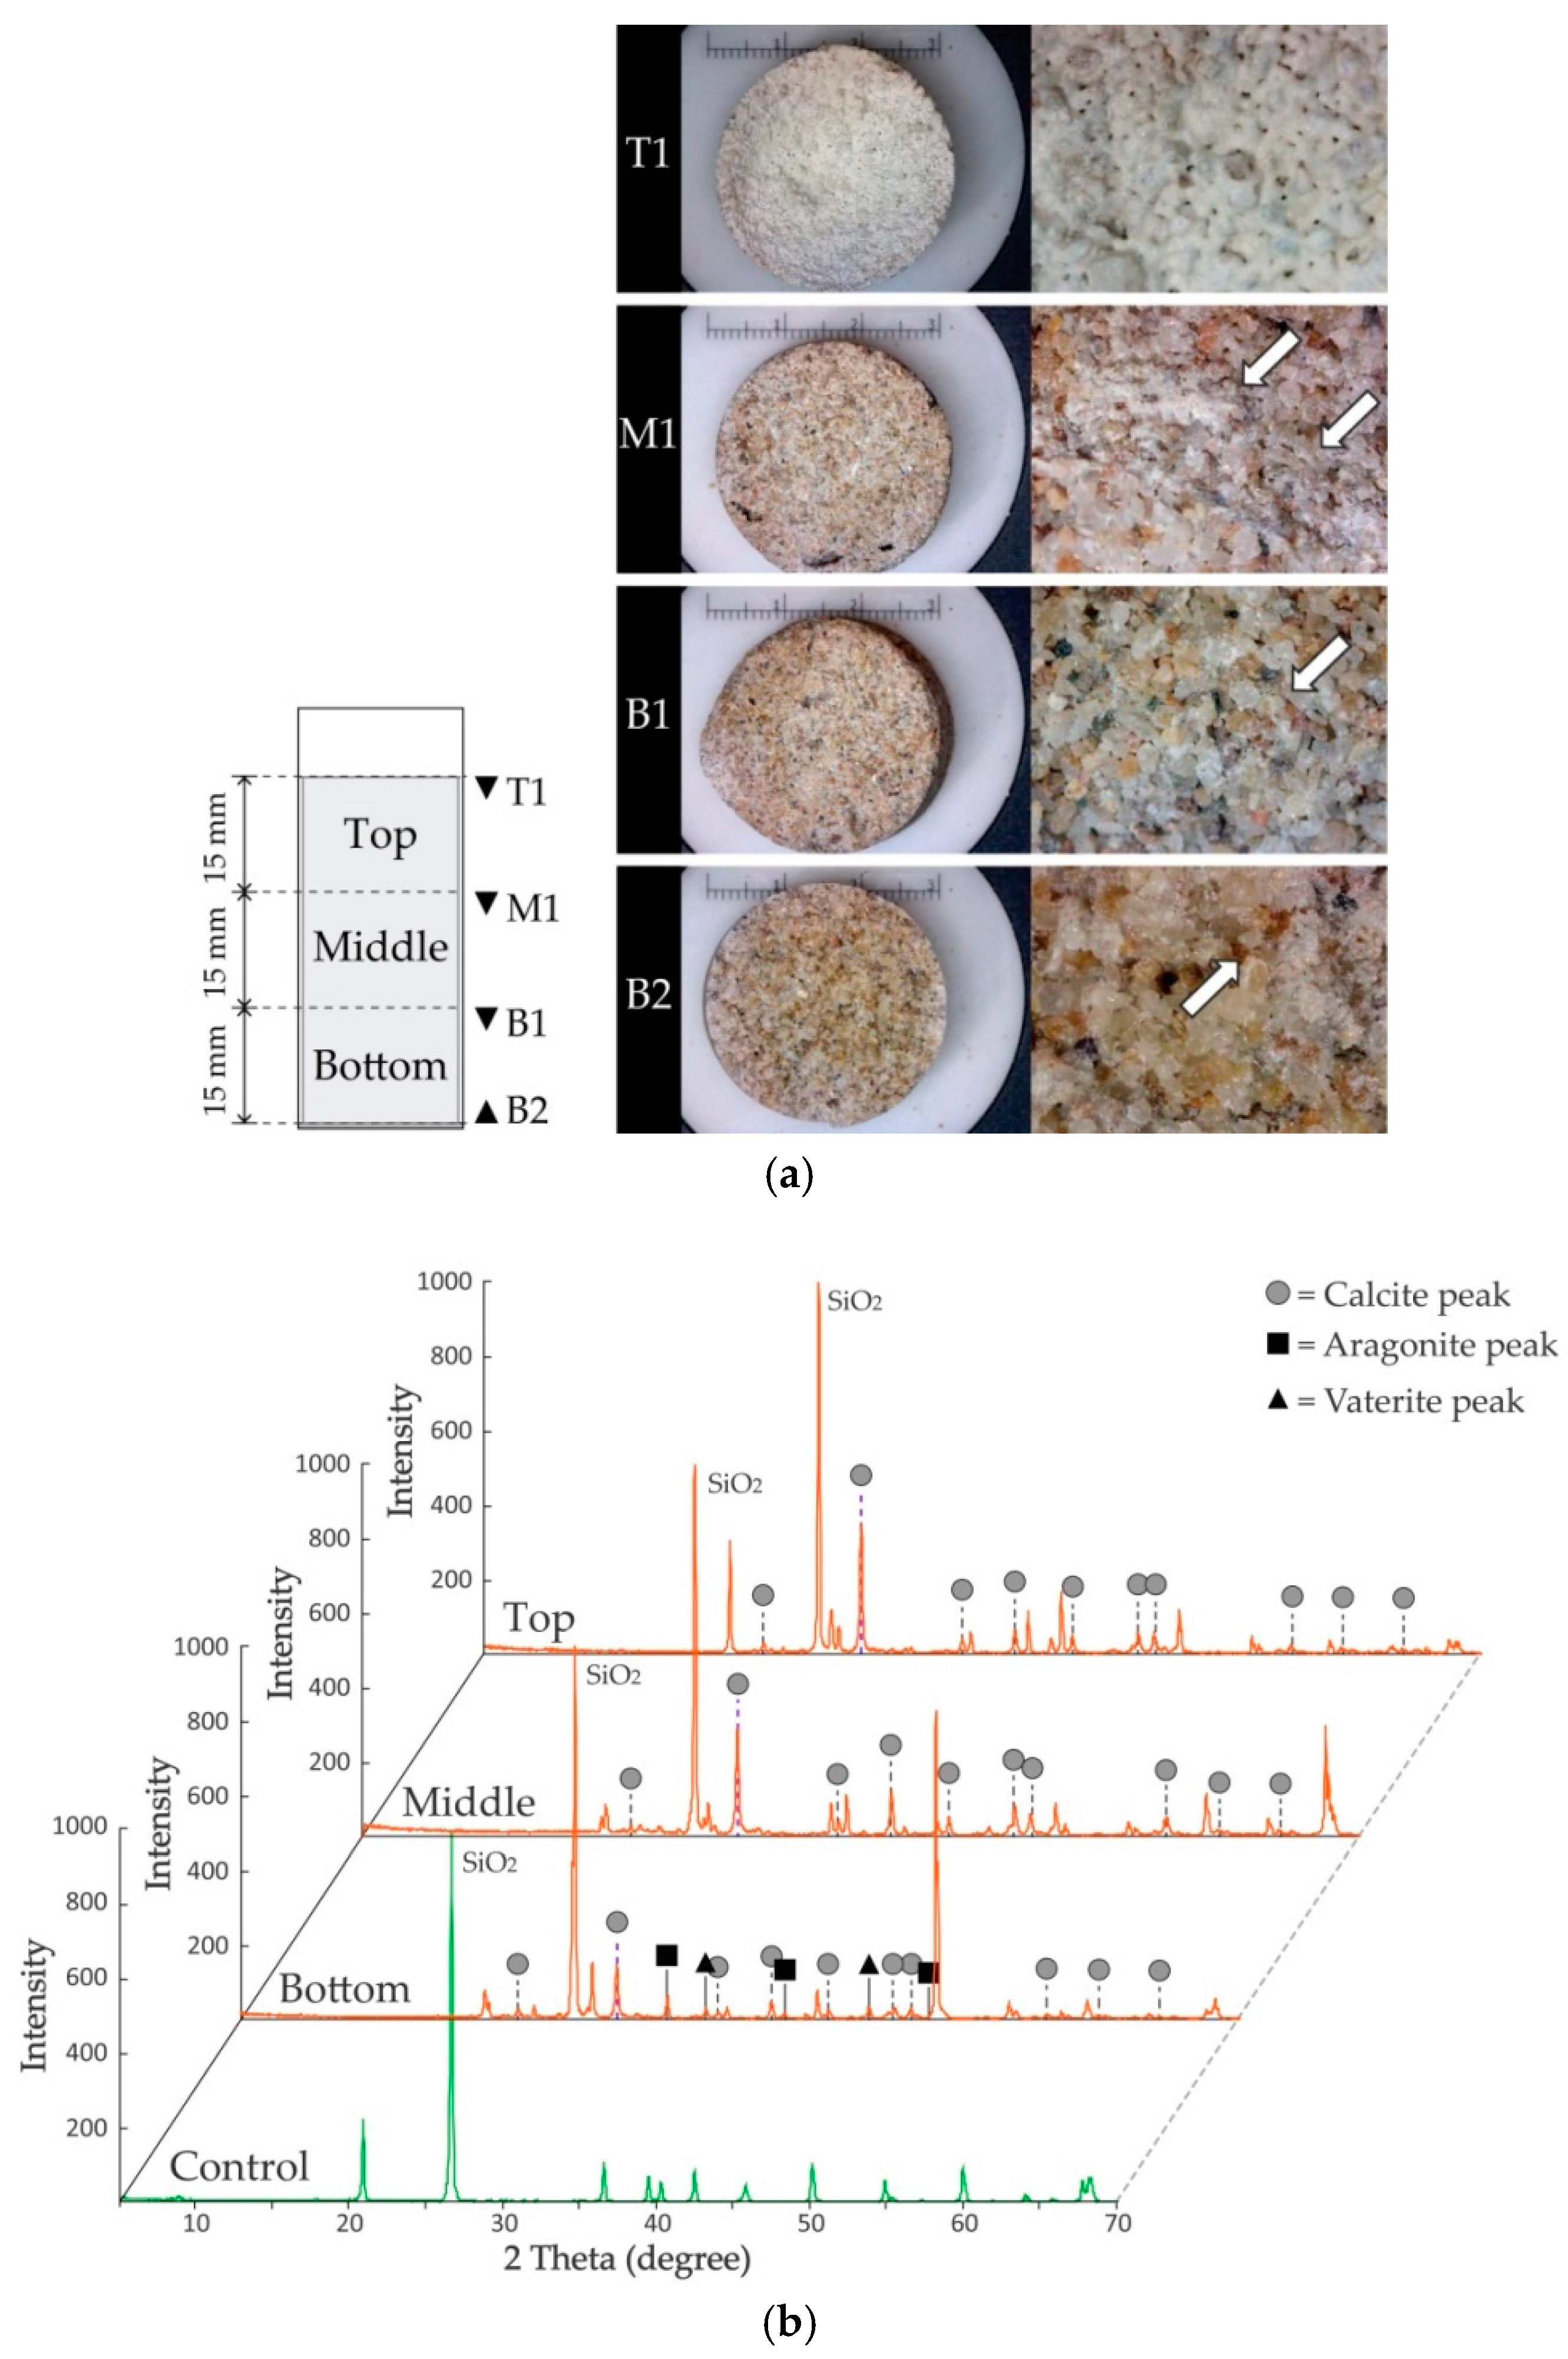
The biocement sample was divided into three equal portions (15 mm in height) with a jeweler saw, and each section was observed through a digital microscope (DISMIS-M, Siwon Optical Technology, Anyang, Korea) before being ground for XRD analysis.
X-ray diffraction analysis was conducted with a diffractometer (Rigaku D/Max-2000/PC, Rigaku, Tokyo, Japan) with Ni-filtered Cu Kα radiation. The wavelength of Cu Kα X-rays was 1.5418 Å. Three parts of the sample were ground separately in a mortar until all of the sand particles were finely ground. Two equal amounts of ground sand were taken from each section for accurate XRD analysis. X-ray diffraction irradiation was performed according to the position of the sample.

2.5.3. Compressive Strength Test

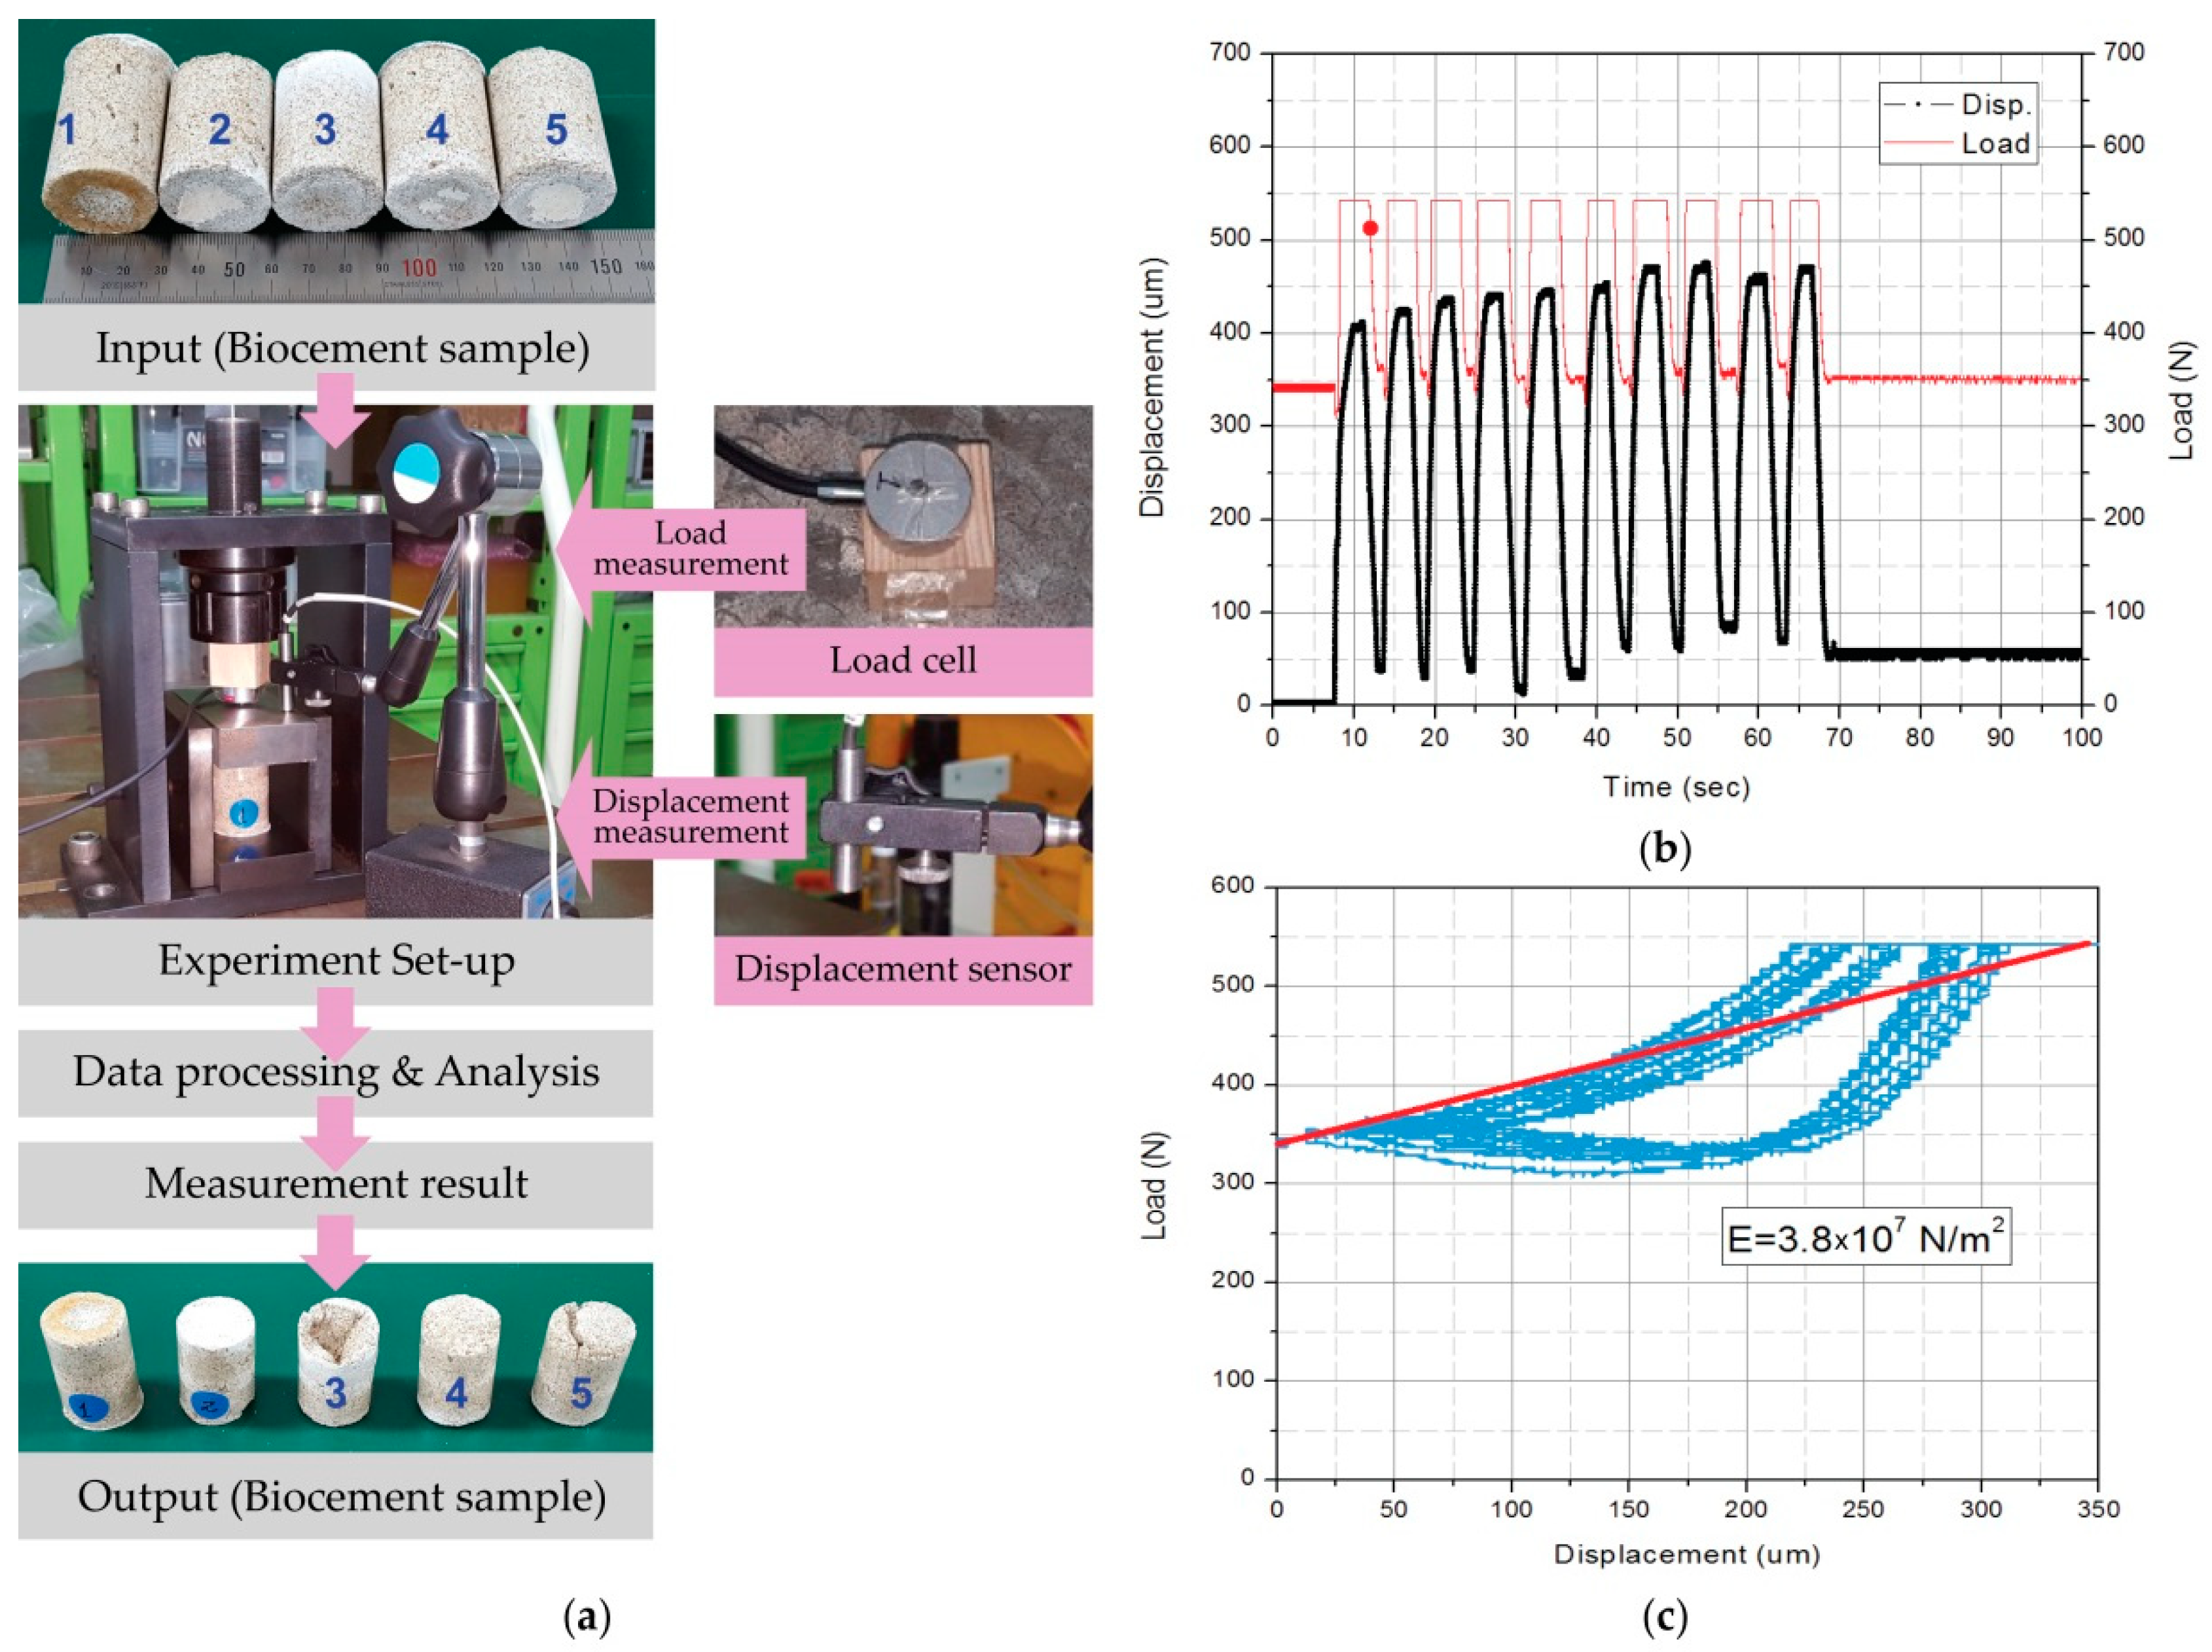
All surfaces of the biocement samples were made flat for the sake of accuracy. The elastic modulus (N/m2) of the sample was measured, which is a measure of the resistance to elastic deformation when the load is applied and compared with high-strength concrete. This compressive strength test was measured under the upper limit (the area within 0.2% compressive displacement of the initial specimen). The sample was placed into the machine vertically. A load cell (which converts force into a measurable electrical output) and a displacement sensor (which measures compressive displacement) were used measurements conducted in the compressive strength test. While the preload (340 N) was applied to the sample, an additional 200 N load was applied ten times in order to obtain an average compressive strength.

2.6. Material Studies of Compatibility and Scalability Using the Biocement

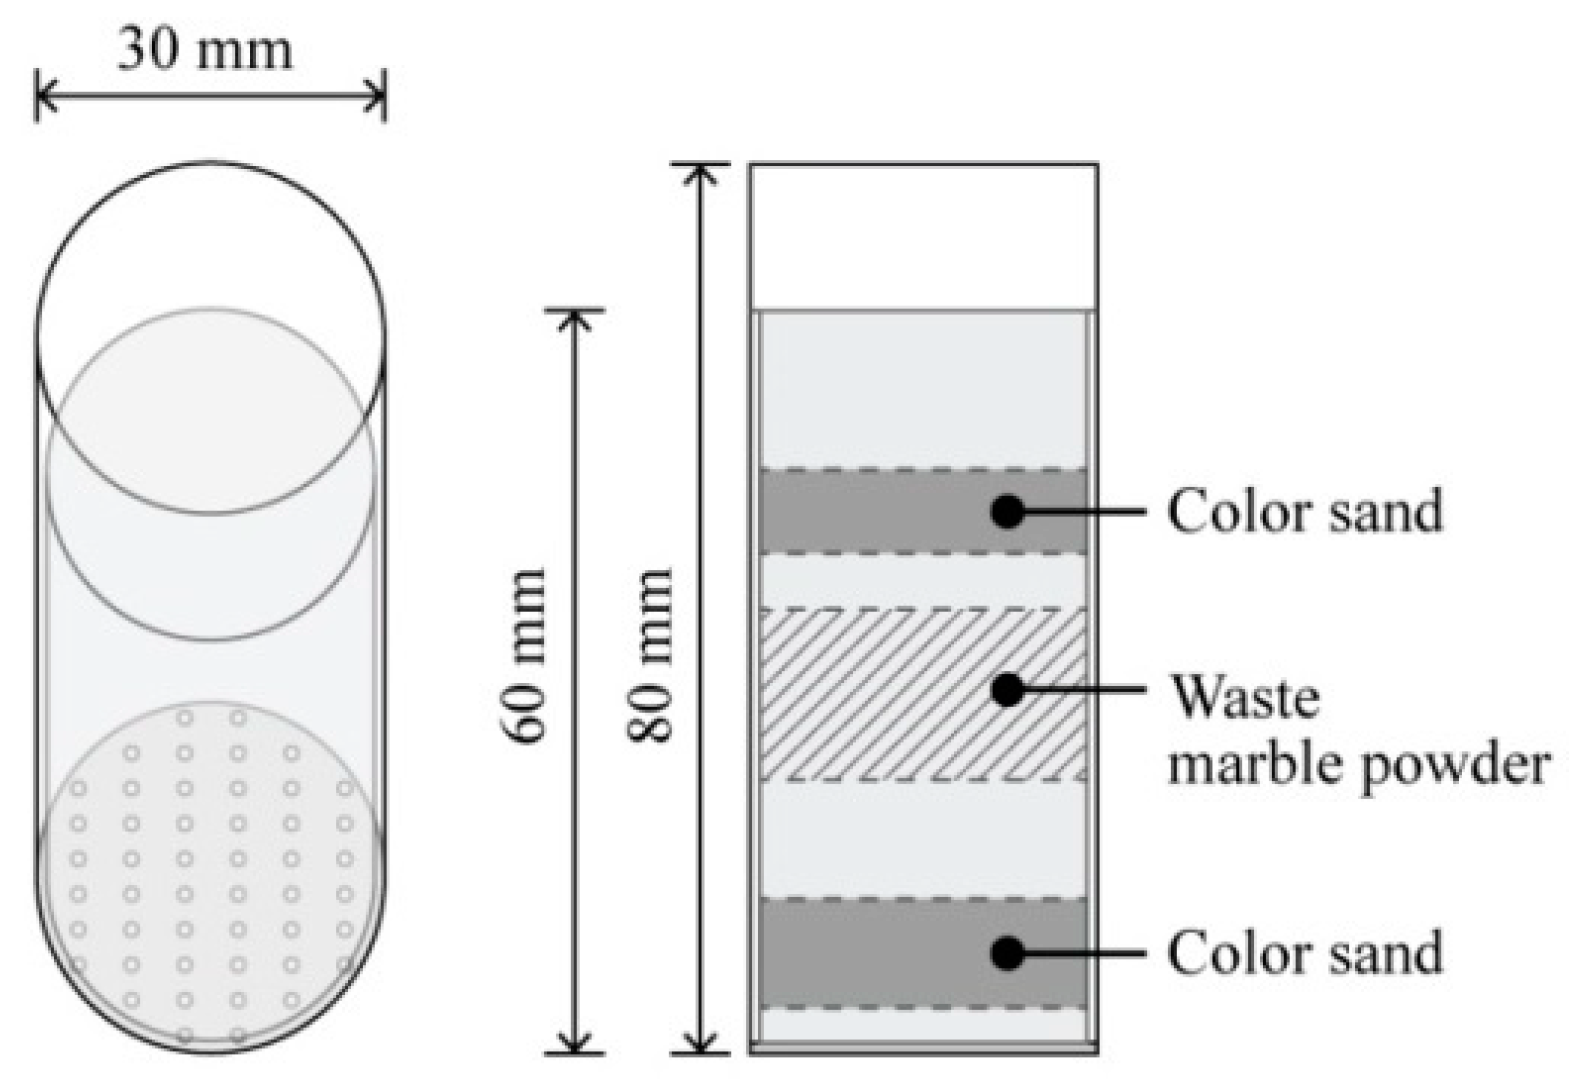
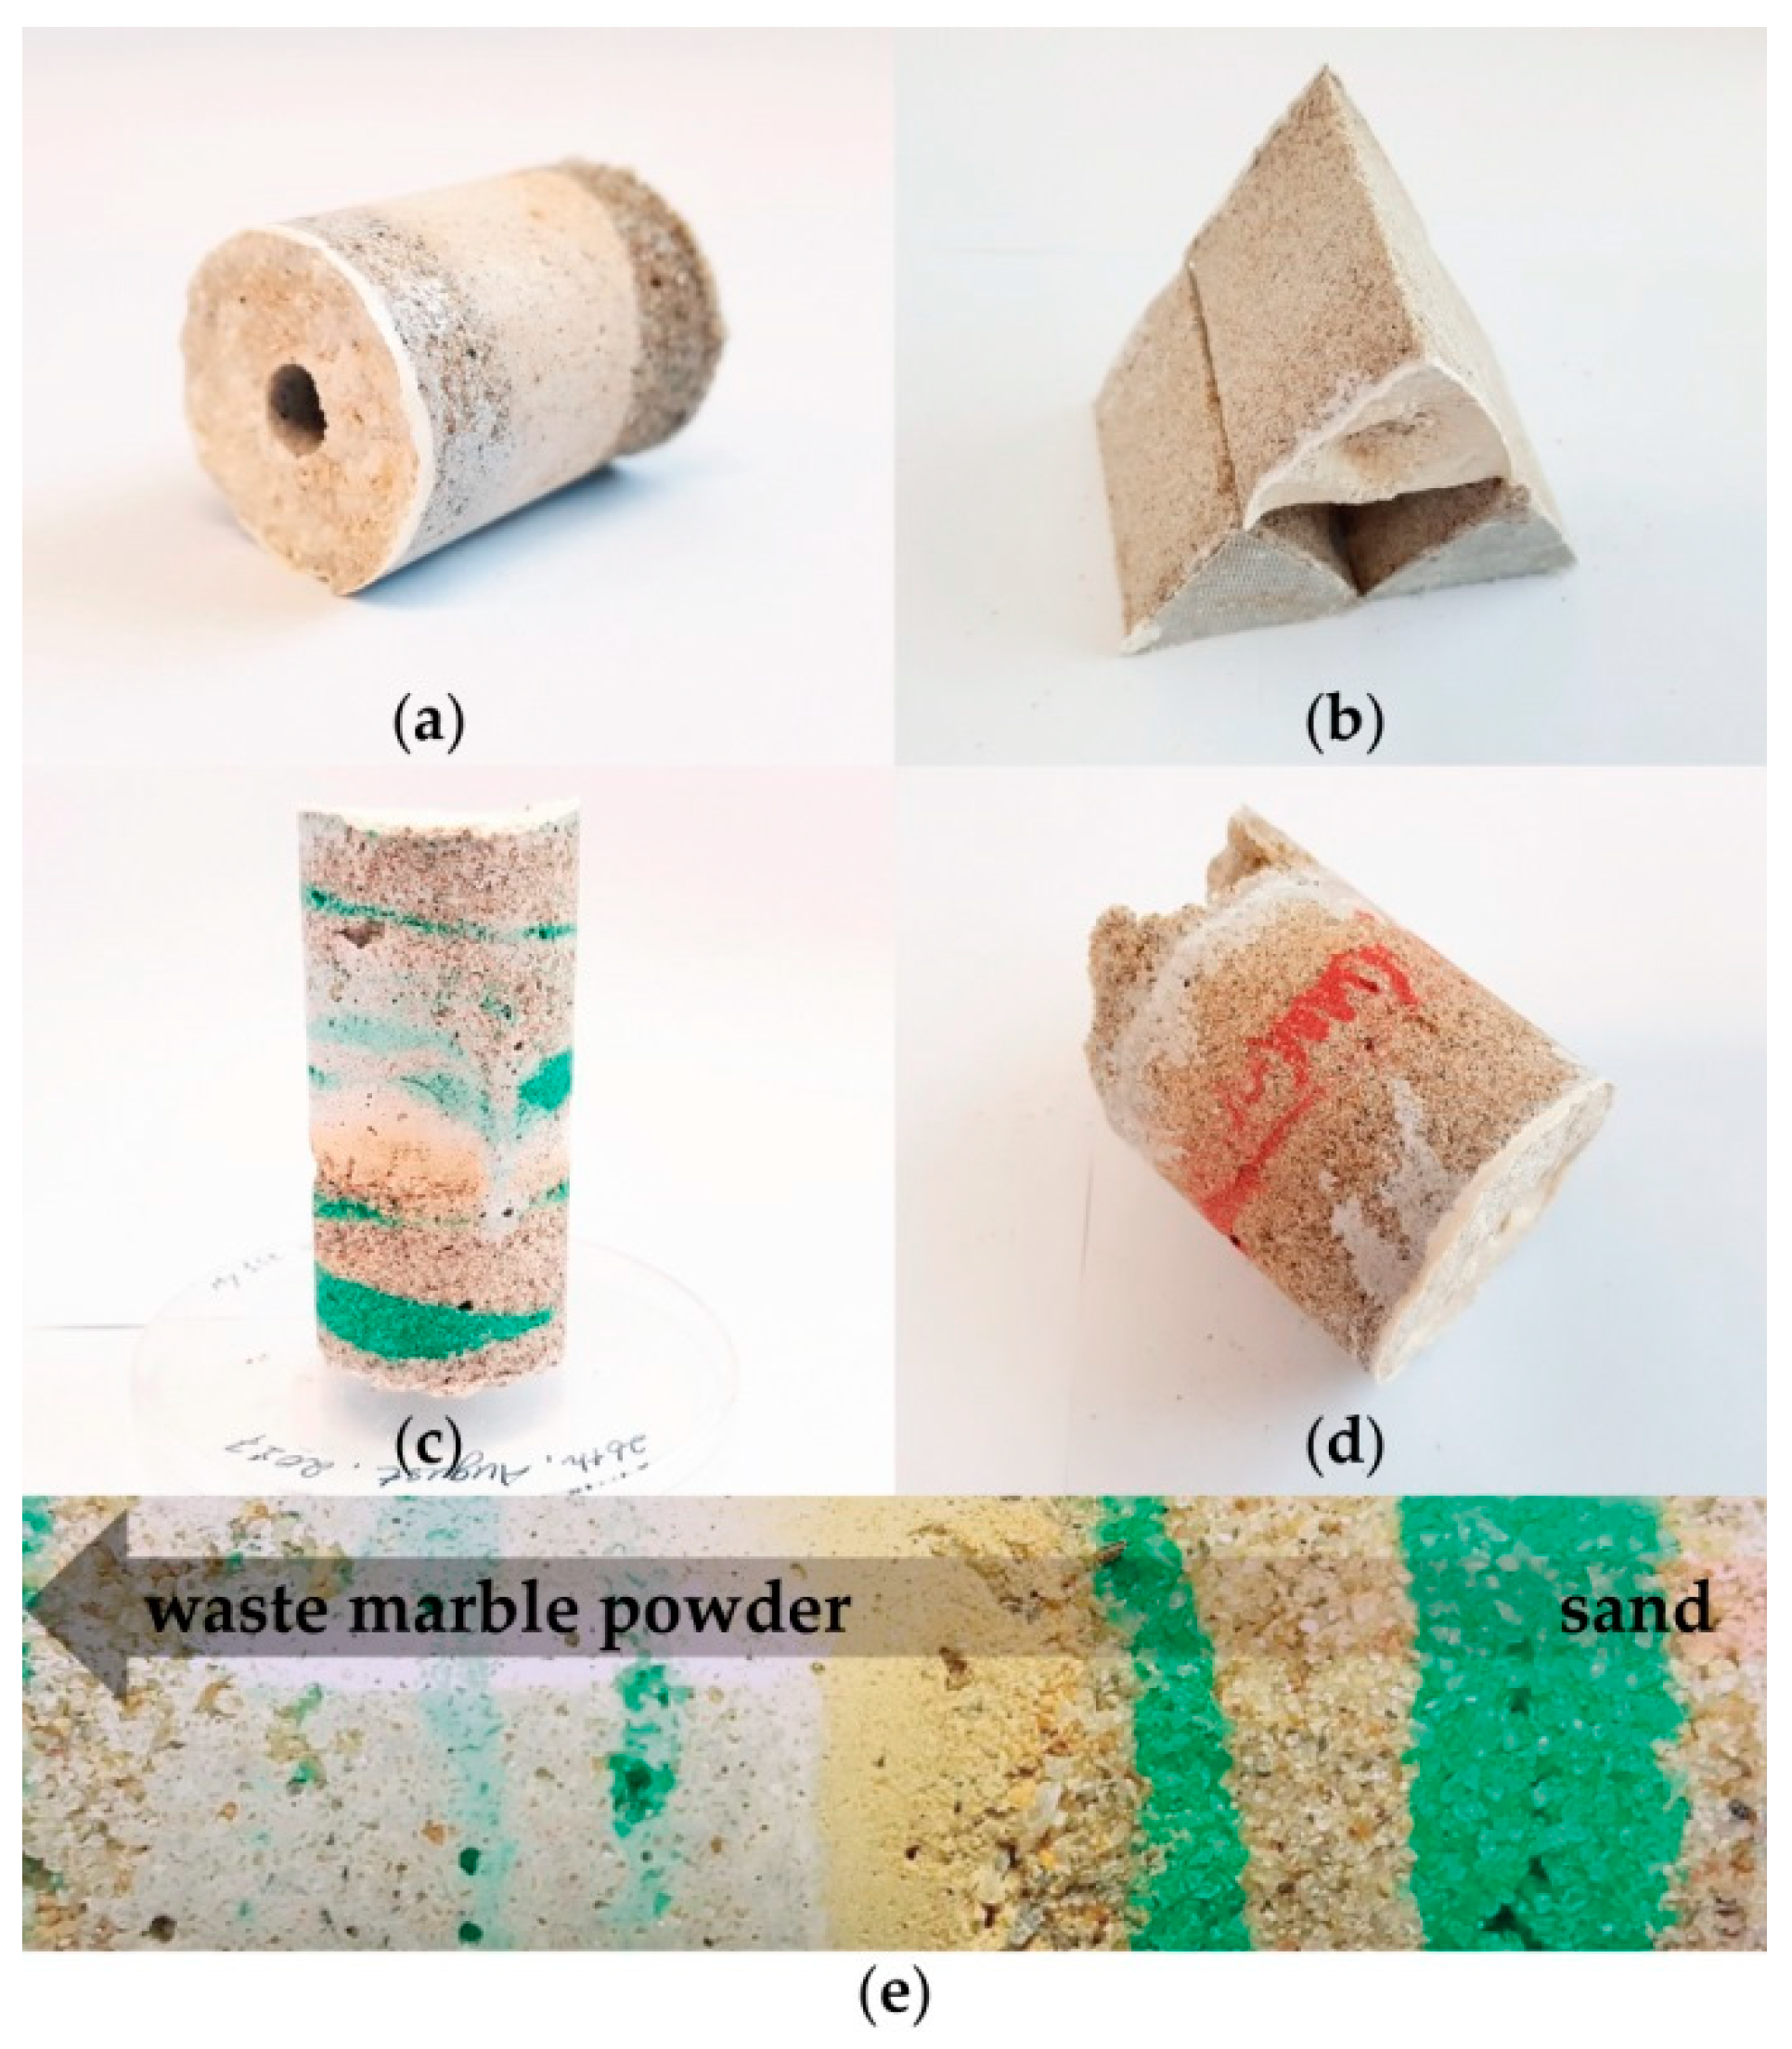
Microbially-induced calcite precipitation in this study was performed by repetitive steps of mixing 10 mm sand and solutions up to 60 mm in height. During these steps, a small amount of color sand and waste marble powder were inserted into the middle of layers (Figure 3). The cementation solution (0.75 M CaCl2 and 1.5 M urea) was then used. For scalability testing, mold B (diameter 60 mm) was prepared in the same way with 120 mm in height with main sand, color sand, and waste marble powder (Figure 3).

2.7. Design Application Using Biocement

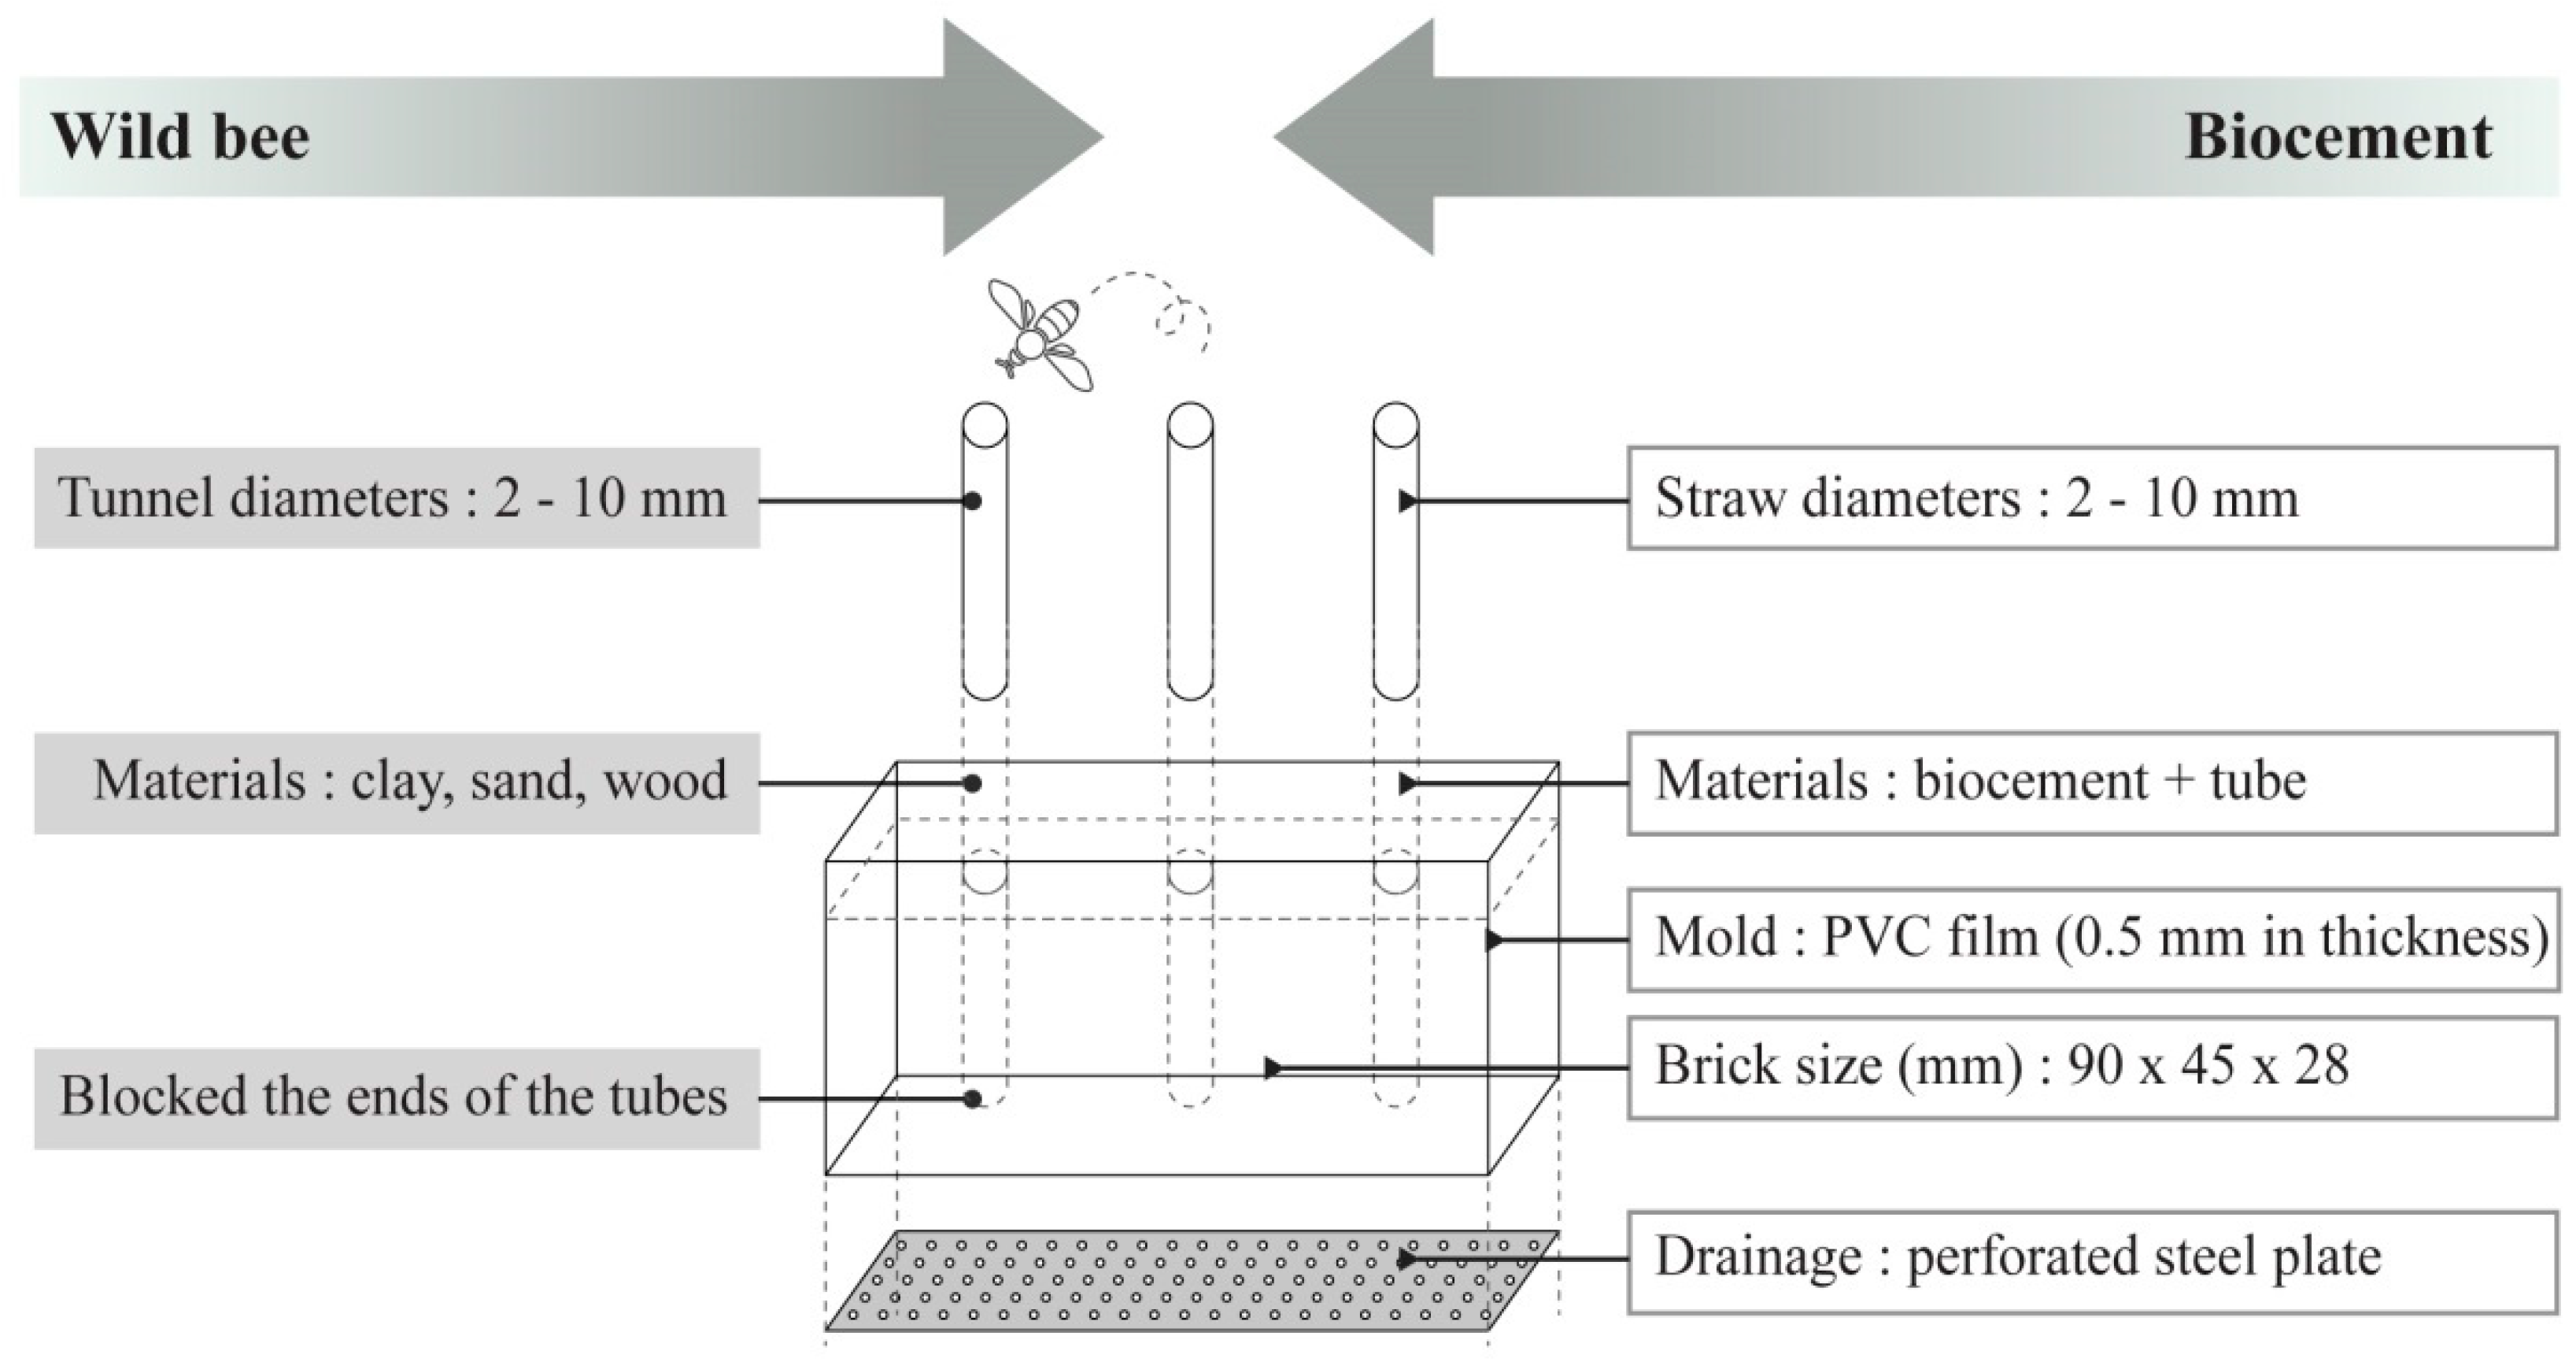
The PVC film (0.5 mm in thickness), a non-porous and non-reactive material, was formed in a hexahedral shape in half the size (85 mm × 45 mm × 28 mm) of the conventional brick size (190 mm × 90 mm × 57 mm). At the bottom of a hexahedron, perforated steel plates were attached for drainage (Figure 4). After the PVC mold was cut vertically on one surface, it was fixed with tape. The straw was then attached 10 mm above the bottom of the mold. Next, the mold was filled with the main sand, and bacterial culture and fixative solution were alternately poured. This work was performed every 10 mm in height and repeatedly performed until the sand accumulated up to 90 mm in height. Non-porous material straw (3 mm) was used as a mold for various sizes of holes. The ends of the holes were then blocked (Figure 4). Finally, the cementation solution (0.75 M CaCl2, 1.5 M urea) was applied for 14 days and block modules were dried at 60 °C.

3. Results and Discussion

The need for proper laboratory conditions combined with the rigorous procedures of MICP can be a huge barrier to the application of MICP in multidisciplinary fields; therefore, all experiments except for bacterial cultivation were conducted under non-sterilized conditions.

3.1. Study of MICP

3.1.1. Cultivation of S. pasteurii for MICP

The Sporosarcina pasteurii was aerobically cultivated in medium NH4-YE (ATCC 1376). The growth showed the exponential phase from 3 to 10 h (Figure S1). To produce the largest amount of biocement, the bacterial culture from the late exponential phase at 9 to 10 h (OD600 around 2.5 to 2.7) was used to precipitate calcium carbonate crystals (biocement) in the sand.
Microbially-induced calcite precipitation is absolutely dependent on the urease activity of S. pasteurii, which increases the surrounding pH. The urease activity of S. pasteurii was confirmed by pH change caused by urea degradation (Figure S2). After the addition of 0.15 M urea, the pH value of S. pasteurii culture increased to pH 12, while the pH values of cultures of Escherichia coli and Actinobacillus succinogenes were maintained at pH 6.

3.1.2. Study of Bacterial Solution

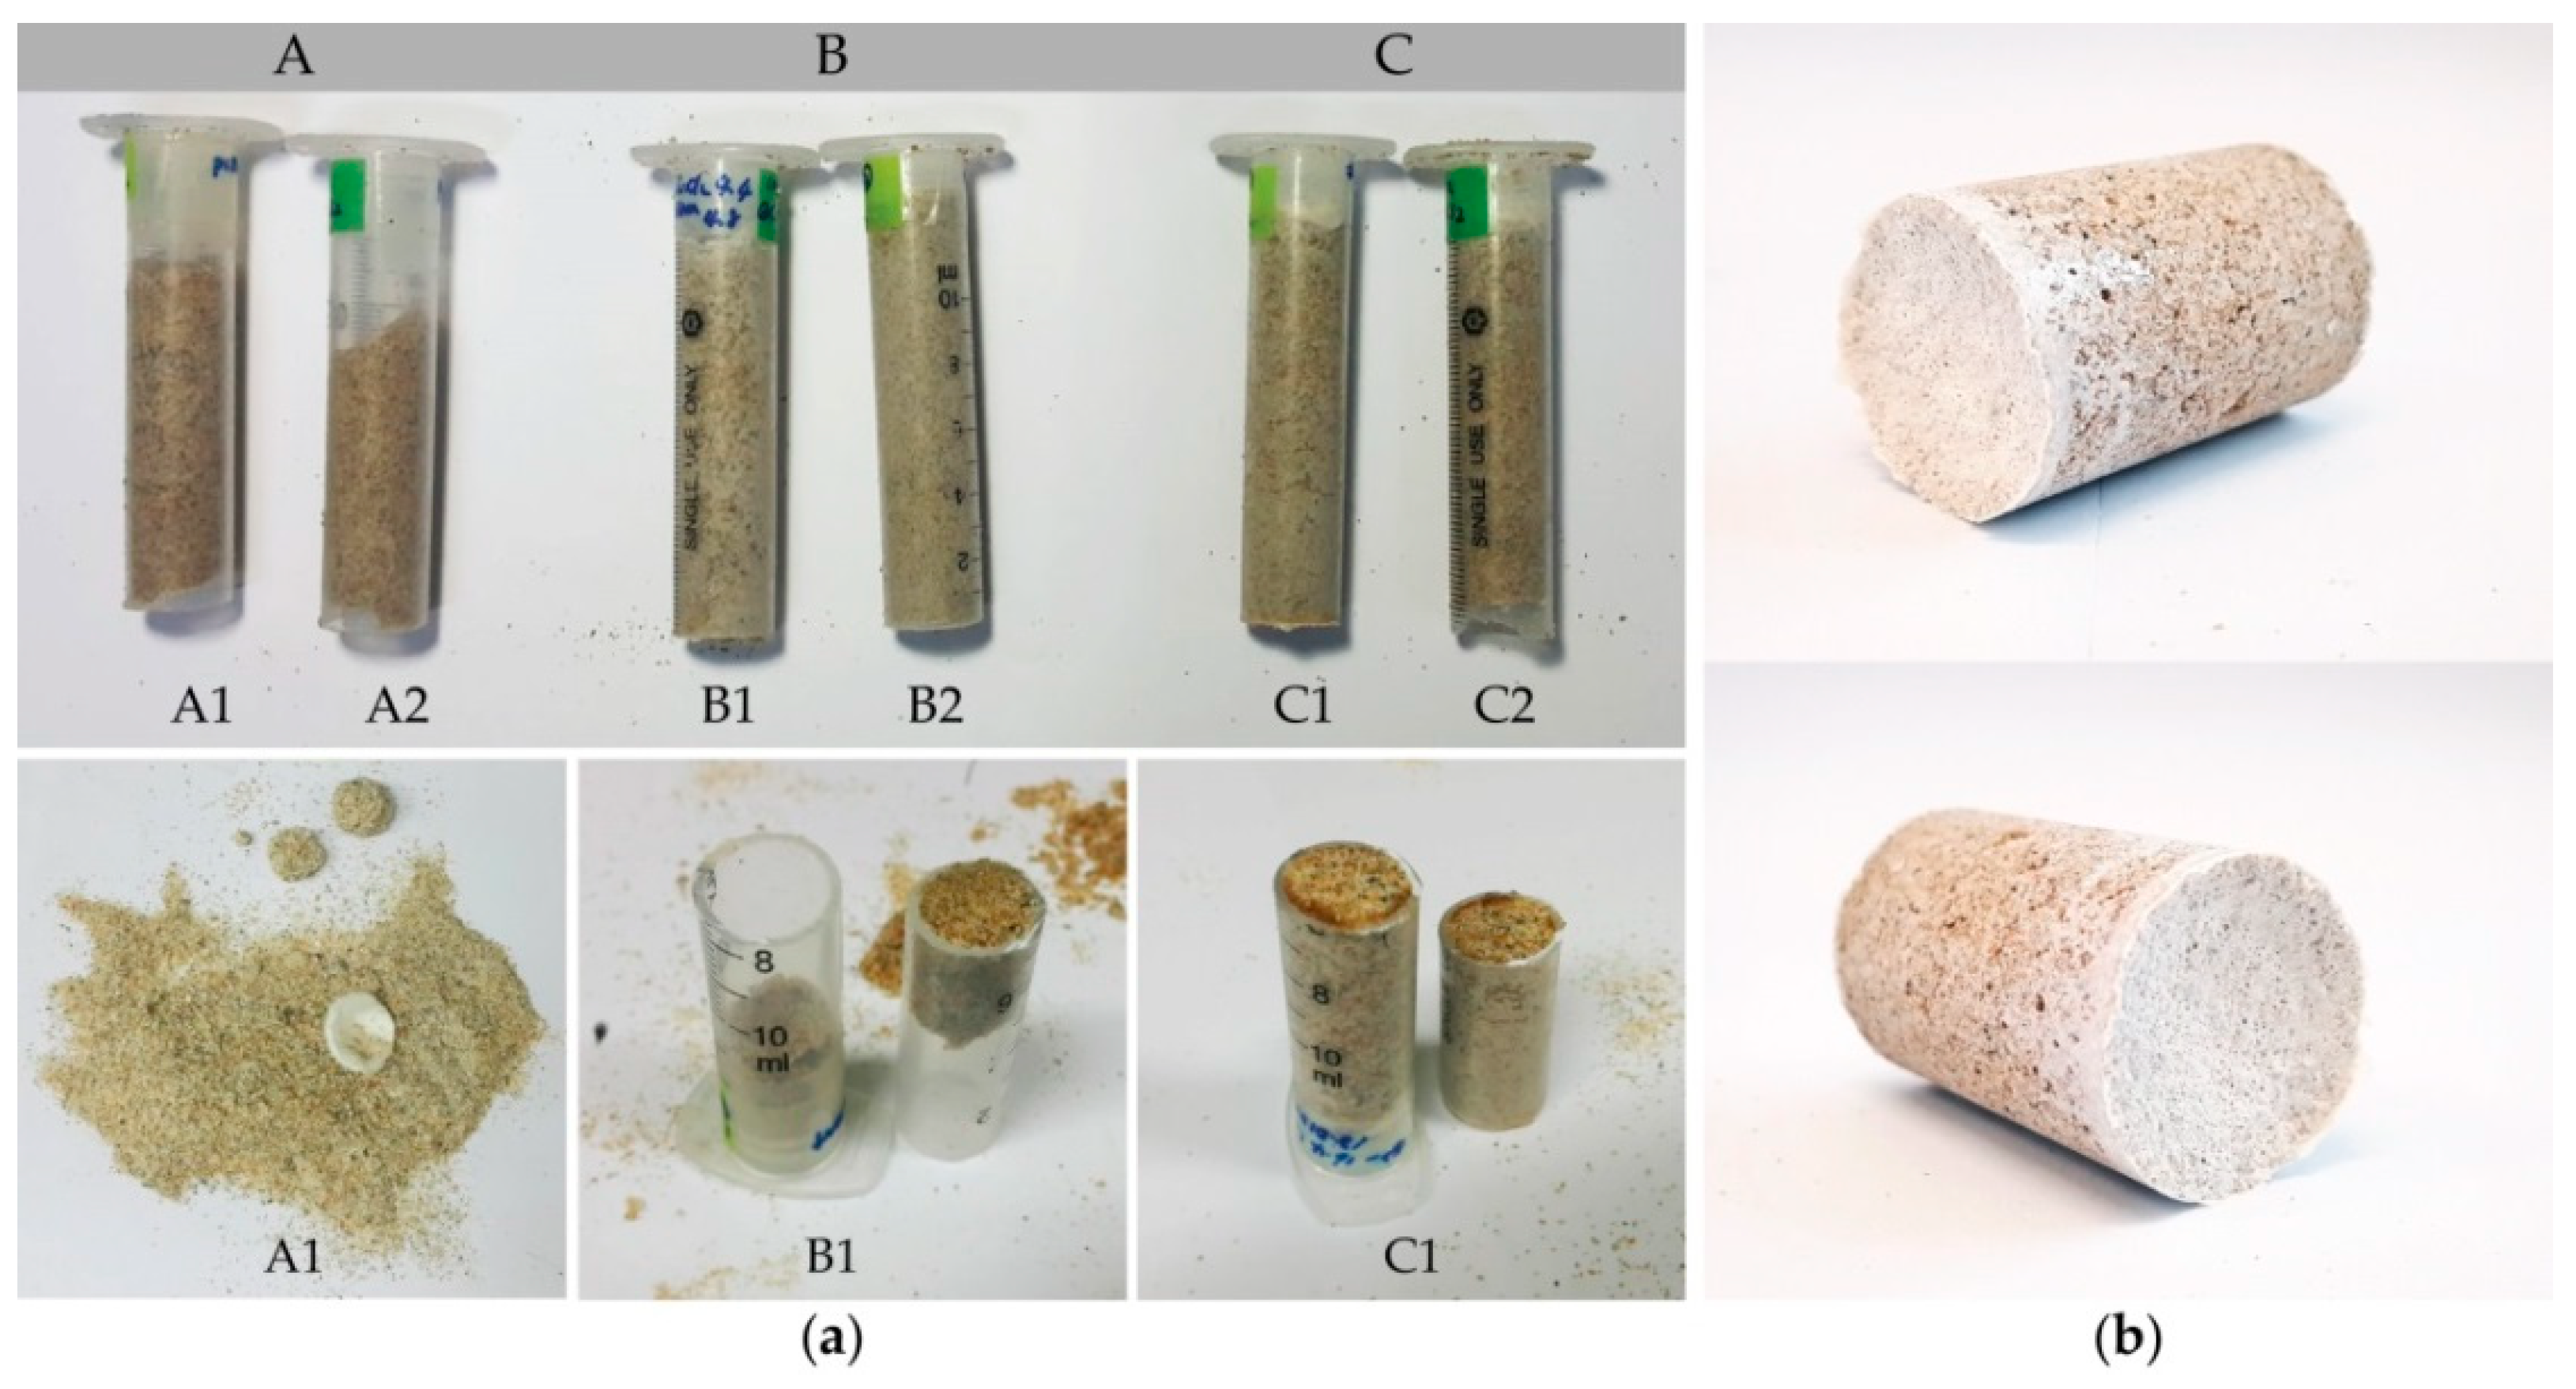
The difference in the two densities (1X, 10X) of bacterial solution did not significantly affect the MICP efficiency according to the results of the water percolation test and the loss of sand weight (Table 3). The concentrations of cementation solution had a more significant effect on the MICP results, and the cell density led to very slight differences in MICP efficiency depending on the concentration of the cementation solution (A–C). Overall, the combination of 1X cell density and the highest concentration of cementation solution (1.5 M urea and 0.75 M CaCl2) in C1 produced the biocement sample with the highest water impermeability, lowest sand loss (Table 3), and highest durability (Figure 5).

3.1.3. Study of Cementation Solution

Table 3 and Figure 5 show that the highest concentrations of urea (1.5 M) and CaCl2 (0.75 M) produced the highest MICP efficiency among the three concentrations (A–C). It was observed that C samples with the highest concentrations of urea (1.5 M) and CaCl2 (0.75 M) had much higher water resistances than the B and A samples, had only slight sand loss (Table 3), and showed significantly higher durability at the section cutting (Figure 5).
In contrast, the A samples with the lowest concentration of urea (0.12 M) and CaCl2 (0.055 M) had a large amount of sand loss with weak water resistance (Table 3), resulting in only a small amount of mass remaining on the top (Figure 5).
Another important factor for cementation solution was the addition of 25 mM NaHCO3, 150 mM NH4Cl, and 7.5 g/L BHI. Compared with the sample treated with the cementation solution containing NaHCO3 and NH4Cl, the sample with the cementation solution containing only urea and CaCl2 did not show any MICP activity.

3.1.4. Study of the Cementation Process

The most optimized method of injecting the bacterial solution, fixation solution, and cementation solution was as follows: 10 mL of the bacterial solution was poured into 10 g of sand, followed by the injection of 10 mL of the fixation solution and mixing with sand. The sand, bacterial solution, and fixation solution were alternatively stacked, and this process was repeatedly performed in order to fill the mold to the planned height. By alternately injecting bacterial solution and fixation solution into each layer of sand, the bacteria were evenly distributed and fixed in the sand with a curved shape and edge of the mold.
When the bacterial solution and the cement solution were mixed together before being injected into the sand, the biocement was concentrated on the surface of the sample resulting in a weak strength of the sample. In addition, when the bacterial solution and fixation solution were injected into the sand without dividing the sand layer, the bottom of the sample was not hardened.

3.1.5. Study of Mold

Material. The material of the mold was made of PVC film (0.3 mm–0.5 mm in thickness) and the drainage part was made of perforated plate (0.5 mm in thickness) with a diameter of 500 μm. The perforated plate showed little adhesion with the biocement sample, indicating that it is necessary to study other drainage materials. The material of the module was additionally investigated with 3D printer filament PLA (polylactic acid), concrete, syringe, and wooden material. The 3D filament PLA material, concrete, and syringe showed adhesion with the biocement sample such that the biocement sample could not be separated from the mold; the wood had issues with absorption.
Structure. The mold generated the most optimized biocement sample in the form of the vertical column structure. The transformation of the mold was applied to the plane. To produce uniformity and repetitive production of the modules, each module was assembled horizontally.
Injection and Drainage Structure. The injection and drainage were designed to be formed in a vertical structure and the injection port was open at the top. When the injection port was made of small holes, the biocement was concentrated around the hole, resulting in uneven strength in the mold. Applying the injection port at the side of the mold interfered with MICP activity. The ideal diameter of the drainage hole was 500 μm or less, considering the average size of the sand particles.

3.2. Mechanical and Chemical Evaluation of Biocement as an Alternative Concrete

A compressive strength test and analysis of mineralogical composition were employed to determine the biocement sample’s mechanical and chemical properties, respectively.

3.2.1. Compressive Strength Test

Since the elastic modulus (N/m2) of concrete can be expressed only as the compressive strength, the biocement is also expressed as compressive strength [42]. The elastic modulus (N/m2) of the biocement sample was analyzed using the compressive strength test (Figure 6a). The biocement samples were depressed by a load of 540 N ten times (Figure 6b). The elastic modulus (E) of the samples was determined to be 3.8 × 10⁷ N/m2 (Figure 6c). It was assumed that the difference in strength is about ±30%, depending on the composition of the biocement samples. As a result, biocement sample has showed 40% strength compared with the average compressive strength value (9.5 × 10⁷ N/m2) of conventional concrete showing 6 to 13 × 107 N/m2 [43]. Therefore, further optimization of biocement strength may justify biocement as an alternative to conventional concrete for general use.

3.2.2. XRD (X-ray Diffraction) Analysis

The biocement sample was cut into three equal parts, then the cross-sectional strength and calcium carbonate composition were visually confirmed. It was found that more CaCO3 was produced at the top part and that higher strength was shown at the top during cutting. On the surface of the bottom part, the combination of calcium carbonate and sand did not form evenly and it was easier to cut than the top (Figure 7a).
Figure 7b shows that characteristic peaks of calcium carbonate at 29.4°, 35.97°, 39.41°, 43.17°, and 47.5° of 2θ are formed in all three parts of the bio-cement sample. Since the CaCO3 peak was not found in the control sample without bacteria, it was determined that calcium carbonate in the three parts of the biocement sample was precipitated by MICP activity.
In the calcium carbonate peaks (Figure 7b), the calcite, which has the most stable polymorphic structure among the crystal structures of calcium carbonate (calcite, aragonite, and vaterite), was found to be the highest in the calcium carbonate peak. A few peaks of aragonite and vaterite were observed at the bottom of the biocement sample, but this may be attributable to the temperature, which plays an important role in the formation and transformation of the calcium carbonate crystals during the MICP process [44]. Since the calcite enhances bonding between adjacent particles with the hardest bridges, it is believed that high strength is formed in the top and middle of the biocement sample [45].

3.3. Compatibility Study of Biocement with Other Minerals and Various Formation Study

3.3.1. Compatibility of Biocement

Results from the compatibility test reveal that the biocement was compatible with the color sand and the waste marble powder, as shown in Figure 8c,d. The color pattern at the bottom of the sample in Figure 8c showed that the pattern was well formed as initially planned. However, the pattern at the top part was not formed as initially planned due to the water pressure at the time of injection of the cementation solution. In addition, the color of the pattern was faded by precipitation of calcite around the color sand particles. Therefore, it is necessary to consider the color change due to the precipitation of calcium carbonate when applying color to biocement.

3.3.2. Improvement of the Finish Quality of Biocement

In terms of the improvement of the finish quality, the surface with the waste marble powder had formed a softer finish than the surface with the sand, resulting in high-water impermeability and aesthetic improvement (Figure 8e). It is meaningful that the smooth surface finishes can provide a better experience to the user. The aesthetic aspects such as compatibility with color and the possibility of a smooth finish are important when the biocement is applied to products. Therefore, it is considered that the high compatibility of biocement with color sand and waste marble powder and the improvement of finishing quality by mixing with marble dust increase the possibility of using biocement in areas such as product design.
Figure 8a shows the bonding of biocement with three different particle sizes of sand, showing a smoother surface texture in the sand with smaller particles. It is also possible to develop various combinations of biocement modules by forming a biocement with a hole in the inside (Figure 8a). Figure 8b shows the possibility of bonding between the bio-cement and the iron perforated plate.
However, since PVC moldings are slightly deformed during the biocementation process, uniformity and repeatability should be considered when making various shapes using biocement.

3.4. Large-Scale Test

Two samples of different heights (mold A with 60 mm height, mold B with 120 mm height) were tested under the same optimized conditions in order to investigate the scalability of the biocement sample. As a result, it was identified that the sample was hardened only below 60 mm. When the height of the sample exceeded 60 mm, the part exceeding 60 mm was easily broken or formed into a weak structure, as seen in Figure 8d. Further scalability studies are needed to optimize the application of biocement.

3.5. Potential of Using Biocement in the Design Application

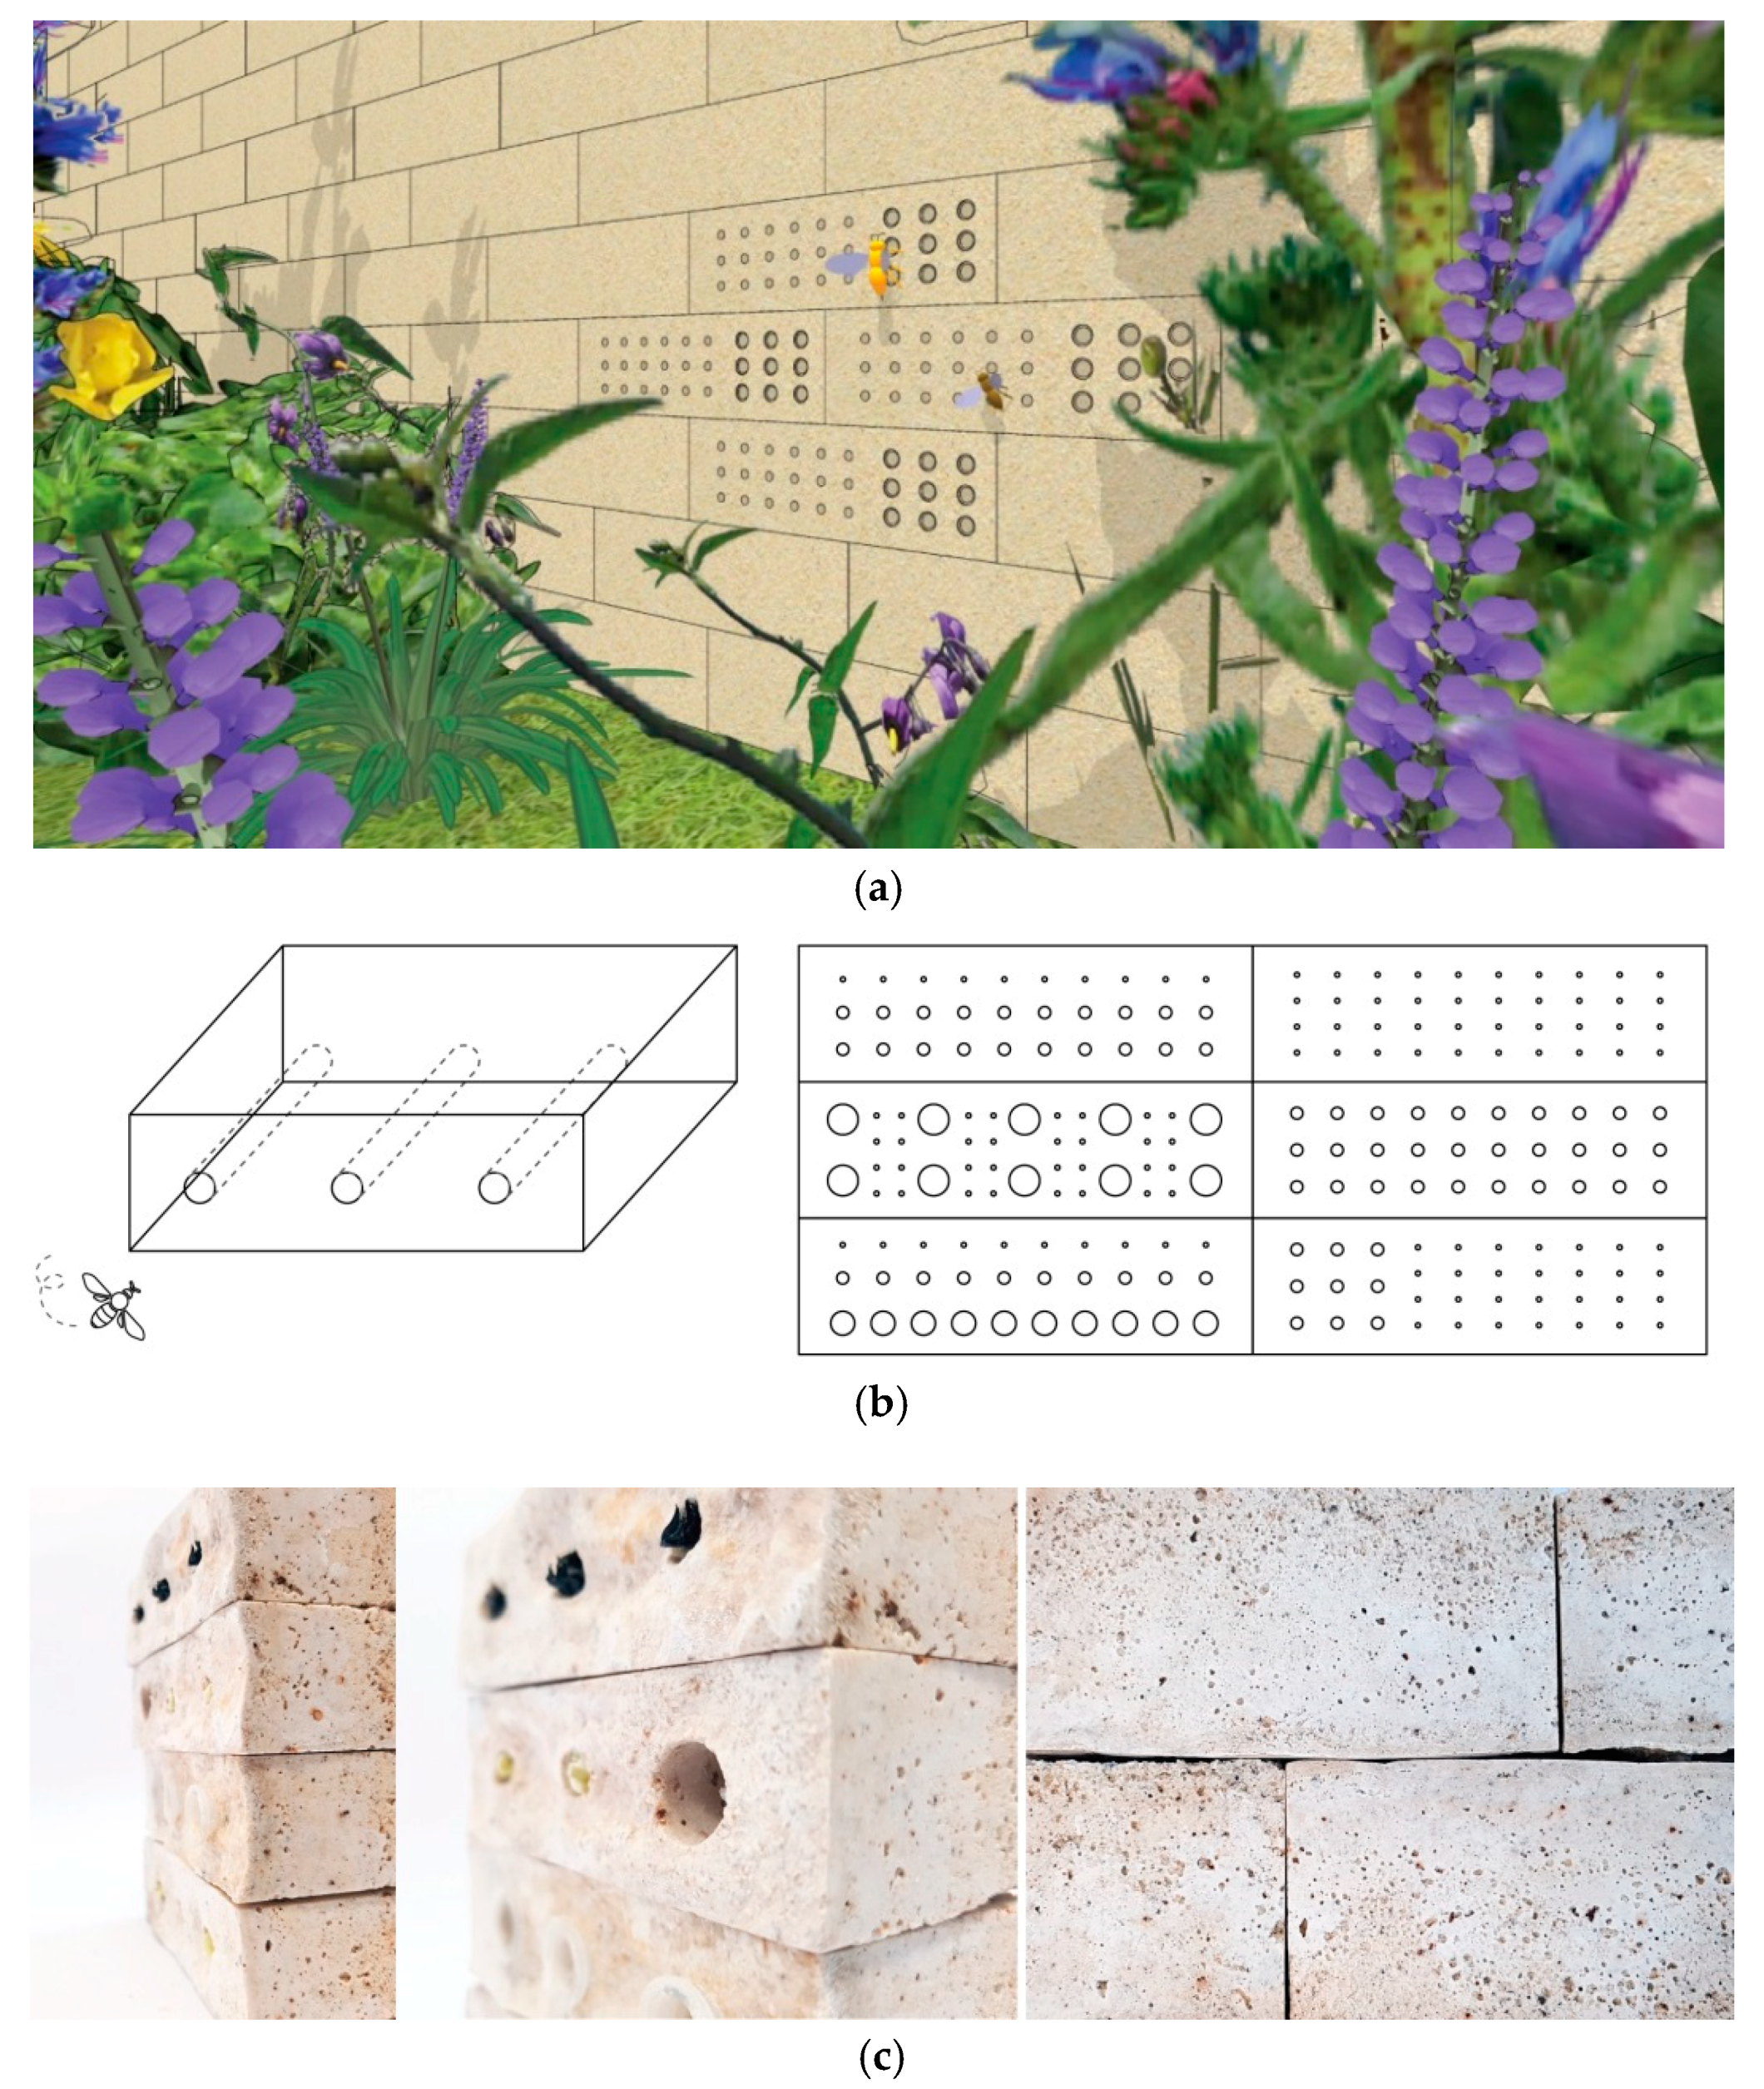
Figure 9 shows concept images of the biocement module using biocement that serves as a breeding place for wild bees and as brick for construction. As a design application, the module block to house wild bees can be installed in the garden, which can allow more wild bees to reproduce (Figure 9a). A biocement module can be installed as one block in the brick wall, or as an independent structure built with biocement modules.
In addition, various combinations of hole patterns can be developed, as shown in Figure 9b,c, so that many species of wild bees can reproduce in different holes that match their sizes.
The module size used here was 85 mm × 45 mm × 28 mm which is half of the conventional brick size due to the height limitation discussed in the above study. Considering the habitats of wild bees, the holes were casted using recycled 2–10 mm polypropylene straws. The holes in the bricks are blocked on just one side of the habitat of wild bees, and the bees’ nest is protected from moisture since the biocement does not allow water to pass through. Unfortunately, the polypropylene straws used to template the holes were not removed from the brick due to friction between the straw and the biocement. Thus, the casting material requires other environmentally friendly materials such as wood tubes to be used in place of polypropylene.
To install the bricks on an independent structure without installing them on the walls, the brick modules themselves can be manufactured in a form where they are connected to each other. For this method, we have studied various module types, as seen in Figure 8. For strong integration between the modules, the module requires unity and high strength, both of which are necessary for development. As shown in Figure 8, bricks can be applied with various types of sand on the surface, additionally allowing for an aesthetic that contains a variety of colors and patterns outside the building.
The concept of this design work is to achieve sustainability through interdisciplinary research in ecology, design, and biology using biocement. In addition, raw materials used for brick modules can be easily obtained locally in non-sterilized conditions, and can be recyclable as well, as seen in this study. Thus it can have less of an environmental impact as a sustainable product in consumption and disposal as compared to conventional cement. In terms of industrial applications using biocement, the unity, scalability, and repeatability of the modules need to be further explored, but the fabrication process using biocement can empower users to design a unique module of their choice.
A potential issue in this biocement fabrication processes includes the ammonia produced via urease activity that may harm the health of animals and humans (though the module smells negligibly of ammonia after being dried in an oven).

4. Conclusions

In this study, engineering and aesthetic aspects of the MICP process were applied to the design field. Although the compressive strength of our proposed concrete is still lower than that of conventional concrete, its potential as a new environmentally-friendly design material has been observed, showing positive results in terms of water permeability, compatibility with other materials, and material finish. This research contributes foundational research regarding design applications using biomaterials by combining knowledge from biological mechanism research, engineering aspects, and design applications. Future research will focus on improvements in strength and durability, which are necessary for use as a design material.

Supplementary Materials

The following are available online at https://www.mdpi.com/2071-1050/10/11/4079/s1, Figure S1: Growth curve of S.pasteurii, Figure S2: Urease test.

Author Contributions

C.L. did the initial design, data visualization, and performed all the experiments and design application works. O.B.K supervised the experimental research and supported all the laboratory resources for experiments. H.L. supervised the design research frame. C.L. prepared the manuscript and wrote the paper. O.B.K. reviewed and edited the paper.

Funding

This work was supported by the Basic Science Research Program (NRF-2015R1C1A2A01053608) and Basic Research Laboratory (BRL) (NRF-2015R1A4A1041997) through the National Research Foundation of Korea.

Acknowledgments

The authors acknowledge all the supports from Laboratory of Microbiology & Biorefinery at Ewha Womans University. Also, Nano Material Laboratory at Ewha Womans University helped to measure X-ray Powder Diffraction (XRD), and Korea Institute of Machinery and Materials (KIMM) supported the compressive strength test.

Conflicts of Interest

The authors declared no conflict of interest.

References

  1. Manzini, E. New design knowledge. Des. Stud. 2009, 30, 4–12. [Google Scholar] [CrossRef]
  2. Ehrenfeld, J. Sustainability by Design: A Subversive Strategy for Transforming Our Consumer Culture; Yale University: New Haven, CT, USA, 2008. [Google Scholar]
  3. Myers, W. Bio Design: Nature, Science, Creativity; Museum of Modern Art: New York, NY, USA, 2012. [Google Scholar]
  4. Camere, S.; Karana, E. Fabricating materials from living organisms: An emerging design practice. J. Clean. Prod. 2018, 186, 570–584. [Google Scholar] [CrossRef]
  5. Mogas-Soldevila, L.; Duro-Royo, J.; Lizardo, D.; Kayser, M.; Patrick, W.; Sharma, S.; Keating, S.; Klein, J.; Inamura, C.; Oxman, N. Designing the ocean pavilion: Biomaterial templating of structural, manufacturing, and environmental performance. In Proceedings of the International Association for Shell and Spatial Structures, Amsterdam, The Netherland, 20 August 2015; Available online: http://neri.media.mit.edu/assets/pdf/IASS2015_MediatedMatter_small.pdf (accessed on 30 October 2018).
  6. Worrell, E.; Price, L.; Martin, N.; Hendriks, C.; Meida, L.O. Carbon dioxide emissions from the global cement industry. Ann. Rev. Energy Environ. 2001, 26, 303–329. [Google Scholar] [CrossRef]
  7. Benhelal, E.; Zahedi, G.; Shamsaei, E.; Bahadori, A. Global strategies and potentials to curb CO2 emissions in cement industry. J. Clean. Prod. 2013, 51, 142–161. [Google Scholar] [CrossRef]
  8. Ivanov, V.; Chu, J.; Stabnikov, V. Basics of construction microbial biotechnology. In Biotechnologies and Biomimetics for Civil Engineering; Springer: Berlin, Germany, 2015; pp. 21–56. [Google Scholar]
  9. Monks, K. Would you live in a house made of sand and bacteria? It’s a surprisingly good idea. CNN, 20 May 2014. [Google Scholar]
  10. De Muynck, W.; De Belie, N.; Verstraete, W. Microbial carbonate precipitation in construction materials: A review. Ecol. Eng. 2010, 36, 118–136. [Google Scholar] [CrossRef]
  11. Dhami, N.K.; Reddy, M.S.; Mukherjee, A. Biomineralization of calcium carbonates and their engineered applications: A review. Front. Microbiol. 2013, 4, 314. [Google Scholar] [CrossRef] [PubMed]
  12. Sarda, D.; Choonia, H.S.; Sarode, D.; Lele, S. Biocalcification by Bacillus pasteurii urease: A novel application. J. Ind. Microbiol. Biotechnol. 2009, 36, 1111–1115. [Google Scholar] [CrossRef] [PubMed]
  13. Hamed Khodadadi, T.; Kavazanjian, E.; Van Paassen, L.; DeJong, J. Bio-grout materials: A review. Geotech. Spec. Publ. 2017, 288, 1–12. [Google Scholar]
  14. Dhami, N.K.; Reddy, M.S.; Mukherjee, A. Improvement in strength properties of ash bricks by bacterial calcite. Ecol. Eng. 2012, 39, 31–35. [Google Scholar] [CrossRef]
  15. Stocks-Fischer, S.; Galinat, J.K.; Bang, S.S. Microbiological precipitation of CaCO3. Soil Biol. Biochem. 1999, 31, 1563–1571. [Google Scholar] [CrossRef]
  16. Anbu, P.; Kang, C.-H.; Shin, Y.-J.; So, J.-S. Formations of calcium carbonate minerals by bacteria and its multiple applications. Springerplus 2016, 5, 250. [Google Scholar] [CrossRef] [PubMed]
  17. Boling, J. Bioprecipitation of Calcite by Sporosarcina pasteurii: Developing Efficient Methodologies for Microbially Indurated Rammed Earth. Ph.D. Thesis, University of Kansas, Lawrence, KS, USA, 2015. [Google Scholar]
  18. Phillips, A.J.; Gerlach, R.; Lauchnor, E.; Mitchell, A.C.; Cunningham, A.B.; Spangler, L. Engineered applications of ureolytic biomineralization: A review. Biofouling 2013, 29, 715–733. [Google Scholar] [CrossRef] [PubMed]
  19. Al-Thawadi, S. High Strength In-Situ Biocementation of Soil by Calcite Precipitating Locally Isolated Ureolytic Bacteria. Ph.D. Thesis, Murdoch University, Perth, Australia, 2008. [Google Scholar]
  20. Fortin, D.; Ferris, F.; Beveridge, T. Surface-mediated mineral development by bacteria. Rev. Mineral. Geochem. 1997, 35, 161–180. [Google Scholar]
  21. Dosier, G.K. Methods for Making Construction Material Using Enzyme Producing Bacteria. Patent 8,728,365, 20 May 2014. [Google Scholar]
  22. Brownell, B.E.; Swackhamer, M.T. Hypernatural: Architecture’s New Relationship with Nature; Princeton Architectural Press: New York City, NY, USA, 2015. [Google Scholar]
  23. Hammes, F.; Verstraete, W. Key roles of ph and calcium metabolism in microbial carbonate precipitation. Rev. Environ. Sci. Biotechnol. 2002, 1, 3–7. [Google Scholar] [CrossRef]
  24. Cheng, L.; Shahin, M.A.; Mujah, D. Influence of key environmental conditions on microbially induced cementation for soil stabilization. J. Geotech. Geoenviron. Eng. 2016, 143, 04016083. [Google Scholar] [CrossRef]
  25. Khodadadi Tirkolaei, H.; Bilsel, H. Estimation on ureolysis-based microbially induced calcium carbonate precipitation progress for geotechnical applications. Mar. Georesour. Geotechnol. 2017, 35, 34–41. [Google Scholar] [CrossRef]
  26. González-Varo, J.P.; Biesmeijer, J.C.; Bommarco, R.; Potts, S.G.; Schweiger, O.; Smith, H.G.; Steffan-Dewenter, I.; Szentgyörgyi, H.; Woyciechowski, M.; Vilà, M. Combined effects of global change pressures on animal-mediated pollination. Trends Ecol. Evol. 2013, 28, 524–530. [Google Scholar] [CrossRef] [PubMed] [Green Version]
  27. Baldock, K.C.; Goddard, M.A.; Hicks, D.M.; Kunin, W.E.; Mitschunas, N.; Osgathorpe, L.M.; Potts, S.G.; Robertson, K.M.; Scott, A.V.; Stone, G.N. Where Is the UK’s Pollinator Biodiversity? The Importance of Urban Areas for Flower-Visiting Insects. Proc. R. Soc. B 2015, 282, 20142849. [Google Scholar] [CrossRef] [PubMed]
  28. Glaum, P.; Simao, M.-C.; Vaidya, C.; Fitch, G.; Iulinao, B. Big city bombus: Using natural history and land-use history to find significant environmental drivers in bumble-bee declines in urban development. Roy. Soc. Open Sci. 2017, 4, 170156. [Google Scholar] [CrossRef] [PubMed]
  29. Hernandez, J.L.; Frankie, G.W.; Thorp, R.W. Ecology of urban bees: A review of current knowledge and directions for future study. CATE 2009, 2, 3. [Google Scholar] [CrossRef]
  30. Kellert, S.R.; Heerwagen, J.; Mador, M. Biophilic Design: The Theory, Science and Practice of Bringing Buildings to Life; John Wiley & Sons: Hoboken, NJ, USA, 2011. [Google Scholar]
  31. Matteson, K.C.; Ascher, J.S.; Langellotto, G.A. Bee richness and abundance in New York City urban gardens. Ann. Entomol. Soc. Am. 2008, 101, 140–150. [Google Scholar] [CrossRef]
  32. Al Qabany, A.; Soga, K. Effect of chemical treatment used in MICP on engineering properties of cemented soils. Géotechnique 2013, 63, 331. [Google Scholar] [CrossRef]
  33. Kim, G.; Youn, H. Microbially induced calcite precipitation employing environmental isolates. Materials 2016, 9, 468. [Google Scholar] [CrossRef] [PubMed]
  34. Ramachandran, S.K.; Ramakrishnan, V.; Bang, S.S. Remediation of concrete using micro-organisms. ACI Mater. J.-Am. Concr. Inst. 2001, 98, 3–9. [Google Scholar]
  35. Chunxiang, Q.; Jianyun, W.; Ruixing, W.; Liang, C. Corrosion protection of cement-based building materials by surface deposition of CaCO3 by Bacillus pasteurii. Mater. Sci. Eng. C 2009, 29, 1273–1280. [Google Scholar] [CrossRef]
  36. Gorospe, C.M.; Han, S.-H.; Kim, S.-G.; Park, J.-Y.; Kang, C.-H.; Jeong, J.-H.; So, J.-S. Effects of different calcium salts on calcium carbonate crystal formation by Sporosarcina pasteurii KCTC 3558. Biotechnol. Bioprocess Eng. 2013, 18, 903–908. [Google Scholar] [CrossRef]
  37. Mobley, H.; Hausinger, R. Microbial ureases: Significance, regulation, and molecular characterization. Microbiol. Rev. 1989, 53, 85–108. [Google Scholar] [PubMed]
  38. Cheng, L.; Cord-Ruwisch, R. Upscaling effects of soil improvement by microbially induced calcite precipitation by surface percolation. Geomicrobiol. J. 2014, 31, 396–406. [Google Scholar] [CrossRef]
  39. DeJong, J.T.; Fritzges, M.B.; Nüsslein, K. Microbially induced cementation to control sand response to undrained shear. J. Geotech. Geoenviron. Eng. 2006, 132, 1381–1392. [Google Scholar] [CrossRef]
  40. Whiffin, V.S. Microbial CaCO3 Precipitation for the Production of Biocement. Ph.D. Thesis, Murdoch University, Perth, Australia, 2004. [Google Scholar]
  41. Kucharski, E.S.; Cord-Ruwisch, R.; Whiffin, V.; Al-thawadi, S.M. Microbial Biocementation. Patent 8,182,604, 22 May 2012. [Google Scholar]
  42. Beer, F.P.; Johnston, E.R.; DeWolf, J.T.; Mazurek, D.F. Mechanics of Materials; McGraw-Hill: New York, NY, USA, 1992. [Google Scholar]
  43. Rashid, M.A.; Mansur, M.A. Considerations in producing high strength concrete. J. Civil Eng. (IEB) 2009, 37, 53–63. [Google Scholar]
  44. Wang, H.; Alfredsson, V.; Tropsch, J.; Ettl, R.; Nylander, T. Formation of CaCO3 deposits on hard surfaces effect of bulk solution conditions and surface properties. ACS Appl. Mater. Interfaces 2013, 5, 4035–4045. [Google Scholar] [CrossRef] [PubMed]
  45. Martinez, B.C.; DeJong, J.T. Bio-mediated soil improvement: Load transfer mechanisms at the micro-and macro-scales. In Proceedings of the U.S.-China Workshop on Ground Improvement Technologies, Orlando, FL, USA, 14 March 2009. [Google Scholar]
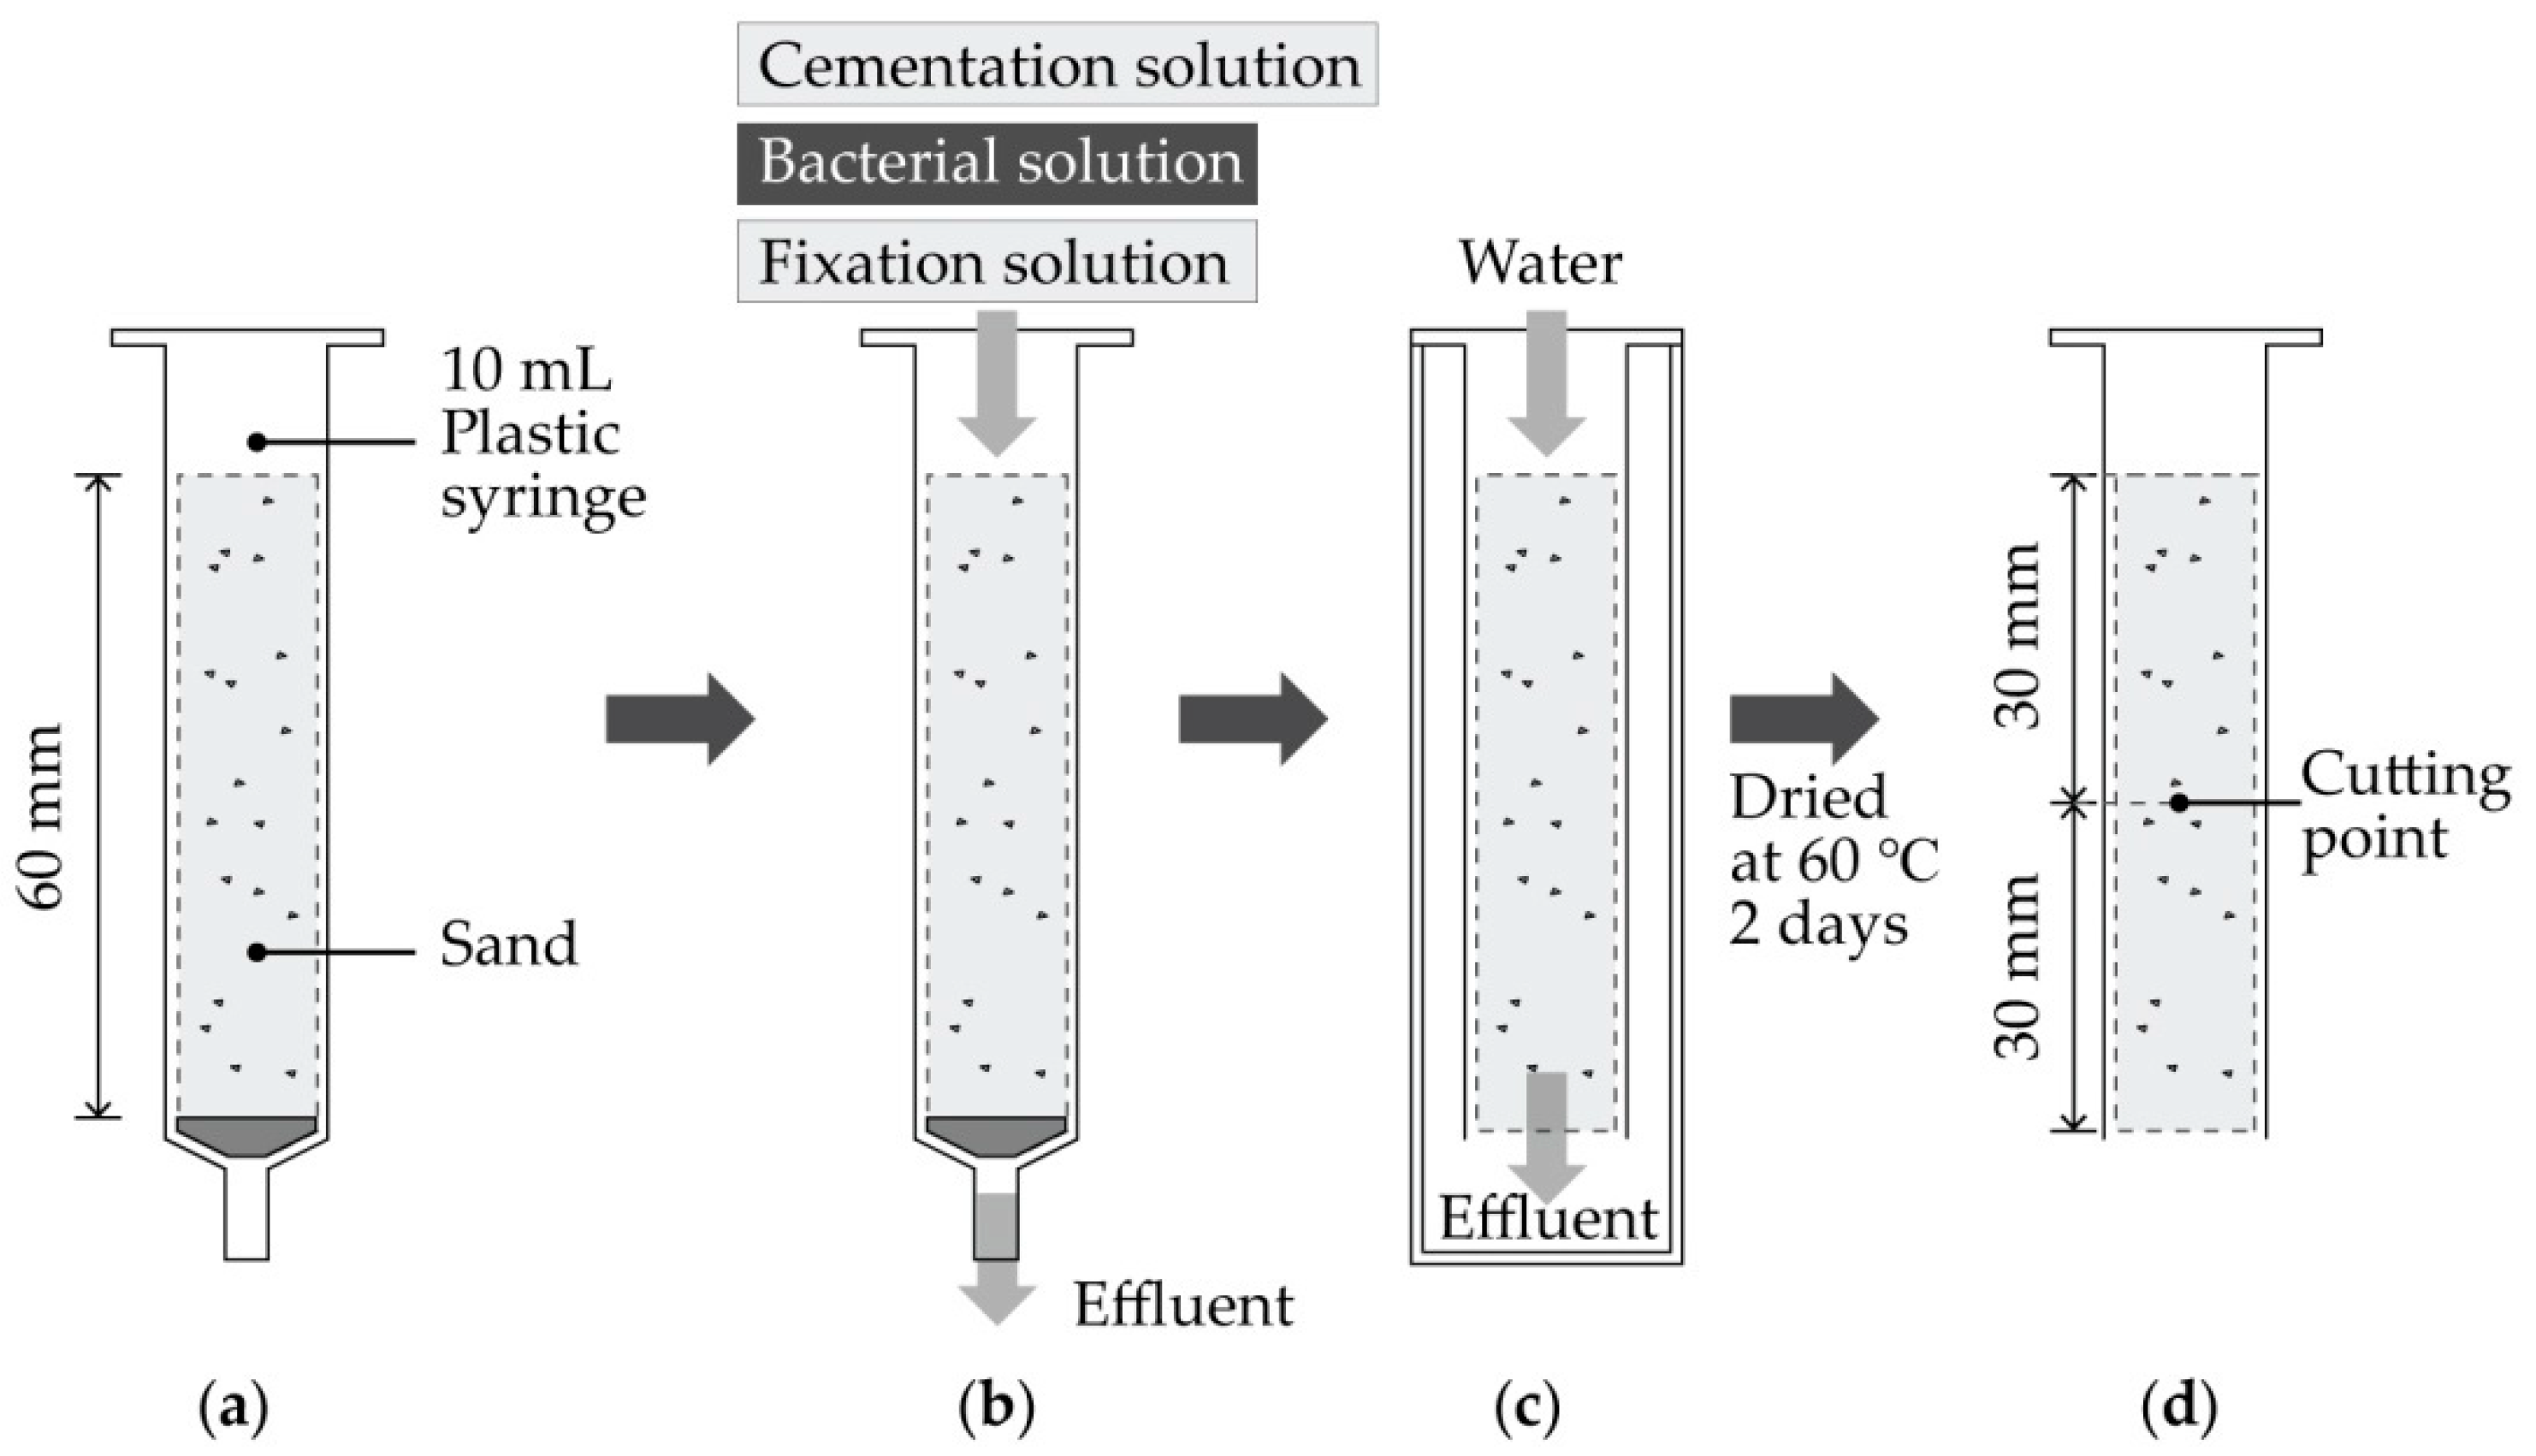
Figure 1. Experimental setup to test two factors affecting microbially-induced calcite precipitation (MICP): concentration of cementation solution, bacterial density. (a) A plastic syringe (10 mL) was prepared as a mold and the syringe was filled with sand A to 60 mm height. (b) Bacterial solution, fixation solution (CaCl2 aqueous solution), and cementation solution were sequentially injected into the top surface of the syringe. (c) Experimental setup for water absorption test. (d) Cutting the sample in three parts to identify the hardness.
Sustainability 10 04079 g001
Figure 2. Experimental setup for MICP: (a) A PVC pipe was prepared as a mold and a perforated steel plate was used for drainage. (b) Injection of bacterial solution and fixation solution alternatively on each sand layer. This process is repeated once again after the mold is inverted. (c) The cementation solution was injected into the top surface.
Sustainability 10 04079 g002
Figure 3. Different layer composition plan.
Sustainability 10 04079 g003
Figure 4. Mold design considering wild bees; a 0.5-mm thick PVC film was formed in a hexahedral shape as a mold.
Sustainability 10 04079 g004
Figure 5. The result for the MICP optimization condition: (a) The degree of sand hardness differed depending on the concentration of cementation solution (urea-CaCl2). C1 showed a high degree of hardness from the top to the bottom. (b) Biocement sample made under optimized conditions.
Sustainability 10 04079 g005
Figure 6. (a) Experimental setup for the compressive strength test; five samples produced by 1X bacterial culture and cementation solution (0.75 M CaCl2, 1.5 M urea) were prepared for the compressive strength test. The elastic modulus (N/m2) of the biocement sample was measured. (b) Load-displacement measurement. A black line wave indicates that the sample was pushed ten times by the load of 540 N in the compressive strength and it was endured in the elastic zone. (c) Load-shrinkage diagram. The blue line indicates measured value and the red line indicates average value. The elastic modulus (E) of the sample was measured at 3.8 × 10⁷ (N/m2).
Sustainability 10 04079 g006
Figure 7. The result of X-ray diffraction (XRD) shows calcium carbonate composition in the biocement sample: (a) The section of the biocement sample was cut into three equal portions and observed. The top part (T1) has more precipitation of calcium carbonate than the bottom (B2). (b) The mineral composition of the biocement sample was analyzed by XRD in each section of the sample (Top, Middle, Bottom). Control refers to the sand without the bacteria. Circle, calcite; square, aragonite; triangle, vaterite.
Sustainability 10 04079 g007
Figure 8. Different formations using biocement. (a) Cylindrical shape formation using three different sands that make a pattern on the surface. We planned to have a hole in the center of the cylinder. (b) Triangle shape formation using biocement. The metal plates are fixed with the sand by MICP. (c) Biocement sample containing waste marble powder and color sand with 60 mm height. (d) Biocement sample containing waste marble powder and color sand with 120 mm height, the part exceeding 60 mm was easily broken. (e) The surface of biocement containing waste marble powder and color sand.
Sustainability 10 04079 g008
Figure 9. Biocement application to bee nesting. Biocement was applied in a brick module to serve as a nest of wild bees and as a basic building material for human construction. (a) Bee block module installed in garden. (b) Basic block module and the combination of block modules which have differently-sized holes to accommodate many wild bees. (c) Bee block prototype fabricated with biocement.
Sustainability 10 04079 g009
Table 1. Summary of sand and solutions for MICP.
Control VariableRangeReferences
Sand typeGrain size250–500 μm[33]
SterilizationNon sterilizationThis study
Bacterial solutionMicroorganismSporosarcina pasteurii[12]
Bacterial densityOD600 2.4–2.7[35]
Carbon sourceYeast extract[15]
Cementation solutionCalcium sourceCaCl2[36]
Nitrogen sourceUrea[37]
Added substances25 mM NaHCO3
150 mM NH4Cl
[15]
pH7.0[15]
SterilizationNon-sterilizationThis study
Fixation solutionAttaching bacteria to sand particles55 mM CaCl2 [21]
Table 2. Summary of treatment procedure.
Control VariableRangeReferences
MoldMaterialPVC cylinder pipe (0.3 mm in thickness, 30 mm in diameter, and 60 mm in height),
Perforated steel plate (0.5 mm in thickness, 0.5 mm in hole diameter)
This study
Bacterial culture InjectionBacterial placementLayer by layer 1[38]
Cementation solution InjectionInjection frequency2 times a dayThis study
Injection time (days)14–21
Injection strategyApplied from the top to the bottom by gravity
PercolationPercolated by gravity
Temperature (°C)25–30 2
Total injection solution per each sample (mL)200
Note: 1 Alternating bacterial culture and fixation solution for even distribution of urease activity; 2 The optimum temperature for S. pasteurii is 30 °C under field conditions.
Table 3. The concentration of urea-CaCl2 and cell density influenced the efficiency of MICP. The largest amount of biocement sample was formed and the high water impermeability was observed in C with the highest concentration of urea-CaCl2. Additionally, the least amount of bio-cement was lost after water permeated it.
Name[Urea] (M)[CaCl2] (M)Cell Density (time)Biocement Sample Weight (g)Water Percolation Quantity (mL)Biocement Sample Weight (g) after Water Percolation TestLoss of Sand Weight (g)
AA1 10.120.055119.35114.15.18
A21017.732.516.31.42
BB10.40.2121.46.220.31.06
B21024.51024.10.4
CC1 21.50.75128.2027.60.6
C210250250
Note: The cell density and urea-CaCl2 concentration of 1 are used in References [21,39], and those of 2 are used in References [8,40,41].