Article

Influence of Reduced Ownership on the Environmental Benefits of the Circular Economy

Department of Built Environment, School of Engineering, Aalto University, Otakaari 4, P.O. Box 14100, AALTO-FIN, 00076 Helsinki, Finland
*
Author to whom correspondence should be addressed.
Sustainability 2018, 10(11), 4077; https://doi.org/10.3390/su10114077
Submission received: 4 September 2018 / Revised: 8 October 2018 / Accepted: 30 October 2018 / Published: 7 November 2018

Abstract

:
The circular economy has become a popular concept, suggesting economic growth with fewer emissions and reduced ownership as one of its key parameters. Based on the literature, however, it appears that the concept has not been sufficiently contested empirically. This study evaluates the carbon and material footprint implications of reduced ownership in the context of household consumption. We found that the reduced ownership does not automatically reduce the environmental impact of the production–consumption system in the context of households. Reduced ownership in the study did not have any noticeable influence on material footprint, and in the case of carbon footprint, it only had a mild positive influence in low-income households. The result is surprising, since both intuitively as well as based on the literature, moving from ownership to services should increase resource efficiency and reduce environmental impact. In the context of households, actual consumption and investment behavior seem to override the theoretical benefits of reduced ownership. In our study, the circular economy rebound and the willingness to invest in green products seems to explain quite well why the environmental impact of consumption is not reduced when households move from ownership to services. Households appear to spend the money saved from reduced ownership on carbon-intensive services; when they own the products themselves, they invest a more-than-average amount in the life cycle performance of the products. The paper’s implications for the circular economy as a concept for decoupling economic growth from environmental pressure is that one of its primary qualities, sharing and renting services instead of owning things, seems to offer only a partial solution for the dilemma. In order to fully benefit from reduced ownership, the circular economy should emphasize simultaneous change in both the production and consumption of services, as it seems that simply offering products for rent does not automatically reduce the environmental impact of the final demand.

1. Introduction

In recent years, the circular economy (CE) has raised high expectations as a viable solution for decoupling economic growth from environmental pressure [1,2]. This perspective is clearly encapsulated in a quote from the CEO of the World Business Council for Sustainable Development (WBCSD): “Moving towards the circular economy will be critical for addressing climate change” [3]. Similarly, the business models of the circular economy have been suggested as sustainable rivals to traditional linear business and operation models.
There are numerous definitions of CE in academic literature. Prieto-Sandoval et al. (2018), for example, in their recent literature review, present over ten existing definitions of the circular economy [4]. Based on their analysis, the definition has evolved from something quite abstract toward something more holistic. Nevertheless, almost all of the definitions imply that closing loops are an important part of CE. The most recent definitions have also started to call for new business models that enable moving from products toward services and reuse practices. In this study, we emphasize the idea of reusing products through renting and leasing instead of selling them to consumers.
According to the literature, one of the key enablers for CE is indeed the new consumption culture, where the ownership of products is not the main focus; instead, it is the access to the function it provides instead [5,6,7]. Accordingly, for businesses, it has been suggested that leasing instead of owning is a cornerstone of the CE business model as it allows manufacturers to create durable products without cannibalizing their own sales [8].
Ghisellini et al. (2016) have proposed that CE suggests a rethinking of ownership in favor of models where products are leased to consumers [7]. Furthermore, on the consumption side, it is claimed that monitoring collaborative consumption experiences (e.g., car sharing) suggests that the quality of consumption patterns affects environmental impacts. In CE, the reuse of products is combined with servitization, meaning that products are leased instead of sold [9]. Numerous other authors also suggest that companies should extend their responsibility over the use of products in order to enable a more effective closing of loops, since retaining the ownership of products encompasses the highest level of responsibility over it [10,11,12,13]. Finally, new consumption systems where user groups and communities share the use of the function, service, and value of physical products are suggested [14,15].
There are also several CE business concepts, both theoretical and empirical, suggesting the move away from ownership toward services as a key characteristic of the CE. Many of the practical implementations are in the business-to-business (B2B) domain, e.g., ‘power by the hour’ for jet engines by Rolls-Royce [16], but examples can also be found in the business-to-consumer (B2C) domain, e.g., ‘pay per wash’ for washing machines by Electrolux [17]. One extensively studied strategy in the field is product service systems (PSS) [14,18,19]. In environmental PSS studies, the increased service content is typically estimated to reduce the environmental intensity of the product sold [20]. However, serious challenges, such as user behavior and complexity, in environmental evaluation of PSS have also been pointed out [21]. Another closely related approach is known as product-as-a-service, where companies extend their responsibility over users for the ownership of products in order to enable a more effective closing of loops [10,11,12]. The new business concepts may include leasing and renting the service provided by the product, designing the product for multiple life cycles, take-back strategies, reverse logistics, and concepts that enhance sharing the function of the product between many users [15,22]. Similarly, other approaches have been presented to improve circularity [23,24,25].
Compared to linear models of value creation, CE promises two main types of environmental benefit [15]: Firstly, decreasing the need for primary production, whether through substitution by secondary production or increased efficiency in fulfilling the demand with fewer resources. Secondly, reducing negative externalities such as greenhouse gas (GHG) emissions by using renewable inputs in primary production as far as possible. As the profit comes from the asset, it is argued that the manufacturer can be incentivized to maximize the number of times an individual product unit can be offered, the utilization rate, and product performance [26]. This means that the same or even more value is provided for the user with less energy or material. Offering additional services such as maintenance and upgradability might also increase the consumer acceptance of access over ownership offers [27]. As the producer retains the responsibility for the costs of risks and waste in the use phase, it has been argued that it makes economic sense to design the product in a way that minimizes operating costs, meaning less energy and fewer resources during the use phase [28]. On the consumption side, as the user pays for access rather than ownership, they are incentivized to decrease the number of uses [28] and also to ensure that the level of service corresponds with the actual need. Studies where the environmental benefits of CE have been quantified are limited in number, particularly in the B2C domain. One example [29] concluded that the rental business model in the home-use water purifier market is more environmentally friendly than the conventional one-off sales model in terms of the impact on global warming, while the conventional model shows lower abiotic resource depletion.
Despite the significant and environmentally encouraging literature about CE, there are several theoretical papers discussing the potential environmental limitations of CE. Those papers argue that a shift from products to services cannot be assumed to bring environmental benefits automatically [28,30]. Zink and Geyer (2017) present the concept of CE rebound, which occurs in a situation where CE activities partially or fully offset their benefits [31]. In the case of reduced ownership, this could happen in the form of a user achieving cost savings via optimizing product usage and then allocating the saved money to activities that partially or fully offset the environmental benefits, for example. In addition, lower upfront costs and reduced risk levels might encourage more users to use the product instead of the more environmentally friendly alternative they used earlier (e.g., switching from using a bicycle to car sharing).
Based on the literature, however, it appears that the concept has been insufficiently contested empirically, and this paper demonstrates one method for how this can be addressed. In addition, the focus seems to have predominantly been on the production side of the production–consumption system. The actual behavior of consumers in service-dominant environments has not gained as much attention. It seems that the environmental benefits of moving from ownership to services has mostly been based on theoretical concepts or just taken for granted in the literature. The paper positions itself as offering a step forward in understanding the gaps and serious limitations of the circular economy. Similarly, the paper is limited in its evaluation of the implication of monetary consumption and therefore leaves many other aspects of CE out of its scope.
The purpose of this study is to use empirical data to evaluate the influence of reduced ownership on environmental impacts, particularly consumer carbon and material footprints. We use the carbon footprint (CF) as an environmental indicator due to its high importance on the environmental agenda. Similarly, the CF of consumers has been studied extensively and good data is available based on household budget surveys that are regularly collected in many countries [32,33,34,35,36,37,38]. We also use the material footprint (MF) because of its particular interest for CE, as it is often suggested that the approach reduces material flows. However, it is important to note that MF is still not such a well-established environmental indicator as CF. MF treats all natural resources similarly and adds them up as total mass. In the study, we use the total material consumption (TMC) as the measure of the material footprint. This includes direct material input and hidden flows, meaning transformed or moved natural resources that are not directly used by an economy [39,40].
Interestingly, we found that reduced ownership, as suggested by many CE papers, does not automatically reduce the environmental impact of a production–consumption system. Reduced ownership did not have any influence on MF, and in the case of CF, it had only a mild positive implication in low-income households. In the case of positive CF implications in low-income households, the explaining factor seems to be that the consumers have to make a trade-off between investing in better housing conditions or owning and driving a car, in which case car ownership implies higher emissions. However, in other income classes, as there are no acute household budget constraints, it seems that reduced ownership goes together with consumption of carbon-intensive services, such as vacation travel. At the same time, households with high ownership of products and assets seem to invest voluntarily in energy-efficient housing and vehicles, which in turn reduces emissions on those carbon-intensive categories, and simultaneously reduces consumption and emissions in other categories.
The paper is divided into four chapters. Following this introduction, Section 2 describes the empirical data and methods used to answer the research question. Section 3 presents the results for both descriptive and statistical analysis. Finally, Section 4 provides the discussion of the results and relates it to the existing literature.

2. Materials and Methods

2.1. Materials

The main research material of the study is Statistics Finland’s 2012 Household Budget Survey [41], which is considered good-quality data in the methodical context of the study (see Section 2.2). At the same time, it is important to note here that since CE is a relatively new concept, with its origins from just a decade ago, the data cannot directly address the most recent development of CE. On the other hand, many of the basic principles of CE (e.g., closing industrial loops, servitization), which are the focus of this study, date back to the 1990s and thus have had ample time to be included in the service offerings and consumption patterns of households.
The survey includes detailed data on household expenditure and sociodemographic background information. We use the data to divide consumers into two groups based on their level of ownership. We define two groups: owners and sharers. The independent variables available in the household budget survey that we use to measure the level of ownership are the ownership of a dwelling, heating system, and car. In the case of heating, we consider district heating as shared heating. We selected these three variables to describe ownership in the study, since they all contribute significantly to household carbon footprints.
One problem in studying the impact of ownership regarding environmental footprints is that the ownership correlates strongly with income, and income is the main driver of consumption-based footprints. Thus, we controlled for income in the study using four measures:
(1)
We split all households into income deciles and observed the level of ownership in each income decile.
(2)
We excluded the three highest income deciles from the study, because there are very few households that have high income and low ownership levels. Similarly, we dropped the lowest income decile to keep the income levels of the compared groups similar (the sharers dominate the lowest income decile).
(3)
We divided the households with a sufficient amount of both owners and sharers into two income groups based on household income deciles: a low-income group and middle-income group.
(4)
We used regression analysis to control for income, household size, and age within the studied two income groups.
Table 1 presents the studied groups and sample sizes. As it shows, the sharer households own no dwelling, car, or heating systems (they have district heating). The high ownership group includes all other households, meaning that they have at least one of the items that describe ownership in the study.

2.2. Carbon and Material Footprint Assessments

In the study, we use environmentally extended input–output (EE IO) analysis and hybrid LCA to calculate the carbon and material footprints of consumers. EE IO analysis is an established environmental assessment method to estimate the environmental impacts caused by consumption and other economic activities [42,43,44,45]. The method is based on environmentally extended economic input–output tables, developed by Leontief in 1970 [46]. The input–output tables present monetary transaction matrices of economic sectors, and environmental extension means satellite accounts that display the environmental impacts of the sectors. While most official environmental accounting methods use production-based sectoral emissions, EE IO analysis can be used to account for the consumption-based life cycle emissions of different sectors or commodity categories. The main strength of the method is its comprehensiveness. While traditional bottom-up LCA suffers from truncation error, EE IO analysis does not [42,47,48]. However, EE IO analysis has other downsides: The method is relatively rough, depending on the level of aggregation of the model. In addition, it involves an inherent assumption of the linearity of prices (i.e., 1 euro spent on an economic sector always causes the same amount of emissions). Due to the above issues, hybrid LCA has been suggested as a method that could combine the best sides of both EE IO analysis and the more traditional process LCA [42]. In hybrid LCA, either process LCA data is integrated into the EE IO model or vice versa.
The material footprints of the study were calculated with a pure EE IO analysis and the carbon footprints with a more accurate hybrid LCA method. We used the EE IO model of the Finnish economy, called ENVIMAT [39,49], as the basis of our models. The ENVIMAT model, created by the Finnish Environment Institute, includes 50 commodity categories. Since both the ENVIMAT model and our main data, the 2012 Household Budget Survey, use COICOP (Classification of individual consumption by purpose) categories to classify consumption, the fit between the model and the data is perfect. However, we used commodity category-specific inflation coefficients to modify the expenditure data, since the base year of the ENVIMAT model is 2005.
As mentioned above, we used the hybrid LCA approach in the case of carbon footprints. To put it briefly, we assessed the GHG emissions of housing energy and car use more accurately by integrating process LCA data into the EE IO model. These two consumption categories comprise a large share of total carbon footprints, and there is high-quality process LCA data available. For more details on the hybrid LCA carbon footprint model, see [37].
The material footprint model is described in detail by Ottelin et al. in [40]. As mentioned in the introduction, we use TMC as the material footprint in the study. Generally, TMC is the total material requirements (TMR) minus TMR of exports. However, our approach to assessing TMC is slightly different. The ENVIMAT model directly provides the material intensities for the 50 commodity categories of the model (Seppälä et al. 2009). Thus, we simply multiplied the inflation-corrected expenditure data with the material intensities to assess the TMC of household consumption. We excluded public consumption, since the aim of the study is to examine how ownership affects household consumption and related environmental impacts.
It should be noted that we avoid the common error of EE IO models concerning rentals and imputed rentals in our carbon and material footprint models. In our models, we have excluded the maintenance charges and rents in the household budget survey, and used the statistics on the financial statement from the housing companies instead [50]. It is likely that the rentals do not directly reflect environmental impacts, whereas the average expenses of housing companies give a more accurate estimate of energy usage per square meter, for example. Statistics Finland’s Household Budget Survey includes information on the building type and age and the living space. Since the statistics on housing companies are building type- and age-specific as well, we get a relatively accurate estimate of the actual maintenance costs and energy consumption of the buildings where the respondents live. In addition, we have added GHG emissions and TMC induced by construction. We use the following estimates for the construction-phase environmental impacts: 0.7 CO2-eq t/m2 [51] and TMC 6.4 t/m2 [40]. The square meters refer to the living space.

3. Results: Environmental Benefits of Reduced Ownership

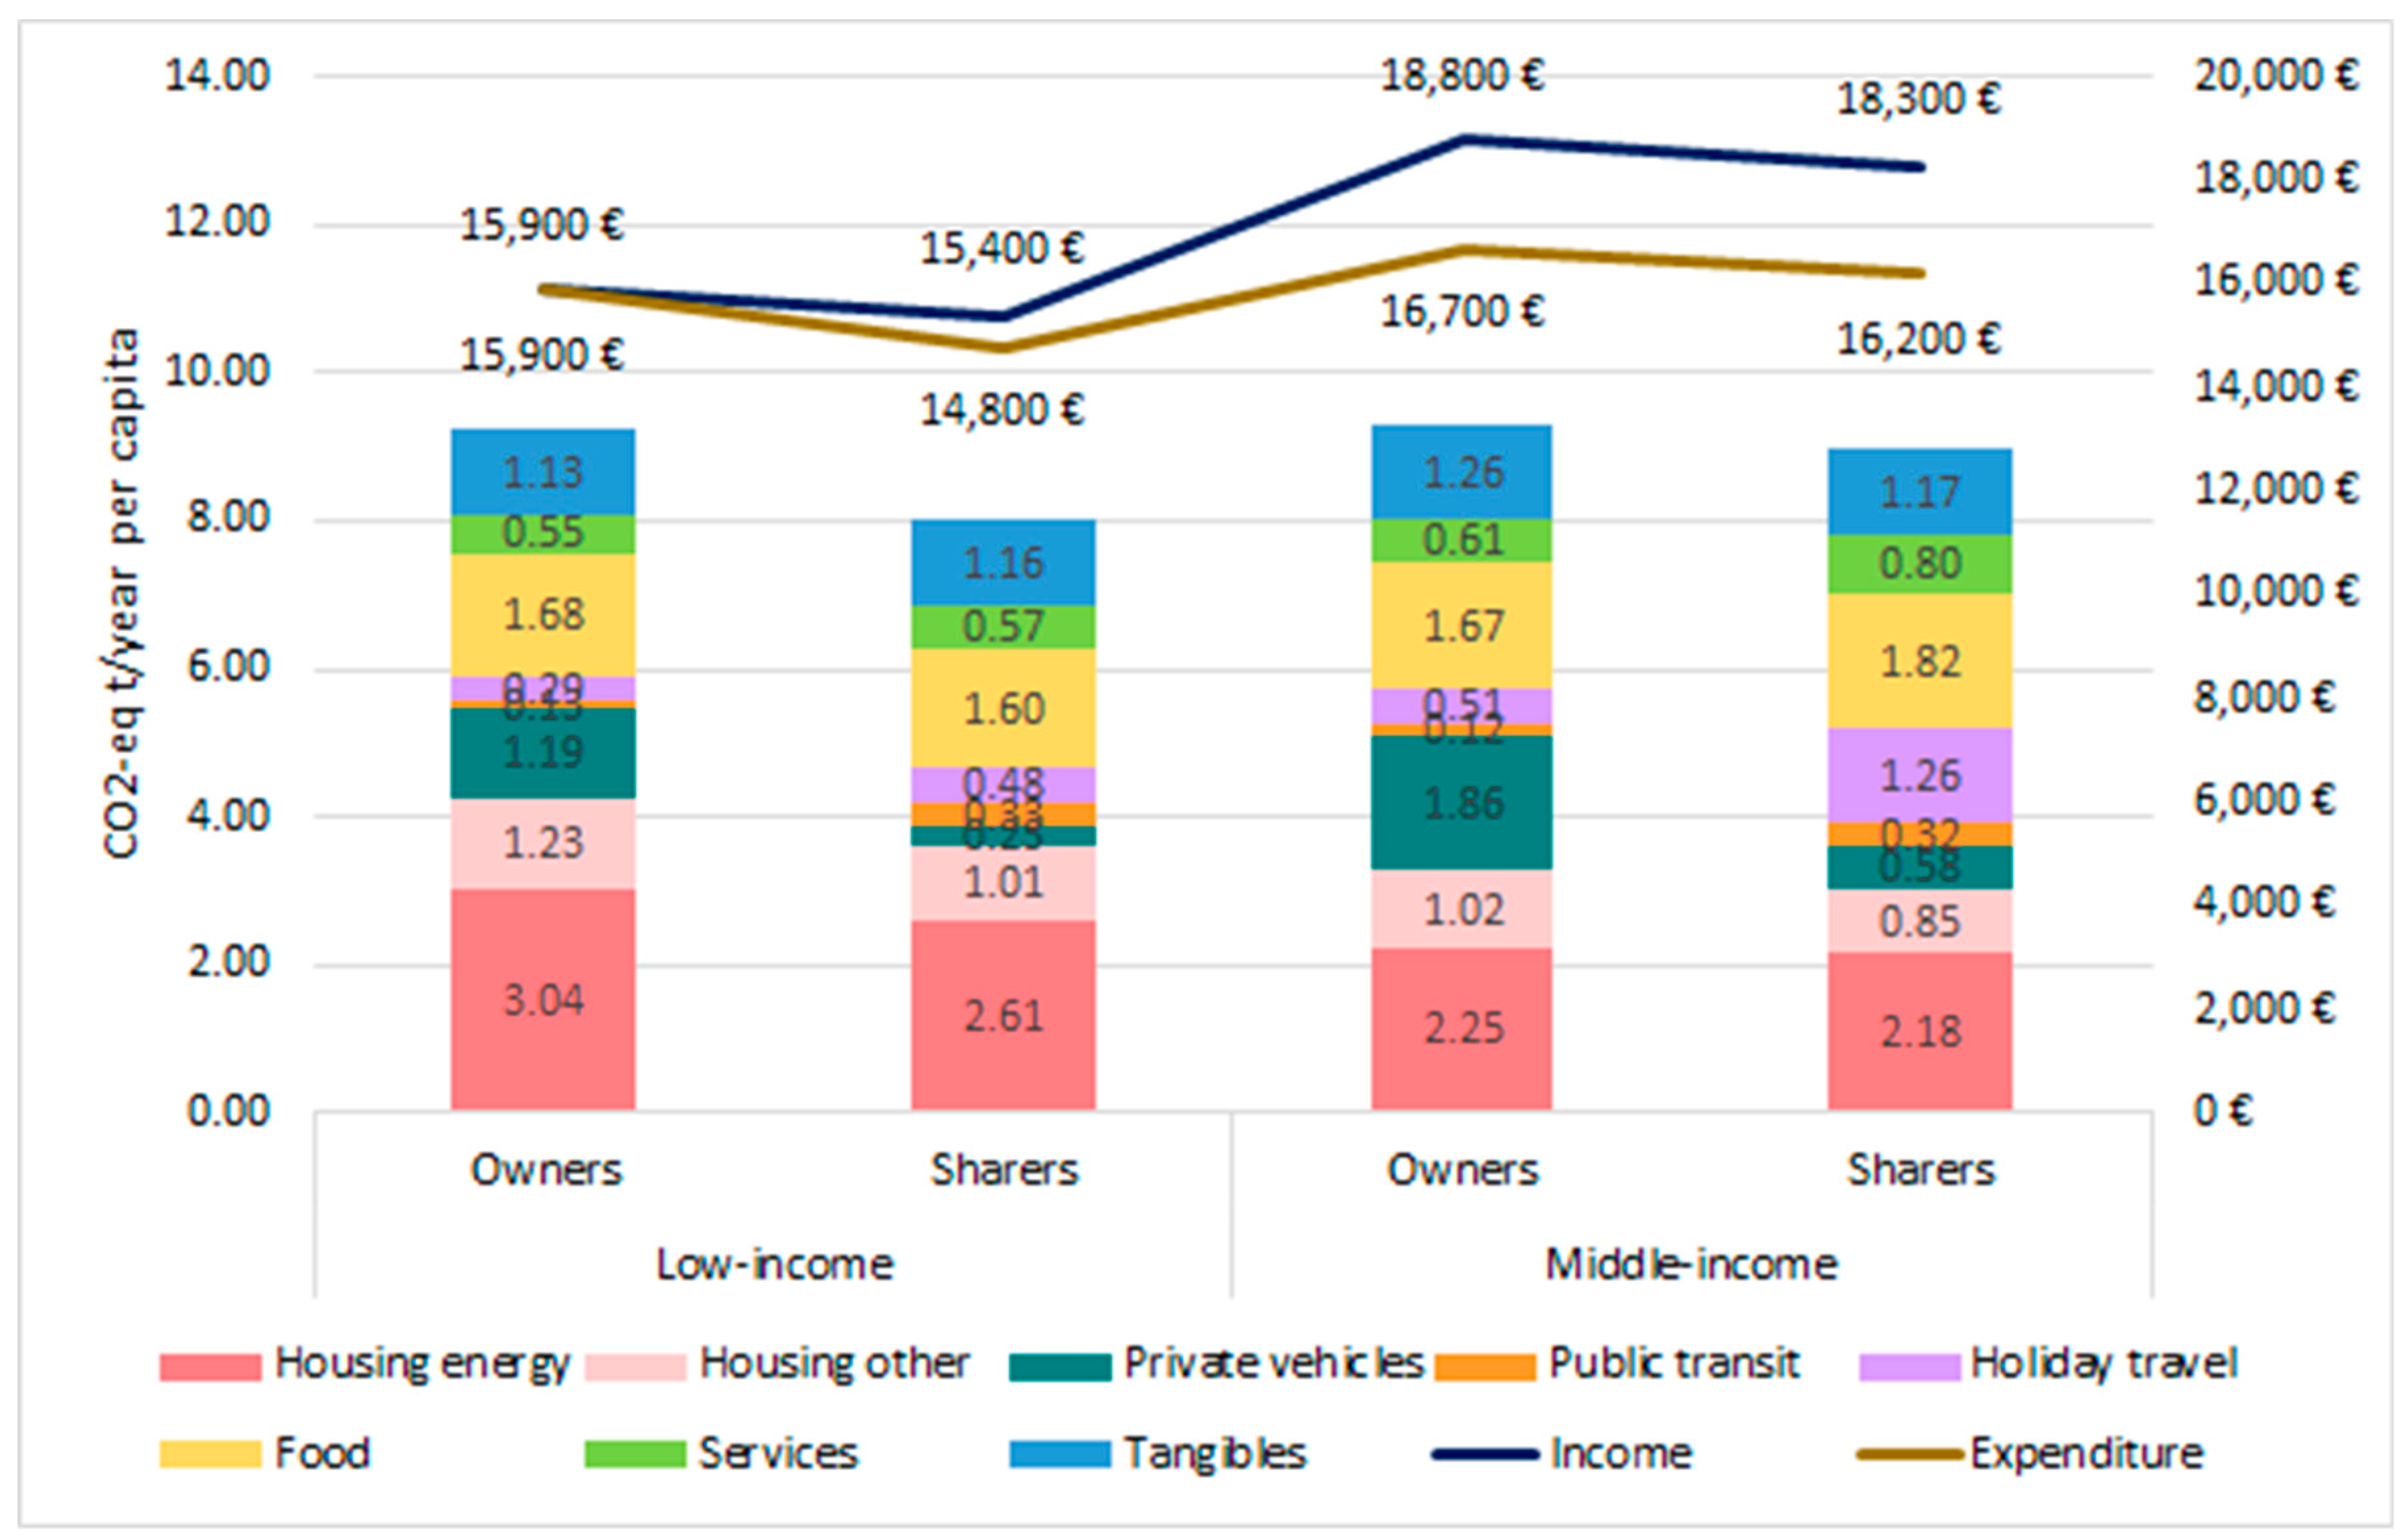
3.1. Carbon Footprint

We found that the consumption pattern of reduced ownership decreases the carbon footprint of low-income but not middle-income households. As Figure 1 illustrates, the low-income sharers have a lower carbon footprint per capita than the low-income owners. However, in the middle-income group, hardly any difference exists between the two; the small difference seems to be explained by the lower income level of the sharers. For comparison, the average income and carbon footprint per person are around €15,800 and 8.9 CO2-eq tons for low-income households (income deciles 1–2), €18,800 and 9.3 tons for middle-income households (income deciles 3–6), and €23,000 and 9.8 tons for the high-income group (income deciles 7–9), respectively. The high-income group was excluded from the analysis due to the insufficient amount of sharer households.
The low-income sharers have the lowest carbon footprint of all the groups, which is mostly due to the reduced emissions from private vehicles and partly from housing energy categories. The low-income owners have clearly higher carbon footprints, equaling that of the middle-income groups. This is due to the high emissions from housing and private vehicle categories. The relatively high emissions are also explained by small household size, and probably also to some extent by the maintenance backlog in energy efficiency investments in housing energy systems [52]. It is also noticeable that the low-income owners use all their income on consumption, whereas the low-income sharers save some 4% of their income. In the middle-income households, the saving ratio is higher again, approximately 11% among both sharers and owners.
Among middle-income households, there is no noticeable difference between sharers and owners in terms of their carbon footprints. The owners have clearly higher emissions in private vehicle category, but the sharers have higher emissions from the vacation travel and public transit categories, which alone almost compensates for the lower emissions from the private vehicle category. Interestingly, the housing energy footprint is systematically lower in middle-income groups than low-income groups. This is due to the larger number of household members in the middle-income group, which supports intrahousehold sharing of housing assets [38], but is partly also due to the better energy and carbon efficiency of the housing energy category. When comparing emissions between owners and sharers in both income groups, the data brings up another interesting finding: the owners in both low- and middle-income groups have an average of 1.4 times more living space per person than sharers, but only some 1.2 times greater carbon footprint of living, which would imply higher carbon efficiency of housing energy among owners.
The carbon intensity of different groups (emissions per euro of income) produce important results: the intensity is highest in the low-income owners group (0.58 CO2-eq t/€), followed by low-income sharers (0.52), and finally, both the middle-income groups share the lowest carbon intensity (0.49). The low intensity of middle-income groups is mainly due to two issues: first, the intrahousehold sharing effect already mentioned earlier, where some carbon-intensive assets, such as housing, are shared between household members; and second, the growing income and the subsequent consumption is partly attributed to less carbon-intensive consumption and savings in the middle-income households. The highest carbon intensity among the low-income owners group is again due to the higher emissions of carbon-intensive private vehicles and housing energy categories, as well as the lowest savings level.

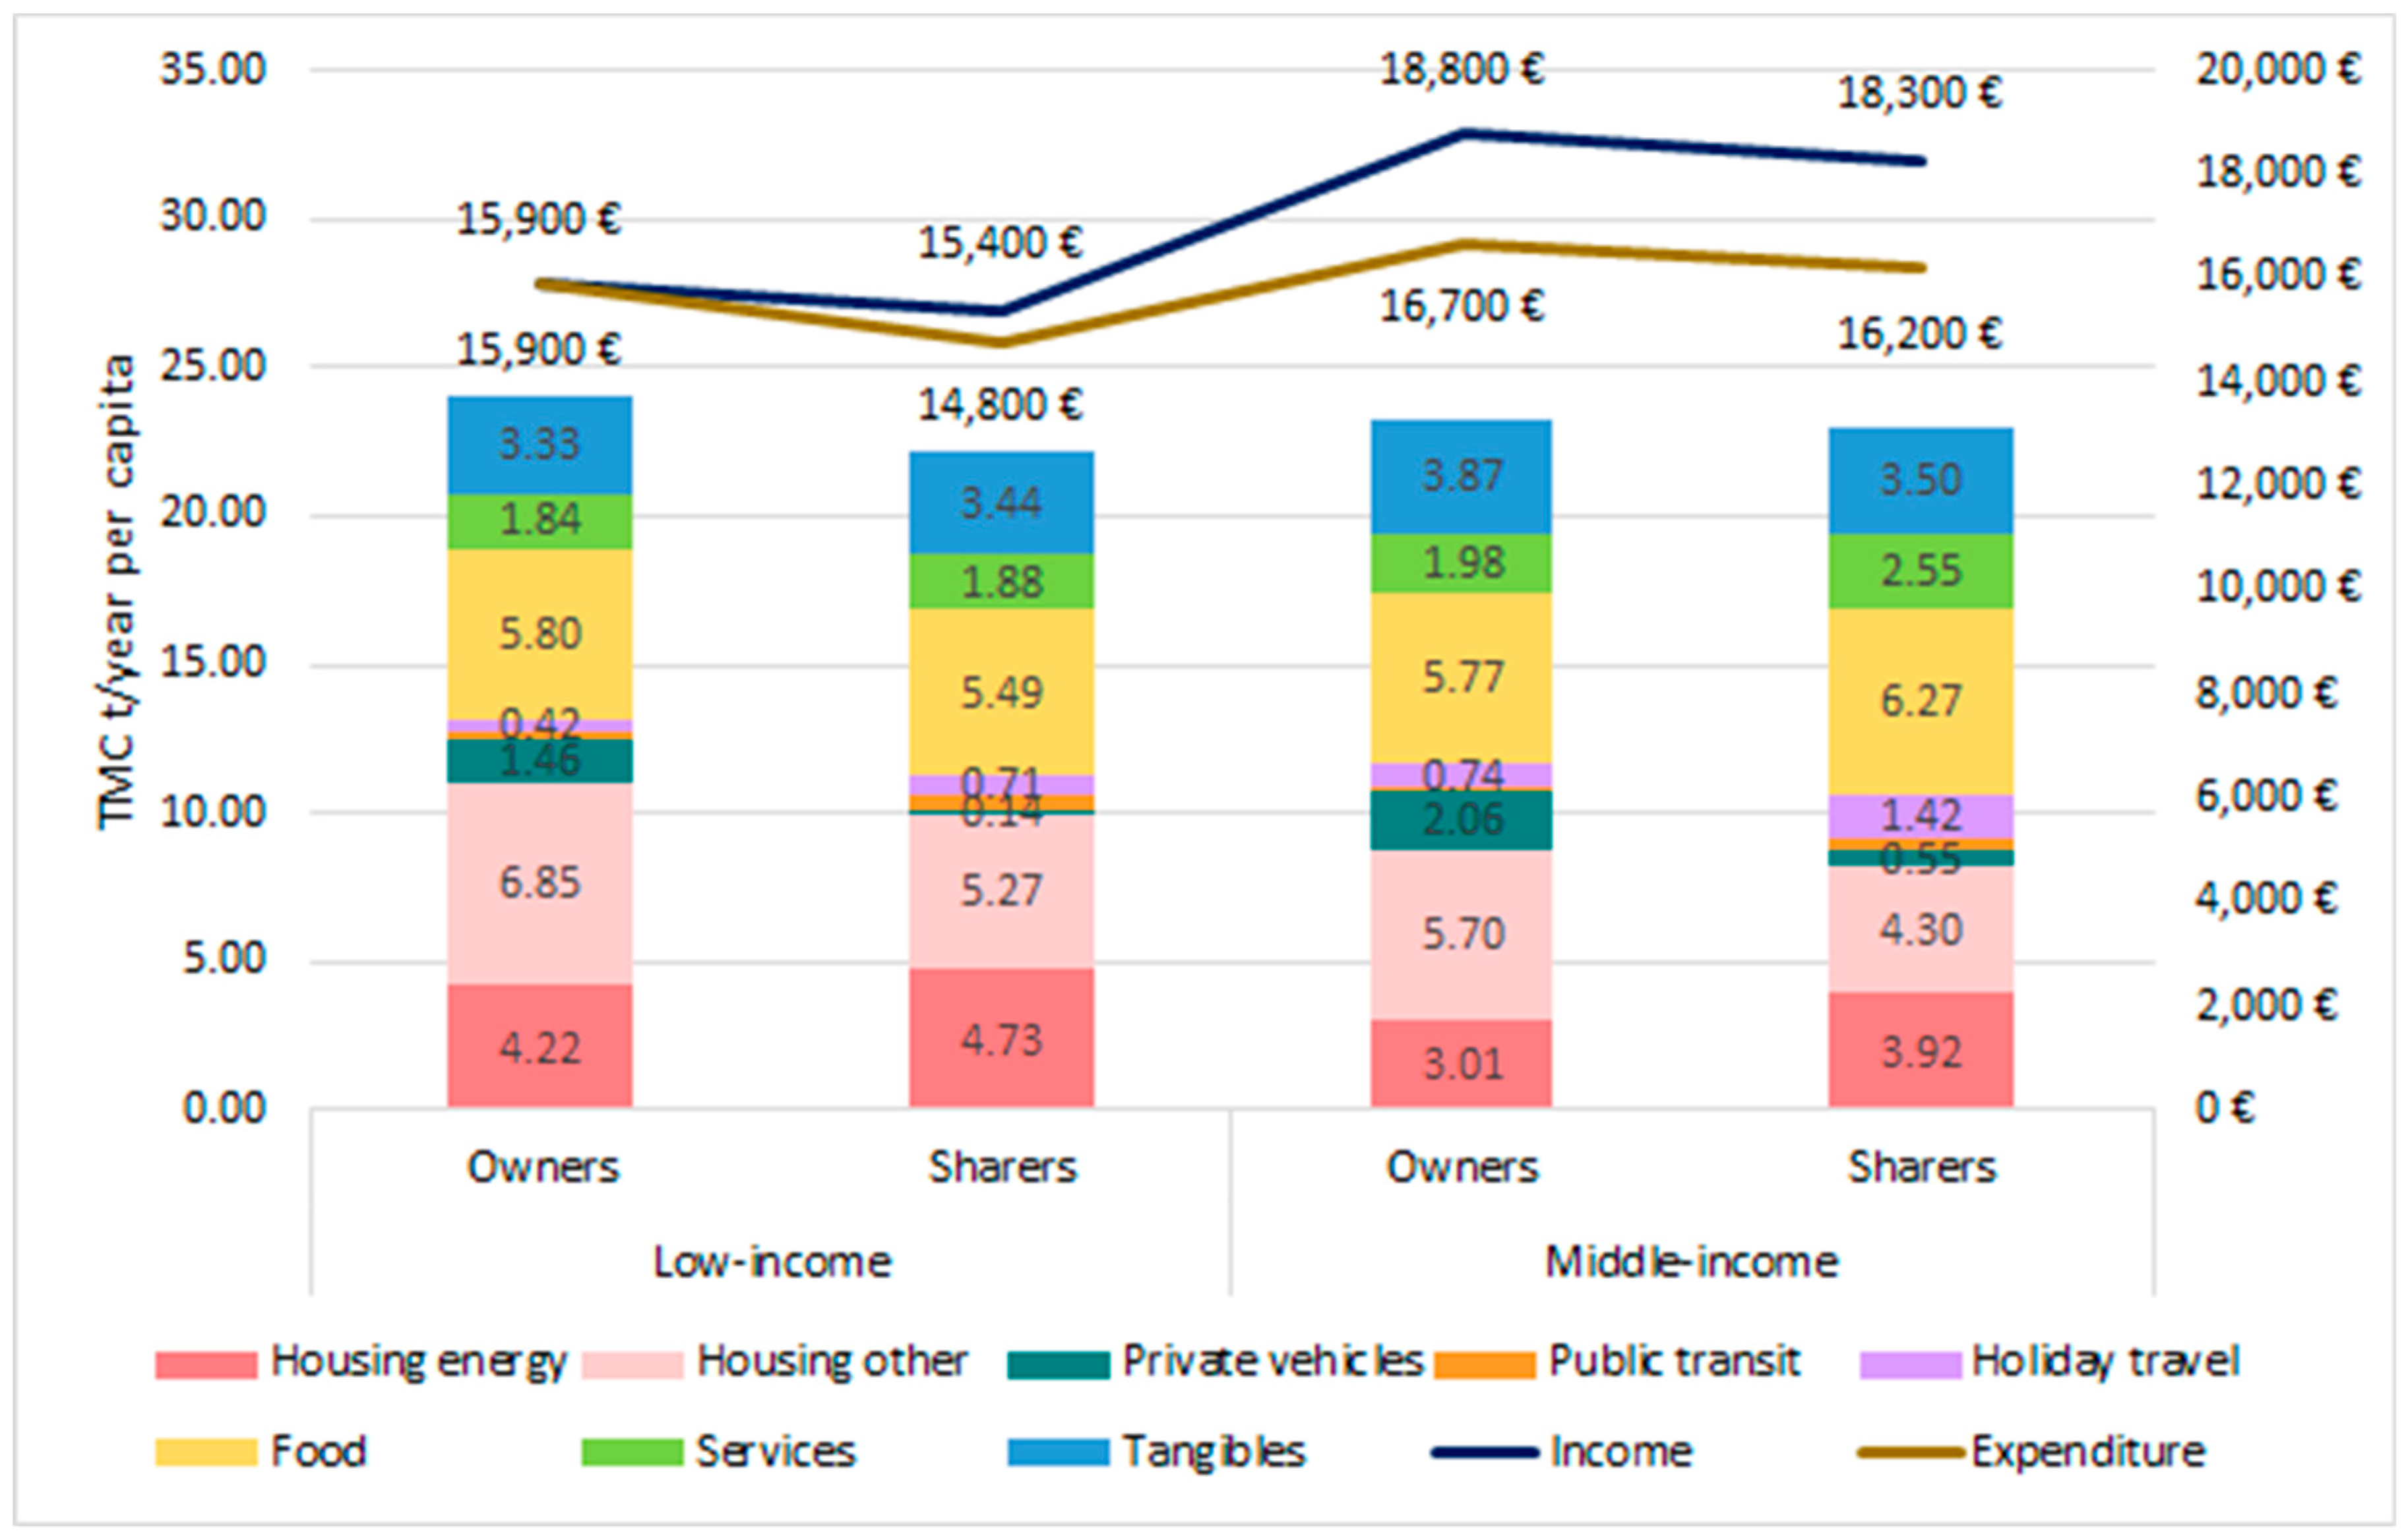
3.2. Material Footprint

The material footprint comparison for sharers and owners produce relatively similar but weaker results for carbon footprint assessment, as illustrated in Figure 2. The consumption pattern of higher sharing and lower ownership mildly reduces the material footprint of low-income households, but not that of middle-income households.
It is also interesting to compare the results between MF and CF across the studied consumption categories. The relative importance of housing energy is decreased significantly, and on the other hand, the share of the “housing other” category, meaning mostly construction, increases. Similarly, the share of food increases in all households when moving from the CF to the MF indicator. At the same time, the private vehicles and vacation travel categories reduce in importance. As a general rule, CF grows in significance when energy and fuel is affiliated directly to the category, whereas MF is highest for material-intensive categories, such as construction.

3.3. Results of Regression Analysis

While Figure 1 and Figure 2 illustrate the impact of reduced ownership on household carbon and material footprints well, we conducted regression analyses in order to help interpret the results from the environmental impact calculations above. We controlled for income, household size, and age of the respondent, since these have been found to be the main drivers of consumption-based footprints [53,54]. Table 2 presents the results of the regression analysis. In Table 2, “sharers” is a dummy variable compared to the owners group.
As Table 2 reveals, reduced ownership affects CF statistically significantly only in the low-income group, and MF not at all. The result is in concordance with Figure 1 and Figure 2. In the low-income group, sharers have an 11% lower carbon footprint than owners when income, household size, and age are controlled for.
Looking at the other independent variables, household size reduces CF and MF in the middle-income group. In addition, seniors have lower footprints than other households in this income group, whereas young adults do not have statistically significantly different footprints compared to others. In the low-income group, there are very few households with more than two people, which explains why household size does not have a statistically significant impact on footprints within the group. There is no clear explanation as to why age does not seem to affect the low-income group. One reason could be that the emissions of housing energy are emphasized at lower income levels, and seniors have a larger living space per person than others on average.

4. Discussion and Conclusions

The circular economy has become a popular new concept, suggesting economic growth with lower emissions and reduced ownership as some of its key parameters. Based on the literature, however, it appears that the concept has not been sufficiently contested empirically. This study evaluates the carbon and material footprint implications of reduced ownership in the context of households. We found that reduced ownership as a feature of CE alone does not automatically reduce the environmental impact of a production–consumption system. The reduced ownership in the study did not have any influence on MF, and in the case of CF, it had only a mildly positive influence in low-income households.
The result is surprising, since both intuitively as well as based on CE literature, moving from ownership to services and access to the functions that products provide should increase resource efficiency and reduce environmental impact. Indeed, at the subsystem level, reduced ownership seems to decrease environmental impact. One good practical example of the result at the subsystem level is the CF of private vehicle usage. Households that do not own cars have substantially lower emissions than the rest of the households. They still use private vehicles, but as the result shows, CF is substantially lower with sharers due to less driven kilometers and the lack of capital expenditure on the vehicles. This clearly shows the benefits of CE at the subsystem level and it is convergent with the findings of Camacho-Otero et al. (2018) that most CE studies focus on specific solutions instead of dealing with the issue at the whole system level [55].
However, at the whole system level, the CF and MF of households are similar. There seem to be other factors overriding the subsystem benefits of reduced ownership. This overall finding is very close to what Kjaer et al. (2016) suggest as the “user behavior” and “complexity of system” challenges in environmental evaluations of PSS developments [21]. Nevertheless, the current study tries to overcome two of the major limitations proposed by their study by using ex-poste assessment with a specific focus on user behavior in the B2C context.
Interestingly, Agrawal and Bellos (2017) argue that although the service business models in general are not automatically environmentally superior, in the specific case of products where the majority of the environmental impact occurs in the use phase, environmental superiority occurs [28]. In our study, all the reduced ownership indicators (housing, heating, and car ownership) should fall into that category, but still, the environmental superiority does not seem to hold.
In the literature, a few papers attempt to explain the potential drawbacks of CE models. In order to avoid the risk of relative environmental superiority of products and business models, Kjaer et al. (2018) have suggested a two-step strategy from relative to absolute resource decoupling in the context of PSS and CE [19]. They have three requirements for absolute resource decoupling: “ensure net resource reduction, avoid burden shifting between life cycle stages, and mitigate rebound effects”. The implication of the latter two requirements can also be identified in our results. In our empirical setting, the environmental burden in renting was shifted from investment to use and the rebound effects seem to explain some of the environmental drawbacks of reduced ownership quite well.
Zink and Geyer (2017) present the concept of CE rebound, which occurs in a situation where CE activities partially or fully offset their benefits [31]. In our study, the CE rebound seems to clarify some of the negative impacts quite well: the households seem to consume the money they save from reduced ownership on carbon-intensive services. In particular, the mechanism of allocating the saved money to activities that offset the environmental benefits seem to be evident in the travel behavior of the middle-income households in the study. The results here systematically show that car-free households allocate more money to vacation travel, which offsets the benefits of giving up a car [56,57].
However, the other rebound effect suggested by Zink and Geyer, namely lower upfront costs encouraging more consumption, does not show in our data. In the case of housing, the living space of sharer households is significantly less than that of owners. It seems that the sharer households favor location to living space, which actually supports the positive hypothesis of CE where users are incentivized to select the most suitable service and to ensure that the level of service corresponds with the actual need [28].
The result also predicts a new type of CE rebound related to products with long life cycles, such as buildings. It seems that owner-occupiers are more willing to invest in the life cycle performance of these products. This makes sense since tenants typically only compare the rental levels, while companies, on the other hand, invest and buy only if the required internal rate of return is achieved. The owner-occupiers, who pay the operational costs directly, typically evaluate profitability via a simple payback period and thus benefit more from the life cycle performance. The life cycle rebound is represented in the housing category as a higher housing energy carbon footprint per square meter for the sharers. It seems that the owners invest more in the life cycle performance, namely energy efficiency, of their premises, which reduces the CF. A similar life cycle rebound phenomenon is also reported elsewhere in the carbon and energy efficiency literature [37,57,58]. Overall, the results suggest that owner-occupiers value housing category consumption as an important part of their lifestyle and are therefore willing to invest time and money into housing quality. At the same time, the tenant households seem to focus their interest on other consumption categories. Our results imply that tenants, and sharers in general, are prone to spending more money on services and particularly leisure travel than their owner counterparts.
When interpreting the results, it is also important to note the difference between the results of low-income and middle-income households. In the middle-income households, the rebound effect seems to be stronger. The regression analysis showed that the CF of middle-income households did not see any statistically significant difference in environmental performance, unlike the low-income households. It is clear that monetary constraints are not as strong in middle-income households, which allow relaxed consumption choices and stronger rebound. It is important to recognize this in the context of CE, since the goal of CE is also to build economic capital. If the phenomenon of increased income reinforcing the rebound effects holds at more general levels, the CE creates a systemic mechanism that reduces its original benefits.
Another implication of monetary constraints is the higher carbon intensity of low-income households. The majority of their income is allocated to the relatively carbon-intensive activities of housing and mobility, which again are closely related to the basic needs of the households. On such occasions, freedom of choice is relatively limited. This emphasizes the responsibility of the supply side of the production–consumption system in low-income markets. This could promote a new concept of basic-needs-as-a-service thinking for climate mitigation among low-income families, where the required services are provided with good environmental performance for lease at a reasonable price.
The study has some limitations to consider. First, the data, although relatively recent, was collected at a time when CE was not widely recognized in Finland. It might be that the services in CE are not “standard” services, but are environmentally improved with closed loops in both material and energy usage, and that consumers are willing to pay extra for these CE service features today. This would reduce the negative rebound identified in the results. The results may also be country-specific. For example, a recent study from US did not find severe rebounds for sharing [59]. Secondly, the reduced ownership in the study was identified based on the existing categories of standard IO tables from national accounting. To study CE in detail, it would be important to be able to separate CE services from other services in consumption data and IO tables. Third, the data from the most affluent consumers could not be included due to the lack of sharers. In the future, it would be very useful to understand the consumption behavior of these affluent consumers. They tend to have the highest personal environmental footprint, and play a key role in strategic decisions in society. Finally, the cost of energy is still relatively low compared to the investments required to reduce it. This makes investment decisions difficult for commercial service operators, whereas consumers can freely choose more energy-efficient investments. However, in a future with rising energy prices, the commercial service providers could efficiently invest in energy conservation and thus reduce the environmental footprint of their service products. Similarly, the use of renewable energy will also become highly important in terms of the production of CE services. As soon as consumers are willing to pay more for renewable energy investments, both the environmental footprint of those services and the CE rebound will start to decrease, simultaneously.
The implication of the result is that a society that shifts to renting everything (in the current context) makes little difference in terms of reducing environmental pressure. At low-income levels, sharing and renting services automatically seem to reduce environmental impact, but as soon as income levels start to rise, the rebound effect and voluntary private energy efficiency investments seem to override the environmental benefits of standard services. This further emphasizes the systemic nature of the production–consumption system. As CE hopes to reduce the environmental impact of economies by renting services, it should emphasize a simultaneous change on both the production and consumption sides of the system by offering environmentally friendly service products and developing favorable conditions for sharing, and not just by encouraging the rental of current products.

Author Contributions

S.J. initiated the study and wrote most of the paper. J.O. conducted the calculations and wrote parts of the method and results sections. L.L. contributed to theory development and literature review and wrote most of the introduction.

Funding

This research received no external funding.

Conflicts of Interest

The authors declare no conflicts of interest.

References

  1. European Commission (COM). Towards a circular economy: A zero waste programme for Europe. In Communication from the Commission to the European Parliament; Council, the European Economic and Social Committee and the Committee of the Regions: Brussels, Belgium, 2014. [Google Scholar]
  2. Ellen MacArthur Foundation (EMAF). Towards the Circular Economy; EMAF: London, UK, 2013. [Google Scholar]
  3. Bakker, P. Available online: https://www.circularity-gap.world/ (accessed on 3 May 2018).
  4. Prieto-Sandoval, V.; Jaca, C.; Ormazabal, M. Towards a consensus on the circular economy. J. Clean. Prod. 2018, 179, 605–615. [Google Scholar] [CrossRef]
  5. Ramani, K.; Ramanujan, D.; Bernstein, W.Z.; Zhao, F.; Sutherland, J.; Handwerker, C.; Choi, J.-K.; Kim, H.; Thurston, D. Integrated sustainable life cycle design: A review. J. Mech. Des. 2010, 132, 091004. [Google Scholar] [CrossRef]
  6. Bakker, C.; Wang, F.; Huisman, J.; Den Hollander, M. Products that go round: Exploring product life extension through design. J. Clean. Prod. 2014, 69, 10–16. [Google Scholar] [CrossRef]
  7. Ghisellini, P.; Cialani, C.; Ulgiati, S. A review on circular economy: The expected transition to a balanced interplay of environmental and economic systems. J. Clean. Prod. 2016, 114, 11–32. [Google Scholar] [CrossRef]
  8. van Loona, P.; Delagardea, C.; Van Wassenhovea, L. The role of second-hand markets in circular business: A simple model for leasing versus selling consumer products. Int. J. Prod. Res. 2017. [Google Scholar] [CrossRef]
  9. Sarkis, J.; Zhu, Q. Environmental sustainability and production: Taking the road less travelled. Int. J. Prod. Res. 2017. [Google Scholar] [CrossRef]
  10. Mayers, C.K.; France, C.M.; Cowell, S.J. Extended producer responsibility for waste electronics: An example of printer recycling in the United Kingdom. J. Ind. Ecol. 2005, 9, 169–189. [Google Scholar] [CrossRef]
  11. Xue, B.; Chen, X.P.; Geng, Y.; Guo, X.J.; Lu, C.P.; Zhang, Z.L.; Lu, C.Y. Survey of officials’ awareness on circular economy development in China: Based on municipal and county level. Resour. Conserv. Recycl. 2010, 54, 1296–1302. [Google Scholar] [CrossRef]
  12. Richter, J.L.; Koppejan, R. Extended producer responsibility for lamps in Nordic countries: Best practices and challenges in closing material loops. J. Clean. Prod. 2016, 123, 167–179. [Google Scholar] [CrossRef]
  13. Lahti, T.; Wincent, J.; Parida, V. A definition and theoretical review of the circular economy, value creation, and sustainable business models: Where are we now and where should research move in the future? Sustainability 2018, 10, 2799. [Google Scholar] [CrossRef]
  14. Tukker, A. Product services for a resource-efficient and circular economy—A review. J. Clean. Prod. 2015, 97, 76–91. [Google Scholar] [CrossRef]
  15. Korhonen, J.; Honkasalao, A.; Seppälä, J. Circular economy: The concept and its limitations. Ecol. Econ. 2018, 143, 37–46. [Google Scholar] [CrossRef]
  16. Smith, D. Power-by-the-hour: The role of technology in reshaping business strategy at Rolls-Royce. Technol. Anal. Strat. Manag. 2013, 25, 987–1007. [Google Scholar] [CrossRef]
  17. Beuren, F.; Ferreira, M.; Miguel, P. Product-service systems: A literature review on integrated products and services. J. Clean. Prod. 2013, 47, 222–231. [Google Scholar] [CrossRef]
  18. Reim, W.; Parida, V.; Örtqvist, D. Product-Service Systems (PSS) business models and tactics–a systematic literature review. J. Clean. Prod. 2015, 97, 61–75. [Google Scholar] [CrossRef]
  19. Kjaer, L.L.; Pigosso, D.C.A.; Niero, M.; Bech, N.M.; Mcaloone, T.C. Product/service-systems for a circular economy: the route to decoupling economic growth from resource consumption? J. Ind. Ecol. Early View 2018. [Google Scholar] [CrossRef]
  20. Kjaer, L.L.; Høst-Madsen, N.K.; Schmidt, J.H.; McAloone, T.C. Application of environmental input-output analysis for corporate and product environmental footprints-learnings from three case. Sustainability 2015, 7, 11438–11461. [Google Scholar] [CrossRef] [Green Version]
  21. Kjaer, L.L.; Pagoropoulos, A.; Schmidt, J.H.; McAloone, T.C. Challenges when evaluating Product/Service-Systems through Life Cycle Assessment. J. Clean. Prod. 2016, 120, 95–104. [Google Scholar] [CrossRef] [Green Version]
  22. Rashid, A.; Asif, F.M.; Krajnik, P.; Nicolescu, C. Resource conservative manufacturing. J. Clean. Prod. 2013, 57, 166–177. [Google Scholar] [CrossRef]
  23. Gutierrez, A.; Thornton, T.F. Can consumers understand sustainability through seafood eco-labels? A U.S. and UK case study. Sustainability 2014, 6, 8195–8217. [Google Scholar] [CrossRef]
  24. Jonell, M.; Crona, B.; Brown, K.; Rönnbäck, P.; Troell, M. Eco-labeled seafood: determinants for (blue) green consumption. Sustainability 2016, 8, 884. [Google Scholar] [CrossRef]
  25. Molina-Moreno, V.; Núñez-Cacho Utrilla, P.; Cortés-García, F.J.; Peña-García, A. The use of led technology and biomass to power public lighting in a local context: The case of Baeza (Spain). Energies 2018, 11, 1783. [Google Scholar] [CrossRef]
  26. Guajardo, J.; Cohen, M.; Kim, S.-H.; Netessine, S. Impact of performance-based contracting on product reliability: An empirical analysis. Manag. Sci. 2012, 58, 961–979. [Google Scholar] [CrossRef]
  27. Lieder, M.; Asif, F.; Rashid, A.; Mihelic, A.; Kotnik, S. A conjoint analysis of circular economy value propositions for consumers: Using “washing machines in Stockholm” as a case study. J. Clean. Prod. 2018, 172, 264–273. [Google Scholar] [CrossRef]
  28. Agrawal, V.; Bellos, I. The potential of servicizing as a green business model. Manag. Sci. 2017, 63, 1545–1562. [Google Scholar] [CrossRef]
  29. Chun, Y.Y.; Lee, K.M. Environmental impacts of the rental business model compared to the conventional business model: A Korean case of water purifier for home use. Int. J. Life Cycle Assess. 2017, 22, 1096–1108. [Google Scholar] [CrossRef]
  30. Mont, O. Institutionalisation of sustainable consumption patterns based on shared use. Ecol. Econ. 2004, 50, 135–153. [Google Scholar] [CrossRef]
  31. Zink, T.; Geyer, R. Circular economy rebound. J. Ind. Ecol. 2017, 21, 593–602. [Google Scholar] [CrossRef]
  32. Druckman, A.; Jackson, T. The carbon footprint of UK households 1990–2004: A socio-economically disaggregated, quasi-multi-regional input–output model. Ecol. Econ. 2009, 68, 2066–2077. [Google Scholar] [CrossRef] [Green Version]
  33. Wiedenhofer, D.; Lenzen, M.; Steinberger, J.K. Energy requirements of consumption: Urban form, climatic and socio-economic factors, rebounds and their policy implications. Energy Policy 2013, 63, 696–707. [Google Scholar] [CrossRef]
  34. Heinonen, J.; Jalas, M.; Juntunen, J.K.; Ala-Mantila, S.; Junnila, S. Situated lifestyles: I. How lifestyles change along with the level of urbanization and what the greenhouse gas implications are—A study of Finland. Environ. Res. Lett. 2013, 8, 025003. [Google Scholar] [CrossRef]
  35. Jones, C.; Kammen, D.M. Spatial distribution of US household carbon footprints reveals suburbanization undermines greenhouse gas benefits of urban population density. Environ. Sci. Technol. 2014, 48, 895–902. [Google Scholar] [CrossRef] [PubMed]
  36. Nässén, J.; Andersson, D.; Larsson, J.; Holmberg, J. Explaining the variation in greenhouse gas emissions between households: Socioeconomic, motivational, and physical factors. J. Ind. Ecol. 2015, 19, 480–489. [Google Scholar] [CrossRef]
  37. Ottelin, J.; Heinonen, J.; Junnila, S. New energy efficient housing has reduced carbon footprints in outer but not in inner urban areas. Environ. Sci. Technol. 2015, 49, 9574–9583. [Google Scholar] [CrossRef] [PubMed]
  38. Ala-Mantila, S.; Ottelin, J.; Heinonen, J.; Junnila, S. To each their own? The greenhouse gas impacts of intra-household sharing in different urban zones. J. Clean. Prod. 2016, 135, 356–367. [Google Scholar] [CrossRef]
  39. Seppälä, J.; Mäenpää, I.; Koskela, S.; Mattila, T.; Nissinen, A.; Katajajuuri, J.; Härmä, T.; Korhonen, M.; Saarinen, M.; Virtanen, Y. Suomen Kansantalouden Materiaalivirtojen Ympäristövaikutusten Arviointi ENVIMAT-Mallilla; Finnish Environment Institute: Helsinki, Finland, 2009. [Google Scholar]
  40. Ottelin, J.; Heinonen, J.; Junnila, S. Carbon and material footprints of a welfare state: Why and how governments should enhance green investments. Environ. Sci. Policy 2018, 86, 1–10. [Google Scholar] [CrossRef]
  41. Statistics Finland. Household Budget Survey; Statistics Finland: Helsinki, Finland, 2012. [Google Scholar]
  42. Suh, S.; Lenzen, M.; Treloar, G.J.; Hondo, H.; Horvath, A.; Huppes, G.; Jolliet, O.; Klann, U.; Krewitt, W.; Moriguchi, Y. System boundary selection in life-cycle inventories using hybrid approaches. Environ. Sci. Technol. 2004, 38, 657–664. [Google Scholar] [CrossRef] [PubMed]
  43. Junnila, S. Empirical comparison of process and economic input-output life cycle assessment in service industries. Environ. Sci. Technol. 2006, 40, 7070–7076. [Google Scholar] [CrossRef] [PubMed]
  44. Lenzen, M.; Murray, J.; Sack, F.; Wiedmann, T. Shared producer and consumer responsibility—Theory and practice. Ecol. Econ. 2007, 61, 27–42. [Google Scholar] [CrossRef]
  45. Wiedmann, T. Editorial: Carbon footprint and input-output analysis—An introduction. Econ. Syst. Res. 2009, 21, 175–186. [Google Scholar] [CrossRef]
  46. Leontief, W. Environmental repercussions and the economic structure: An input-output approach. Rev. Econ. Stat. 1970, 52, 262–271. [Google Scholar] [CrossRef]
  47. Hubacek, K.; Feng, K. Comparing apples and oranges: Some confusion about using and interpreting physical trade matrices versus multi-regional input–output analysis. Land Use Policy 2016, 50, 194–201. [Google Scholar] [CrossRef]
  48. Lutter, S.; Giljum, S.; Bruckner, M. A review and comparative assessment of existing approaches to calculate material footprints. Ecol. Econ. 2016, 127, 1–10. [Google Scholar] [CrossRef] [Green Version]
  49. Seppälä, J.; Mäenpää, I.; Koskela, S.; Mattila, T.; Nissinen, A.; Katajajuuri, J.; Härmä, T.; Korhonen, M.; Saarinen, M.; Virtanen, Y. An assessment of greenhouse gas emissions and material flows caused by the Finnish economy using the ENVIMAT model. J. Clean. Prod. 2011, 19, 1833–1841. [Google Scholar] [CrossRef]
  50. Statistics Finland. Finance of Housing Companies [e-Publication]; Statistics Finland: Helsinki, Finland, 2017. [Google Scholar]
  51. Säynäjoki, A.; Heinonen, J.; Junnonen, J.; Junnila, S. Input–output and process LCAs in the building sector: Are the results compatible with each other? Carbon Manag. 2017, 8, 155–166. [Google Scholar] [CrossRef]
  52. Kyrö, R.; Heinonen, J.; Säynäjoki, A.; Junnila, S. Occupants have little influence on the overall energy consumption in district heated apartment buildings. Energy Build. 2011, 43, 3484–3490. [Google Scholar]
  53. Wier, M.; Lenzen, M.; Munksgaard, J.; Smed, S. Effects of household consumption patterns on CO2 requirements. Econ. Syst. Res. 2001, 13, 259–274. [Google Scholar] [CrossRef]
  54. Ala-Mantila, S.; Heinonen, J.; Junnila, S. Relationship between urbanization, direct and indirect greenhouse gas emissions, and expenditures: A multivariate analysis. Ecol. Econ. 2014, 104, 129–139. [Google Scholar] [CrossRef]
  55. Camacho-Otero, J.; Boks, C.; Pettersen, I.N. Consumption in the circular economy: A literature review. Sustainability 2018, 10, 2758. [Google Scholar] [CrossRef]
  56. Ottelin, J.; Heinonen, J.; Junnila, S. Greenhouse gas emissions from flying can offset the gain from reduced driving in dense urban areas. J. Transp. Geogr. 2014, 41, 1–9. [Google Scholar] [CrossRef]
  57. Ottelin, J.; Heinonen, J.; Junnila, S. Rebound effect for reduced car ownership and driving. In Nordic Experiences of Sustainable Planning: Policy and Practice; Kristjansdottir, S., Ed.; Routledge: London, UK, 2017. [Google Scholar]
  58. Leth-Petersen, S.; Togeby, M. Demand for space heating in apartment blocks: Measuring effect of policy measures aiming at reducing energy consumption. Energy Econ. 2001, 23, 387–403. [Google Scholar] [CrossRef]
  59. Underwood, A.; Fremstad, A. Does sharing backfire? A decomposition of household and urban economies in CO2 emissions. Energy Policy 2018, 123, 404–413. [Google Scholar] [CrossRef]
Figure 1. The carbon footprint of owners and sharers in low- and middle-income households.
Sustainability 10 04077 g001
Figure 2. The material footprint (TMC) of owners and sharers in low- and middle-income households.
Sustainability 10 04077 g002
Table 1. Sample sizes and descriptive statistics of the studied groups.
Low IncomeMiddle Income
OwnersSharersOwnersSharers
Sample size (households)338114136475
Income deciles (0–9)1–21–23–63–6
Average income (€/year per capita)€15,900€15,400€18,800€18,300
Average expenditure (€/year per capita)€15,900€14,800€16,700€16,200
Apartment or house ownership (% of households)60%0%78%0%
District heating49%100%48%100%
Car ownership62%0%87%0%
Average household size1.21.22.01.7
Average age of respondent58475439
Table 2. Regression analysis on the impact of reduced ownership on carbon and material footprints.
Dependent Variableln (CF Per Capita)ln (MF Per Capita)
Income GroupLow IncomeMiddle IncomeLow IncomeMiddle Income
Explanatory power of the model (Prob > F = 0.000 in all models)R2 = 0.38R2 = 0.50R2 = 0.25R2 = 0.48
Coef.pCoef.pCoef.pCoef.p
ln (disposable income per capita)0.580.0000.730.0000.580.0000.630.000
Household size: 1 person (ref.)
2 people−0.150.174−0.050.236−0.150.227−0.080.030
3 people−0.260.286−0.140.034−0.220.366−0.170.003
>3 people0.010.976−0.200.017−0.020.945−0.230.002
Seniors (>64 years)−0.050.328−0.140.000−0.090.103−0.120.000
Young (<25 years)0.080.328−0.070.3620.070.281−0.010.908
Sharers−0.110.023−0.080.152−0.070.168−0.040.358
Constant3.460.0231.960.0014.440.0073.950.000
Statistically significant (p < 0.05) coefficients in bold. CF = carbon footprint. MF = material footprint (TMC).

