Article

Feasibility Study and Impact of Daylight on Illumination Control for Energy-Saving Lighting Systems

by
Sulee Bunjongjit
1 and
Atthapol Ngaopitakkul
2,*
1
Faculty of Engineering, Rajamangala University of Technology Rattanakosin, Nakhon Pathom 73170, Thailand
2
Faculty of Engineering, King Mongkut’s Institute of Technology Ladkrabang, Bangkok 10520, Thailand
*
Author to whom correspondence should be addressed.
Sustainability 2018, 10(11), 4075; https://doi.org/10.3390/su10114075
Submission received: 31 August 2018 / Revised: 26 October 2018 / Accepted: 31 October 2018 / Published: 7 November 2018
(This article belongs to the Special Issue Sustainable Lighting and Energy Saving)

Abstract

:
The main goal of energy conservation should be reducing the consumption of energy resources. Due to energy and environmental concerns in recent years, to reduce energy consumption in a lighting system, which has been one of the prime targets of energy saving, daylighting has been investigated and has become one of the energy-efficiency techniques widely applied in buildings. This paper presents an analysis of T5 fluorescent luminaire lighting control using daylight in a building. The study is conducted in two parts; simulation of a lecture room using the daylighting function of the DIALux program is performed to estimate the effect of daylighting on a task area (workplane). Another part is an experimental setup to evaluate the performance of a lighting control unit that is installed for a T5 fluorescent luminaire with a dimmable electronic ballast. The efficiency of the lighting control in term of illumination on the task area and energy consumption are also evaluated and compared with the standard case. The simulation results show that daylighting increases illuminance on a task area, especially on the window side, so the lighting system can significantly reduce its power consumption compared with a standard case (without lighting control). The experimental result shows that upon installing the lighting control with daylighting, both the average illuminance and the energy consumption in each time period are decreased compared with in the standard case. Lighting control with daylighting tries to set the average illuminance on a task area to less than 500 lux, corresponding to the amount of daylight passing through window shutters. The obtained results are useful for the design of a T5 fluorescent luminaire with lighting control using daylighting in a building lighting system for energy efficiency and reducing energy consumption, including the average illuminance on the task area, according to a relevant standard.

1. Introduction

In past decade, energy has become an important issue in many countries due to the rapid increase of population and economic growth. Considering a developing country, Thailand is changing from an agrarian country to an industrial country with a large industrial sector. Industrial countries need steady supplies of energy to support their industrial sector and ensure economic growth. Energy statistics of Thailand from the Energy Policy and Planning Office (EPPO) under Thailand’s Ministry of Energy [1,2], show that the energy demand has continuously increased. According to a study on the future energy consumption in Thailand over the next 20 years [3] under a business-as-usual (BAU) scenario, the Gross Domestic Product (GDP) will grow at annual average rate of 4.2% and the population will grow at an annual average rate of 0.3%; the energy demand during this period is forecasted to increase annually by an average of 3.9%. The energy consumption in the year 2030 will rise to 151,000 ktoe, or 2.1 times the current. Hence, greenhouse gas emissions from the energy sector will tend to increase accordingly. However, based on historical energy data [1] and a statistical review [2] as shown in Table 1, the growth of energy consumption in the business and residential sectors considerably surpassed the economic growth. The increasing usage of energy in various sectors discussed above will cause energy shortages in the near future due to the depletion of fossil fuel. To prevent energy shortages and increase the energy efficiency of the country, the government has set an objective to reduce energy usage by decreasing the energy intensity (EI) by 30% in the next 30 years according to the Energy Efficiency Plan (EEP 2015) [3].
In Thailand, lighting accounts for approximately 24% of the commercial sector’s electricity use, 8% of the residential sector use and 10% of the industrial sector use. Of this lighting energy use, approximately 70–80% is from fluorescent lighting. Fluorescent tubes have been used in Thailand for many decades, particularly in the residential sector, due to the price of energy, financial and environmental concerns of the local population and the acceptability of the light output. In addition, Government also support replacement of T8 fluorescent luminaire to T5 fluorescent luminaire with higher efficiency. The reason for LED tube types luminaire are not widely used in Thailand especially in residential sector due to price of LED tube is higher than fluorescent, this have a significant impact on customer choice. Another reason is T5 and LED provide similar lumen output and occupancy in resident sector are accustomed to feeling provide by fluorescent luminaire. Currently, Thailand is still not able to achieve its energy conservation goals for the economical and efficient production and use of energy and the production of highly efficient machinery and equipment and the materials for energy conservation within the country. Thus, the Department of Alternative Energy Development and Efficiency has issued a draft of an Energy Conservation law to identify measurements to supervise, promote and assist in minimizing energy usage.
To reduce energy usage in building lighting systems, many methods can be implemented, such as replacing older and inefficient equipment, implementing energy management technology and taking measurements to change the energy consumption behavior of occupants. One of such methodology is lighting control. Lighting controls are an integral part of a lighting system. Lighting control equipment is divided into two broad categories, on/off and dimming. Each category is subdivided into two additional categories, manual and automatic. On/off controls simply turn lights on or off, while dimming controls permit the adjustment of lighting levels over a range. Daylighting is the use of natural light to illuminate a work area instead of using artificial light that consumes electricity. Some luminaires located in a daylight area can be dimmed or closed to reduce energy consumption. This control strategy results in significant reduction of energy usage in lighting system while maintain lighting quality from natural light.
This paper proposes the design and analysis of T5 fluorescent lighting control using daylight and its performance in term of energy consumption and illuminance. The research has been divided into two parts; simulation and experiment. A lecture room with T5 fluorescent luminaires and windows that allow daylight to pass through has been investigated and simulated using the daylighting function in the DIALux program. This program was used to calculate the effect of daylighting on the workplane in terms of illuminance and energy consumption when using a T5 fluorescent luminaire without daylight (as a base case) compared with cases of various periods of time. The performance of the lighting control unit has been evaluated using an experimental setup. The system voltage, current and real power have been measured to indicate the power consumption of a T5 fluorescent luminaire and the performance of the lighting control unit. The average illuminance on the workplane has also been measured; this value is needed for a lighting control unit to set the light output according to standards [4]. The result from the experimental setup will be useful for designing and installing a daylighting system in a building to fully harvest natural light and increase the energy efficiency in a lighting system. The paper is organized as follows: The literature review of the past research in related field is presented in Section 2. Section 3 presents the simulation and illuminance results. Section 4 presents the experimental setup with the design of the test unit and result from actual field test. The discussion of result and finding are presented in Section 5. Finally, the conclusions are given in Section 6.

2. Literature Review
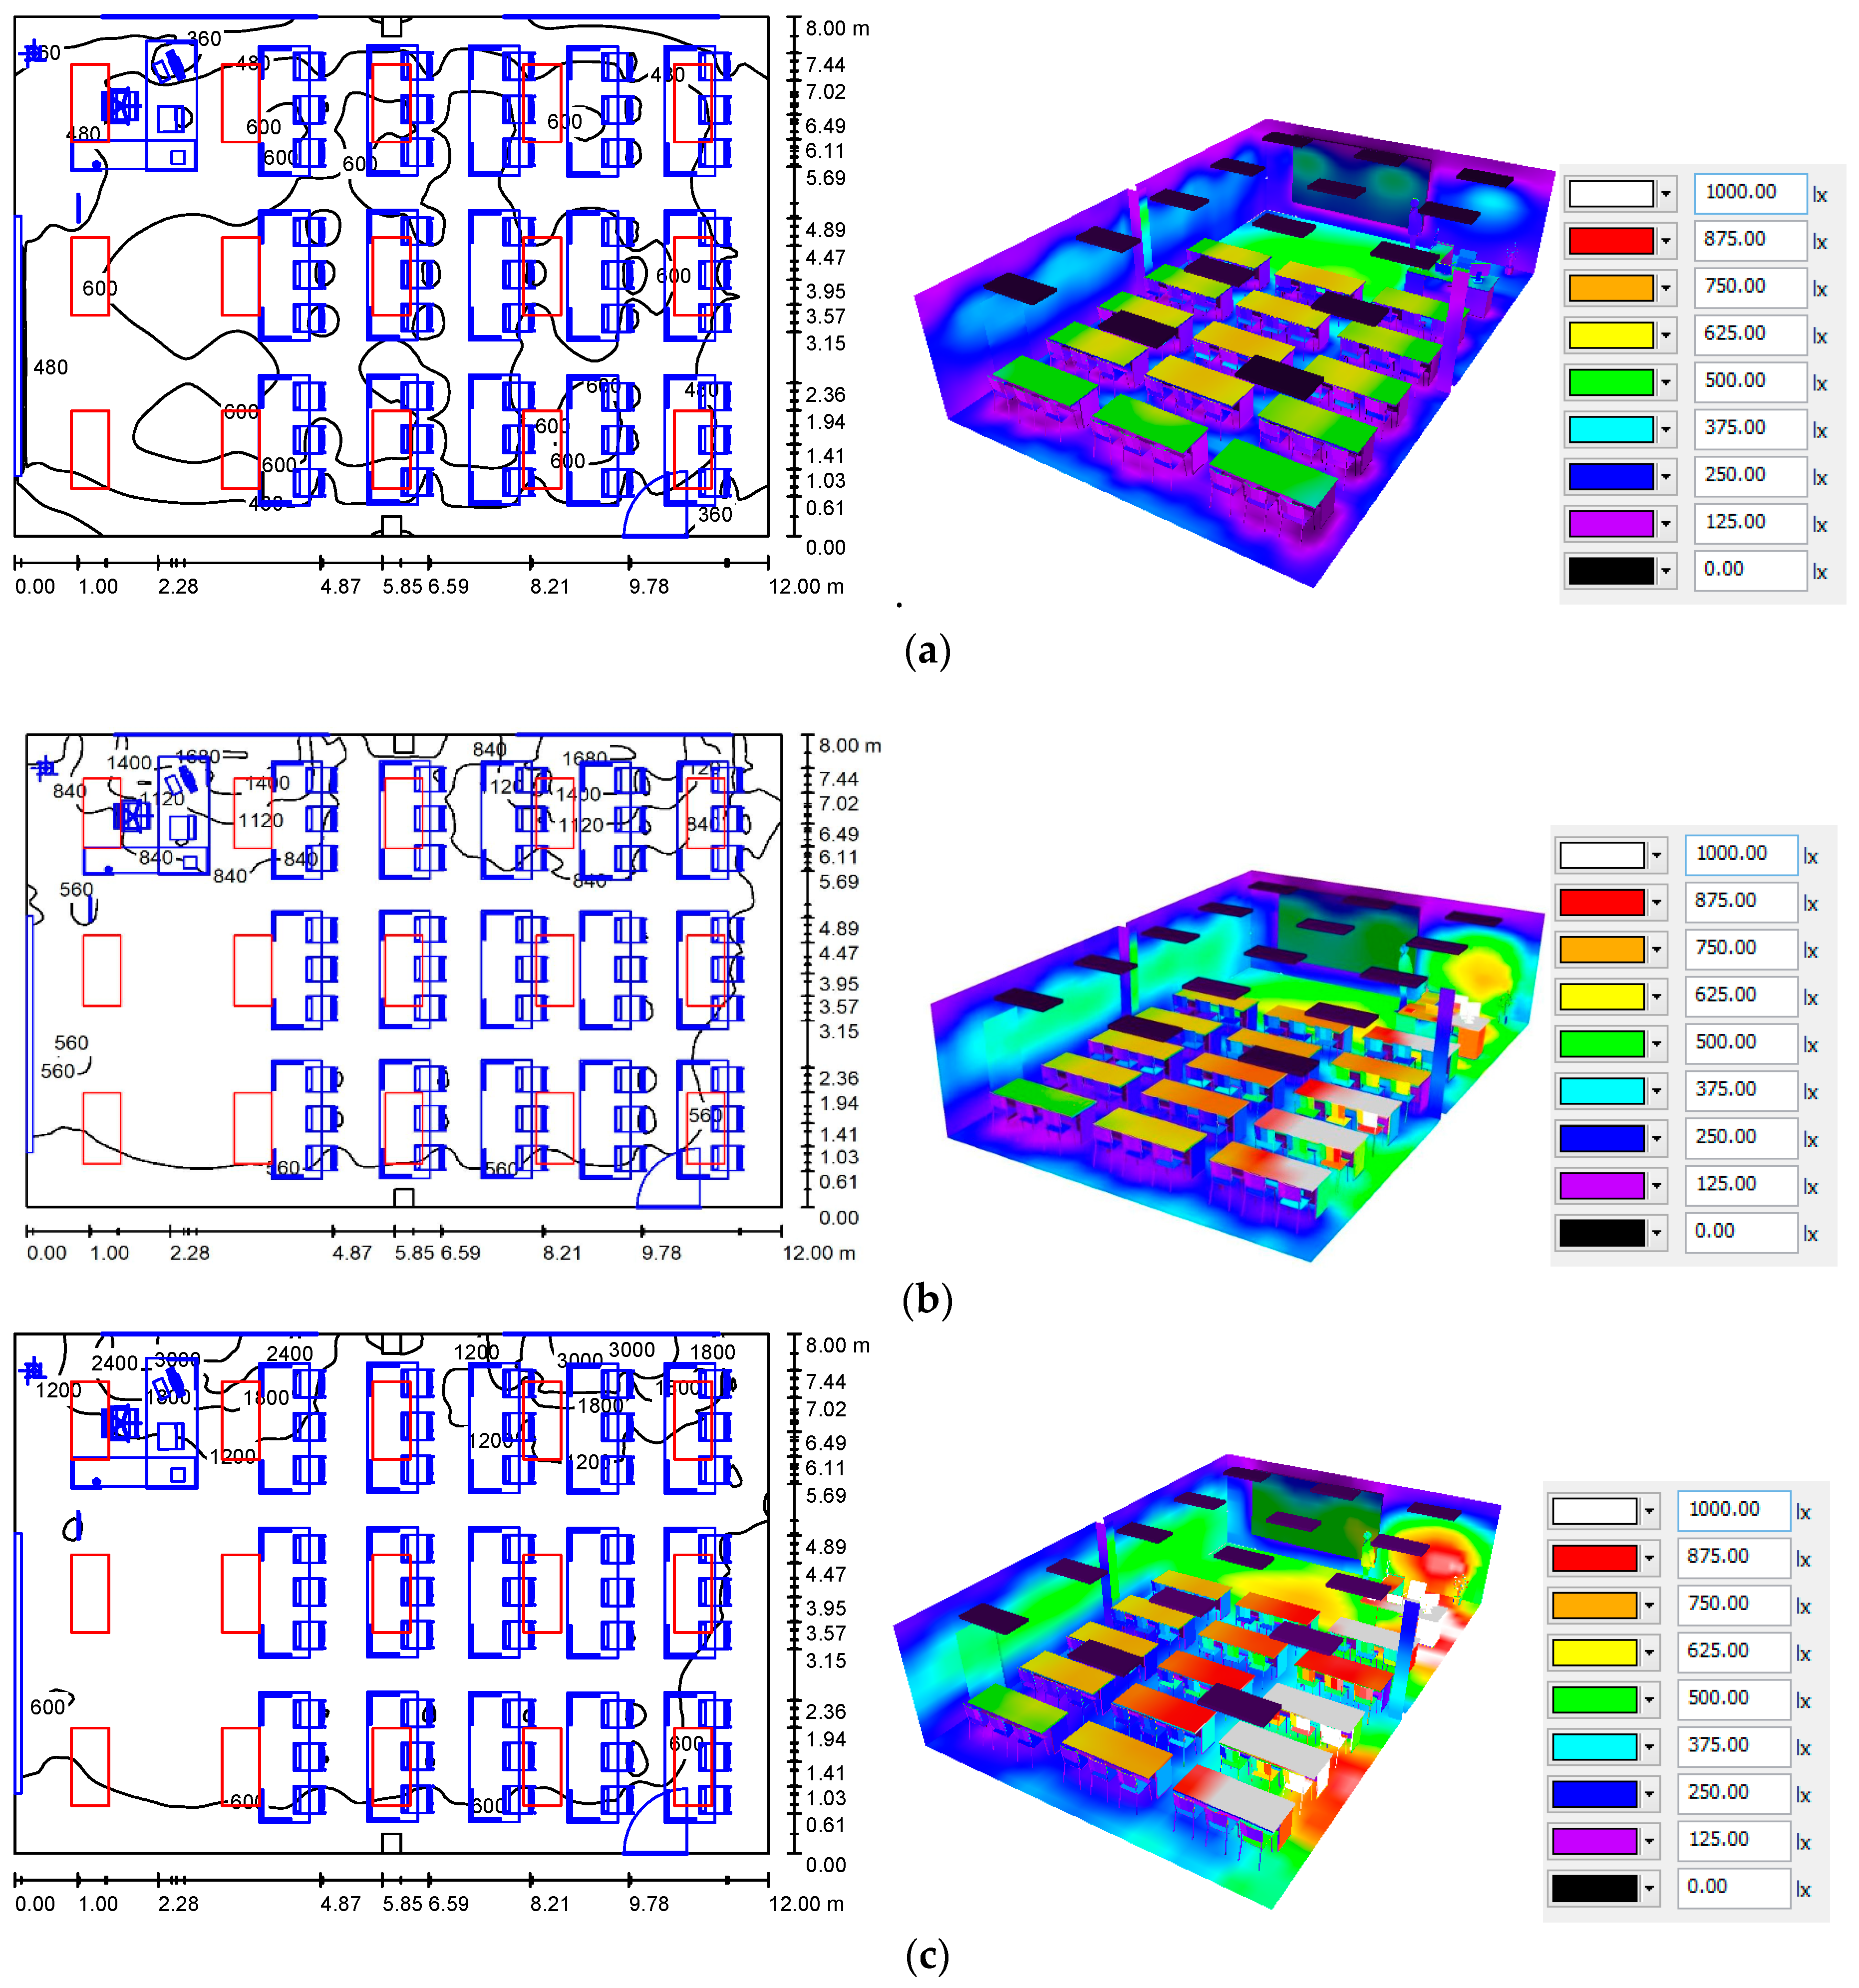
Literature review from past research and various case studies in related field to lighting system and daylight control has been presented in this section. The energy consumption in the household sector and buildings is reviewed, consisting of studies that aim to evaluate the energy consumption and the potential to increase the energy efficiency through various technologies. Several research articles [5,6,7,8,9,10,11,12,13,14,15,16,17,18,19,20,21,22,23,24,25,26,27,28,29,30,31,32,33,34,35,36,37] proposes energy efficiency improvements that have been applied in various countries. The result is that the implementation of technology and novel methodologies in both the retrofitting of existing building and new construction projects can improve energy efficiency, save energy and lower the environmental impact. A survey study on households’ choices of lighting fuels has been performed in Kenya to evaluate the factors influencing the adoption of less carbon-intensive energy sources [6]. In Reference [8], a study on energy performance and carbon emissions is reported for an urban district in the city of Macau. The result suggests that there is a great potential for solar energy production, which would reduce carbon emissions by approximately 10%. The opportunities and challenges of energy efficiency in India are discussed in Reference [10]. This paper also suggests several key steps that the government can take to achieve energy efficiency. Another study in India has identified the problem of energy regulation at the local level [12]. The study found that climate, building envelope, building materials, daylighting and HVAC are important factors to improving energy efficiency in buildings. Energy efficiency measurement concepts are proposed for incorporation into India’s building regulations for designing energy efficient residential buildings. Ref. [14] discusses the role of conventional and renewable energy technologies that can be implemented in a green energy system in Turkey. The residential building performance in different climate zones of Turkey is discussed in Reference [15]. This research evaluated life cycle energy consumption and CO2 emissions using the life cycle assessment (LCA) and life cycle cost (LCC) methods. The approach in this research can be applied to both new designs and existing buildings. Energy-saving policies in both Japan and China for existing buildings are discussed in Reference [17]. Both countries are facing several obstacles such as high transaction cost and a lack of innovation and awareness, which are very critical to reducing CO2 emissions in the building sector. Ref. [18] has proposed the retrofitting of existing buildings to achieve energy efficiency by using conventional technologies such as improving insulation and retrofitting HVAC systems. The proper use of conventional technologies can achieve green building certification with less energy consumption and improved occupant satisfaction. The energy performance of the residential sector in Spain has been investigated, as presented in Reference [20]. The results can be used to prioritize energy conservation and help the government plan future policy. Ref. [21] investigated the effectiveness of energy efficiency measurements for different occupancy patterns. Less expensive measurements could generate similar savings to conservation devices, with the savings varying with the occupancy pattern. Ref. [23] discusses the design, development and application of a model to calculate energy consumption for lighting systems in the residential sector. Research in modelling energy consumption in buildings is presented in Reference [24]. This method uses an agent-based model, with important elements taken into account, and the results of the simulation can be used for building energy management. In Reference [25], a model is simulated to quantify residential peak demand. The model has been used to evaluate energy demand reduction using energy savings measurements. The results from the simulation indicate that the most effective countermeasure is turning off lights. A model that estimates the energy demand in the residential sector using artificial neural network is proposed in Reference [26]. Uncertainties in building energy consumption introduced by building operations and weather were addressed using a simulation approach for a commercial office building [27]. The models include all energy-consuming activities such as heating, cooling, lighting and other appliances inside the residential units. A feasibility study on renewable energy options in buildings is presented in Reference [28]. The results from the study indicate that the use of solar thermal power for hot water and space heating is the most cost-effective, while solar PV is suitable for demand-side management. One renewable energy application in buildings is building-integrated photovoltaics (BIPVs), which is proposed in Reference [29]. Research in Hong Kong also applied a BIPV system in a building, as described in Reference [30]. The results indicate that BIPVs could meet the energy demand but there are some issues between the government and the utility company. Ref. [31] proposes a novel scheme to increase the efficiency of the PV-converter battery in a BIPV system. The results from simulations and experiments show an increased energy efficiency under normal conditions. Ref. [32] discusses renewable energy in buildings in China. The research aims to forecast the growth rate of renewable energy in buildings (REIB) using a prediction model of grey theory and scenario analysis. Countermeasures to reduce energy consumption in buildings are discussed in many studies. Energy savings can be achieved by both implementing new technology and changing the behavior of building occupants. Ref. [33,34] propose basic actions to improve energy efficiency that have been tested in several buildings. A joint solution to increase energy efficiency using a real case study on a university campus is proposed in Reference [35]. The effects of an energy management system on energy savings in buildings are investigated in Reference [36]. Ref. [31] also evaluated the energy performance of an intelligent energy management system, indicating its potential for energy saving due to its high energy performance in terms of payback and return factor. The behavior, attitudes and opinions of employees of a large commercial company are presented and analyzed in Reference [37]. As a result, it is internationally accepted that energy conservation and energy efficiency improvement are important approaches to address the aforementioned challenges, so some of these strategies may be implemented immediately.
Thailand became the first country in Asia to implement a comprehensive, national demand-side management (DSM) program in 1993. Demand-side management (DSM) was implemented to reduce energy consumption and CO2 emissions in the residential sector [16,19]. The calculation method to estimate the energy-savings was proposed in Reference [22]. This method was adopted from the British Standards Institution (BSI) to reflect Thailand’s residential sector. Another approach for solar PV is presented in Reference [38]. This research proposed an efficient solar-powered Homegrid model based on load characteristics represented by static ZIP models. The simulation model has been validated by implementation on a solar PV test bed in Thailand. The result showed an improvement in efficiency and a reduction in harmonics. [39], proposed a design model of a renewable energy air-conditioning system using solar and biomass as renewable energy sources. The life cycle assessment of a chilling system in Thailand is presented in Reference [40], comparing the environmental impacts of a conventional system and a solar-assisted system. The energy savings potential in the residential and building sectors are presented in Reference [41], using business as usual (BAU) as a reference case and the AIM/EndUse model. The results indicate that the implementation of new styles of buildings can achieve energy savings of up to 42.7% compared to the BAU scenario. From research on energy consumption in buildings, the efficient use of lighting is essential, as the energy usage in lighting systems is the second largest component after heating, ventilating and air conditioning (HVAC). The reduction of energy consumption in these areas can significantly impact the overall energy usage in buildings. Many countries have begun to increase the stringency of their lighting minimum energy performance standards (MEPS), with the intent of phasing out the least efficient light source technologies, while researchers aim to develop techniques and technologies to increase the energy efficiency and reduce the energy consumption in lighting systems.
To reduce energy consumption by lighting systems, there are several techniques that have been developed for energy efficiency improvement and energy conservation [42,43,44,45,46,47,48,49,50,51,52,53,54,55]. Criteria for efficient lighting energy are presented in Reference [42]. The approach in research has taken account of lighting comfort requirements and maximum allowable lighting loads to set criteria for designing lighting systems. A stochastic model for energy consumption in lighting systems is proposed in Reference [43]. The research has developed a model to simulate a lighting consumption profile in the residential sector. It also performs a study on the impact of LED technology and evaluates the economic cost when energy saving actions are implemented. Another stochastic model is presented in Reference [44]. In this research, statistical analysis was used to evaluate the lighting energy usage in 15 office buildings in China and Hong Kong. Ref. [45] presents survey results from an office in Korea, evaluating the behavior of occupants and lighting use patterns. The results indicate that a lighting control strategy must be implemented to reduce energy usage in lighting systems. Lighting scheduling for energy saving is presented in Reference [46]. The paper proposes the active use of life log data based on a decision-making method to minimize the waste of lighting energy by controlling the real-time operation of luminaires. A cost-benefit analysis of high-intensity luminaire replacement is provided in Reference [47]. For compact fluorescent lamps (CFLs), a new high-power-factor dimmable electronic ballast control scheme is proposed in Reference [48]. According to experimental results studying various dimming levels and operating conditions, they verified the good performance and effectiveness of the proposed dimmable ballast. A fuzzy logic controller and dimmable electronic ballasts were used to obtain artificial lighting at targeted levels. During the functioning of the system, approximately 30% savings were achieved by the proposed controller implementation. [49] proposes energy saving in T5 fluorescent lamps with an electronic ballast and harmonic reduction using a filter circuit. The results indicate that the energy consumption of a T5 fluorescent lamp can be reduced through the design of an appropriate filter and it can also reduce the harmonic values within the international standard. A high-power-factor electronic ballast with different dimming mechanisms and interfaces for T5 fluorescent lamps is developed in Reference [50]. The life cycle assessment of light-emitting diode (LED) and compact fluorescent (CFL) luminaires is presented in Reference [51]. The environmental impact of these two technologies has been evaluated. The results indicate that LEDs can reduce greenhouse gas emissions by at least 41%. The effect of LED lighting on cooling and heating in building is presented in Reference [52]. It also proposes a heat control strategy to achieve energy-efficient of LED lighting. In Finland, research on an LED lighting system and its potential to reduce energy usage and CO2 emissions was conducted [53]. The lighting control strategy is presented in Reference [54,55], proposing a control algorithm and control system components required to achieve energy efficiency in a lighting system with daylight harvesting and optimal space cooling. An adaptive lighting control system is proposed in Reference [56]. The system is an automated lighting control under varying conditions of occupancy, weather, seasons and other influences. Ref. [57] proposes a lighting control technique based on a fractional-order (FO) adaptive minimum energy cognitive control strategy. Ref. [58] proposes a high-efficiency lighting system using real-time integrated lighting for energy savings. The experimental results demonstrate the effectiveness and applicability of the proposed method. Researcher in the lighting industry focuses on improving the light output and lifetime, lighting systems combined with advanced wireless control systems, personal and workstation controls and daylighting to manage the lighting needs of work spaces energy efficiently.
Research on lighting control systems using daylight has been reviewed. To evaluate the potential of daylighting, the adaptation of daylighting modelling has been performed and is presented in Reference [59]. The paper investigated whether kriging modelling can be used to profile illuminance. The results show that the proposed modelling was in the approximate range of measurement data. A hybrid lighting system (HLS) with electric lighting and daylight delivered into the building was developed in Reference [60,61]. The energy performance of an office building with daylight integration is discussed in Reference [62]. The research has investigated the energy savings in a lighting system based on both daylighting and artificial light, while taking visual comfort into consideration. It can be observed from the result that in all cases, visual comfort can be achieved with automatic interior shading controls. Ref. [63] proposes design recommendations for daylight harvesting systems (DHS). It suggests that technical robustness, architectural integration and human acceptance are the main aspects that need attention. A practical case of using daylight harvesting is proposed in Reference [64]. The control strategy is to detect illuminance in the area below and adjusting the modulation of the luminous flux to maintain the illuminance required by the standard. A new concept of using daylighting for a factory is proposed in Reference [65]. The methodology is based on a multidisciplinary approach that is a combination of logistics, building physics and structural engineering to achieve both indoor environmental quality (IEQ) and energy savings. An algorithm for daylight harvesting is presented in Reference [66]. The proposed algorithm is based on machine learning and radiosity theory to calculate the total illuminance. A controller designed for an artificial lighting system in a room illuminated with daylight using light pipes is presented in Reference [67]. The model was tested in a five-level building and it was shown that all five levels of the building can achieve an average illuminance of 70 lux at a low sun elevation. Ref. [68] has developed an optimal daylight-based controller. Sensor-integrated luminaires with daylight and occupancy in consideration are proposed in Reference [69]. The centralized lighting control was based on solving a power minimization problem with illumination constraints. The results demonstrate better uniformity with similar energy savings to other control strategies. Ref. [70,71] present the application of artificial intelligence to predict the availability of daylighting and use this algorithm to calculate the final energy requirements of a building. The calculation of daylight availability and its impact on energy savings are presented in Reference [72,73,74]. Factors that have an impact on daylight performance such as weather, architecture and location of the building are presented in Reference [75,76,77]. A simulation result [78] using different weather data has revealed that weather has a significant effect on the illuminance value through the condition of the sky. A review of the effects of daylight on building occupants in term of psychology and physiology also showed that daylight not only benefits a building through energy savings but also provides health, productivity and safety benefits to the building occupants [79]. From the literature review above, it can be seen that daylight contributes benefits to many aspects of buildings and lighting control using daylight has attracted much attention from many researchers. The majority of the research has only used simulations to evaluate the performance of control strategies and the potential of daylighting, so experimental work is needed to evaluate the impact of some factors that were omitted in the simulation stage.

3. Simulation

The fluorescent T5 tube lamp was simulated using the DIALux program to study the impact of daylight and artificial light in terms of average illuminance, including the energy consumption, for a university building. A lecture room with dimensions of 12 m × 8 m × 2.7 m (room area of 96 m2) was considered as the case study room, with a layout as shown in Figure 1. As shown in Figure 1a,c, this room contains two windows (with dimensions of 1.5 m × 3.4 m) and a wooden door (with dimensions of 1 m × 2 m). The height of the task area (or workplane) was set as 0.75 m, corresponding to the height of a table (approximately as 0.75–0.85 m above the floor level), as shown in Figure 1c. As shown in Figure 1d, 15 sets of 2 × 28 W T5 fluorescent luminaires are installed in the lecture room. The luminous intensity of the T5 fluorescent luminaire is recorded on a polar plot shown in Figure 2 and its data are shown in Table 2.
As previously mentioned, to study the impact on illuminance and energy consumption of daylight in each time period, the illuminance was calculated at 8 a.m., 10 a.m., 12 p.m., 2 p.m. and 4 p.m., in addition to without daylight (as base case) by considering only the T5 luminaires, as shown in Table 3 and Figure 3.
The obtained results are presented in Table 3 and the illuminance distribution (as an isolux diagram) and a false color rendering are illustrated in Figure 3. Generally, according to the CIE standard, the average illuminance on a task area of a general room must be more than 300 lux but should not exceed 750 lux (recommended by the EN 12464-1 and CIE S 008/E:2001 standard as 500 lux [80,81]). By considering the illuminance in Table 3, in the case of a lecture room with daylight, the average illuminance is more than that of the base case (without daylight); this indicates that the daylight is beneficial to the overall illuminance on the task area. However, the variation of the maximum illuminance within each time period is significantly larger than that in the base case and the variation of the minimum illuminance is also slightly larger. This indicates a slight mismatch between the maximum and minimum illuminances in each period of time. Although the uniformity of the illuminance in the cases of daylight is greater than that of the base case, as shown in Table 3, the difference between the maximum and minimum illuminances can be clearly seen in the isolux diagrams shown in Figure 3; this indicates that the daylight could increase the average illuminance but the uniformity of the illuminance should be improved, as the illuminance of the task area section near the window side was higher than that of the other section of task area in the lecture room. Considering Figure 3, the illuminance on the task areas near the window side is more than 1000 lux, while the other task areas of this room have illuminance values of 400–600 lux.
Based on a further analysis of Figure 3, it is noteworthy that, for the daylight at 10 a.m., the illuminance on the task area is much higher than that of the other time periods because of location of the building and the direction of the sunlight passing through the window while, for the daylight at 4 p.m., the average illuminance on the task area is lower than during the other periods of time because it is the sunset period. The energy consumption index (in watts per square meter) does not change with the time period, as shown in Table 3. This emphasizes that luminaires in the window area affected by daylight can be dimmed or turned off to reduce energy consumption and maintain the uniformity of the illuminance in the daytime, so that artificial light with dimming ability must be applied to control the illuminance of the task area at the desired values for each time period.

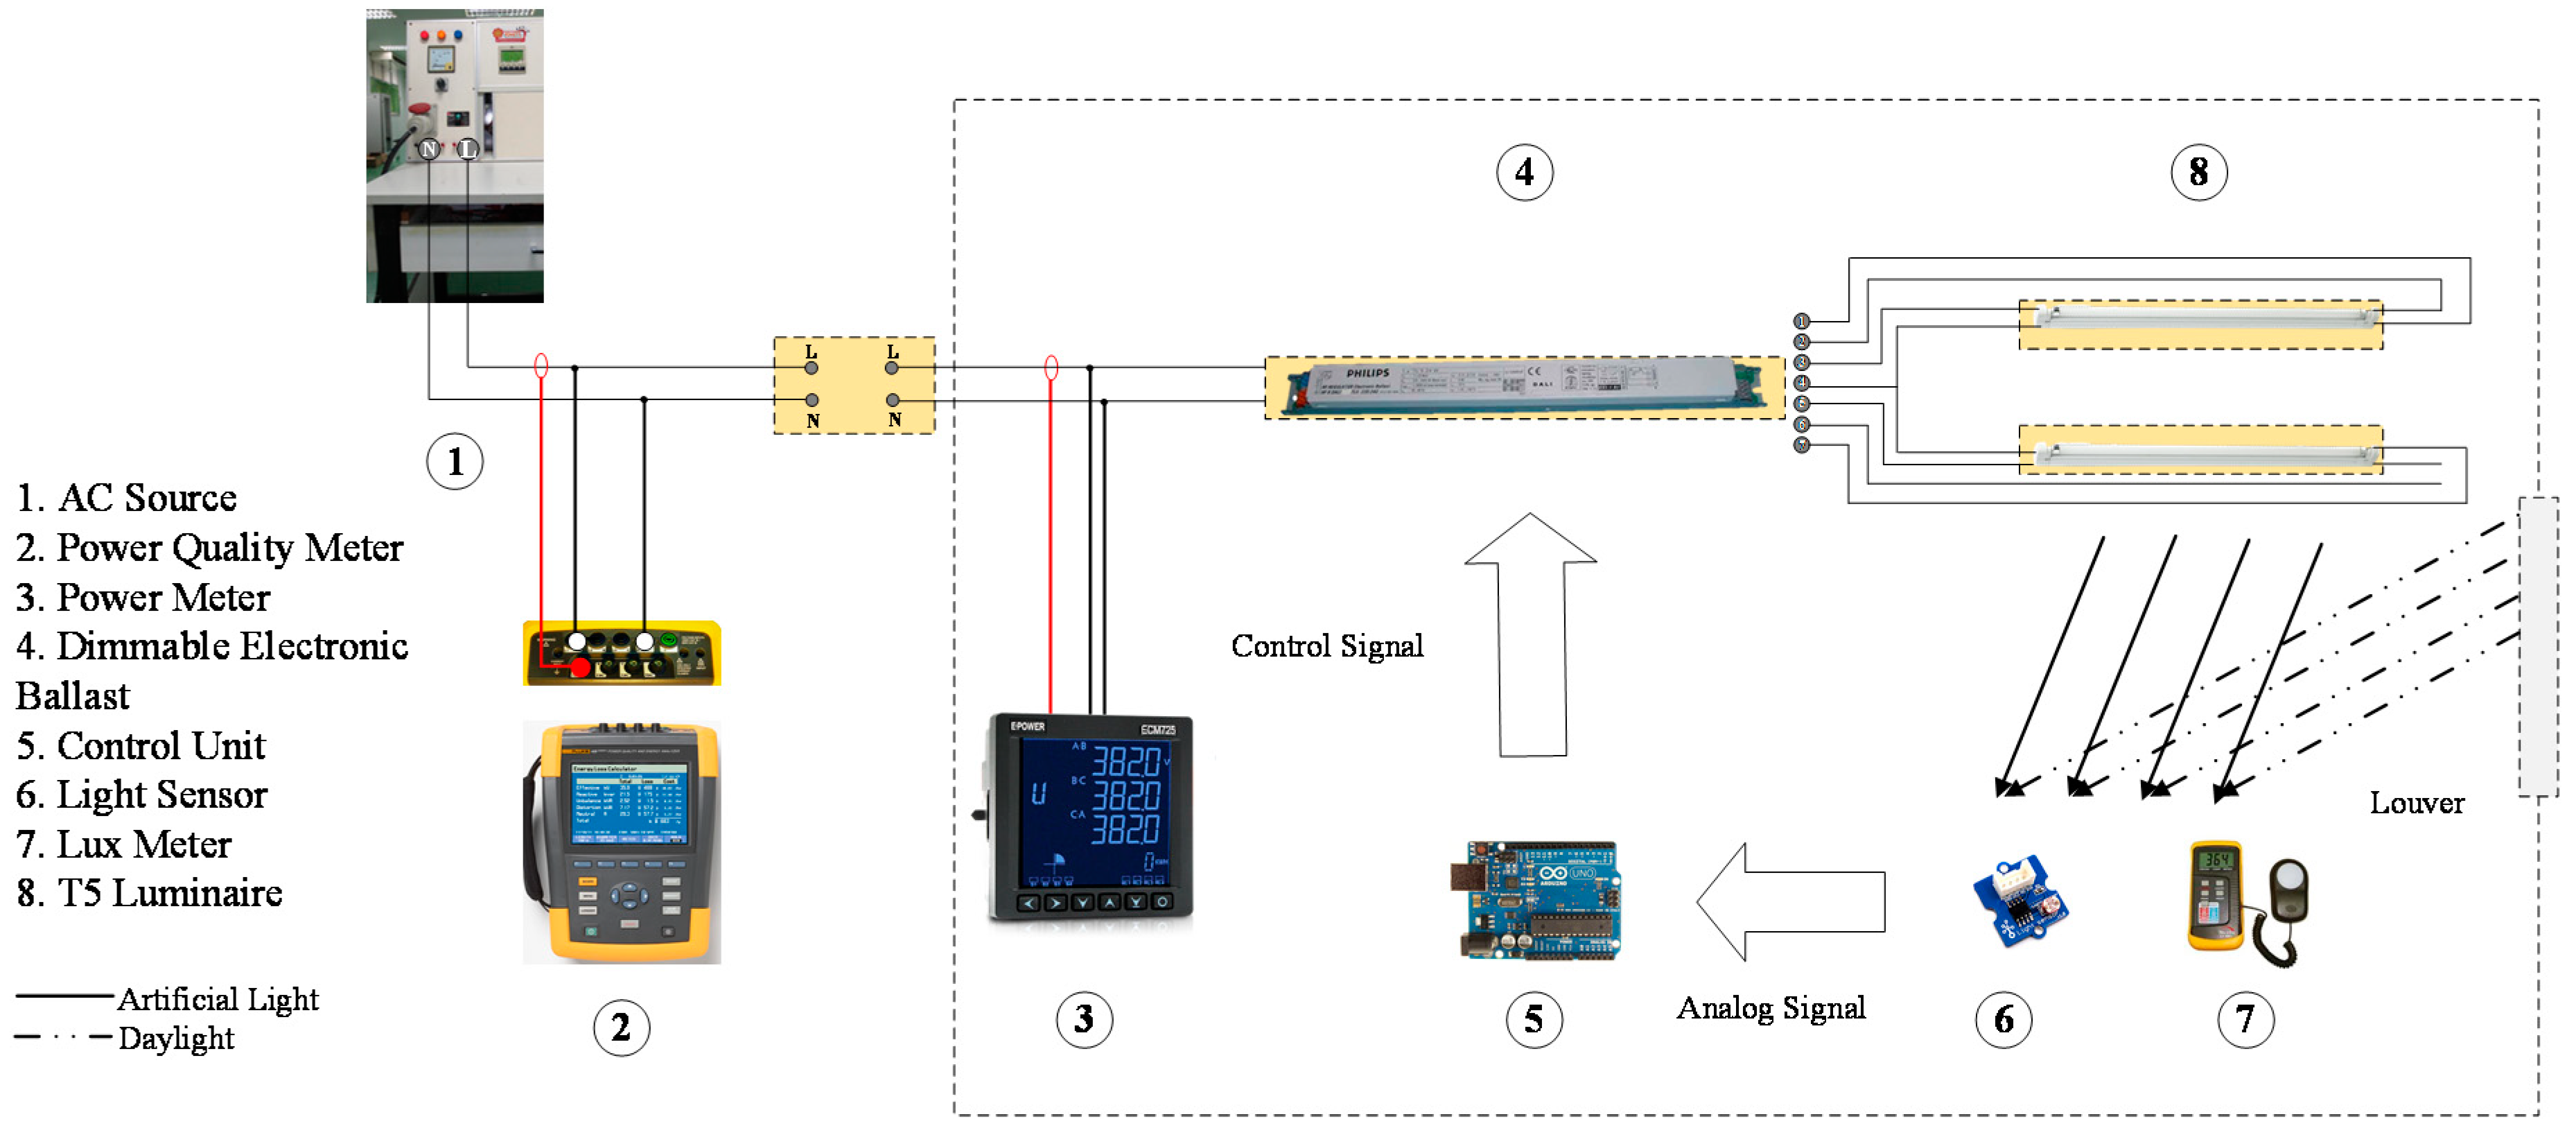
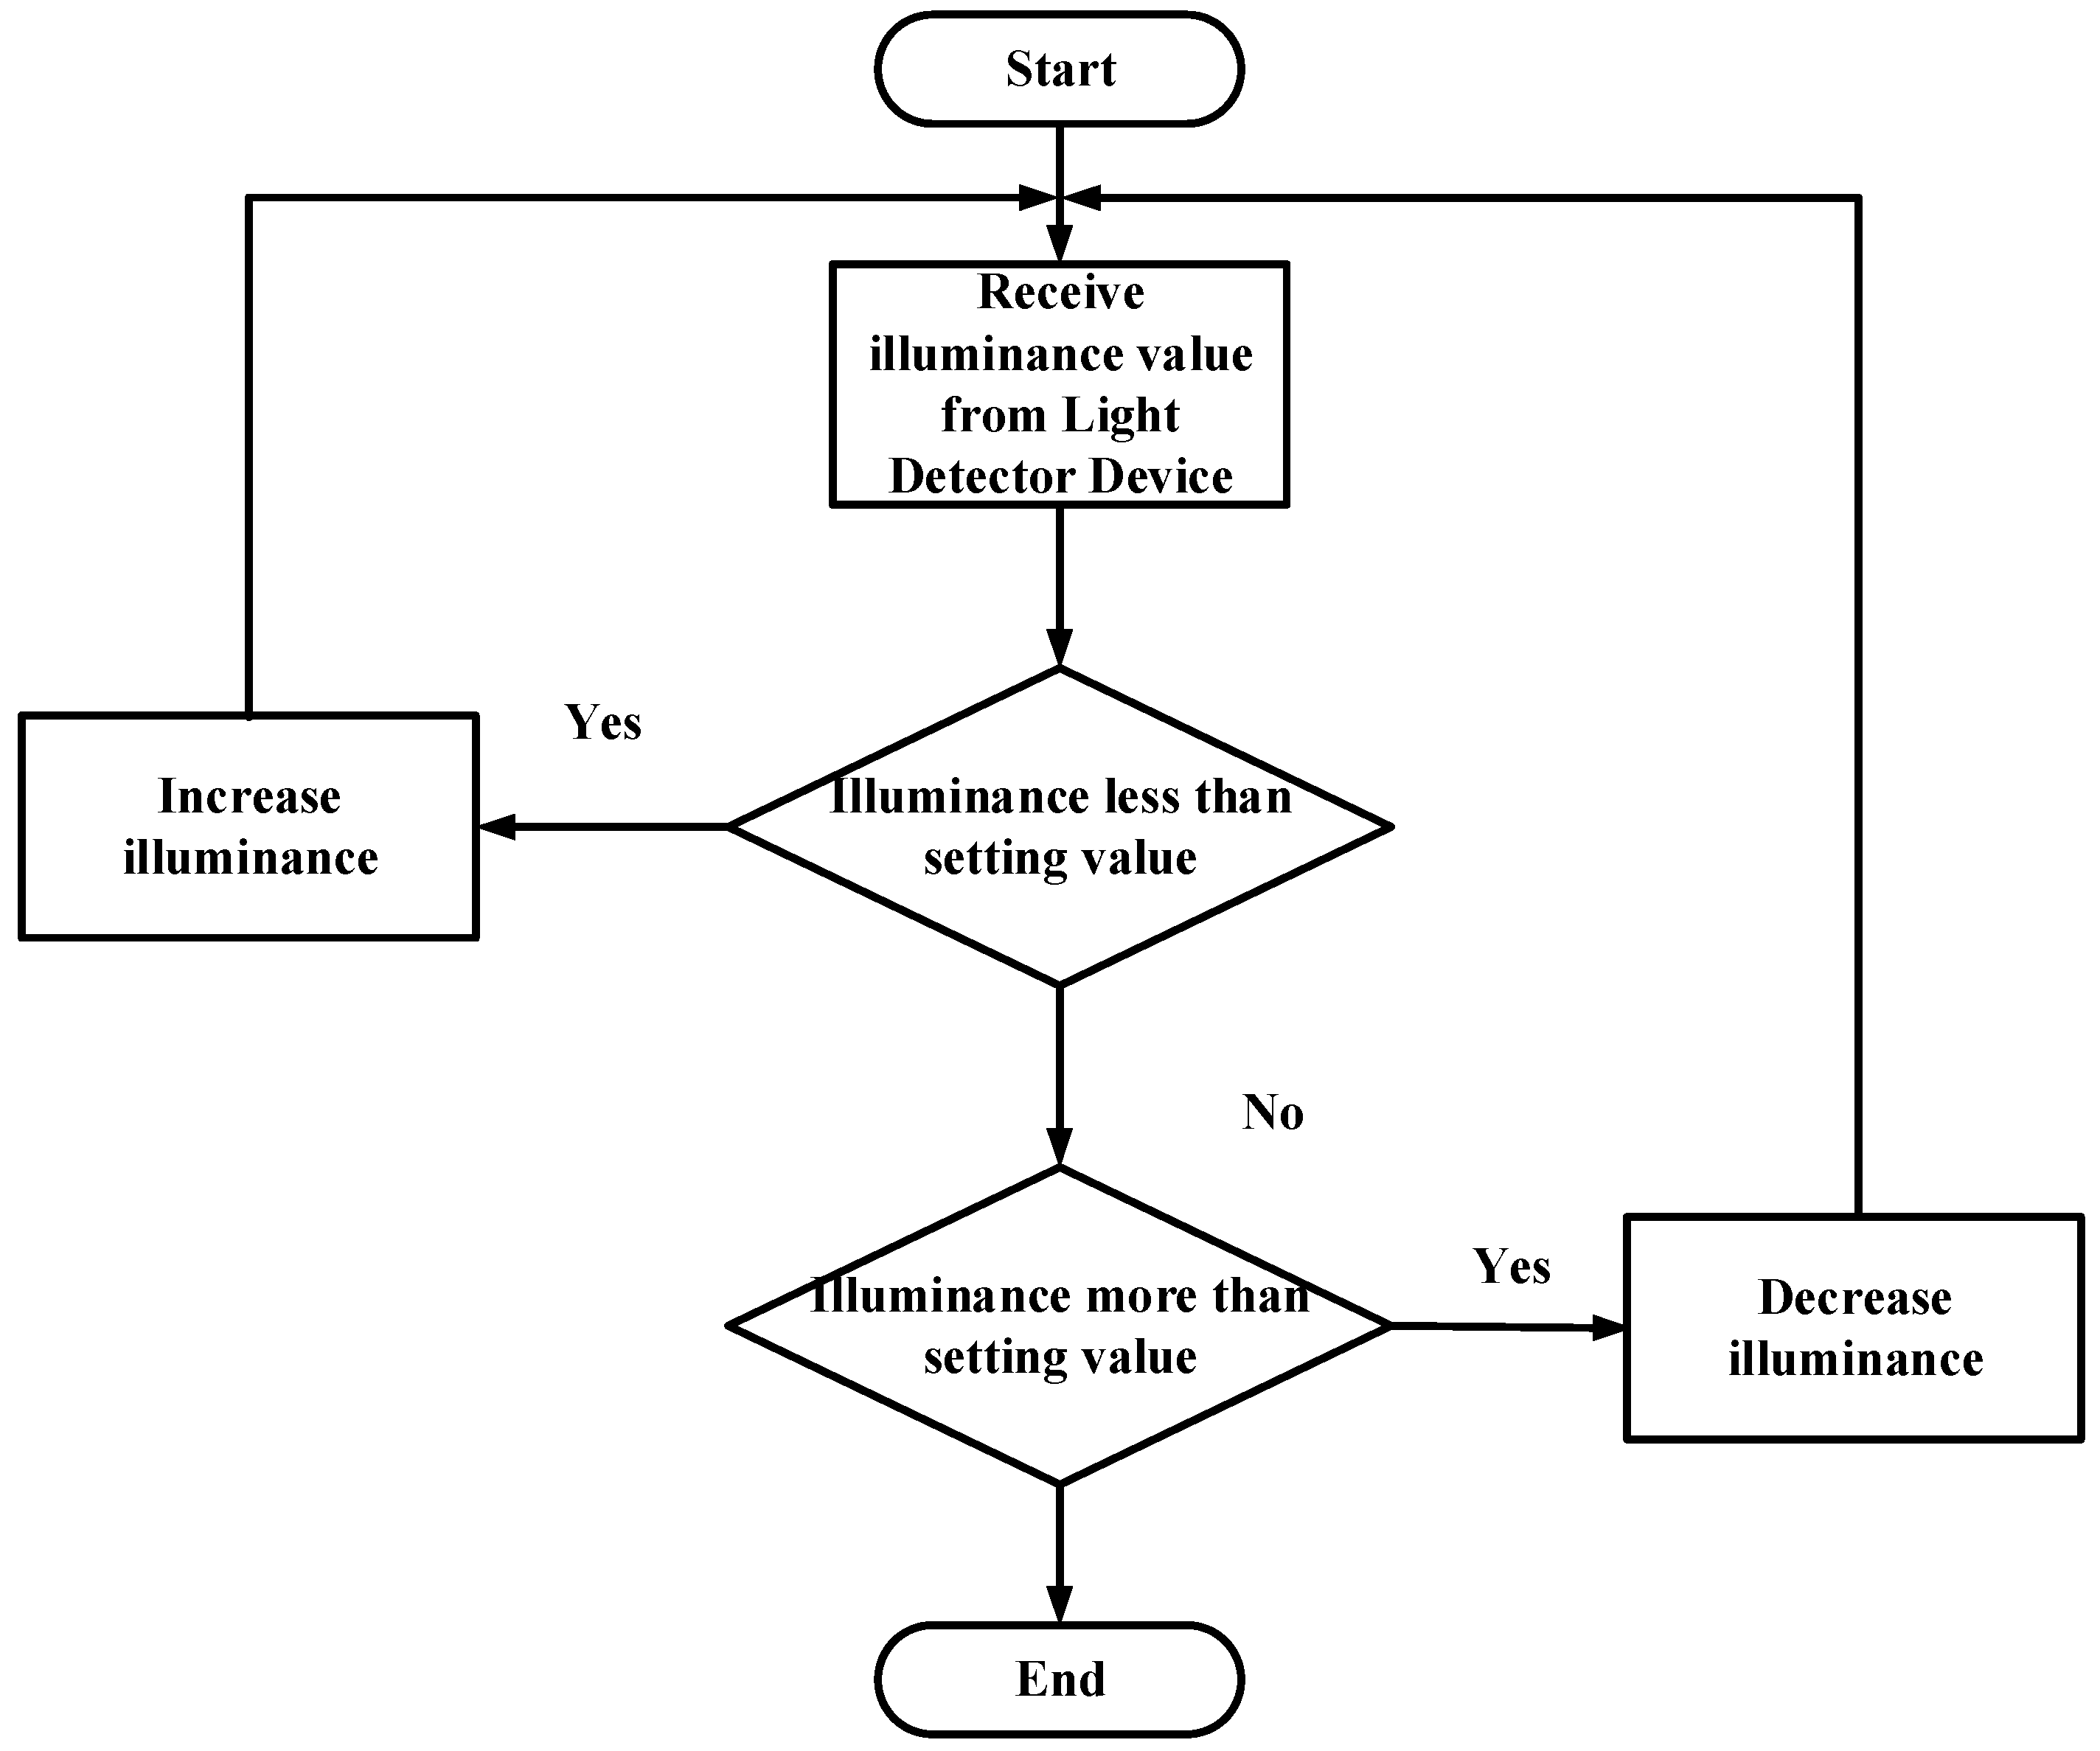
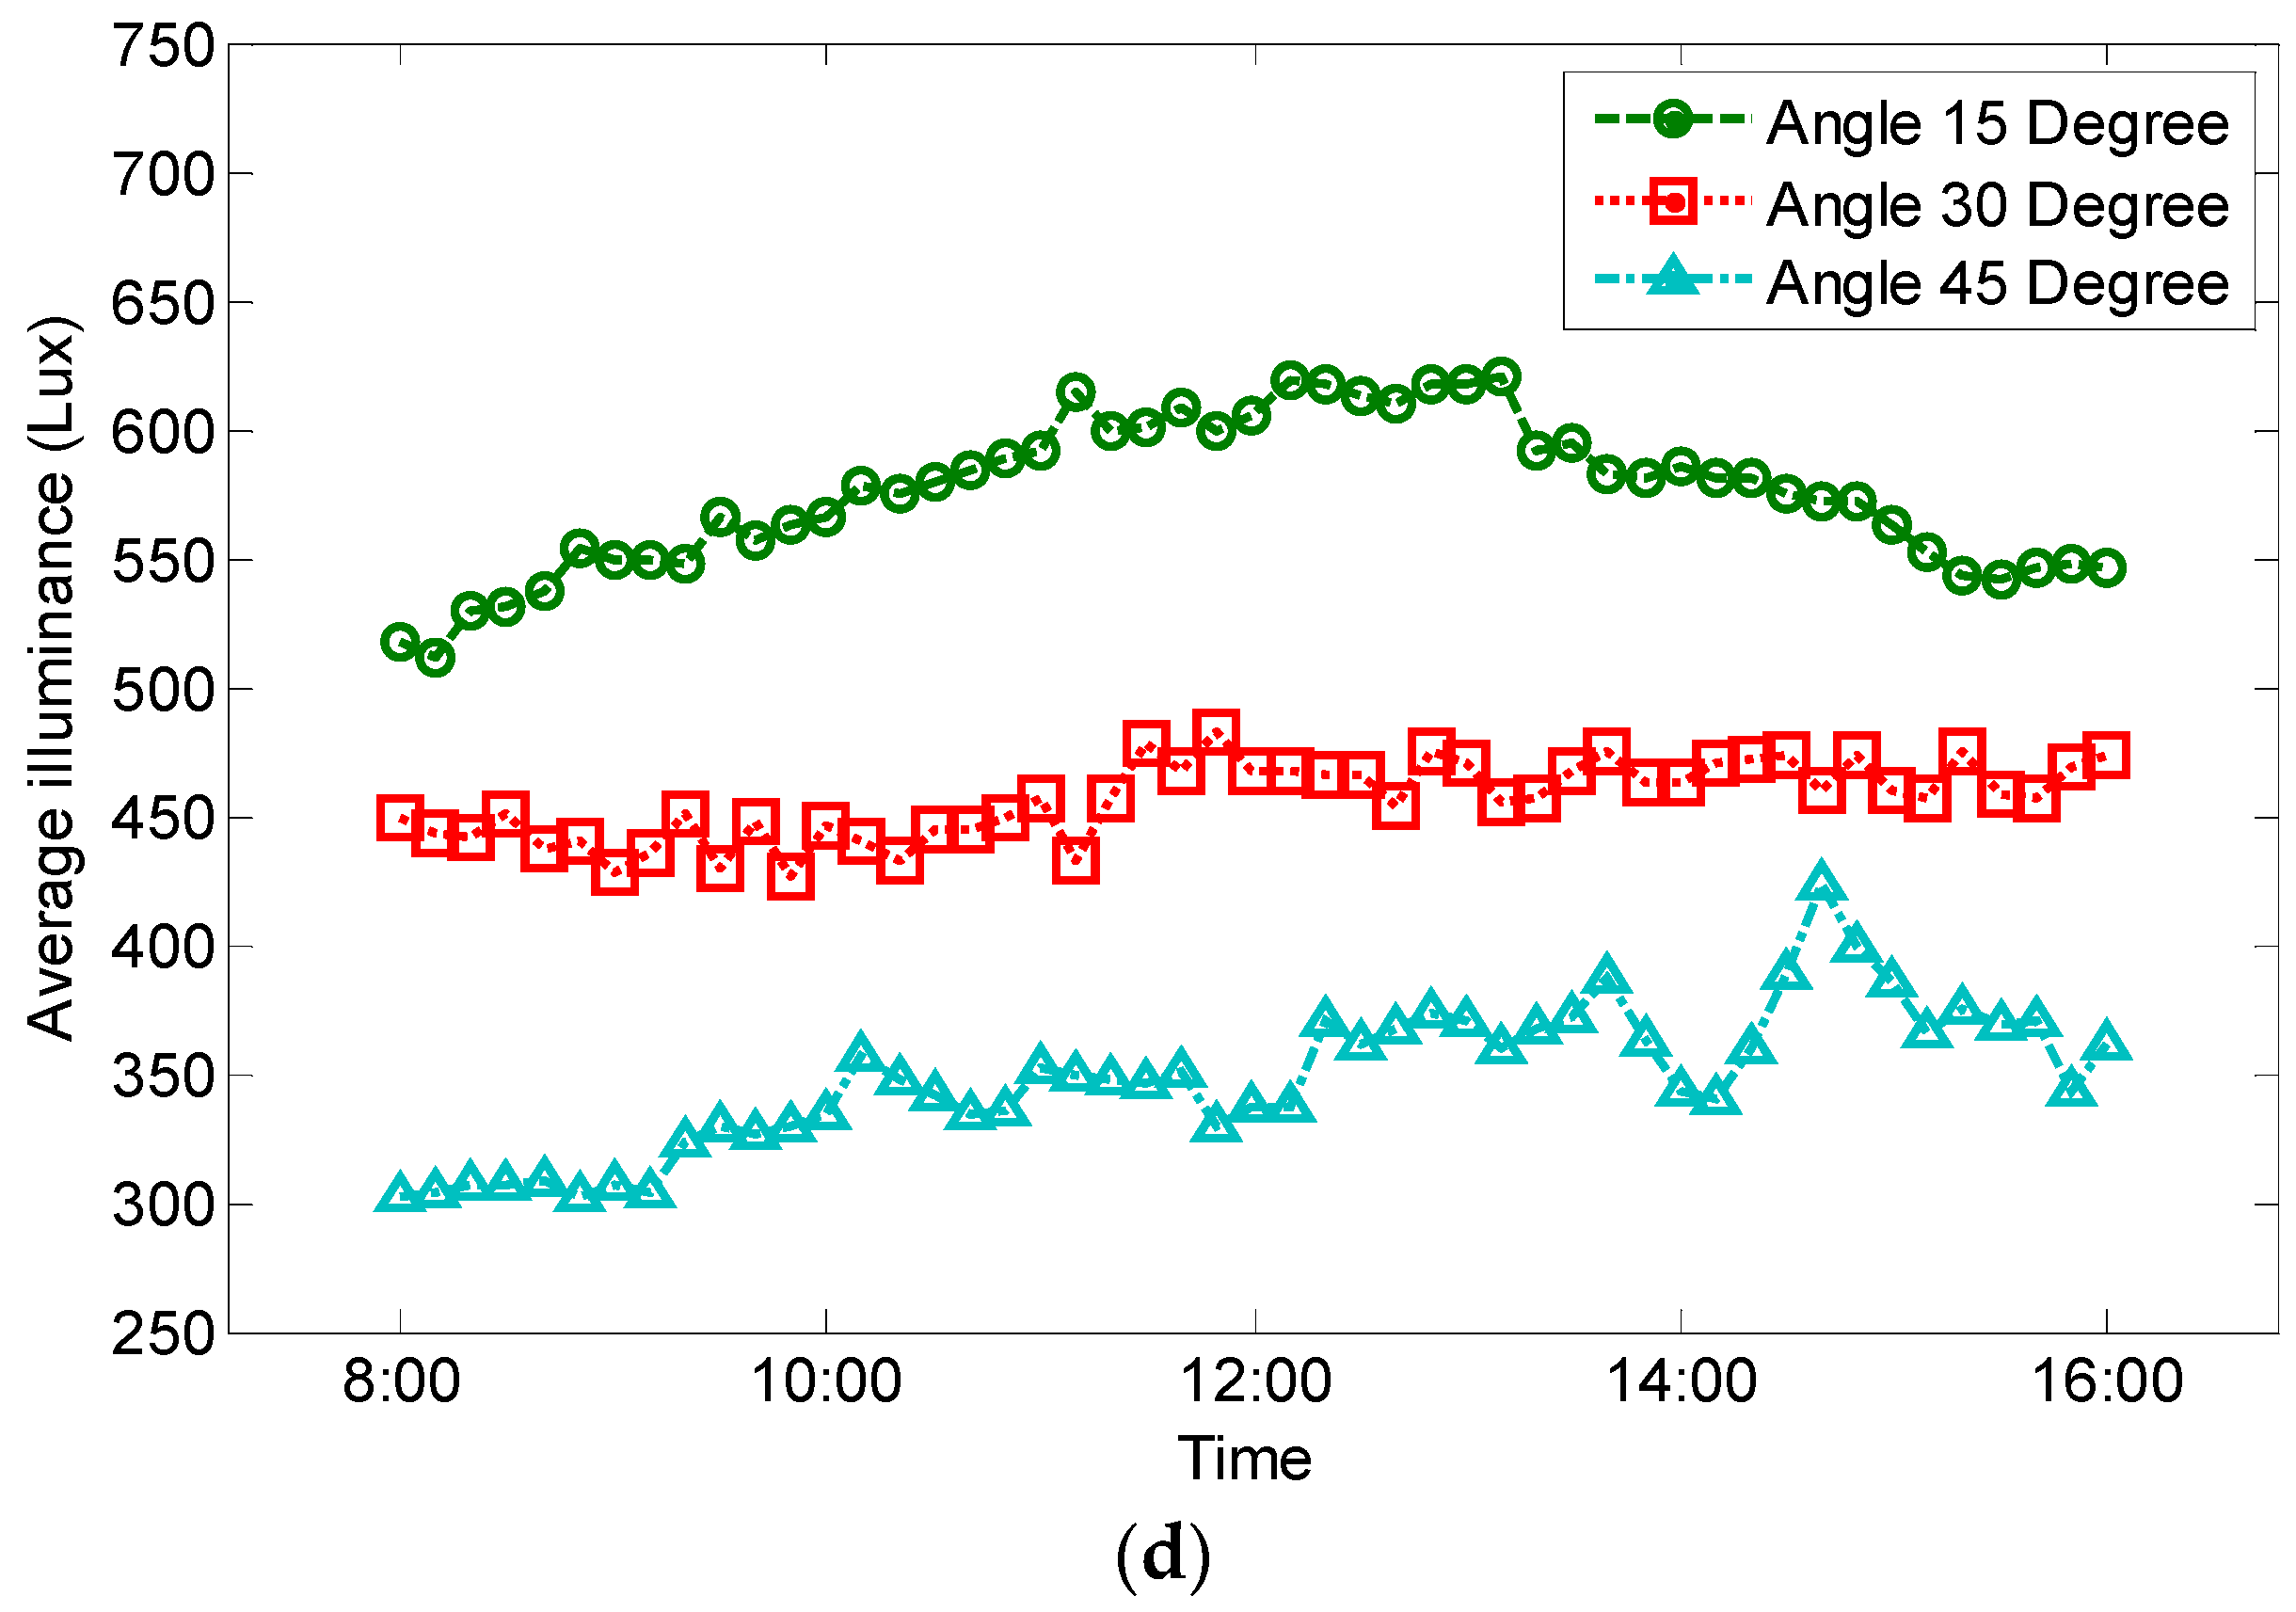
4. Experimental Setup and Results

As described in the previous section, daylighting may provide a sufficient quantity of illumination (illuminance and uniformity of illuminance) to reduce the artificial lighting level needed but it can result in false energy consumption. To maintain an appropriate average illuminance level and reduce the energy consumption, the lighting control must be properly adjusted with the daylight level. By considering the isolux of Figure 3, the daylight from the window has an effect on only 1/3 of the task area, so that this task area section should be subjected to lighting control to adjust the illuminance only in a specific area. In this section, an experimental setup unit has been designed and built, as shown in Figure 4. Figure 4a shows that the experimental setup unit (1.35 m × 1.4 m × 1.9 m) has been designed as an enclosed area with a black interior surface to prevent light reflection, as depicted in Figure 4b. The louver system on the window of experimental setup can be adjusted into 4 level; 0, 15, 30 and 45 degree using vertical line as a reference. when 0 degree mean that the louver is close and 45 degree mean that louver is open at 45 degree with vertical reference line. The distance between the luminaire and task area (measured point on floor of experimental setup) is 1.8 m because this distance is generally 1.75 m–1.95 m, depending on the objective of room. Considering the side view of the experimental setup unit shown in Figure 4c, two window shutters (0.485 m × 0.615 m) have been installed to admit daylight into the experimental setup unit and there are two luminaires installed on the ceiling of the experimental setup unit each (2.95 m × 11.95 m × 0.65 m) consisting of 28 W T5 fluorescent lamps connected with a dimmable electronic ballast, as shown in Figure 4b. The illuminance control unit is installed on the ceiling of the experimental setup, as shown in Figure 4d. Measuring instruments such as a lux meter, power meter and lighting control switch (on/off control) have been installed to measure the illuminance, voltage, current and real power, as shown in Figure 5.
A diagram of the experimental setup is shown in Figure 5. The single-phase power supply of the experimental setup was determined in the laboratory to have a voltage level of 230 V (number 1 in Figure 5), while a fuse with 5 A is used to protect the experimental setup unit. For measurement, an energy meter (Fluke 435-II) (number 2 in Figure 5) is used to measure the power quality including harmonics and electrical parameters, both for the power supply and the experimental setup unit, while, as previously mentioned, the illuminance and real power of the experimental setup unit are measured using a lux meter (number 7 in Figure 5) and power meter (number 3 in Figure 5), respectively. The measurement of illuminance using lux meter has been done on two points under both T5 luminaires. As previously mentioned, a luminaire a T5 fluorescent lamp with a dimmable electronic ballast (number 8 and number 4 in Figure 5, respectively) was installed on the ceiling of the experimental setup, as were a light detector (number 6 in Figure 5) and the illuminance control unit (number 5 in Figure 5), as shown in Figure 4d. The algorithm used to control the illuminance with daylighting is shown in Figure 6.
Considering Figure 6, in the case of lighting control with daylighting, the light detector (number 6 in Figure 5) measures the daylight (light from the window shutters) and artificial light (light from T5 fluorescent luminaires) in the form of a voltage signal (analogue input) and then converts this voltage signal to a digital signal. The digital signal is used for comparison with the illuminance value setting in the program. The illuminance value on the workplane (or task area) is measured by two lux meters that are installed under the two luminaires, as shown in Figure 4b. These values were used to calculate the average illuminance on the workplane. If the illuminance measured from the light detector device is more than the setting value, the illuminance control circuit will decrease the light output by 0.25 units. Contrarily, if the illuminance is less than the setting value, the illuminance control circuit will increase the light output by 0.25 units. For the computation of the illuminance control unit, a Pulse-width modulation (PWM) signal was generated using the obtained digital signal. The output of the PWM signal has a duty cycle of 1–100% to adjust the illuminance using the dimmable electronic ballast (number 4 in Figure 5). This dimmable electronic ballast controls the input current of the T5 fluorescent lamp (number 8 in Figure 5) so that the obtained illuminance from the luminaire can be adjusted. The minimum illuminance set in this program is one unit, when the fluorescent luminaire has a 1% light output, while the maximum illuminance setting is 255 units, when the fluorescent luminaire has a 100% light output.
After building the experimental setup unit, two case studies were considered to verify the lighting control unit capability and study the performance of the daylight control T5 fluorescent luminaire. Two T5 luminaire using in experimental setup will be refer as luminaire 1 and Luminaire 2 (Installed location is referring in Figure 4b). The overall average illuminance on the task area was also measured and controlled to less than 500 lux according to EN 12464-1 and CIE S 008/E:2001 standard [80,81], while the energy consumption should be reduced by decreasing the average illuminance. In the first study, a comparison in terms of illuminance and energy consumption between the fluorescent luminaire without and with the lighting control unit was considered. In the next case study, various aperture angles of the window shutters (open louver at different angle) were compared in terms of the illuminance and energy consumption. The obtained results from the comparison between before and after the installation of the lighting control unit are shown in Table 4 and Table 5 and Figure 7.
Considering the case without lighting control in Table 4, when a window shutters angle of 0 degrees (as a dark room or without light from daylighting) is considered as an example, it can be observed that the average illuminance has a value of more than 1000 lux and the energy consumption is approximately 120 W. By changing the angle of the window shutters to 15 degrees (a little daylighting), the average illuminance slightly increases but the energy consumption exhibits little change; this indicates that the average illuminance can benefit from the daylighting but not the energy consumption. To support this assertion, by further increasing the angle of the window shutters to 30 degrees and 45 degrees, the average illuminance continues to increase, while the energy consumption is still unchanged.
Further analyzing Table 4, when the angle of the window shutters is 0 degrees, the average illuminance significantly decreases to less than 500 lux when the lighting control unit is applied. The obtained energy consumption is significantly affected in comparison with the case without lighting control, to less than half its original value. This is because the light detector device changes the illuminance value to a voltage signal for controlling the dimmable electronic ballast, thus reducing the current and real power consumption, as previously mentioned; this indicates that the lighting control unit can both benefit the illumination and reduce energy consumption with the variation of the daylight. Likewise, by increasing the angle of the window shutters from 0 degrees to 45 degrees, the average illuminance tends to decrease in comparison with the case without lighting control and the average illuminance was controlled to less than 500 lux using the lighting control unit. The energy consumption also tends to decrease in comparison with the case without lighting control; this indicates that the lighting control with daylighting still provides energy savings in the building.
Upon considering the results of 12.00 p.m. in Table 5, it can be observed that, in case without lighting control, when the angle of the window shutters is 0 degrees, the average illuminance has a value of more than 1000 lux, which is the same behavior as the case without lighting control in Table 4 but the average illuminance is higher. This is because the data from Table 5 are from midday, while those from Table 4 are from the late afternoon (3.00 p.m.), so the obtained irradiation in Table 5 is higher. To support this assertion, in the obtained result of Table 5, in the case without lighting control, the average illuminance at midday (12 p.m.) has the same behavior as the data during the late afternoon (3.00 p.m.) from Table 4 but the average illuminance for all the angles of the window shutters have slightly higher values. By considering the energy consumption in the case without lighting control, the obtained energy consumption has a similar value to the case without lighting control in Table 4.
Similarly, for the case with lighting control of Table 5, when the angle of the window shutters is 0 degrees, it can be clearly seen that the average illuminance was controlled to less than 500 lux using the lighting control unit. Likewise, the obtained energy consumption significantly decreases to less than in the case of without lighting control in Table 4; this emphasizes that the lighting control with daylighting can significantly benefit energy savings in the building. The illumination and electrical parameters (such as voltage, current and real power) were additionally measured every 10 min (and manually monitored every 1 min) to understand the variation with time so that the illuminance and electrical parameters could be logged every 30 min with a Fluke 435-II power quality meter. The obtained results of various periods of time are shown in Figure 7.
Figure 7 shows the relation between the electrical parameters of the experimental setup unit, including the voltage, current, real power and average illuminance and the time from 8.00 a.m. to 4.00 p.m. A comparison between the fluorescent luminaire without and with the lighting control unit was also performed with various aperture angles of the window shutters. First, considering Figure 7a, it can be clearly seen that the voltage fluctuates in a narrow range throughout the day because the daylight does not cause a significant voltage change. Based on a further analysis of Figure 7a, it can be observed that when the angle of the window shutters is 45 degrees, the level of voltage was highest and more than in the case without lighting control.
Considering Figure 7b, it can clearly be seen that when the aperture angle of the window shutters was varied with the control unit, the obtained current is significantly decreased in comparison with the case without the lighting control, by a factor of two. It can be further observed that when the aperture angle of the window shutters is increased, the current tends to decrease. This is because decreasing the T5 fluorescent luminaire light output requires that the dimmable electronic ballast reduce the output current corresponding to the amount of daylight passing through the window shutters.
Considering Figure 7c, it can clearly be seen that the trend of real power is similar to that of the current level according to the amount of daylight that passes through the window shutters. Hence, when the aperture angle of the window shutters is increased, the obtained current tends to decrease, as previously mentioned. Moreover, when the aperture angle of the window shutters is varied with the lighting control, as shown in Figure 7c, the real power tends to significantly decrease in comparison to the case without the lighting control to values 2–4 times smaller; this emphasizes that the lighting control unit can reduce energy consumption as a result of the variation of daylight.
Finally, from Figure 7d, it can be clearly seen that when as the aperture angle of the window shutters is varied with the lighting control, the average illuminance steadily increases in the morning and peaks around midday before steadily decreasing in the late afternoon. It can be further observed that the average illuminance without the lighting control is more than 1000 lux, as shown in Table 4 and Table 5, so the obtained average illuminance without the lighting control unit is ignored from Figure 7d. This result shows that installing the lighting control with daylighting, both the average illuminance and energy consumption for each time period decreases compared to the case without the lighting control unit, as the lighting control unit tries to set the average illuminance on the task area to less than 500 lux, corresponding with the amount of daylight that passes through the window shutters. This confirms the effectiveness of the proposed lighting control unit with daylighting.

5. Discussion

The goal of energy conservation is to reduce the consumption of energy resources. Lighting is one of the major sources of energy consumption in buildings and exterior applications, so it is one of the prime targets of mandatory standards to reduce energy consumption. This paper presented a study of the performance of lighting control with daylighting for T5 fluorescent luminaires to reduce the energy consumption in a building. The research has been divided into two parts: a simulation on a lecture room using DIALux software and an experiment on T5 fluorescent luminaire lighting control using an experimental test unit. The simulation showed that that the lecture room with T5 fluorescent luminaires and a window allowing daylight to pass through increases the illuminance on the task area, especially in the section near the window but the energy consumption index (in watts per square meter) remains unchanged for each time period (or daylight). To overcome this problem, the lighting control with daylighting must properly control the illuminance of the task area at the desired value to maintain an appropriate average illuminance level and thereby reduce energy consumption.
In the experiment with the test unit, the average illuminance on the task area was also measured, which is necessary for the lighting control unit to set the light output according to the standard (less than 500 lux) while reducing the real power consumption and decreasing the average illuminance. The result from the experimental setup shows that upon installing the lighting control unit, the dimmable electronic ballast is able to decrease the output current level and thereby reduce the power consumption of the T5 fluorescent luminaire. This illustrates that when applying the proposed control unit with actual building, the sensor will detect higher luminance than black surface in experimental setup due to luminance value that sensor obtains, which consists of natural light, artificial light and reflection from surface. Hence, the energy consumption can be further decreased. This result is useful for designing and installing daylighting systems in buildings to fully harvest natural light and increase the energy efficiency of the lighting system. The electricity consumption of the lighting can be significantly reduced if the lighting control with daylighting is integrated with the fluorescent lamps popularly used currently. The typical building lighting system contains considerably more luminaires than the number used in the experimental setup unit and the architecture of the window is also different. Future work would study the use of T5 fluorescent luminaire lighting control with advanced wireless control systems in a building environment to evaluate the performance of the lighting control unit in terms of reducing the power consumption of the lighting system while maintaining an average illuminance on task area according to relevant standards.

6. Conclusions

This research has presented the T5 luminaire daylighting control unit that reduce energy consumption while maintain illuminance on workplane. The prototype has been tested its performance on actual field test by built an experimental setup. The methodology and result compare to previous research from literature review, it can be seen that many researches mainly focus on control strategy, application or case studies. While this research focus on various perspective from the impact of daylight on workplane on different period of time; the control strategy to reduce energy consumption and maintain illuminance on workplane, performance of prototypes on actual field test with various level of daylight inlet into workplane via louver system and the electrical parameter over the period that control unit working.
Result from simulation has shown that daylighting has positive impact on illuminance on workplane by increase it significantly. While the result from experimental setup shown that proposed control unit can adjust illuminance on workplane within standard value. The power measurement from power meter shown that energy consumption has been reduce significantly proportionate to light output from luminaire. The proposed of prototypes unit are small enough to installed within luminaire. So, it can be installed to building lighting system that has potential daylight through window. The result showed that the proposed lighting control could achieve significant energy saving in lighting system while maintain lighting quality in term of illuminance on workplane within standard value; the real power tends to significantly decrease in comparison to the case without the lighting control to 2 times smaller value. The energy consumption that can be reduce from installed proposed daylight control unit can indirectly benefit environmental issue from improve energy efficiency in building and with large scale installation it can further reduce fossil fuel usage to generate electricity.

Author Contributions

S.B. conceived, designed the experiments and analyzed the data. A.N. conduct the experiment and wrote the paper.

Funding

The research is funding (No. 2558A11802136) by the National Research Council of Thailand and the King Mongkut’s Institute of Technology Ladkrabang Research Fund.

Acknowledgments

The work presented in this paper is part of a research project sponsored (No. 2558A11802136) by the National Research Council of Thailand and the King Mongkut’s Institute of Technology Ladkrabang Research Fund. The authors would like to thank them for their financial support.

Conflicts of Interest

The authors declare no conflict of interest.

References

  1. Energy Policy and Planning Office (EPPO), Ministry of Energy. Energy Statistics of Thailand 2017; EPPO: Bangkok, Thailand, 2017. [Google Scholar]
  2. Energy Policy and Planning Office (EPPO), Ministry of Energy. Energy Efficiency Plan 2015; EPPO: Bangkok, Thailand, 2015. [Google Scholar]
  3. Energy Policy and Planning Office (EPPO), Ministry of Energy. Thailand 20 Year Energy Efficiency Development Plan (EEDP); EPPO: Bangkok, Thailand, 2015. [Google Scholar]
  4. Lombard, C.; Mathews, E.H.; Kleingeld, M. Demand-Side Management through thermal efficiency in South African houses. Energy Build. 1999, 29, 229–239. [Google Scholar] [CrossRef]
  5. Lay, J.; Ondraczek, J.; Stoever, J. Renewables in the energy transition: Evidence on solar home systems and lighting fuel choice in Kenya. Energy Econ. 2013, 40, 350–359. [Google Scholar] [CrossRef] [Green Version]
  6. Chan, A.T.; Yeung, V.C.H. Implementing building energy codes in Hong Kong: Energy savings, environmental impacts and cost. Energy Build. 2005, 37, 631–642. [Google Scholar] [CrossRef]
  7. Li, Z.; Quan, S.J.; Yang, P.P.J. Energy performance simulation for planning a low carbon neighborhood urban district: A case study in the city of Macau. Habitat Int. 2016, 53, 206–214. [Google Scholar] [CrossRef]
  8. Krarti, M. Evaluation of large scale building energy efficiency retrofit program in Kuwait. Renew. Sustain. Energy Rev. 2015, 50, 1069–1080. [Google Scholar] [CrossRef]
  9. Sahoo, S.K.; Varma, P.; Lall, K.P.; Talwar, C.K. Energy efficiency in India: Achievements, challenges and legality. Energy Policy 2016, 88, 495–503. [Google Scholar] [CrossRef]
  10. Lopes, L.; Hokoi, S.; Miura, H.; Shuhei, K. Energy efficiency and energy savings in Japanese residential buildings—Research methodology and surveyed results. Energy Build. 2005, 37, 698–706. [Google Scholar] [CrossRef]
  11. Chandel, S.S.; Sharma, A.; Marwaha, B.M. Review of energy efficiency initiatives and regulations for residential buildings in India. Renew. Sustain. Energy Rev. 2016, 54, 1443–1458. [Google Scholar] [CrossRef]
  12. Jaber, S.; Ajib, S. Optimum, technical and energy efficiency design of residential building in Mediterranean region. Energy Build. 2011, 43, 1829–1834. [Google Scholar] [CrossRef]
  13. Ozturk, M.; Yuksel, Y.E. Energy structure of Turkey for sustainable development. Renew. Sustain. Energy Rev. 2016, 53, 1259–1272. [Google Scholar] [CrossRef]
  14. Mangan, S.D.; Oral, G.K. Assessment of residential building performances for the different climate zones of Turkey in terms of life cycle energy and cost efficiency. Energy Build. 2016, 110, 362–376. [Google Scholar] [CrossRef]
  15. Kusumadewi, T.V.; Limmeechokchai, B. Energy Efficiency Improvement and CO2 Mitigation in Residential Sector: Comparison between Indonesia and Thailand. Energy Procedia 2015, 79, 994–1000. [Google Scholar] [CrossRef]
  16. Huang, B.; Mauerhofer, V.; Geng, Y. Analysis of existing building energy saving policies in Japan and China. J. Clean. Prod. 2016, 112, 1510–1518. [Google Scholar] [CrossRef]
  17. Zhou, Z.; Zhang, S.; Wang, C.; Zuo, J.; He, Q.; Rameezdeen, R. Achieving energy efficient buildings via retrofitting of existing buildings: A case study. J. Clean. Prod. 2016, 112, 3605–3615. [Google Scholar] [CrossRef]
  18. Foran, T.; Pont, P.T.D.; Parinya, P.; Phumaraphand, N. Securing energy efficiency as a high priority: Scenarios for common appliance electricity consumption in Thailand. Energy Effic. 2010, 3, 347–364. [Google Scholar] [CrossRef]
  19. Gangolells, M.; Casals, M.; Forcada, N.; Macarulla, M.; Cuerva, E. Energy mapping of existing building stock in Spain. J. Clean. Prod. 2016, 112, 3895–3904. [Google Scholar] [CrossRef] [Green Version]
  20. Marshall, E.; Steinberger, J.K.; Dupont, V.J.; Foxon, T.J. Combining energy efficiency measure approaches and occupancy patterns in building modelling in the UK residential context. Energy Build. 2016, 111, 98–108. [Google Scholar] [CrossRef]
  21. Tiangket, A.; Chullabodhi, B.; Pas, K.E.O.; Watechagit, S. The Energy Saving Calculation for a Residential Sector in Thailand with Top-Down Methodology. Energy Procedia 2015, 79, 415–422. [Google Scholar] [CrossRef]
  22. Gago, E.J.; Garcia, J.O.; Estrella, A.E. Development of an energy model for the residential sector: Electricity consumption in Andalusia, Spain. Energy Build. 2011, 43, 1315–1321. [Google Scholar] [CrossRef]
  23. Zhang, T.; Siebers, P.O.; Aickelin, U. Modelling electricity consumption in office buildings: An agent based approach. Energy Build. 2011, 43, 2882–2892. [Google Scholar] [CrossRef] [Green Version]
  24. Taniguchi, A.; Inoue, T.; Otsuki, M.; Yamaguchi, Y.; Shimoda, Y.; Takami, A.; Hanaoka, K. Estimation of the contribution of the residential sector to summer peak demand reduction in Japan using an energy end-use simulation model. Energy Build. 2016, 112, 80–92. [Google Scholar] [CrossRef]
  25. Kialashaki, A.; Reisel, J.R. Modeling of the energy demand of the residential sector in the United States using regression models and artificial neural networks. Appl. Energy 2013, 108, 271–280. [Google Scholar] [CrossRef]
  26. Wang, L.; Mathew, P.; Pang, X. Uncertainties in energy consumption introduced by building operations and weather for a medium-size office building. Energy Build. 2012, 53, 152–158. [Google Scholar] [CrossRef] [Green Version]
  27. Rezaie, B.; Esmailzadeh, E.; Dincer, I. Renewable energy options for buildings: Case studies. Energy Build. 2011, 43, 56–65. [Google Scholar] [CrossRef]
  28. Kumar, P.S.; Biswas, S.; Kumari, S. Building integrated photovoltaic generation system. In Proceedings of the 2014 1st International Conference on Non Conventional Energy (ICONCE), Kalyani, India, 16–17 January 2014; pp. 80–83. [Google Scholar]
  29. Hongxing, Y.; Yuyan, F. Building-integrated photovoltaic application—Its practice in Hong Kong. In Proceedings of the 3rd World Conference on Photovoltaic Energy Conversion, Osaka, Japan, 11–17 May 2003; pp. 2490–2493. [Google Scholar]
  30. Fathabadi, H. Increasing energy efficiency of PV-converter-battery section of standalone building integrated photovoltaic systems. Energy Build. 2015, 101, 1–11. [Google Scholar] [CrossRef]
  31. Zhang, W.; Liu, S.; Li, N.; Xie, H.; Li, X. Development forecast and technology roadmap analysis of renewable energy in buildings in China. Renew. Sustain. Energy Rev. 2015, 49, 395–402. [Google Scholar] [CrossRef]
  32. Escriva, G.E. Basic actions to improve energy efficiency in commercial buildings in operation. Energy Build. 2011, 43, 3106–3111. [Google Scholar] [CrossRef]
  33. Danny Harvey, L.D. Reducing energy use in the building sector: Measures, costs, and examples. Energy Effic. 2009, 2, 139–163. [Google Scholar] [CrossRef]
  34. Tan, B.; Yavuz, Y.; Otay, E.N.; Çamlıbel, E. Optimal selection of energy efficiency measures for energy sustainability of existing buildings. Comput. Oper. Res. 2016, 66, 258–271. [Google Scholar] [CrossRef]
  35. Lee, D.; Cheng, C.C. Energy savings by energy management systems: A review. Renew. Sustain. Energy Rev. 2016, 56, 760–777. [Google Scholar] [CrossRef]
  36. Nisiforou, O.A.; Poullis, S.; Charalambides, A.G. Behaviour, attitudes and opinion of large enterprise employees with regard to their energy usage habits and adoption of energy saving measures. Energy Build. 2012, 55, 299–311. [Google Scholar] [CrossRef]
  37. Sasidharan, N.; Madhu, M.N.; Singh, J.G.; Ongsakul, W. An approach for an efficient hybrid AC/DC solar powered Homegrid system based on the load characteristics of home appliances. Energy Build. 2015, 108, 23–35. [Google Scholar] [CrossRef]
  38. Prasartkaew, B.; Kumar, S. Design of a renewable energy based air-conditioning system. Energy Build. 2014, 68, 156–164. [Google Scholar] [CrossRef]
  39. Bukoski, J.; Gheewala, S.H.; Mui, A.; Smead, M.; Chirarattananon, S. The life cycle assessment of a solar-assisted absorption chilling system in Bangkok, Thailand. Energy Build. 2014, 72, 150–156. [Google Scholar] [CrossRef]
  40. Promjiraprawat, K.; Winyuchakrit, P.; Limmeechokchai, B.; Masui, T.; Hanaoka, T.; Matsuoka, Y. CO2 mitigation potential and marginal abatement costs in Thai residential and building sectors. Energy Build. 2014, 80, 631–639. [Google Scholar] [CrossRef]
  41. Ryckaert, W.R.; Lootens, C.; Geldof, J.; Hanselaer, P. Criteria for energy efficient lighting in buildings. Energy Build. 2010, 42, 341–347. [Google Scholar] [CrossRef]
  42. Garcia, E.J.P.; Chen, A.; Santiago, I.; Outeiriño, F.J.B.; Arias, J.M.F.; Munoz, A.M. Stochastic model for lighting’s electricity consumption in the residential sector. Impact of energy saving actions. Energy Build. 2015, 89, 245–259. [Google Scholar] [CrossRef]
  43. Yang, H.; Lee, Y. Lighting Scheduling for Energy Saving in Smart House Based on Life Log Data. Procedia Environ. Sci. 2014, 22, 403–413. [Google Scholar] [CrossRef]
  44. Yun, G.Y.; Kim, H.; Kim, J.T. Effects of occupancy and lighting use patterns on lighting energy consumption. Energy Build. 2012, 46, 152–158. [Google Scholar] [CrossRef]
  45. Zhou, X.; Yan, D.; Hong, T.; Ren, X. Data analysis and stochastic modeling of lighting energy use in large office buildings in China. Energy Build. 2015, 86, 275–287. [Google Scholar] [CrossRef] [Green Version]
  46. Preston, D.J.; Woodbury, K.A. Cost-benefit analysis of retrofit of high-intensity discharge factor lighting with energy-saving alternatives. Energy Effic. 2013, 6, 255–269. [Google Scholar] [CrossRef]
  47. Lam, J.C.W.; Hui, J.C.Y.; Jain, P.K. A Dimmable High Power Factor Single-Switch Electronic Ballast for Compact Fluorescent Lamps With Incandescent Phase-Cut Dimmers. IEEE Trans. Ind. Electron. 2012, 59, 1879–1888. [Google Scholar] [CrossRef]
  48. Chiradeja, P.; Ngaopitakkul, A.; Jettanasen, C. Energy savings analysis and harmonics reduction for the electronic ballast of T5 fluorescent lamp in a building’s lighting system. Energy Build. 2015, 97, 107–117. [Google Scholar] [CrossRef]
  49. Wang, S.C.; Chen, Y.L.; Lin, H.B.; Shen, K.Y.; Huang, K.C. Realization of a High-Efficiency T5 Ballast with Multi-dimming Mechanisms Based on Lamp Arc Modeling. In Proceedings of the 8th IEEE Conference on Industrial Electronics and Applications (ICIEA), Melbourne, Australia, 19–21 June 2013; pp. 1077–1082. [Google Scholar]
  50. Principi, P.; Fioretti, R. A comparative life cycle assessment of luminaires for general lighting for the office—Compact fluorescent (CFL) vs Light Emitting Diode (LED)—A case study. J. Clean. Prod. 2014, 83, 96–107. [Google Scholar] [CrossRef]
  51. Ahn, B.L.; Jang, C.Y.; Leigh, S.B.; Yoo, S.; Jeong, H. Effect of LED lighting on the cooling and heating loads in office buildings. Appl. Energy 2014, 113, 1484–1489. [Google Scholar] [CrossRef]
  52. Tetri, E.; Sarvaranta, A.; Syri, S. Potential of new lighting technologies in reducing household lighting energy use and CO2 emissions in Finland. Energy Effic. 2014, 7, 559–570. [Google Scholar] [CrossRef]
  53. Carrillo, C.; Dorado, E.D.; Cidras, J.; Pregal, A.B.; Falcon, P.; Fernandez, A.; Sanchez, A.A. Lighting control system based on digital camera for energy saving in shop windows. Energy Build. 2013, 59, 143–151. [Google Scholar] [CrossRef]
  54. Soori, P.K.; Vishwas, M. Lighting control strategy for energy efficient office lighting system design. Energy Build. 2013, 66, 329–337. [Google Scholar] [CrossRef]
  55. Wang, Y.; Dasgupta, P. Designing an adaptive lighting control system for smart buildings and homes. In Proceedings of the IEEE 12th International Conference on Networking, Sensing and Control (ICNSC), Taipei, Taiwan, 9–11 April 2015; pp. 450–455. [Google Scholar]
  56. Yin, C.; Stark, B.; Chen, Y.Q.; Zhong, S.M.; Lau, E. Fractional-order adaptive minimum energy cognitive lighting control strategy for the hybrid lighting system. Energy Build. 2015, 87, 176–184. [Google Scholar] [CrossRef]
  57. Manganelli, M.; Consalvi, R. Design and energy performance assessment of high-efficiency lighting systems. In Proceedings of the IEEE 15th International Conference on Environment and Electrical Engineering (EEEIC), Rome, Italy, 10–13 June 2015; pp. 1035–1040. [Google Scholar]
  58. Yi, Y.K. Adaptation of Kriging in daylight modeling for energy simulation. Energy Build. 2016, 111, 479–496. [Google Scholar] [CrossRef]
  59. Tsuei, C.H.; Sun, W.S. Simulating the Illuminance and Efficiency of Sunlight/LED Hybrid Illuminating System Used in Indoor Lighting Design. In Proceedings of the 2009 Symposium on Photonics and Optoelectronics, Wuhan, China, 14–16 August 2009; pp. 1–4. [Google Scholar]
  60. Mayhoub, M.; Carter, D. A feasibility study for hybrid lighting systems. Energy Build. 2012, 53, 83–94. [Google Scholar] [CrossRef]
  61. Fasi, M.A.; Budaiwi, I.M. Energy performance of windows in office buildings considering daylight integration and visual comfort in hot climates. Energy Build. 2015, 108, 307–316. [Google Scholar] [CrossRef]
  62. Gentile, N.; Dubois, M.C.T.; Laike, T. Daylight harvesting control systems design recommendations based on a literature review. In Proceedings of the IEEE 15th International Conference on Environment and Electrical Engineering (EEEIC), Rome, Italy, 10–13 June 2015; pp. 632–637. [Google Scholar]
  63. Parise, L.; Lamonaca, F.; Carnì, D.L. Interior lighting control system: A practical case using daylight harvesting control strategy. In Proceedings of the 2015 IEEE 15th International Conference on Environment and Electrical Engineering (EEEIC), Rome, Italy, 10–13 June 2015; pp. 719–724. [Google Scholar]
  64. Verso, V.R.M.L.; Invernizzi, S.; Carlin, A.; Polato, A. Towards the factory of the future: A new concept based on optimized daylighting for comfort and energy saving. In Proceedings of the 2015 IEEE 15th International Conference on Environment and Electrical Engineering (EEEIC), Rome, Italy, 10–13 June 2015; pp. 701–706. [Google Scholar]
  65. Kumar, R. New algorithms for daylight harvesting in a private office. In Proceedings of the 2015 18th International Conference on Information Fusion (Fusion), Washington, DC, USA, 6–9 July 2015; pp. 383–392. [Google Scholar]
  66. Hansen, V.G.; Edmonds, I. Methods for the illumination of multilevel buildings with vertical light pipes. Sol. Energy 2015, 117, 74–88. [Google Scholar] [CrossRef] [Green Version]
  67. Seo, D.; Park, L.; Ihm, P.; Krarti, M. Optimal electrical circuiting layout and desk location for daylighting controlled spaces. Energy Build. 2012, 51, 122–130. [Google Scholar] [CrossRef]
  68. Caicedo, D.; Pandharipande, A. Sensor-Driven Lighting Control with Illumination and Dimming Constraints. IEEE Sens. J. 2015, 15, 5169–5176. [Google Scholar] [CrossRef]
  69. Fonseca, R.W.D.; Didone, E.L.; Pereira, F.O.R. Using artificial neural networks to predict the impact of daylighting on building final electric energy requirements. Energy Build. 2013, 61, 31–38. [Google Scholar] [CrossRef]
  70. Gorgulu, S.; Ekren, N. Energy saving in lighting system with fuzzy logic controller which uses light-pipe and dimmable ballast. Energy Build. 2013, 61, 172–176. [Google Scholar] [CrossRef]
  71. Bellia, L.; Fragliasso, F.; Pedace, A. Evaluation of Daylight Availability for Energy Savings. J. Daylighting 2015, 2, 12–20. [Google Scholar] [CrossRef]
  72. Parise, G.; Martirano, L. Daylight Impact on Energy Performance of Internal Lighting. IEEE Trans. Ind. Appl. 2013, 49, 242–249. [Google Scholar] [CrossRef]
  73. Li, D.H.W. A review of daylight illuminance determinations and energy implications. Appl. Energy 2010, 87, 2109–2118. [Google Scholar] [CrossRef]
  74. Kyle, K.; Lee, E.S. Measured daylighting potential of a static optical louver system under real sun and sky conditions. Build. Environ. 2015, 92, 347–359. [Google Scholar] [Green Version]
  75. Acosta, I.; Munoz, C.; Campano, M.A.; Navarro, J. Analysis of daylight factors and energy saving allowed by windows under overcast sky conditions. Renew. Energy 2015, 77, 194–207. [Google Scholar] [CrossRef]
  76. Sudan, M.; Tiwari, G.N.; Helal, I.M.A. A daylight factor model under clear sky conditions for building: An experimental validation. Sol. Energy 2015, 115, 379–389. [Google Scholar] [CrossRef]
  77. Bellia, L.; Pedace, A.; Fragliasso, F. Dynamic daylight simulations: Impact of weather file’s choice. Sol. Energy 2015, 117, 224–235. [Google Scholar] [CrossRef]
  78. Edwards, L.; Torcellini, P. A Literature Review of the Effects of Natural Light on Building Occupants; National Renewable Energy Laboratory: Golden, CO, USA, 2002.
  79. Konis, K.S. Effective Daylighting: Evaluating Daylighting Performance in the San Francisco Federal Building from the Perspective of Building Occupants. Ph.D. Thesis, University of California, Berkeley, CA, USA, 2011. [Google Scholar]
  80. Comité Européen de Normalisation (CEN). EN 12464-1: Light and Lighting—Lighting of Work Places, Part 1: Indoor Work Places; CEN: Brussels, Belgium, 2002. [Google Scholar]
  81. International Commission on Illumination (CIE). CIE S 008/E: 2001: Lighting of Work Places—Part 1: Indoor; CIE: Vienna, Austria, 2001. [Google Scholar]
Figure 1. Detail of Lecture room using in simulation: (a) Lecture room drawn in the DIALux program; (b) Lecture room layout for fluorescent luminaire fixtures in the DIALux program; (c) Floor plan of lecture room; (d) Detail of luminaire layout in lecture room.
Sustainability 10 04075 g001
Figure 2. Polar curve of the T5 luminaire used in Simulation.
Sustainability 10 04075 g002
Figure 3. Isolux diagram and false color rendering on the task area of the lecturer room with fluorescent T5 and daylight at various times: (a) without daylight; (b) 8 a.m.; (c) 10 a.m.; (d) 12 a.m.; (e) 2 p.m.; (f) 4 p.m.
Sustainability 10 04075 g003aSustainability 10 04075 g003b
Figure 4. Panel of experimental setup unit: (a) details of experimental setup; (b) interior of experimental setup; (c) side view of experimental setup; and (d) illuminance control unit of experimental setup.
Sustainability 10 04075 g004aSustainability 10 04075 g004b
Figure 5. Diagram of T5 fluorescent daylight control experimental setup unit.
Sustainability 10 04075 g005
Figure 6. Flow chart of Lighting Control.
Sustainability 10 04075 g006
Figure 7. Relation between electrical parameters and periods of time within one day at various aperture angles of the window shutters: (a) the voltage level of the experimental setup; (b) T5 fluorescent luminaire current; (c) T5 fluorescent luminaire power; (d) Average illuminance on the task area.
Sustainability 10 04075 g007aSustainability 10 04075 g007b
Table 1. Electricity consumption for the whole country (classified by sector) [1].
YearResidential (GWh)Small General Service (GWh)Business (GWh)Industrial (GWh)Government and Non-Profit (GWh)Agriculture (GWh)Other (GWh)Total (GWh)Free of Charge (GWh)Grand Total (GWh)
201541,28642,46683,9841793873789172,0902743174,83341,286
201643,93244,63986,8782012673967179,8852963182,84743,932
201744,37445,10087,7721982984247181,9893135185,12444,374
Growth Rate (%)
20166.415.123.4512.40−30.874.704.537.994.586.41
20171.011.031.03−1.6611.567.071.175.811.251.01
Table 2. Data for T5 fluorescent lamp.
Type of LuminaireLuminous Flux (Lumen per Luminaires)Total Luminous Flux (Lumen)Luminaire Wattage (Watt per Luminaires)Total Wattage (Watt)
Fluorescent T5451667,73756840
Table 3. Obtained illuminance on workplane using DIALux in various time period.
TimeSurfaceReflectance Coefficient (%)Average Illuminance (lux)Minimum Illuminance (lux)Maximum Illuminance (lux)Uniformity of IlluminanceEnergy Consumption Index (Watt per Square Meter)
Without DaylightWorkplane-5361366940.2538.75
Floor20273425950.155
Ceiling70138481890.347
Walls5221517432-
8 a.m.Workplane-73933917360.4588.75
Floor20361837800.230
Ceiling70186702670.377
Walls5229026738-
10 a.m.Workplane-90136931710.4098.75
Floor204409813620.223
Ceiling70222893510.403
Walls52340361023-
12 a.m.Workplane-72433522360.4638.75
Floor203679510960.258
Ceiling70179712540.399
Walls5227129596-
2 p.m.Workplane-82234827870.4248.75
Floor2040210612350.263
Ceiling70203793160.388
Walls52312351000-
4 p.m.Workplane-61530910310.5038.75
Floor20309666240.214
Ceiling70156492150.318
Walls5223914501-
Table 4. Results from the experimental setup before and after installing the daylight control in T5 fluorescent at 3.00 p.m.
Angle (Degree)Before Installation of Daylight Control (without Lighting Control)
Voltage (V)Current (A)Real Power (W)Illuminance (Lux)
Luminaire 1Luminaire 2Average
226.10.576118108210261054.0
15°226.20.535119110711031105.0
30°226.50.538120110611091107.5
45°226.30.537119113211281130.0
Angle (Degree)After Installation of Daylight Control (with Lighting Control)
Voltage (V)Current (A)Real Power (W)Illuminance (Lux)
Luminaire 1Luminaire 2Average
226.80.30662365455410.0
15°226.90.29760335460397.5
30°226.80.28959380448414.0
45°226.60.26553394414404.0
Table 5. Results from the experimental test set before and after installing daylight control in the T5 fluorescent at 12.00 p.m.
Angle (Degree)Before Installation of Daylight Control (without Lighting Control)
Voltage (V)Current (A)Real Power (W)Illuminance (Lux)
Luminaire 1Luminaire 2Average
224.10.548119114110911116
15°223.10.536119131011861248
30°2240.532117111014281269
45°223.90.538118108515581321.5
Angle (Degree)After Installation of Daylight Control (with Lighting Control)
Voltage (V)Current (A)Real Power (W)Illuminance (Lux)
Luminaire 1Luminaire 2Average
224.20.28157462440451
15°223.80.24648590477533.5
30°2240.19335209610409.5
45°2240.1472260590325

