Article

Indoor/Outdoor Relationships of Airborne Particles under Controlled Pressure Difference across the Building Envelope in Korean Multifamily Apartments

1
Department of Architectural Engineering, College of Engineering, Kyungil University, Kyungsan 38428, Korea
2
Department of Architectural Engineering, College of Urban Sciences, University of Seoul, Seoul 02504, Korea
*
Author to whom correspondence should be addressed.
Sustainability 2018, 10(11), 4074; https://doi.org/10.3390/su10114074
Submission received: 22 September 2018 / Revised: 30 October 2018 / Accepted: 1 November 2018 / Published: 6 November 2018

Abstract

:
This study investigates indoor/outdoor relationships of airborne particles under controlled pressure difference across the building envelope in Korean multifamily apartments. On-site field experiments on 14 apartment housing units located in urban areas in Korea are conducted to measure the indoor/outdoor ratios of number concentrations of size-resolved particles (0.3–0.5, 0.5–1.0, 1.0–3.0, 3.0–5.0, 5.0–10.0, >10.0 μm). To set identical pressure difference conditions across the envelope of each housing unit for better comparison of I/O ratio results, and to examine the effect of pressure difference on the I/O relations, indoor–outdoor pressure difference was controlled at 10, 30, and 50 Pa using a blower door depressurization procedure. Simultaneously, the air leakage characteristics of housing units are measured using the typical blower door pressurization-depressurization test method to correlate air leakage data and I/O ratios. As expected, moderately airtight housing units (ACH50 ≤ 4.4) show lower I/O ratios than average leaky housing units (ACH50 > 4.4); still, the averaged I/O ratios of finer sized particles (0.3–0.5, 0.5–1.0, and 1.0–3.0 μm) in the moderately airtight housing units were 0.75, 0.59, and 0.61 at an I-O pressure difference of 50 Pa, and 0.62, 0.51, and 0.49 at 10 Pa. The study indicates that indoor residents in moderately airtight Korean multifamily housing units with relatively small envelope area can still be exposed to high concentrations of outdoor originated fine particles.

1. Introduction

Epidemiological evidence has suggested that outdoor air pollution due to particulate matter (PM) is associated with a prevalence of respiratory and cardiovascular diseases [1,2,3]. This outdoor air pollution has been a major public health concern in Asian Countries, including Korea [4,5,6,7,8]. Urbanization and high levels of traffic emissions are suggested to be the major sources of outdoor pollution [9,10,11,12]. Moreover, dust phenomena called Asian dust affect the area during the spring and winter seasons [13,14,15]. National measures have been undertaken to mitigate personal exposure to particles causing immediate or potential health risks. In Korea, the Meteorological Administration provides real-time regional particle concentration data online to advise sensitive groups to stay indoors when the hourly average PM10 concentration exceeds 400 μg/m3 for over two hours. Warnings are issued when the number exceeds 800 μg/m3 for over two hours, prohibiting all people from going outdoors [16].
Although staying indoors can be a safe choice, particles can penetrate through building leakage and become suspended indoors, resulting in occupant exposure to particles of outdoor origin [17]. Since most people spend over 85% of their time indoors, assessing indoor air quality is important for investigating the impact of particle exposure on human health [18]. Multifamily apartment buildings in Korea are typically built along roadsides for traffic convenience, and high-density building blocks create stagnant air, worsening outdoor air conditions. Housing units in apartments are generally located in the middle of a flat-type apartment building, so that the units are exposed only to ambient air at the front and rear sides of the units where penetration of outdoor particles is possible. These apartments are concrete bearing-wall buildings that limit airflow to and from adjacent units. At the same time, with the need to save energy and the development of construction technology, Korean multifamily apartment buildings are becoming airtight and high-rise. Air leakage pathways through building envelopes for multi-story apartment buildings may be reduced; however, pressure differences driven by wind and stack effects can be increased. As aging and new apartment buildings coexist in an urban area, the characteristics of air leakage and pressure difference applied along the envelope may be diverse, affecting particle infiltration, an important determinant of indoor concentrations of ambient particles [18].
Several studies have investigated the quantification of particle infiltration in residential settings experimentally [19,20,21,22,23,24,25,26]. In experimental field studies, single-family homes have been commonly studied with the aim of determining indices such as indoor/outdoor (I/O) ratios, infiltration factors, and penetration factors, which have been widely employed to explain the impact of ambient particles on indoor environments [19,20,21,22]. A few studies have focused on particle infiltration in other types of residences such as high-rise multi-unit homes. Chao et al. [23] suggested the need to evaluate small residences in high-rise buildings located in Asian cities where the ambient particle level is much higher, and their study measured particle penetration in six non-smoking naturally ventilated residences located in high-rise buildings in Hong Kong. Mullen et al. [24] investigated ultrafine particle number concentrations in four high-rise apartments in Beijing. Previous field studies measured outdoor and indoor particles in natural conditions without the control of indoor-outdoor (I-O) pressure differences, and they pointed out that pressure differences may influence infiltration results. In laboratory experimental settings, several studies were conducted on particle penetration under controlled pressure differences. Mosley et al. [25] performed a two-compartment laboratory chamber study measuring particle penetration at 2, 5, 10, and 20 Pa. Particles with diameters in the range of 0.05 to 5 μm were generated in one compartment and then transported through simulated leakage paths to the other compartment under the action of applied pressure differentials. Liu and Nazaroff [26] performed laboratory particle (0.02–7 μm) penetration tests under pressure differences of 4 and 10 Pa. These measurements attempted to simulate the entry of outdoor fine particles into the indoor environment through narrow horizontal slits at typical I-O pressure differences used as driving forces for the particle entry process. Although the previous studies have provided insight into the impact of pressure on particle transport through building cracks, those studies were conducted in laboratory settings with simulated indoor conditions, their correlation with actual residential settings is still in question.
The objective of this study is to investigate I/O ratios of airborne particles under controlled pressure difference across the building envelope in Korean multifamily apartments. 14 residential housing units within multifamily apartment buildings are tested using the blower-door depressurization procedure to estimate I/O ratios. The study contributes to give better understanding on how much outdoor particles affect the indoor environment under different I-O pressure difference across the envelope of multifamily apartment units.

2. Methods

2.1. Study Design

Both on-site field particle infiltration tests and air leakage tests were conducted in 14 apartment housing units located in urban city areas of Korea in 2016. The particle infiltration tests aimed to provide information on how much outdoor particles affect the indoor air. A particle infiltration test method using a blower-door depressurization procedure was applied to measure particle I/O ratios under controlled I-O pressure differences. The I/O ratios were measured without the influence of indoor particle sources to consider the outdoor particle infiltration only. In the particle infiltration test method, I-O pressure differences at the housing unit were controlled by the blower-door system to imitate the pressure difference experienced by high-rise apartment buildings, which enables multiple tests at various pressure differences on one test unit along with direct comparison of the I/O ratios among the test units under the same pressure difference. In parallel, airtightness tests were intended to characterize the air leakage of units using the blower-door fan depressurization/pressurization method in accordance with the ISO 9972 standard [27]. The blower-door airtightness tests estimate the effective leakage area (ELA), normalized leakage (NL), and the air change rate at 50 Pa (ACH50). The influences of air leakage characteristics and I-O pressure differences on particle infiltration were thereby investigated.

2.2. Description of Test Housing Units

The 14 non-smoking, naturally ventilated apartment housing units were chosen in three major cities in Korea (Seoul, Daegu, and Chungju). The units were selected to represent the various age and size of apartment units in Korea. The descriptions of housing units (Units 1 to 14) are summarized in Table 1. The units were built between 1979 and 2015, and the ages of the buildings ranged from 1 to 37 years. The ages of the buildings were calculated from the year 2016 when the experiments were conducted. The floor areas of the housing units ranged from 18 m2 to 212 m2 and the sizes of the units were from studio apartment to four-bedroom apartment size. All the units were one-story flat apartments with ceiling heights between 2.15 m and 2.30 m. The envelope areas varied from 13 m2 to 69 m2. Three larger apartments in this study had low ratio of envelope area to floor area (0.33–0.43). In contrast, the other smaller apartments had higher ratio of exterior wall area to floor area (0.50–0.95). The units were concrete bearing-wall apartments, which represents more than 50% of all housing in Korea [28]. Each housing unit was located in the middle of a flat-type apartment building, which enabled the units to be exposed only to ambient air at the front and rear sides of the housing units where infiltration of outdoor particles is possible. The housing units were designed for natural ventilation, using only a range hood in the kitchen and an exhaust fan in the bathroom. The residents in the units followed a barefoot lifestyle with frequent vacuuming and wiping with wet cloths.

2.3. Particle Infiltration Test Method Using the Blower-Door Depressurization Procedure

For the preparation of particle infiltration tests, all the tested housing units were unoccupied and then thoroughly vacuumed and wiped down with wet cloths prior to the experiment to ensure no indoor particle generation and resuspension during the experiment. The flooring in all the housing units was finished with wooden or vinyl flooring for convenience in cleaning, as Koreans are traditionally barefoot inside their homes. After cleaning the housing units, all air passages to adjacent units, such as range hoods in kitchens and exhaust fans in bathrooms, were sealed with Teflon vinyl sheets to consider only particle infiltration through the envelopes of the housing units. Electric outlets and water drainage holes including those connected to vertical shafts were also sealed for the infiltration tests.
After the housing units were prepared for the experiments, a blower door fan (Retrotec 3101 Blower Door System, Retrotec, Everson, WA, USA) was installed with a blower door frame system at the entrance door of each housing unit. Simultaneously, two identical particle counters (TSI 9306, TSI, Shoreview, MN, USA), which enable detection of the number of size-resolved particles (0.3–0.5, 0.5–1.0, 1.0–3.0, 3.0–5.0, 5.0–10.0, >10.0 μm), were installed indoors and outdoors, respectively. The particle counters were set to continuously measure the particle number concentration with one-minute duration for each sample and time interval of three minutes between samples. For quality assurance, all particle counters were calibrated immediately before the experiments. One of the particle counters was located 1.5 m above the floor in the middle of the living room, which is at the center of the housing units, while the other particle counter was located in the outdoor unit of the air conditioner, which was hung onto the outside exterior wall of the housing unit. After the test housing unit preparation and test equipment settings were completed, the particle infiltration test started with blower door depressurization. The details of I-O pressure differences considered in this experiment are described in the following section. The I/O ratios were calculated by averaging the measured indoor and outdoor concentration data after one time constant, equivalent to the reciprocal of the air change rate, for direct comparison of the I/O ratios among the test units.

2.4. Indoor-Outdoor Target Differential Pressure

The I-O pressure differences applied to the envelope for infiltration testing were set to investigate the effects of outdoor particles on the indoors at various differential pressure conditions experienced in urban high-rise, multi-story apartment buildings. The I-O target differential pressure was determined to reflect building envelope conditions in winter, when buoyancy causes significant stack effects and average wind speed is high. Negative pressure differences created indoors relative to the outdoors are the focus of studies considering the circumstances when outdoor air enters through cracks. Typically, the pressure differences between indoor and outdoor environments in single, low-story detached house are less than ±10 Pa [29]. Measured results for a typical two-story Finnish house equipped with a basement with an average building leakage rate showed pressure difference ranges of −3 Pa to +2 Pa at a temperature difference of 20 °C and −8 Pa to +3 Pa at a temperature difference of 40 °C [30]. Kalamees et al. [31] recommended a design value of ±10 Pa for the air pressure difference across the envelopes of detached houses. In the case of high-rise apartment buildings, much higher pressure differences have been reported. Jo et al. [32] conducted field measurements and airflow simulations to understand the characteristics of pressure distributions in high-rise apartment buildings during the winter period in Seoul. The study found that the pressure difference across the envelope ranged from approximately −25 Pa to 30 Pa in a high-rise apartment building with 69 floors above ground and three floors below ground. Considering the measured I-O pressure difference data shown in the previous study along with the worldwide trend of increasing heights of high-rise residential buildings and possible ambient wind effects, the I-O target pressure differential was set to 10, 30, and 50 Pa.

2.5. Air Leakage Testing of Housing Units

The typical fan pressurization and depressurization test method using a blower door (Retrotec 3101 Blower Door System, Retrotec, WA, USA) was applied to determine airtightness and other air leakage characteristics of the test housing units [33]. The test method uses a blower door installed on a main door to induce pressure differences across the envelope and to measure those pressure differences and the resulting airflows. The pressure inside the unit increased (or decreased) to 50 Pa by the blower door fan and reduced (or increased) gradually at 10-Pa intervals by regulating the fan speed. The same preparatory works as in infiltration testing in the test units were performed before leakage testing. All the air passages to adjacent units in the test units were sealed with Teflon vinyl sheets. The air leakage of housing units can be represented by a power-law equation, as shown in Equation (1).
Q = C · Δ P n
where Q is the air flow rate through the building envelope (m3·h−1), C is the flow coefficient (m3·h−1·Pa−n), and n is the pressure exponent (−).
The air leakage characteristics of the test units, the leakage coefficient (C), and pressure exponent (n) can be determined by measuring the I-O pressure difference (ΔP) and coincident fan flow rate (Q) [34]. By using the blower door data, effective leakage area (ELA), normalized leakage (NL), and air change rates at 50 Pa (ACH50) were estimated using Equations (2)–(4) to determine the air leakage characteristics of the test units, as follows:
ELA = C · Δ P ref ( n 0.5 ) · ( ρ 2 ) 0.5
NL = 1000 ( ELA A ) ( H H 0 ) 0.3
ACH 50 = Q 50 V
where ELA is the effective leakage area (m2), C is the building leakage coefficient, ΔPref is the reference pressure difference (Pa), n is the pressure exponent, and ρ is the air density (kg·m−3), NL is the normalized leakage (−), A is the floor area (m2), H0 is the height of a single story (m), and H is the height of the building (m), ACH50 is the air changes per hour at 50 Pa (h−1), Q50 is the airflow rate at 50 Pa (m3·h−1), and V is the volume of the space (m3).
ACH50 is a commonly used metric for air leakage, referring to the ratio of air leakage at 50 Pa as shown in Equation (4), and ELA is a measure of air leakage which quantifies the equivalent amount of holes in the envelope. For the calculation of ELA, 4 Pa was used as the reference pressure [34]. NL is a parameter used to normalize leakage by the size of the building for comparison purposes and to define leakage classes [34]. ASHRAE has developed a classification scheme according to normalized leakage ranges. Ten leakage classes were defined from the tightest class (A) to the loosest class (J). The leakage class scheme proposed by ASHRAE was adopted in this study for characterization of air leakage in the test housing units.

3. Results and Discussion

3.1. Outdoor Particle Concentration

The results of outdoor particle concentrations measured outside of each housing unit during the entire test period are shown in Figure 1. The grey bars refer to the measured values of outdoor particle number concentrations (0.3–0.5, 0.5–1.0, 1.0–3.0, 3.0–5.0, 5.0–10.0, and >10.0 μm) and the black bars refer to the 24-h mean of outdoor PM10 mass concentrations on the day when the test was conducted (provided by the Meteorological Administration in Korea [35]). The outdoor particle number concentrations at various sizes were measured, and real-time regional PM10 mass concentration data offered online by the Meteorological Administration were investigated in this study to understand the outdoor conditions during the test period. The outdoor particle number concentrations vary with the test unit, as each test was performed at a different time and location. The typical trend of increasing numbers for the smaller-sized particles and a small deviation of number concentrations for each particle size during the test period were observed. According to the Meteorological Administration in Korea, the 24-h mean PM10 concentration index is classified into four categories: good (0–30 μg m−3), average (31–80 μg m−3), bad (81–150 μg m−3), and very bad (151–600 μg m−3). Unit 14 was at the level of ‘bad’, Unit 11 was ‘good’, and the other units were in the condition of ‘average’. However, nine out of 14 housing units exceeded the WHO guideline of 50 μg m−3 according to the data of the 24-h mean PM10 concentration [36].

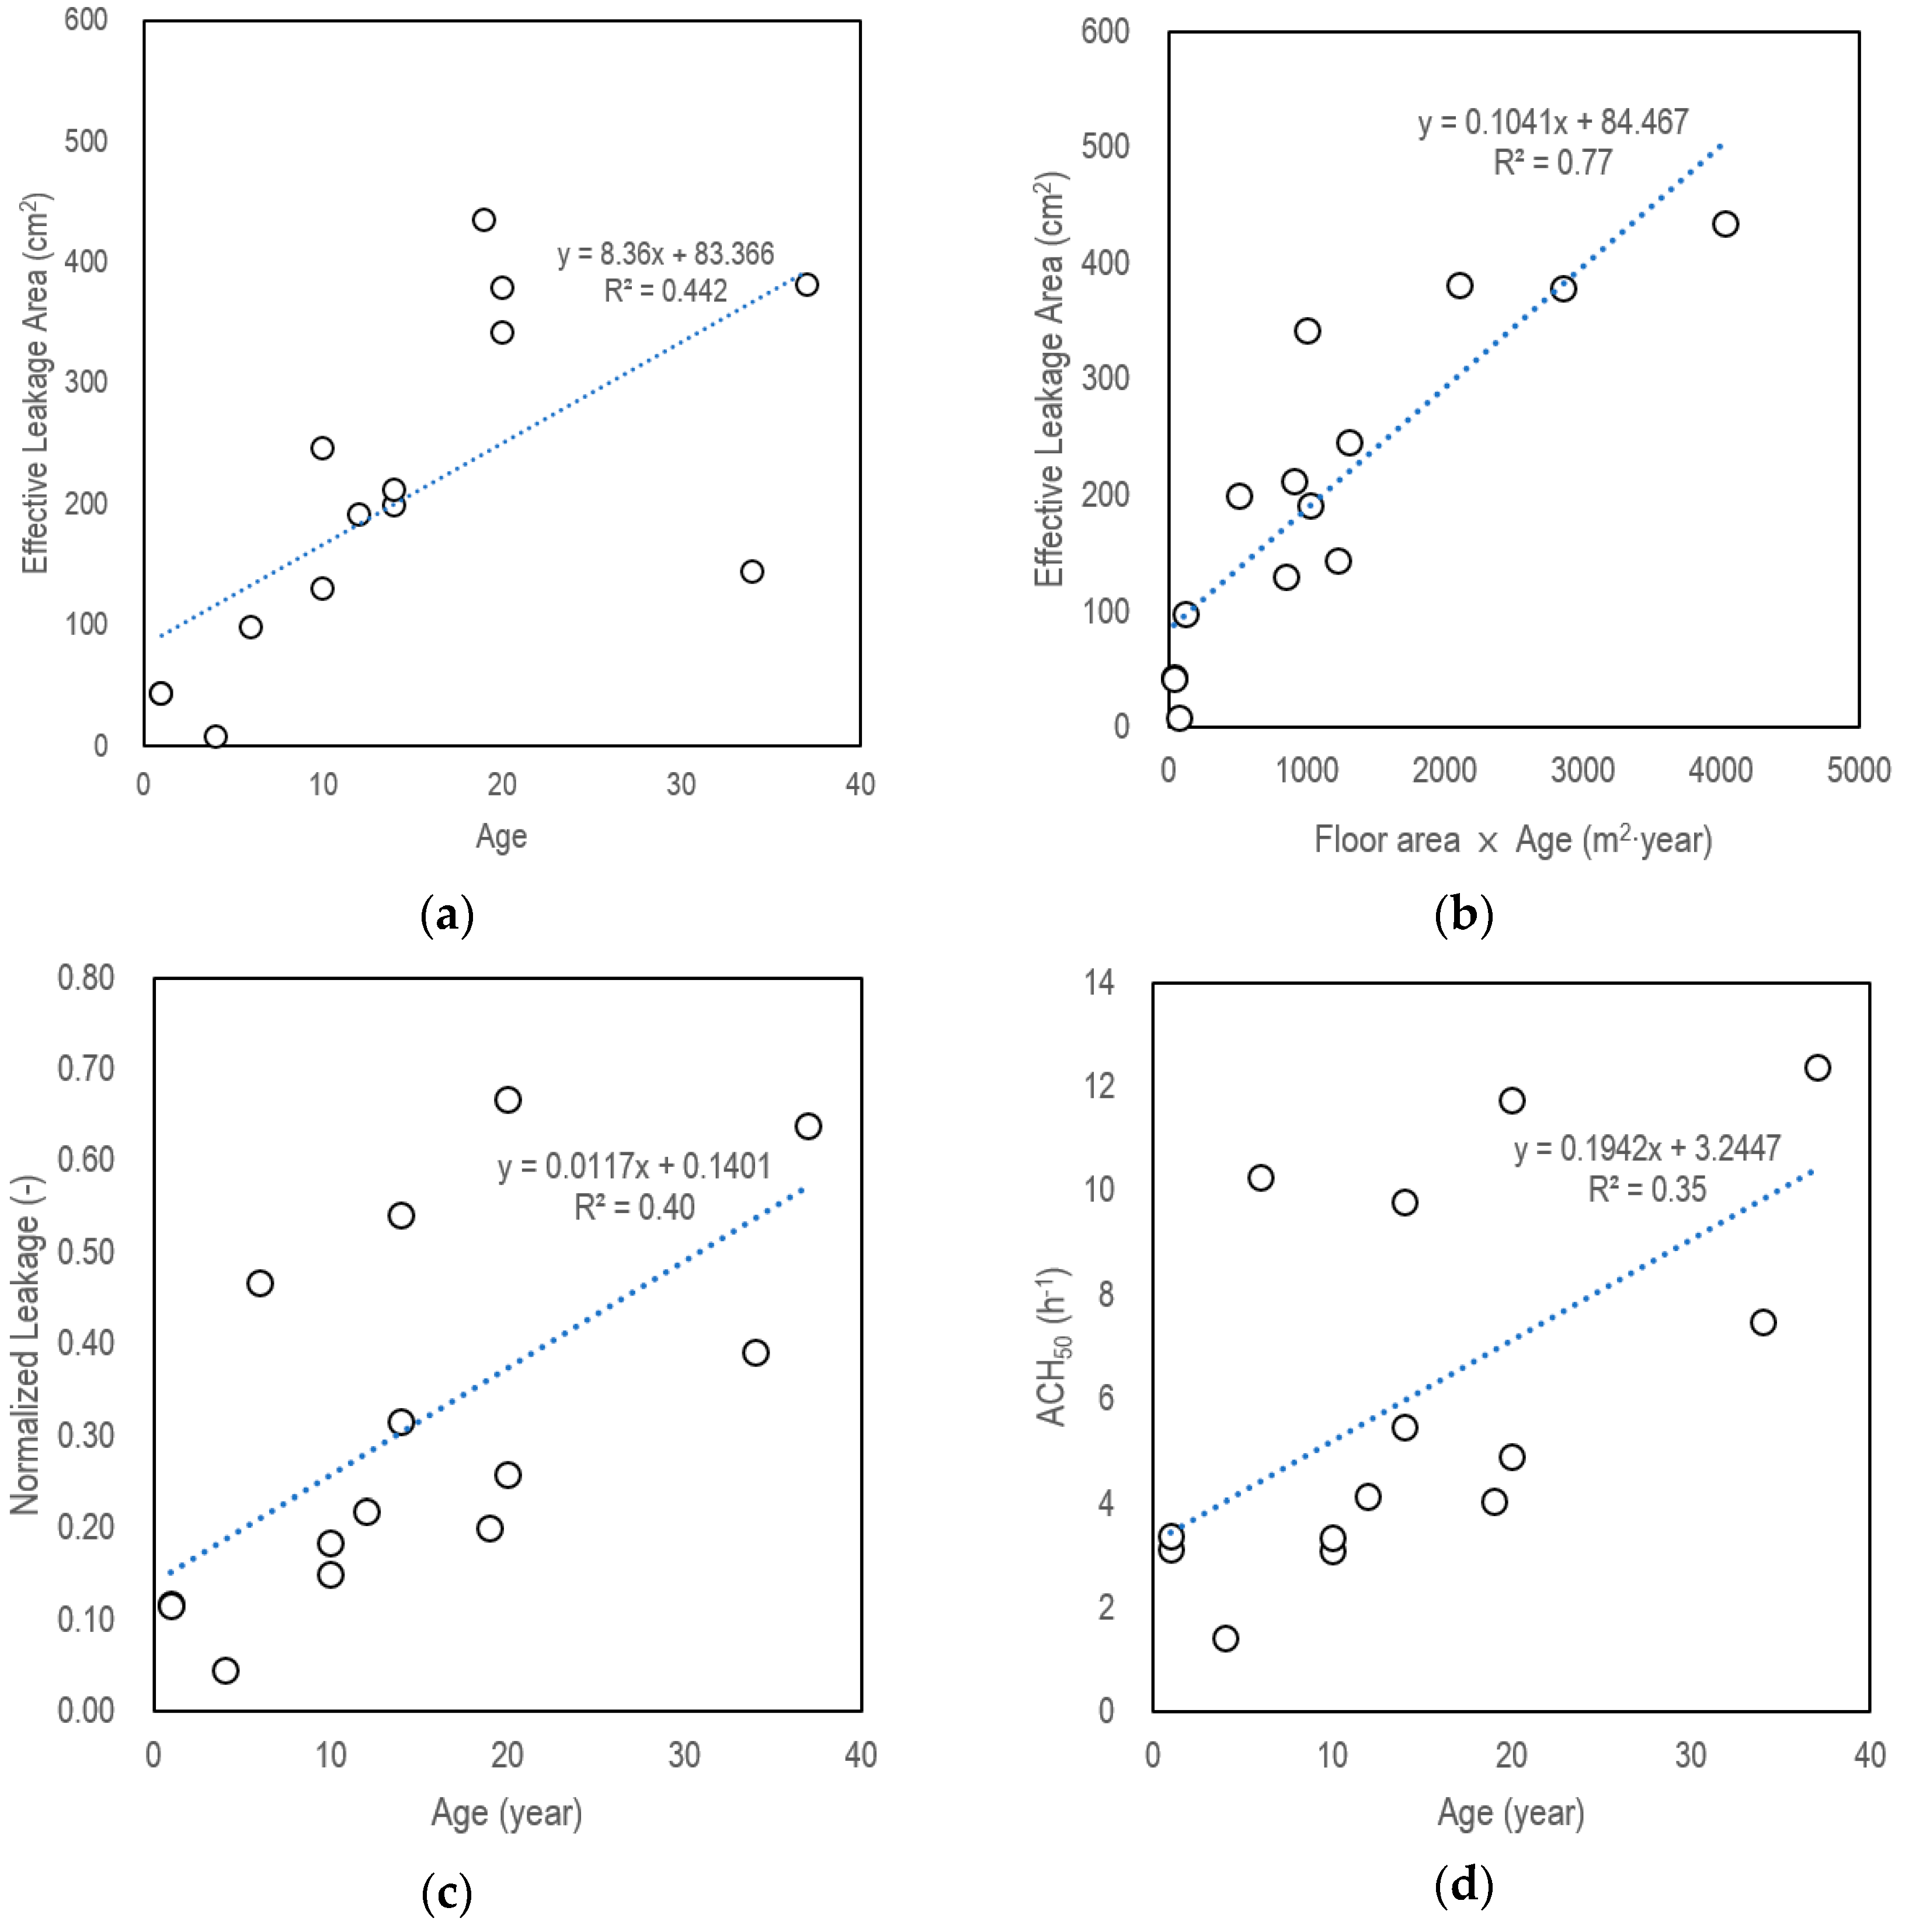
3.2. Air Leakage Characteristics

The results of air leakage characteristics obtained by the blower door test method for the 14 housing units are listed in Table 2. The air leakage characteristics included ELA, NL, and ACH50. The estimated values of the flow coefficients, C, and flow exponent, n, are also listed in the table. The flow exponent is usually determined according to the flow regime, generally being 0.5 for fully turbulent flow and 1.0 for laminar flow regimes. For buildings, flow exponent values ranging from approximately 0.6 to 0.7 are generally reported. The flow exponent values estimated in this study were between 0.6 and 0.8 which is within a reasonable range.
The 14 housing units tested in the study showed a wide range of leakages. The ELA values of test housing units ranged from 8.4 to 435.4 cm2 depending on the building age and floor area. Figure 2 shows the correlation results of the air leakage data with other relevant factors. The results suggested that the higher ELA values were observed for the older units with larger floor areas, as expected, showing a strong correlation coefficient (R2 = 0.77). The NL values were in the range of 0.05 to 0.64. The correlation between NL and building age was relatively weak, showing a low correlation coefficient (R2 = 0.35). According to the classification scheme developed by ASHRAE, leakage classes of A to J can be determined using the range of NL. The results of NL for 14 test housing units revealed that the units fall into categories between Classes A and G. One of the test units (Unit 12) had the lowest NL, resulting in its grouping into Class A, and two of the test units (Units 1 and 4) had the highest NL, resulting in Class G. The ACH50 values were estimated to be between 1.4 h−1 and 12.4 h−1. There was a relatively weak correlation between ACH50 and the age of housing units (R2 = 0.40). The units did not comply with the airtightness requirement for the Passivhaus standard, which states that ACH50 should be less than or equal to 0.6 h−1 at 50 Pa [37]. 7 out of 14 test units (Units 5, 8, 9, 10, 12, 13, and 14) met the requirement of 4.4 ACH50 developed by ASHRAE as an average value of current standards [37], while the other units (Units 1, 2, 3, 4, 6, 7, and 11) revealed values higher than 4.4 ACH50. For the analysis of the I/O ratio in the variation of leakage characteristics, the test housing units were classified into two groups: moderately airtight (ACH50 ≤ 4.4) and average leaky (ACH50 > 4.4).

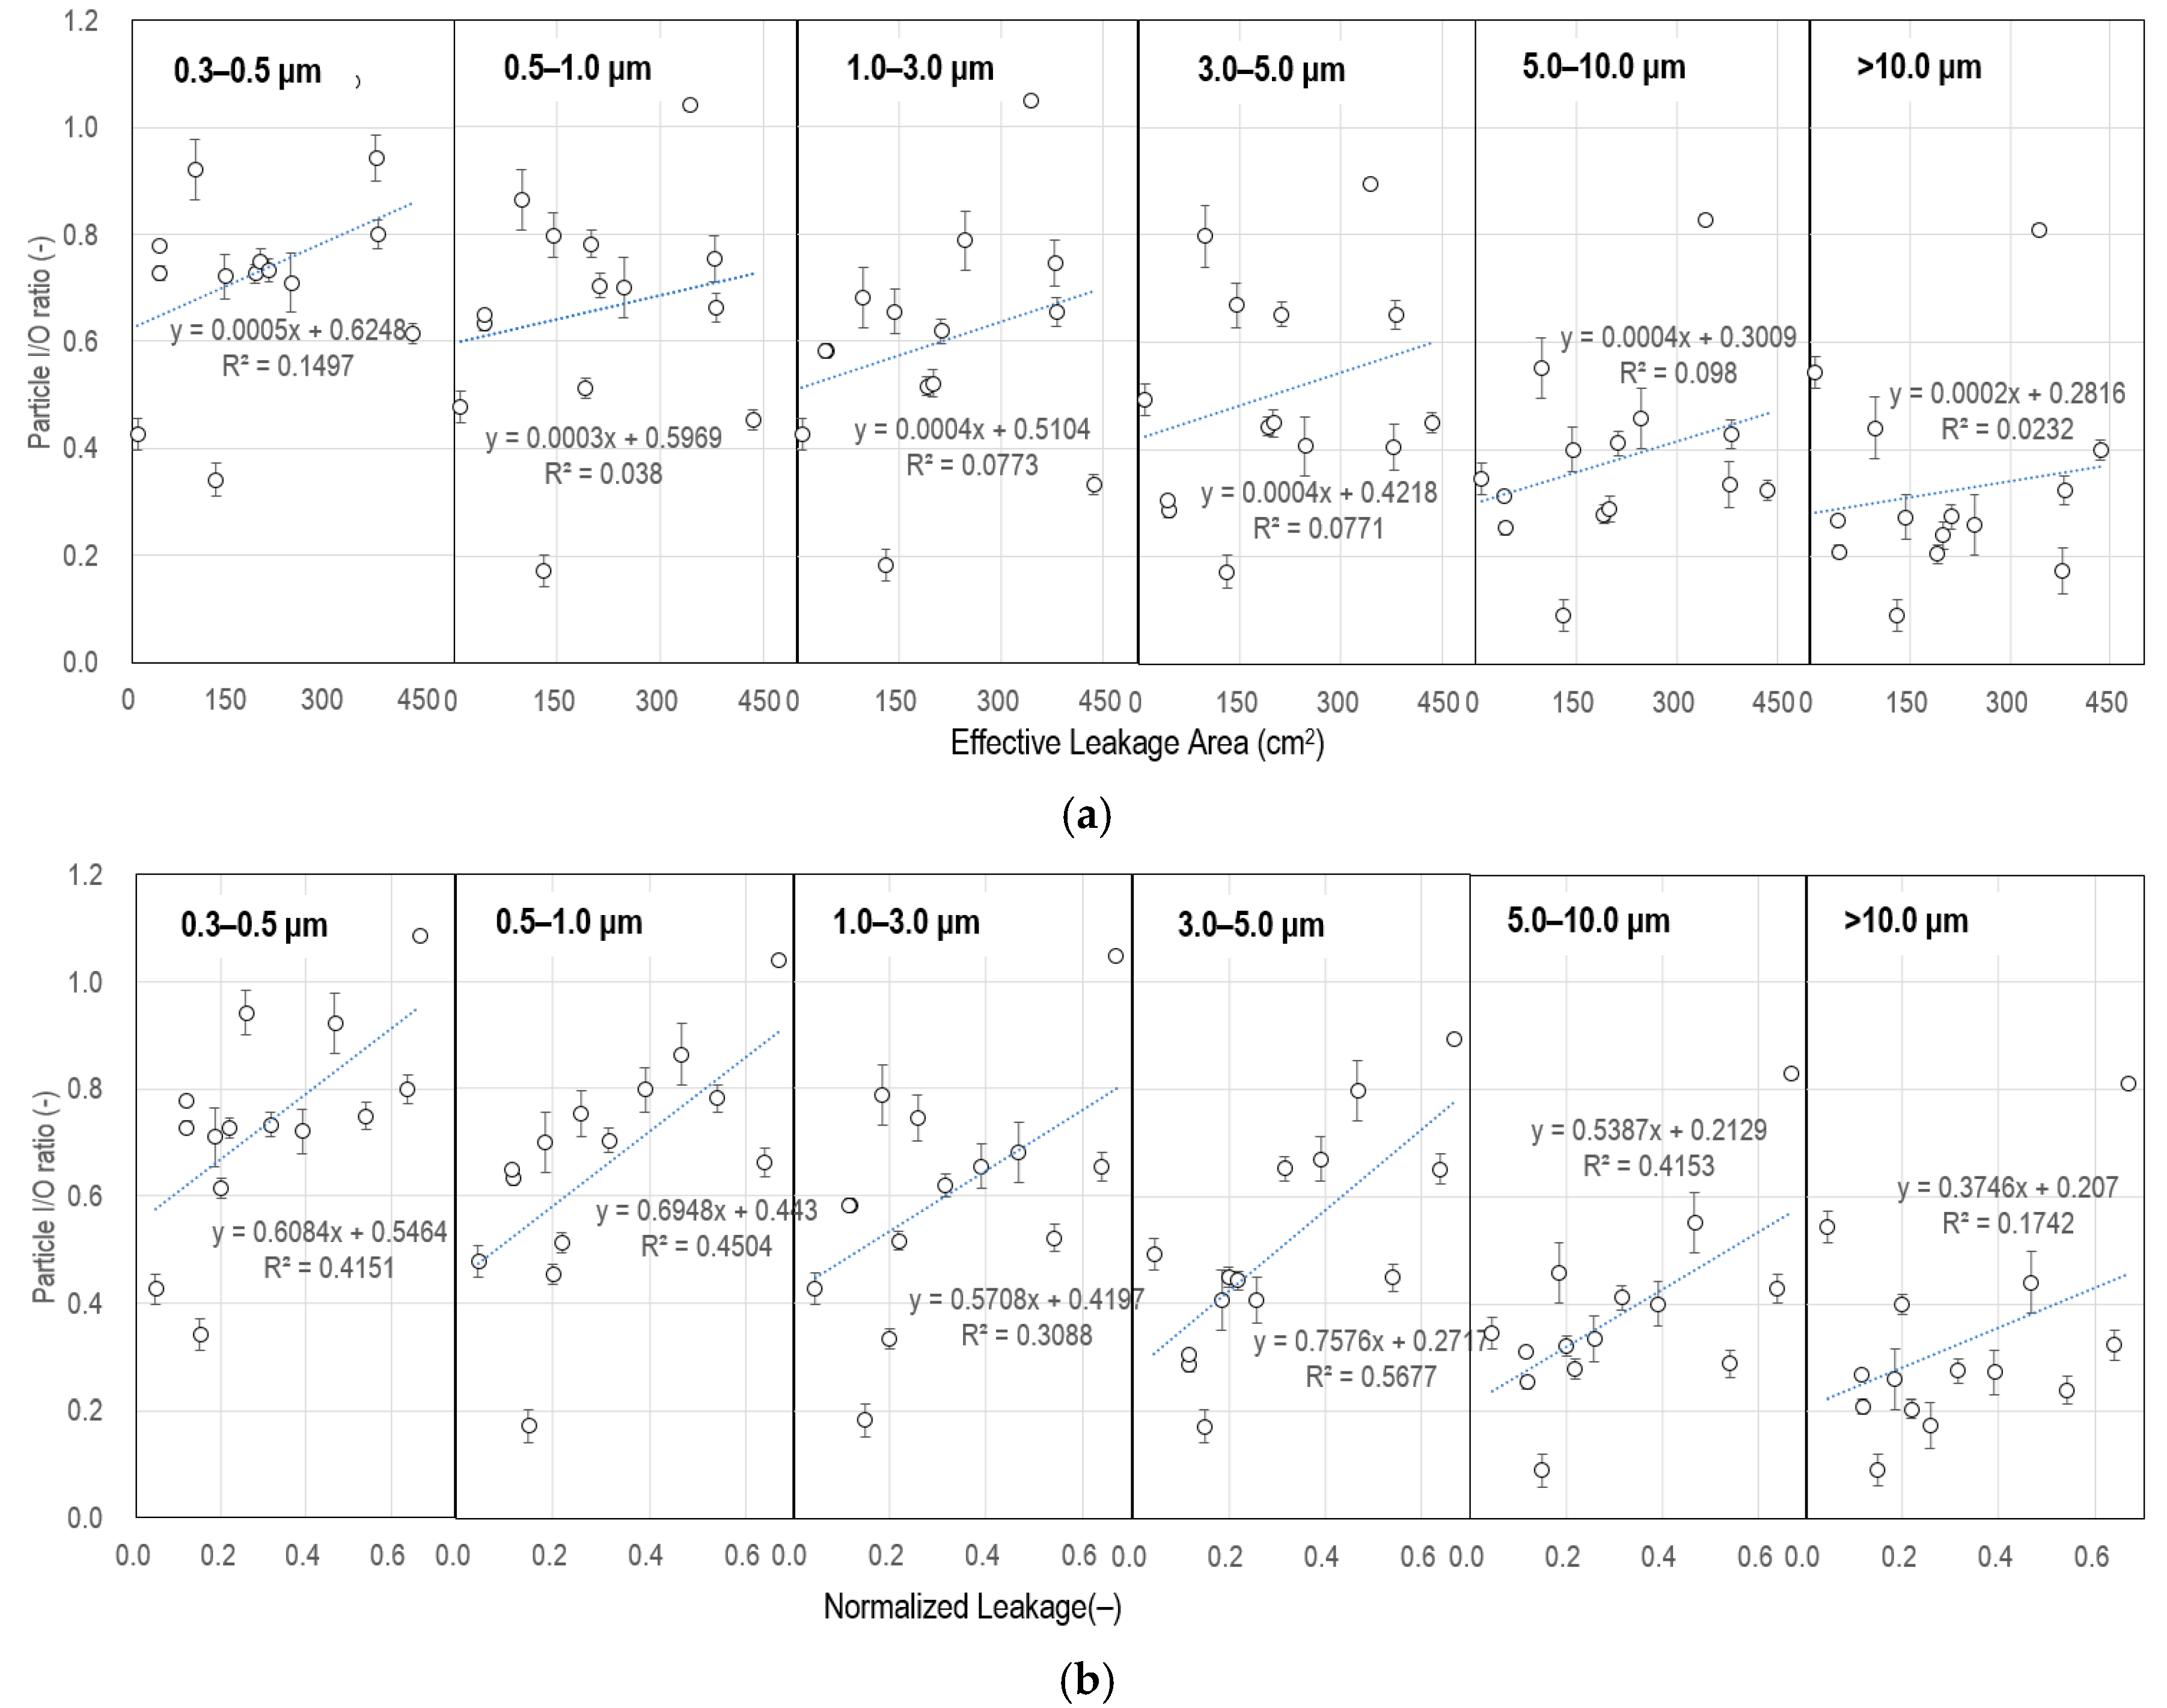
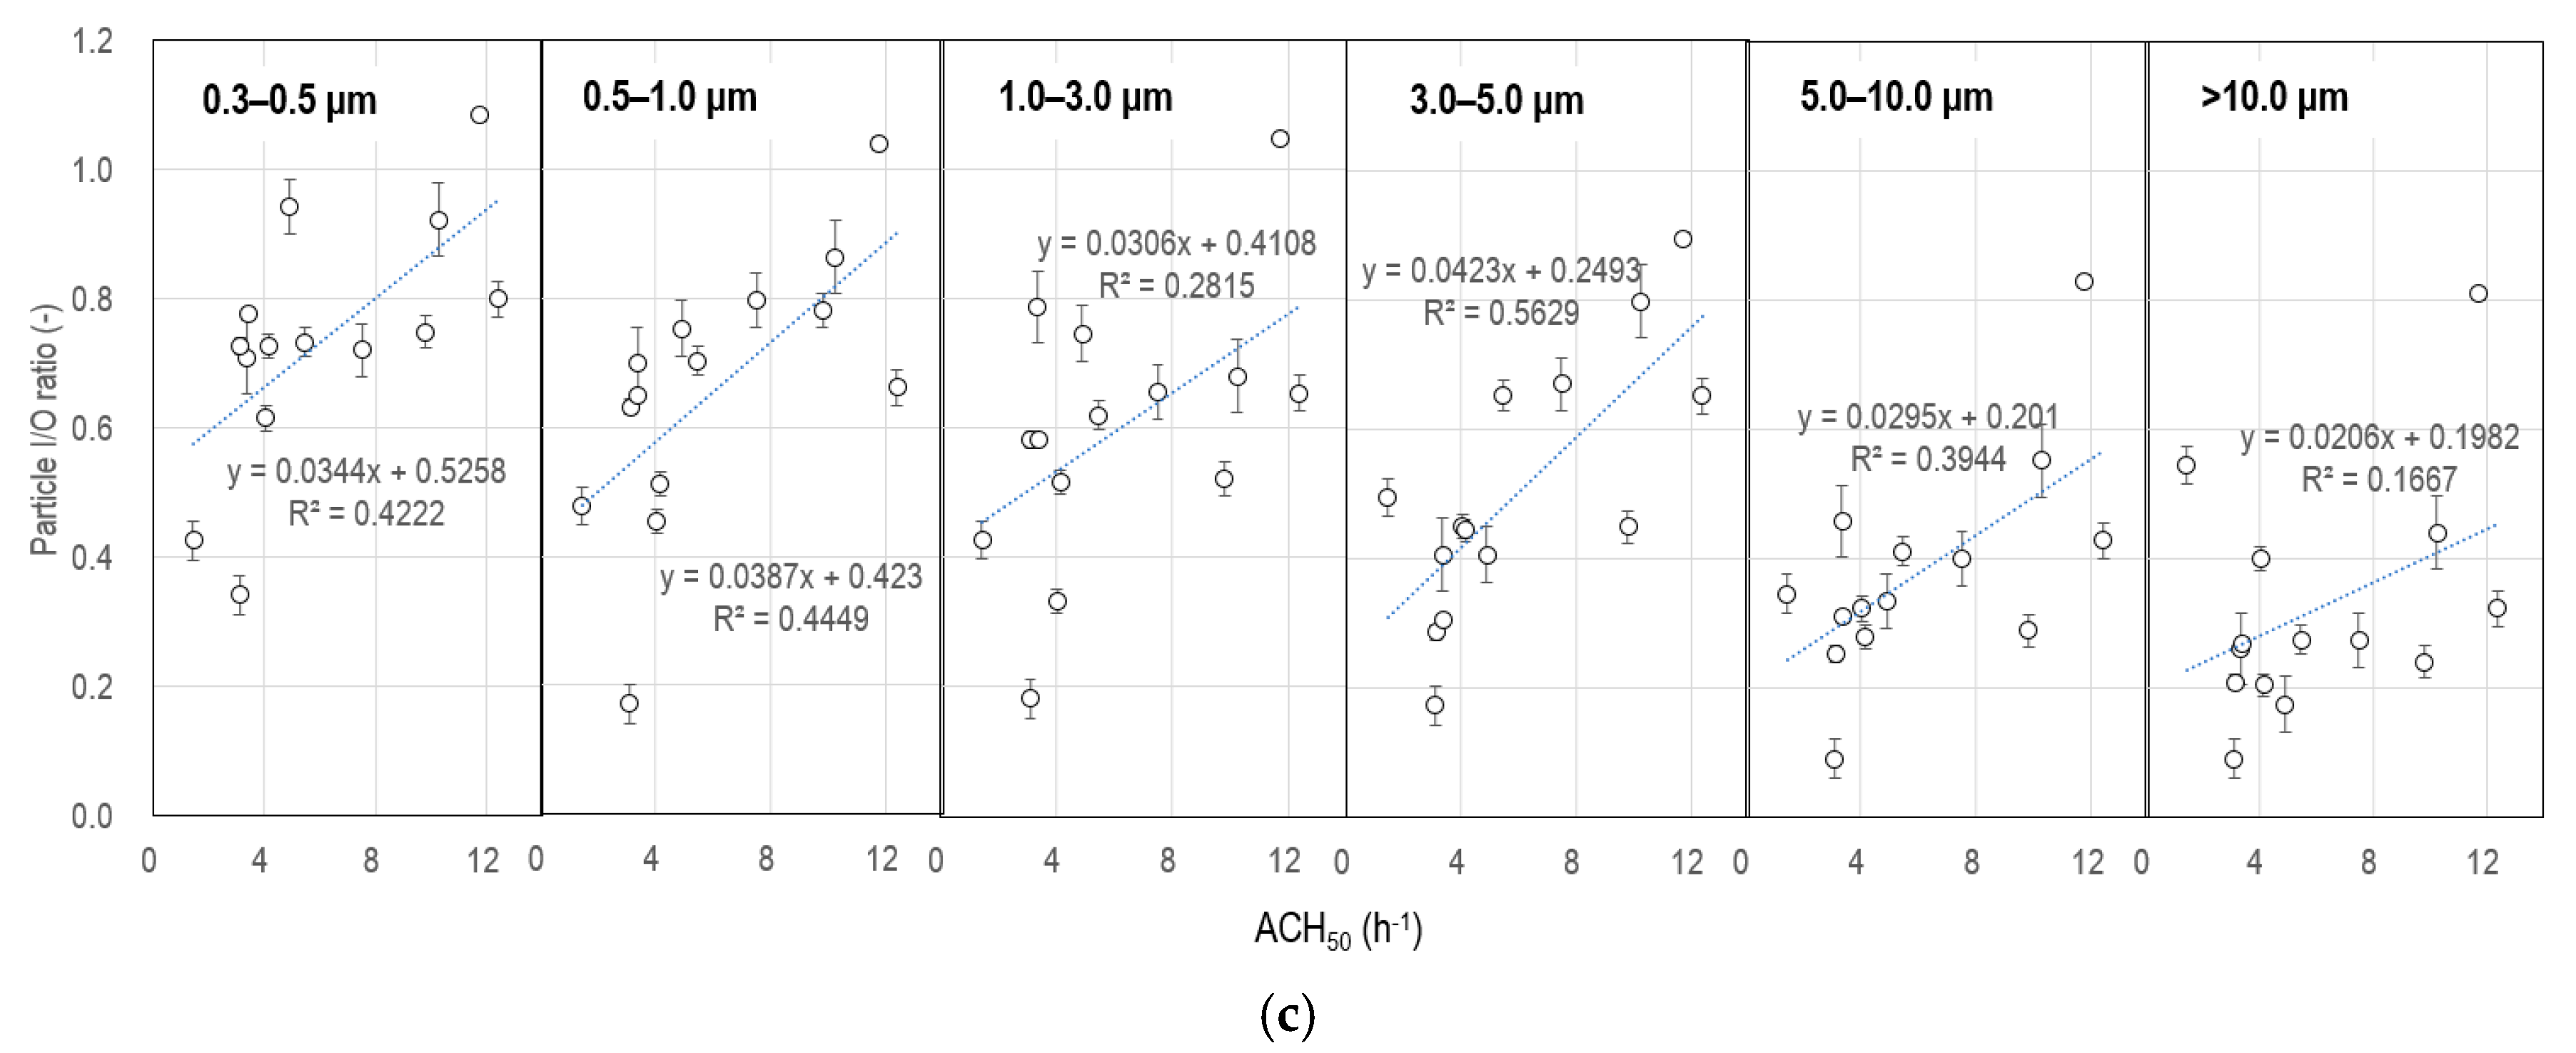
3.3. The I/O Ratios at a Typical I-O Pressure Difference of 10 Pa

Figure 3 shows the example of the measurement results for I/O ratios at Unit 12. The figure shows that the indoor particle concentration decayed during the first round of particle infiltration testing under the typical pressure difference of 10 Pa with depressurization provided by the blower door. The only particle concentrations after the estimated one-time constant (2.79 h) were used to estimate the I/O ratios of the housing unit. Followed by the first round of infiltration tests, the second (ΔP = 30 Pa) and third (ΔP = 50 Pa) rounds of infiltration tests were conducted, of which results are presented and discussed in the next sections.
Table 3 shows the average and standard deviation of size-resolved particle I/O ratios in the 14 tested housing units at the typical I-O pressure difference of 10 Pa. The average I/O ratios of the 14 housing units were 0.73, 0.66, 0.60, 0.51, 0.38, and 0.32 for particles with diameters of 0.3–0.5, 0.5–1.0, 1.0–3.0, 3.0–5.0, 5.0–10.0, and >10.0 μm, respectively. The results generally show that the I/O ratios of finer particles (0.3–0.5, 0.5–1.0, and 1.0–3.0 μm) were higher than those of coarser particles (3.0–5.0, 5.0–10.0, and >10.0 μm). This tendency was consistently found in the results of each tested housing unit. The estimated particle I/O ratios widely vary from housing unit to housing unit. The lowest I/O ratios were found at Unit 9 compared to the other housing units, showing 0.34, 0.17, 0.18, 0.17, 0.09, and 0.09 for 0.3–0.5, 0.5–1.0, 1.0–3.0, 3.0–5.0, 5.0–10.0, and >10.0 μm, respectively, while the highest I/O ratios were found at Unit 4, showing 1.09, 1.04, 1.05, 0.89, 0.83, and 0.81 for 0.3–0.5, 0.5–1.0, 1.0–3.0, 3.0–5.0, 5.0–10.0, and >10.0 μm. The difference in particle I/O ratios according to housing units might be explained with air leakage characteristics of housing units, as Unit 9 was classified into leakage class C, while Unit 4 fell into leakage class G. Although the airtight units with higher leakage classes generally showed lower I/O ratios, this was not always the case. For example, Unit 9, with leakage class C, revealed lower values of I/O ratios compared to Unit 12, with leakage class A. These results indicate that particle I/O ratios are also governed by various factors including indoor deposition loss, as particle I/O ratios are influenced by air exchange rate (ACH), penetration coefficient (P), and deposition loss rate (k).
Figure 4 shows the correlation between particle I/O ratios and air leakage data. The size-resolved particle I/O ratios of all tested housing units were correlated with ELA, NL, and ACH50 values. For all particle sizes, weak correlations between the I/O ratios and ELA were found, showing correlation coefficients, R2, ranging from 0.02 to 0.15. On the other hand, comparably meaningful correlations were observed between the I/O ratios and NL and between the I/O ratios and ACH50. The general tendency was that relatively higher I/O ratios were found for the leaky housing units than for airtight housing units, particularly with finer-sized particles.

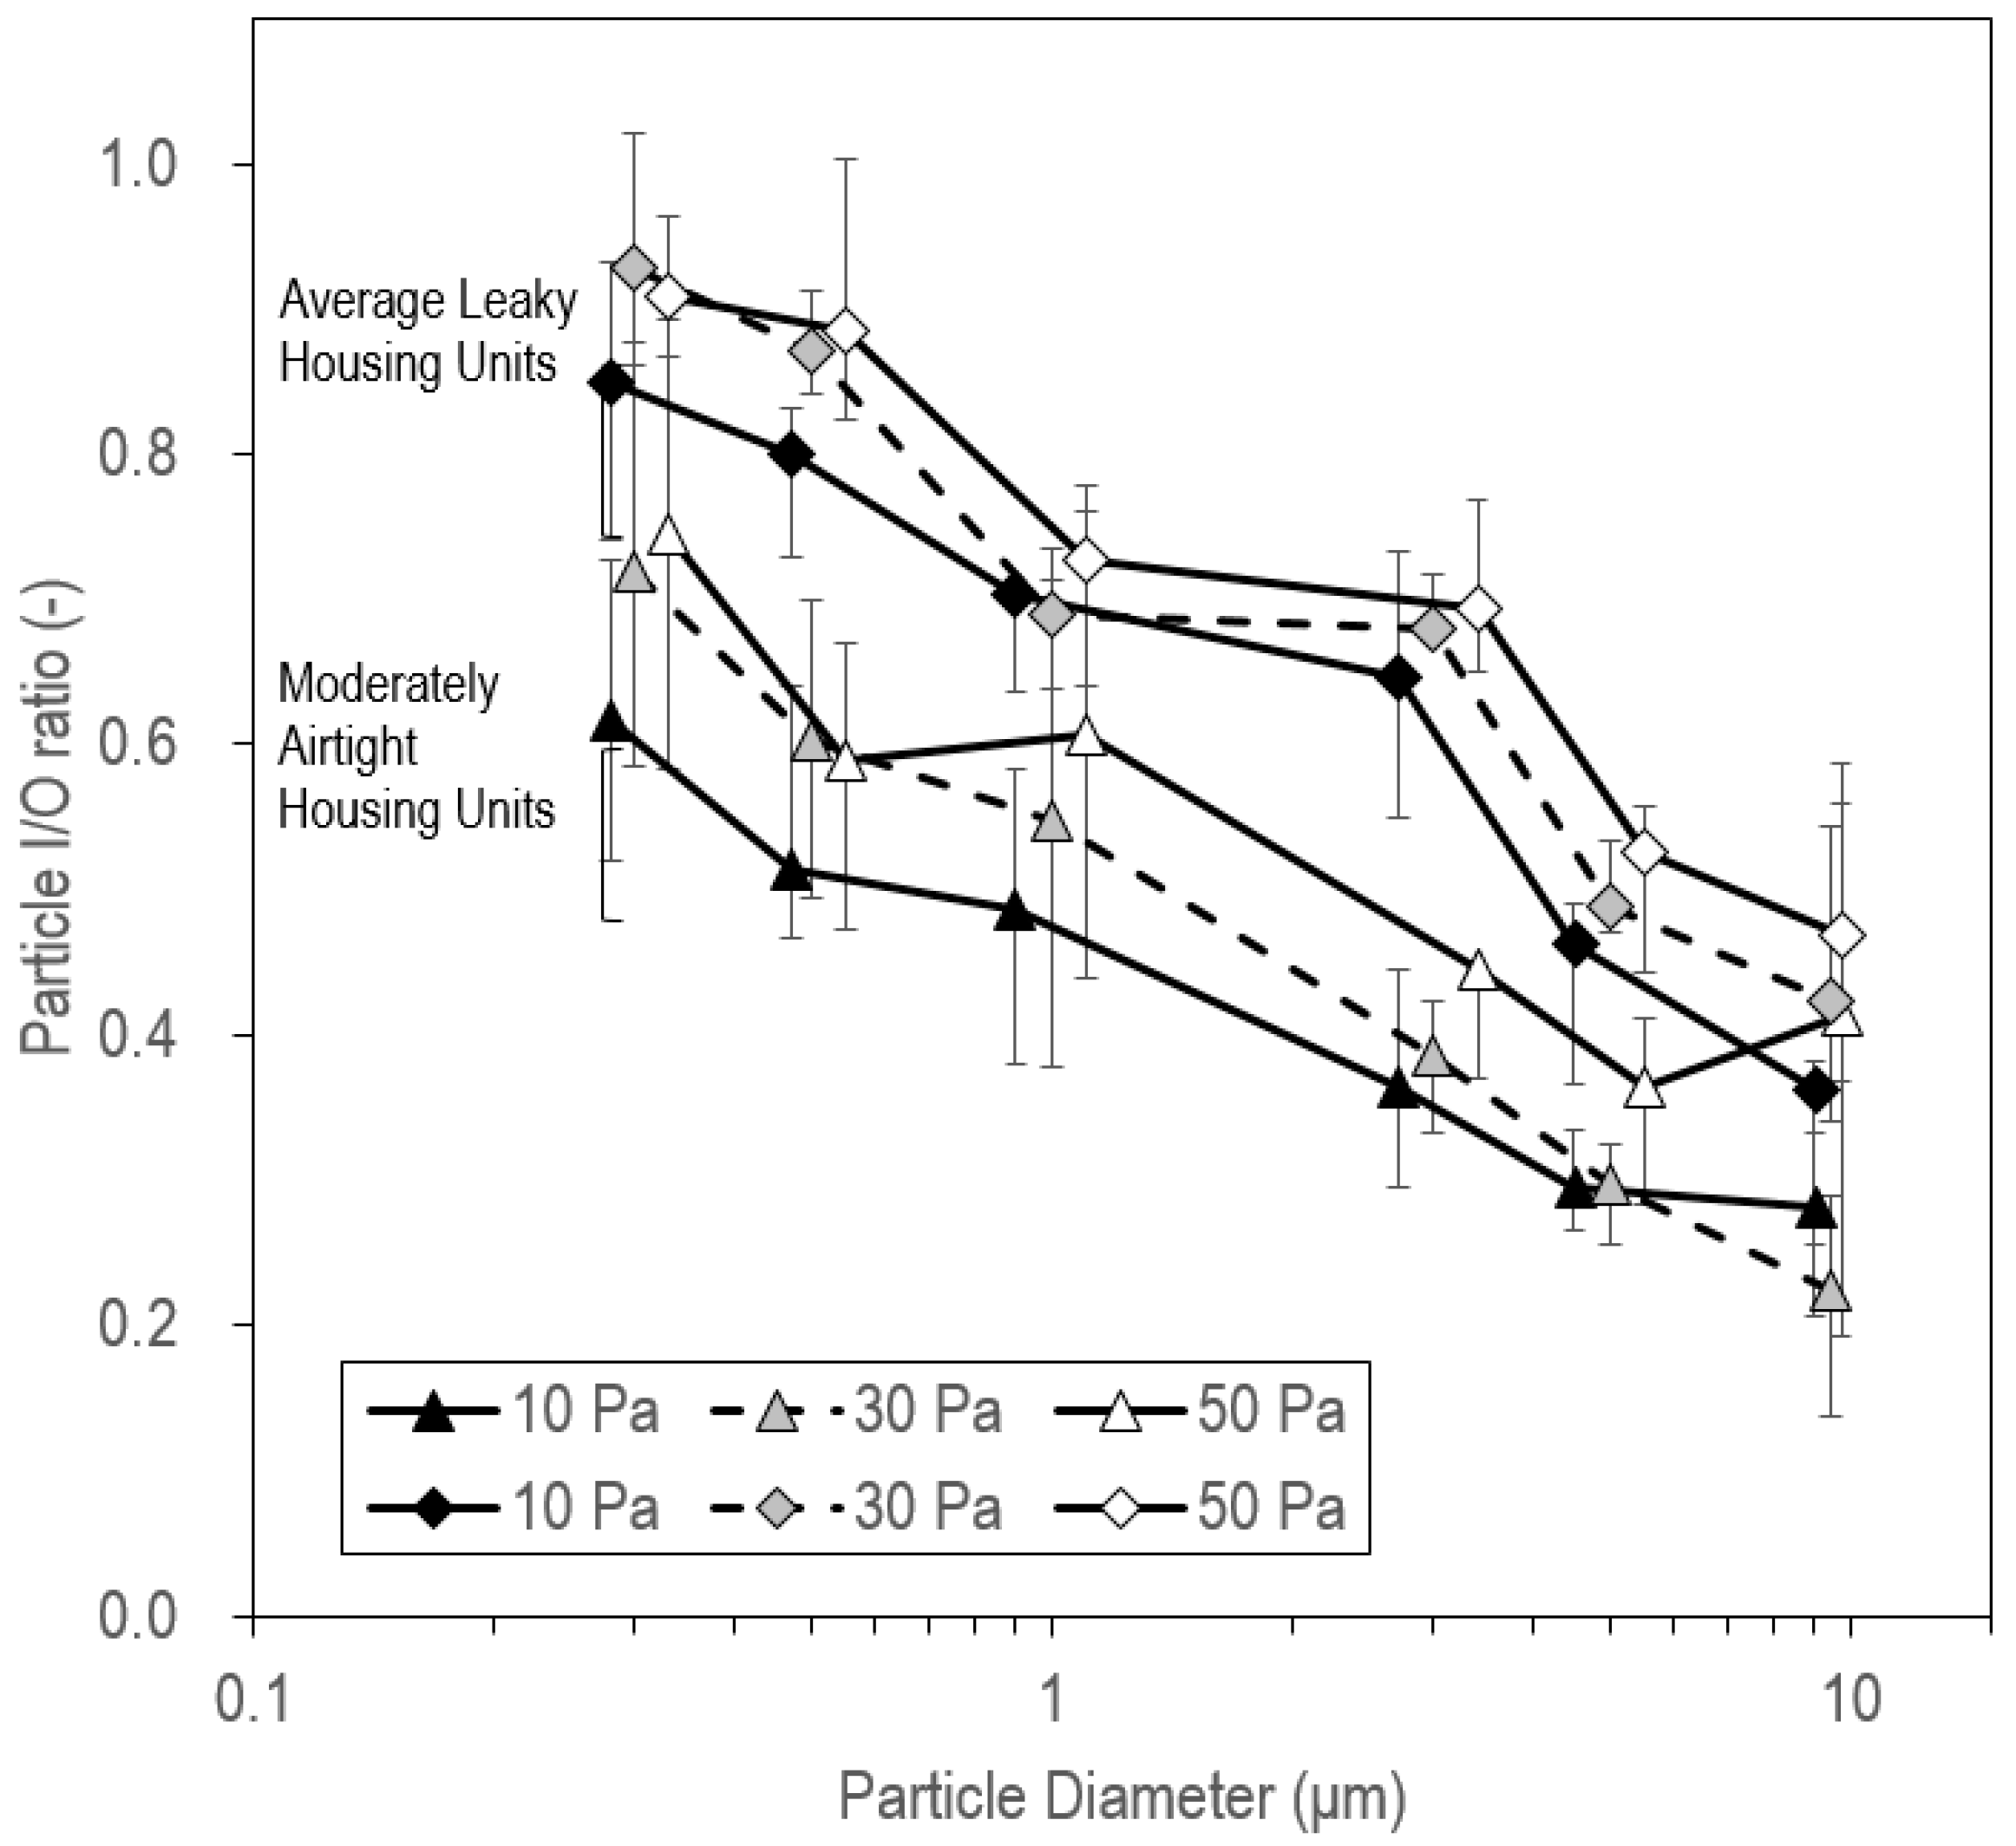
3.4. The I/O Ratios at Increased I-O Pressure Differences of 30 Pa and 50 Pa

Table 4 shows the size-resolved particle I/O ratios at the increased I-O pressure differences of 30 Pa and 50 Pa. The average I/O ratios at 30 Pa were 0.82, 0.74, 0.62, 0.53, 0.39, and 0.32, and the I/O ratios at 50 Pa were 0.83, 0.74, 0.67, 0.57, 0.45, and 0.44 for 0.3–0.5, 0.5–1.0, 1.0–3.0, 3.0–5.0, 5.0–10.0, and >10.0 μm, respectively. Figure 5 shows the graphical comparison of the I/O ratios of all housing units for varied I-O pressure differences. Compared to I/O ratios (0.73, 0.66, 0.60, 0.51, 0.38, and 0.32) at 10 Pa, the results showed that the level of I/O ratios in all particle bin sizes increased with elevated I-O pressure differences. This relationship of I/O ratios generally agreed with previous laboratory experiment results [25,26] reporting that the particle penetration increases with increasing pressure differences.
Figure 6 compares the particle I/O ratios between the group of average leaky housing units (ACH50 > 4.4) and that of moderately airtight housing units (ACH50 ≤ 4.4). As expected, the moderately airtight housing units show lower I/O ratios than average leaky housing units; still, the averaged I/O ratios of finer sized particles (0.3–0.5, 0.5–1.0, and 1.0–3.0 μm) in the moderately airtight housing units were 0.75, 0.59, and 0.61 at I-O pressure difference of 50 Pa, and the I/O ratios of 0.62, 0.51, and 0.49 at 10 Pa.
Compared with the I/O ratios of other types of unoccupied residences reported in previous studies, relatively higher I/O ratios were observed for the Korean multi-family apartments [38,39]. Wallace and Howard-Reed [38] reported size-resolved I/O ratios (0.3–0.5, 0.5–1.0, 1.0–2.5, 2.5–5.0, 5.0–10.0, and >10.0 μm) in three-level, four-bedroom US homes with no indoor particle source. The obtained I/O ratios ranged from 0.13 to 0.24. Orch et al. [39] estimated the size-resolved indoor proportions of outdoor particles in US single-family homes. They suggested geometric mean values of 0.29, 0.25, 0.13, and 0.07 for 0.1–0.5, 0.5–1.0, 1.0–5.0, and 5.0–10.0 μm particles, respectively. One might expect there to be less outdoor particle infiltration into indoor air in an airtight Korean multi-family housing unit as compared to a single-family house, due to the small ratio of envelope area to floor area. However, the present study indicates that, since airtight Korean multi-family housing units such as those in high-rise buildings may experience various ranges of pressure difference, the residents can still be exposed to high concentrations of particles originating from outdoors.

4. Conclusions

This study investigated I/O ratios of airborne particles under controlled pressure difference across the building envelope in Korean multifamily apartments. The I/O ratios were reported for 14 apartment housing units located in urban areas in Korea under various I-O pressure differences (ΔP = 10, 30, and 50 Pa). The particle infiltration tests using the blower door depressurization procedure provide the opportunity to compare ambient particle infiltration characteristics among housing units by setting identical I-O pressure differences in real housing units. The study indicates that indoor residents in moderately airtight Korean multifamily housing units with relatively small envelope area still can be exposed to high concentrations of outdoor originated fine particles, and that additional measures to mitigate exposure to particle infiltrated from outdoors should be considered. This study is part of a research effort to investigate the transport of size-resolved particles through building cracks in Korean multi-family apartments, and to calculate the particle removal efficiency of indoor air cleaners. Findings from the study can be useful to assess occupant exposure to outdoor particles of different sizes in multi-family residences, which may experience various ranges of pressure difference such as the high-rise apartment units, and to guide future research on the optimal selection and sizing of indoor air cleaners.

Author Contributions

Data curation, D.H.C.; Investigation, D.H.K.; Writing—original draft, D.H.C.; Writing—review & editing, D.H.K.

Funding

This research was supported by the National Research Foundation of Korea (NRF) grant funded by the Korea government (MSIP) (NRF- 2017R1C1B2011561) and by Basic Science Research Program through the NRF funded by the Ministry of Education (NRF-2018R1D1A1B07050503).

Conflicts of Interest

The authors declare no conflict of interest.

References

  1. Pope, C.A.; Bates, D.V.; Raizenne, M.E. Health effects of particulate air pollution: Time for reassessment? Environ. Health Perspect. 1995, 103, 1390–1406. [Google Scholar] [CrossRef] [PubMed]
  2. Peters, A.; Liu, E.; Verrier, R.L.; Schwartz, J.; Gold, D.R.; Mittleman, M.; Baliff, J.; Oh, J.A.; Allen, G.; Monahan, K.; et al. Air pollution and incidence of cardiac arrhythmia. Epidemiology 2000, 11, 11–17. [Google Scholar] [CrossRef] [PubMed]
  3. Brunekreef, B.; Holgate, S. Air pollution and health. Lancet 2002, 360, 1233–1242. [Google Scholar] [CrossRef]
  4. Du, X.; Kong, Q.; Ge1, W.H.; Zhang, S.J.; Fu, L.X. Characterization of personal exposure concentration of fine particles for adults and children exposed to high ambient concentrations in Beijing, China. J. Environ. Sci. 2010, 22, 1757–1764. [Google Scholar] [CrossRef]
  5. Ji, W.; Zhao, B. Contribution of outdoor-originating particles, indoor-emitted particles and indoor secondary organic aerosol (SOA) to residential indoor PM2.5 concentration: A model-based estimation. Build. Environ. 2015, 90, 196–205. [Google Scholar] [CrossRef]
  6. Fujitani, Y.; Kumar, P.; Tamura, K.; Fushimi, A.; Hasegawa, S.; Takahashi, K.; Tanabe, K.; Kobayashi, S.; Hirano, S. Seasonal differences of the atmospheric particle size distribution in a metropolitan area in Japan. Sci. Total Environ. 2012, 437, 339–347. [Google Scholar] [CrossRef] [PubMed] [Green Version]
  7. Yang, H.C.; Chang, S.H.; Lu, R.; Liou, D.M. The effect of particulate matter size on cardiovascular health in Taipei Basin, Taiwan. Comput. Method. Progr. Biomed. 2016, 137, 261–268. [Google Scholar] [CrossRef] [PubMed]
  8. Sharma, A.P.; Kim, K.H.; Ahn, J.W.; Shon, Z.H.; Sohn, J.R.; Lee, J.H.; Ma, C.J.; Brown, R.J.C. Ambient particulate matter (PM10) concentrations in major urban areas of Korea during 1996–2010. Atmos. Pollut. Res. 2014, 5, 161–169. [Google Scholar] [CrossRef]
  9. Peterson, J.T.; Junge, C.E. Sources of particulate matter in the atmosphere. In Man’s Impact on the Climate; Matthews, W.H., Kellogg, W.H., Robinson, G.D., Eds.; MIT Press: Boston, MA, USA, 1971. [Google Scholar]
  10. Mage, D.; Ozolins, G.; Peterson, P.; Webster, A.; Orthofer, R.; Vandeweerd, V.; Gwynne, M. Urban air pollution in megacities of the world. Atmos. Environ. 1996, 30, 681–686. [Google Scholar]
  11. Seinfeld, J.H.; Pandis, S.N. Atmospheric Chemistry and Physics: From Air Pollution to Climate Change; Wiley: New York, NY, USA, 1998. [Google Scholar]
  12. Nazaroff, W.W. Indoor particle dynamics. Indoor Air 2004, 14, 175–183. [Google Scholar] [CrossRef] [PubMed] [Green Version]
  13. Kuo, H.W.; Shen, H.Y. Indoor and outdoor PM2.5 and PM10 concentrations in the air during a dust storm. Build. Environ. 2010, 45, 610–614. [Google Scholar] [CrossRef]
  14. Kashima, S.; Yorifuji, T.; Bae, S.; Honda, Y.; Lim, Y.H.; Hong, Y.C. Asian dust effect on cause-specific mortality in five cities across South Korea and Japan. Atmos. Environ. 2016, 128, 20–27. [Google Scholar] [CrossRef]
  15. Kim, J. Transport routes and source regions of Asian dust observed in Korea during the past 40 years (1965–2004). Atmos. Environ. 2008, 42, 4778–4789. [Google Scholar] [CrossRef]
  16. Korean Ministry of Environment. Available online: http://www.me.go.kr (accessed on 2 November 2018).
  17. Liu, D.L.; Nazaroff, W.W. Modeling pollutant penetration across building envelopes. Build. Environ. 2001, 35, 4451–4462. [Google Scholar] [CrossRef] [Green Version]
  18. Chen, C.; Zhao, B. Review of relationship between indoor and outdoor particles: I/O ratio, infiltration factor and penetration factor. Atmos. Environ. 2011, 45, 275–288. [Google Scholar] [CrossRef]
  19. Thatcher, T.L.; Layton, D.W. Deposition, resuspension, and penetration of particles within a residence. Atmos. Environ. 1995, 29, 1487–1497. [Google Scholar] [CrossRef]
  20. Hussein, T.; Hämeri, K.; Heikkinen, M.S.A.; Kulmala, M. Indoor and outdoor particle size characterization at a family house in Espoo-Finland. Atmos. Environ. 2005, 39, 3697–3709. [Google Scholar] [CrossRef]
  21. Sarnat, S.E.; Coull, B.A.; Ruiz, P.A.; Koutrakis, P.; Suh, H.H. The Influences of ambient particle composition and size on particle infiltration in Los Angeles, CA, Residences. Air Waste Manag. Assoc. 2006, 45, 186–196. [Google Scholar] [CrossRef]
  22. Stephens, B.; Siegel, J.A. Penetration of ambient submicron particles into single-family residences and associations with building characteristics. Indoor Air 2012, 22, 501–513. [Google Scholar] [CrossRef] [PubMed]
  23. Chao, C.Y.H.; Wan, M.P.; Cheng, E.C.K. Penetration coefficient and deposition rate as a function of particle size in non-smoking naturally ventilated residences. Atmos. Environ. 2003, 37, 4233–4241. [Google Scholar] [CrossRef]
  24. Mullen, N.A.; Liu, C.; Zhang, Y.; Wang, S.; Nazaroff, W.W. Ultrafine particle concentrations and exposures in four high-rise Beijing apartments. Atmos. Envion. 2011, 45, 7574–7582. [Google Scholar] [CrossRef]
  25. Mosley, R.B.; Greenwell, D.J.; Sparks, L.E.; Guo, Z.; Tucker, W.G.; Fortmann, R.; Whitfield, C. Penetration of ambient fine particles into the indoor environment. Aerosol Sci. Technol. 2001, 34, 127–136. [Google Scholar] [CrossRef]
  26. Liu, D.L.; Nazaroff, W.W. Particle penetration through building cracks. Aerosol Sci. Technol. 2003, 37, 565–573. [Google Scholar] [CrossRef]
  27. ISO/TC 163. ISO 9972: 2015 Thermal Performance of Buildings—Determination of Air Permeability of Buildings—Fan Pressurization Method; International Organization for Standardization: Geneva, Switzerland, 2015. [Google Scholar]
  28. Hong, W.K.; Kim, J.M.; Park, S.C.; Lee, S.G.; Kim, S.I.; Yoon, K.J.; Kim, H.C.; Kim, J.T. A new apartment construction technology with effective CO2 emission reduction capabilities. Energy 2010, 35, 2639–2646. [Google Scholar] [CrossRef]
  29. WHO. WHO Guidelines for Indoor Air Quality: Dampness and Mould; World Health Organization: Geneva, Switzerland, 2009. [Google Scholar]
  30. Kurnitski, J. Ventilation and Airtightness in Houses; Builders’ Yearbook: Helsinki, Finland, 2006. [Google Scholar]
  31. Kalamees, T.; Kurnitski, J.; Jokisalo, J.; Eskola, L.; Jokiranta, K.; Vinha, J. Air pressure conditions in Finnish residences. In Proceedings of the Clima 2007 WellBeing Indoors, Helsinki, Finland, 10–14 June 2007. [Google Scholar]
  32. Jo, J.H.; Lim, J.H.; Song, S.Y.; Yeo, M.S.; Kim, K.W. Characteristics of pressure distribution and solution to the problems caused by stack effect in high-rise residential buildings. Build. Environ. 2007, 42, 263–277. [Google Scholar] [CrossRef]
  33. ASTM E779-10. Standard Test Method for Determining Air Leakage Rate by Fan Pressurization; ASTM International: West Conshohocken, PA, USA, 2010. [Google Scholar]
  34. ASHRAE. ANSI/ASHRAE Standard 119: Air Leakage Performance for Detached Single-Family Residential Buildings; American Society of Heating, Refrigerating & Air Conditioning Engineers: Atlanta, GA, USA, 1988. [Google Scholar]
  35. AirKorea. Available online: http://airkorea.or.kr (accessed on 2 November 2018).
  36. WHO. Health Effects of Particulate Matter; World Health Organization: Geneva, Switzerland, 2013. [Google Scholar]
  37. PHI. Passive House Planning Package 2007; Passive House Institute: Darmstadt, Germany, 2007. [Google Scholar]
  38. Wallace, L.; Howard-Reed, C. Continuous monitoring of ultrafine, fine, and coarse particles in a residence for 18 months in 1999–2000. J. Air Waste Manag. Assoc. 2002, 52, 828–844. [Google Scholar] [CrossRef] [PubMed]
  39. Orch, Z.E.; Stephens, B.; Waring, M.S. Predictions and determinants of size-resolved particle infiltration factors in single-family homes in the U.S. Build. Environ. 2014, 74, 106–118. [Google Scholar] [CrossRef]
Figure 1. Outdoor particle concentrations during particle infiltration tests (grey bars refer to the measured values of outdoor particle number concentrations in the size ranges of 0.3–0.5, 0.5–1.0, 1.0–3.0, 3.0–5.0, 5.0–10.0, and >10.0 μm and black bars refer to the 24-h mean of outdoor PM10 mass concentrations provided by the Meteorological Administration in Korea).
Sustainability 10 04074 g001
Figure 2. Correlation between air leakage characteristics and building conditions: (a) ELA versus age; (b) ELA versus floor area and age; (c) NL versus age, and (d) ACH50 versus age.
Sustainability 10 04074 g002
Figure 3. An example of particle infiltration test results (housing unit 12).
Sustainability 10 04074 g003
Figure 4. Correlation between particle I/O ratios at the I-O pressure difference of 10 Pa and air leakage data: (a) ELA; (b) NL, and (c) ACH50.
Sustainability 10 04074 g004aSustainability 10 04074 g004b
Figure 5. The I/O ratios of all housing units for varying I-O pressure differences (upper, mid, and lower box edges represent the 75th, 50th, and 25th percentiles, respectively). The whiskers represent the 95th and 5th percentiles, and white dots represent the maxima and minima of the I/O ratios.
Sustainability 10 04074 g005
Figure 6. Comparison of average particle I/O ratios between the group of leaky housing units and that of average housing units under various I-O pressure differences (error bars represent the 75th and 25th percentiles).
Sustainability 10 04074 g006
Table 1. Description of test housing units.
Housing UnitConstruction Year (years)Floor Area (m2)Ceiling Height (m)Volume (m3)Envelope Area (m2)
11979572.1512340
21982362.308318
319961432.3032961
41996502.3011528
519972122.3048869
62002362.308318
72002652.2514650
82004852.3019645
92006852.3019650
1020061302.3029955
112010202.154319
122012182.304113
132015362.308332
142015362.308332
Table 2. Blower door leakage test results for housing units.
Housing UnitC (m3·h−1·Pa−n)n (-)ELA (cm2)NL (-)ACH50 (h−1)Leakage Class
1136.00.69381.40.6412.4G
258.30.60144.30.397.5E
3149.90.62378.80.264.9D
4144.10.57342.70.6711.7G
5159.60.67435.40.204.0C
681.90.59199.70.549.8F
789.20.57212.10.325.5E
870.80.66191.00.224.2D
949.10.65130.70.153.1C
1099.30.60246.80.193.4C
1138.20.6397.90.4710.3F
122.50.828.40.051.4A
1314.60.7443.70.123.1B
1413.80.7743.00.123.4B
Table 3. Size-resolved particle infiltration factors of housing units at typical I-O pressure differences of 10 pa.
Housing Unit CodeParticle I/O Ratios (Average ± Standard Deviation)Time Constant, τ (h)
0.3–0.5 μm0.5–1.0 μm1.0–3.0 μm3.0–5.0 μm5.0–10.0 μm>10.0 μm
10.80 ± 0.050.66 ± 0.110.65 ± 0.020.65 ± 0.060.43 ± 0.070.32 ± 0.130.19
20.72 ± 0.050.80 ± 0.030.66 ± 0.070.67 ± 0.130.40 ± 0.080.27 ± 0.050.35
30.94 ± 0.020.75 ± 0.030.75 ± 0.030.41 ± 0.050.33 ± 0.020.17 ± 0.030.81
41.09 ± 0.131.04 ± 0.141.05 ± 0.020.89 ± 0.050.83 ± 0.070.81 ± 0.120.20
50.62 ± 0.020.45 ± 0.050.33 ± 0.020.45 ± 0.050.32 ± 0.120.40 ± 0.140.69
60.75 ± 0.030.78 ± 0.010.52 ± 0.020.45 ± 0.050.29 ± 0.030.24 ± 0.070.27
70.73 ± 0.130.70 ± 0.220.62 ± 0.020.65 ± 0.030.41 ± 0.050.28 ± 0.080.45
80.73 ± 0.020.51 ± 0.090.52 ± 0.020.44 ± 0.060.28 ± 0.040.20 ± 0.181.00
90.34 ± 0.020.17 ± 0.010.18 ± 0.010.17 ± 0.030.09 ± 0.030.09 ± 0.050.88
100.71 ± 0.060.70 ± 0.020.79 ± 0.040.41 ± 0.060.46 ± 0.110.26 ± 0.120.72
110.92 ± 0.060.86 ± 0.140.68 ± 0.050.80 ± 0.170.55 ± 0.150.44 ± 0.180.25
120.43 ± 0.030.48 ± 0.010.43 ± 0.030.49 ± 0.070.35 ± 0.100.49 ± 0.162.79
130.73 ± 0.050.63 ± 0.070.58 ± 0.020.29 ± 0.040.25 ± 0.040.21 ± 0.051.03
140.78 ± 0.100.65 ± 0.080.58 ± 0.020.30 ± 0.020.31 ± 0.040.27 ± 0.100.93
Average0.73 ± 0.190.66 ± 0.210.60 ± 0.210.51 ± 0.200.38 ± 0.170.32 ± 0.18-
Table 4. Size-resolved particle I/O ratios of housing units at increased I-O pressure differences: (a) 30 pa; (b) 50 pa.
Housing Unit CodeParticle I/O Ratios (Average ± Standard Deviation)Time Constant, τ (h)
0.3–0.5 μm0.5–1.0 μm1.0–3.0 μm3.0–5.0 μm5.0–10.0 μm>10.0 μm
10.95 ± 0.070.92 ± 0.060.70 ± 0.010.68 ± 0.040.48 ± 0.050.35 ± 0.090.11
20.74 ± 0.080.89 ± 0.090.65 ± 0.020.78 ± 0.040.56 ± 0.080.46 ± 0.100.18
30.88 ± 0.110.98 ± 0.080.77 ± 0.060.48 ± 0.110.38 ± 0.080.22 ± 0.070.41
41.04 ± 0.040.91 ± 0.070.73 ± 0.030.72 ± 0.020.53 ± 0.070.63 ± 0.170.11
50.69 ± 0.040.52 ± 0.070.42 ± 0.010.57 ± 0.070.48 ± 0.130.29 ± 0.070.34
61.04 ± 0.070.91 ± 0.150.73 ± 0.020.72 ± 0.080.53 ± 0.080.63 ± 0.160.14
71.00 ± 0.180.69 ± 0.070.63 ± 0.040.70 ± 0.110.47 ± 0.070.34 ± 0.060.24
80.91 ± 0.050.71 ± 0.150.62 ± 0.040.47 ± 0.050.27 ± 0.040.13 ± 0.040.34
90.45 ± 0.030.34 ± 0.060.29 ± 0.010.26 ± 0.030.14 ± 0.030.07 ± 0.030.45
100.74 ± 0.010.69 ± 0.030.70 ± 0.040.34 ± 0.040.31 ± 0.040.15 ± 0.040.39
110.84 ± 0.040.79 ± 0.060.60 ± 0.150.68 ± 0.290.47 ± 0.250.34 ± 0.150.13
120.49 ± 0.010.47 ± 0.010.33 ± 0.000.32 ± 0.030.24 ± 0.030.37 ± 0.111.05
130.89 ± 0.190.81 ± 0.160.73 ± 0.100.37 ± 0.050.30 ± 0.080.29 ± 0.200.47
140.87 ± 0.030.69 ± 0.030.73 ± 0.100.37 ± 0.030.34 ± 0.070.28 ± 0.150.44
Average0.82 ± 0.190.74 ± 0.190.62 ± 0.160.53 ± 0.180.39 ± 0.130.32 ± 0.17-
(a)
Housing Unit CodeParticle I/O Ratios (Average ± Standard Deviation)Time Constant, τ (h)
0.3–0.5 μm0.5–1.0 μm1.0–3.0 μm3.0–5.0 μm5.0–10.0 μm>10.0 μm
10.92 ± 0.030.89 ± 0.040.66 ± 0.030.64 ± 0.070.45 ± 0.080.40 ± 0.060.08
20.82 ± 0.050.61 ± 0.170.63 ± 0.020.66 ± 0.050.42 ± 0.050.34 ± 0.090.13
30.95 ± 0.011.04 ± 0.030.78 ± 0.020.50 ± 0.080.43 ± 0.060.32 ± 0.040.20
41.01 ± 0.030.99 ± 0.051.00 ± 0.010.83 ± 0.040.80 ± 0.050.64 ± 0.040.09
50.66 ± 0.060.49 ± 0.050.37 ± 0.020.48 ± 0.050.42 ± 0.080.59 ± 0.160.25
60.98 ± 0.071.02 ± 0.040.74 ± 0.020.77 ± 0.080.61 ± 0.140.66 ± 0.220.10
70.93 ± 0.060.81 ± 0.100.63 ± 0.020.68 ± 0.060.47 ± 0.070.43 ± 0.120.18
80.78 ± 0.110.53 ± 0.050.51 ± 0.010.40 ± 0.030.22 ± 0.030.10 ± 0.020.24
90.46 ± 0.020.33 ± 0.050.28 ± 0.010.31 ± 0.020.15 ± 0.030.13 ± 0.070.32
100.77 ± 0.060.68 ± 0.020.68 ± 0.030.39 ± 0.060.41 ± 0.130.26 ± 0.110.30
110.76 ± 0.300.83 ± 0.090.65 ± 0.040.77 ± 0.120.50 ± 0.060.48 ± 0.190.10
120.55 ± 0.160.55 ± 0.100.32 ± 0.020.22 ± 0.060.13 ± 0.030.22 ± 0.060.69
131.04 ± 0.080.98 ± 0.310.85 ± 0.060.41 ± 0.030.38 ± 0.070.59 ± 0.190.32
141.01 ± 0.040.65 ± 0.040.72 ± 0.010.36 ± 0.040.35 ± 0.060.30 ± 0.110.29
Average0.83 ± 0.180.74 ± 0.230.67 ± 0.190.57 ± 0.180.45 ± 0.160.44 ± 0.23-
(b)

