Article

Leaf Temperature and Vapour Pressure Deficit (VPD) Driving Stomatal Conductance and Biochemical Processes of Leaf Photosynthetic Rate in a Subtropical Evergreen Coniferous Plantation

1
Key Laboratory of Ecosystem Network Observation and Modeling, Institute of Geographic Sciences and Natural Resources Research, Chinese Academy of Sciences, Beijing 100101, China
2
College of Resources and Environment, University of Chinese Academy of Sciences, Beijing 100049, China
3
College of Geography and Environmental Sciences, Zhejiang Normal University, Jinhua 321004, China
*
Authors to whom correspondence should be addressed.
Sustainability 2018, 10(11), 4063; https://doi.org/10.3390/su10114063
Submission received: 21 September 2018 / Revised: 31 October 2018 / Accepted: 3 November 2018 / Published: 6 November 2018

Abstract

:
Photosynthesis is arguably the most important biochemical process on Earth, which is dramatically influenced by environmental conditions. How environmental factors drive stomatal conductance and biochemical processes of leaf photosynthetic rate has not been sufficiently investigated in subtropical China. In this study, we analysed the effects of stomatal and biochemical parameters on the photosynthetic rate of native Masson’s pine (Pinus massoniana Lamb.) and exotic slash pine (Pinus elliottii Engelm.) in response to leaf temperature and vapour pressure deficit (VPD) in subtropical China, based on leaf gas exchange measurements in 2016. Our results showed that there was no significant difference in the light-saturated photosynthetic rate (Asat) between native Masson’s pine and exotic slash pine. The seasonal patterns of maximum rate of the carboxylation (Vcmax25) were basically consistent with seasonal patterns of Asat for both species. The positive effect of leaf temperature on Asat was mainly produced through its positive effect on Vcmax25. Leaf temperature had no significant effect on stomatal conductance. Vcmax25 and gs simultaneously affected Asat in response to VPD. Our results highlighted the importance of biochemical processes in limiting leaf photosynthetic rate in response to environmental conditions in subtropical evergreen coniferous plantations.

1. Introduction

Forest ecosystems contain more than 85% of the total plant carbon (C) on Earth [1] and thus play a major role in the global C cycle. Subtropical forests, which are widely distributed across China’s southern regions, are considered to have high C sequestration capacities [2]. Conifers were selected to establish most forest plantations in subtropical China since the 1980s due to their fast growth [3,4]. Masson’s pine (Pinus massoniana Lamb.) (MP) is a dominant native species in subtropical China, which covers approximately area of 5.8 million ha [4]. Slash pine (Pinus elliottii Engelm.) (SP), native to the south-eastern United States, covers more than 1 million ha of subtropical China [4,5]. As photosynthesis is arguably the most important biochemical process on Earth and a key source of uncertainty in C cycle modelling [6,7], the direct role of environmental conditions in photosynthetic rate changing had been fully documented [8,9,10]. However, how the environmental factors drive stomatal conductance and biochemical processes of leaf photosynthetic rate has not been sufficiently investigated in subtropical evergreen coniferous plantations. Studying the internal mechanisms of environmental factors affecting photosynthesis helps us better understand the physiological processes of plants under a changing climate and then provides an explanation of the physiological mechanisms for plants growth.
Temperature and humidity are the most important environmental factors in influencing leaf photosynthetic rate [11,12,13]. The key processes of photosynthesis include CO2 diffusion processes (stomatal conductance (gs), mesophyll conductance (gm)) and biochemical processes [14,15,16]. The effect of gs on photosynthesis is mainly through CO2 diffusion from the atmosphere to the substomatal cavities [17,18]. Biochemical processes mainly include the carboxylation of ribulose-1, 5-bisphophate (RuBP) (i.e., the maximum rate of carboxylation at 25 °C, Vcmax25) and regeneration of RuBP (i.e., the maximum rate of electron transport at 25 °C, Jmax25) [19,20,21]. Temperature influences the carboxylation rate along with stomatal conductance, and photosynthesis is recognized as a very temperature-sensitive process [13]. Leaf temperature directly determines the microenvironment in which the plants are located, and thus is also an important factor in influencing leaf photosynthetic rate. Leaf temperature is influenced by air temperature, and also controlled by leaf traits [22]. Thus, leaf temperature among different plants may be very different even under the same air temperature condition. Humidity, i.e., vapour pressure deficit (VPD), also influences the photosynthetic rate through leaf stomatal conductance. It is widely recognized that leaf stomatal conductance decreases with decreasing humidity [23]. Indeed, gs and Vcmax25 simultaneously regulate the photosynthetic rate in response to environmental conditions. It is necessary to evaluate the effects of leaf temperature and VPD on the stomatal and biochemical processes, and then on the leaf photosynthetic rate [15,24,25]. However, the effects of temperature and humidity on leaf photosynthetic rate through key processes have not been sufficiently investigated in subtropical China.
Photosynthetic rates are a key source of uncertainty in modelling C cycles [6]. Many studies have demonstrated strong seasonal variations in photosynthetic parameters, and Vcmax25 is different even for the same PFT [6,26]. However, due to a lack of field observation data, the key parameters (Vcmax25 and Jmax25) are still assumed to be constant over time in most models [27,28,29]. Exploring the seasonal variations of photosynthetic parameters over the entire growing season can provide data-based support for key model parameters for evergreen coniferous forest in subtropical China. In addition, Vcamx25 and gs are the important parameters influencing the photosynthetic rate of plants [18,19,20]. Studying leaf temperature and VPD driving stomatal conductance and biochemical processes of leaf photosynthetic rate substantially improves modelling accuracy and predicting vegetation responses to environmental conditions [27,30], which is crucial for reducing the uncertainty of modelling.
Vcamx25 and gs are key parameters characterizing the photosynthetic capacity of plants [18,19,20]. Here we hypothesized that leaf temperature and VPD significantly affected the stomatal and biochemical processes, and then influenced the leaf photosynthetic rate in subtropical evergreen coniferous forest. To evaluate how leaf temperature and VPD affected leaf photosynthetic physiological process in subtropical evergreen coniferous plantation, the seasonal variabilities of photosynthetic parameters were measured using a portable photosynthesis system (LI-6400; Li-Cor, Inc., Lincoln, NE, USA). We compared the effect of leaf temperature and VPD on leaf photosynthetic rate of subtropical forest through stomatal and biochemical parameters. The objective of this study is to (1) investigate seasonal variations of gs and leaf photosynthetic capacities; and (2) evaluate how the leaf temperature and VPD drive stomatal conductance and biochemical processes of leaf photosynthetic rate in a subtropical evergreen coniferous plantation.

2. Materials and Methods
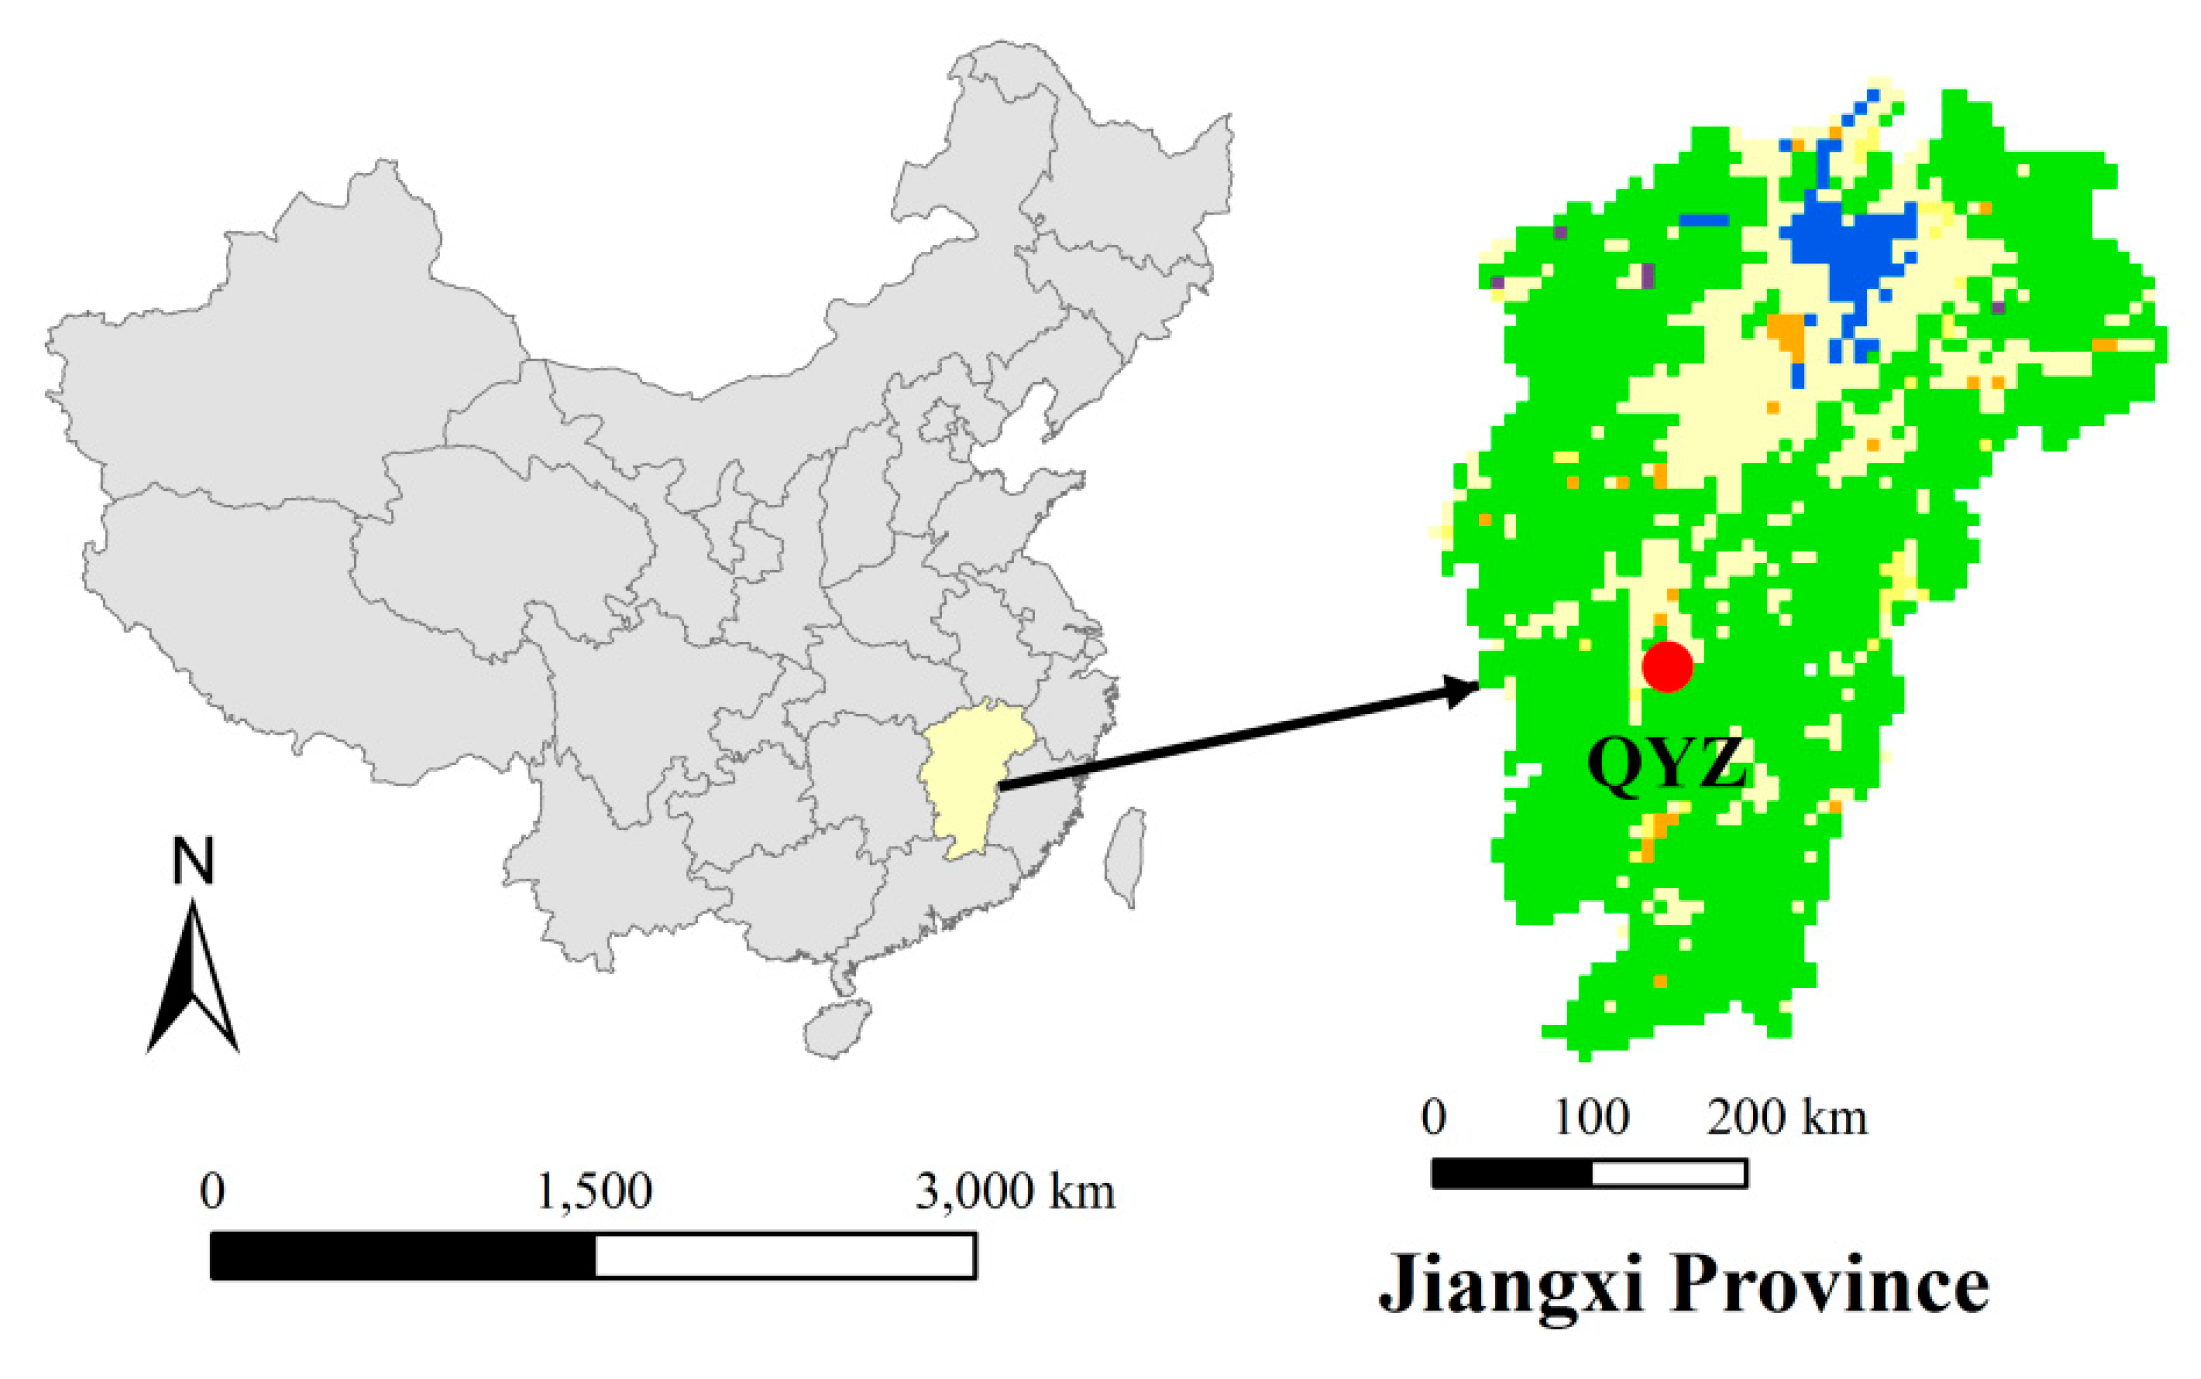
2.1. Study Area

The experimental site is located at Qianyanzhou (QYZ) Ecological Research Station (26°44′ N, 115°03′ E) in Jiangxi Province of subtropical China (Figure 1). The soils belong to a typical red soil, which developed from red sandstone, glutenite, and fluvial sediment. The study site has a typical subtropical monsoon climate. The mean annual temperature is 17.9 °C (1985–2008), with the highest daily mean temperature of 28.8 °C occurring in July and the lowest of 6.4 °C occurring in January. The average annual precipitation is 1469 mm (1985–2008), which mainly occurs from March to June. The mean air temperature and total precipitation of 2016 were 18.9 °C and 1946 mm, respectively. The major species at the QYZ site are the slash pine (Pinus elliottii), Masson’s pine (Pinus massoniana) and Schima (Schima superba). Slash pine and Masson’s pine are the pioneer species, which were mainly established in 1980s. The initial tree density of both species was about 750 stem ha−1 [31].

2.2. CO2 Response Curve

Leaf gas exchanges of both species were measured on the top of a bamboo tower. The height and size of the bamboo tower are approximately 14 m and 5 m × 10 m, respectively. An open gas-exchange system (Li-6400; Li-Cor, Inc., Lincoln, NE, USA) with a red-blue light source (6400-02B) was used to measure the CO2 responses of the leaf photosynthesis of two species (SP and MP) over the growing season. The seasonal variability of photosynthetic parameters was measured over four periods in the 2016 growing season (i.e., 31 March–4 April (Apr), 4–9 June (Jun), 2–7 September (Sep), and 10–15 November (Nov)). The observations of each tree species were repeated for 3 sunny days in each period (excepting the observations for SP in April, for which the available observation days included only one day). The photosynthetic parameters of each day were measured from 8:00 to 16:00, with a measuring interval of 80 min. Twelve needles of each SP and MP sample were put into a 2 × 3 cm2 leaf cuvette, and the cuvette was plugged with plasticine to prevent leakage [15]. Seven leaf samples (12 needles in each leaf sample) of each species were measured each day. Each CO2 response curve lasted for approximately 40 min. We tagged the sampled branches to repeat measurements of the same leaf position over the growing season. CO2 response curves were measured under saturating light conditions, at photosynthetic photon flux density (PPFD) level of 1500 μmol m−2 s−1. The CO2 concentrations (Ca) were initially set to range from 400 μmol CO2 mol−1 air to 50 μmol CO2 mol−1 air and then to range from 400 μmol CO2 mol−1 air to 1400 μmol CO2 mol−1 air with a total of 10 points (400, 300, 200, 100, 50, 400, 600, 900, 1000, 1400 μmol CO2 mol−1 air). Prior to measuring CO2 response curves, twelve leaves were acclimated in 2 × 3 cm2 leaf cuvette at saturated light, ambient temperature and a CO2 concentration of 400 μmol CO2 mol−1 air for 20 min. All measurements were carried out under ambient temperature. The relative humidity was set to be within 60–80%, and the flow rate through the chamber was set at 500 mmol s−1 for photosynthesis. Leaf temperature was measured by the energy balance method, and logged based on the leaf gas-exchange system (Li-Cor 6400).
The A–Ci curves were fitted using a tool developed by Kevin Tu (www.landflux.org/Tools.php). The photosynthesis parameters, including Vcmax and Jmax, were estimated by plotting the intercellular CO2 concentration with the net photosynthetic rate. Vcmax and Jmax were normalized at a standard temperature of 25 °C by using the Arrhenius equation [20,32]. The Asat value used in this study was the net photosynthetic rate with a CO2 concentration of 400 μmol mol−1 under saturated light intensity. The corresponding gs,w (stomatal conductance to water, mol H2O m−2 s−1) was logged. gs,w was 1.6 times higher than the gs,c (stomatal conductance to CO2, mol CO2 m−2 s−1) and we converted the gs,w to gs,c in this study. Vapour pressure deficit (VPD) was also logged based on the gas-exchange system. The specific leaf area (SLA) was calculated using the leaf area and leaf dry weights. As suggested by Gower et al. [33], the needle was approximated as a cylinder, and leaf area was calculated on the basis of half the total surface area [34].
For MP (two-needle leaves), the leaf area enclosed in the cuvette was calculated as Li et al. [35]:
leaf area = [(2h + d)π/4 + d] × 1 × n
For SP (three-needle leaves), the leaf area enclosed in the cuvette was calculated as Li et al. [35]:
leaf   area   =   [ ( 3 d / 6 + h / 2 ) π   + 3 d ]   ×   1   ×   n
where d (cm) and h (cm) were the width and thickness of leaves, respectively, l was the length of leaf samples enclosed in leaf cuvette (i.e., 3 cm), and n was the number of leaf samples enclosed in the leaf cuvette.

2.3. Statistical Analysis

The photosynthesis parameters were calculated by fitting the A–Ci curve using a tool developed by Kevin Tu. Independent sample t-tests with a 95% confidence level were used to evaluate the differences among the variables. Prior to analysis, we used Levene’s test (p < 0.05) to assess the homogeneity of variables. The performances of relationships between variables were evaluated by the coefficient of determination (R2). Structural equation modelling (SEM) was applied to analyse the effect of leaf temperature and VPD on the stomatal conductance and biochemical processes of leaf photosynthetic rate. We used AMOS 17.0 statistical analysis software to establish our model and used the root mean square error of approximation (RMSEA) to examine the performance of our model. All the statistical figures were plotted in Origin 8.5.1.

3. Results

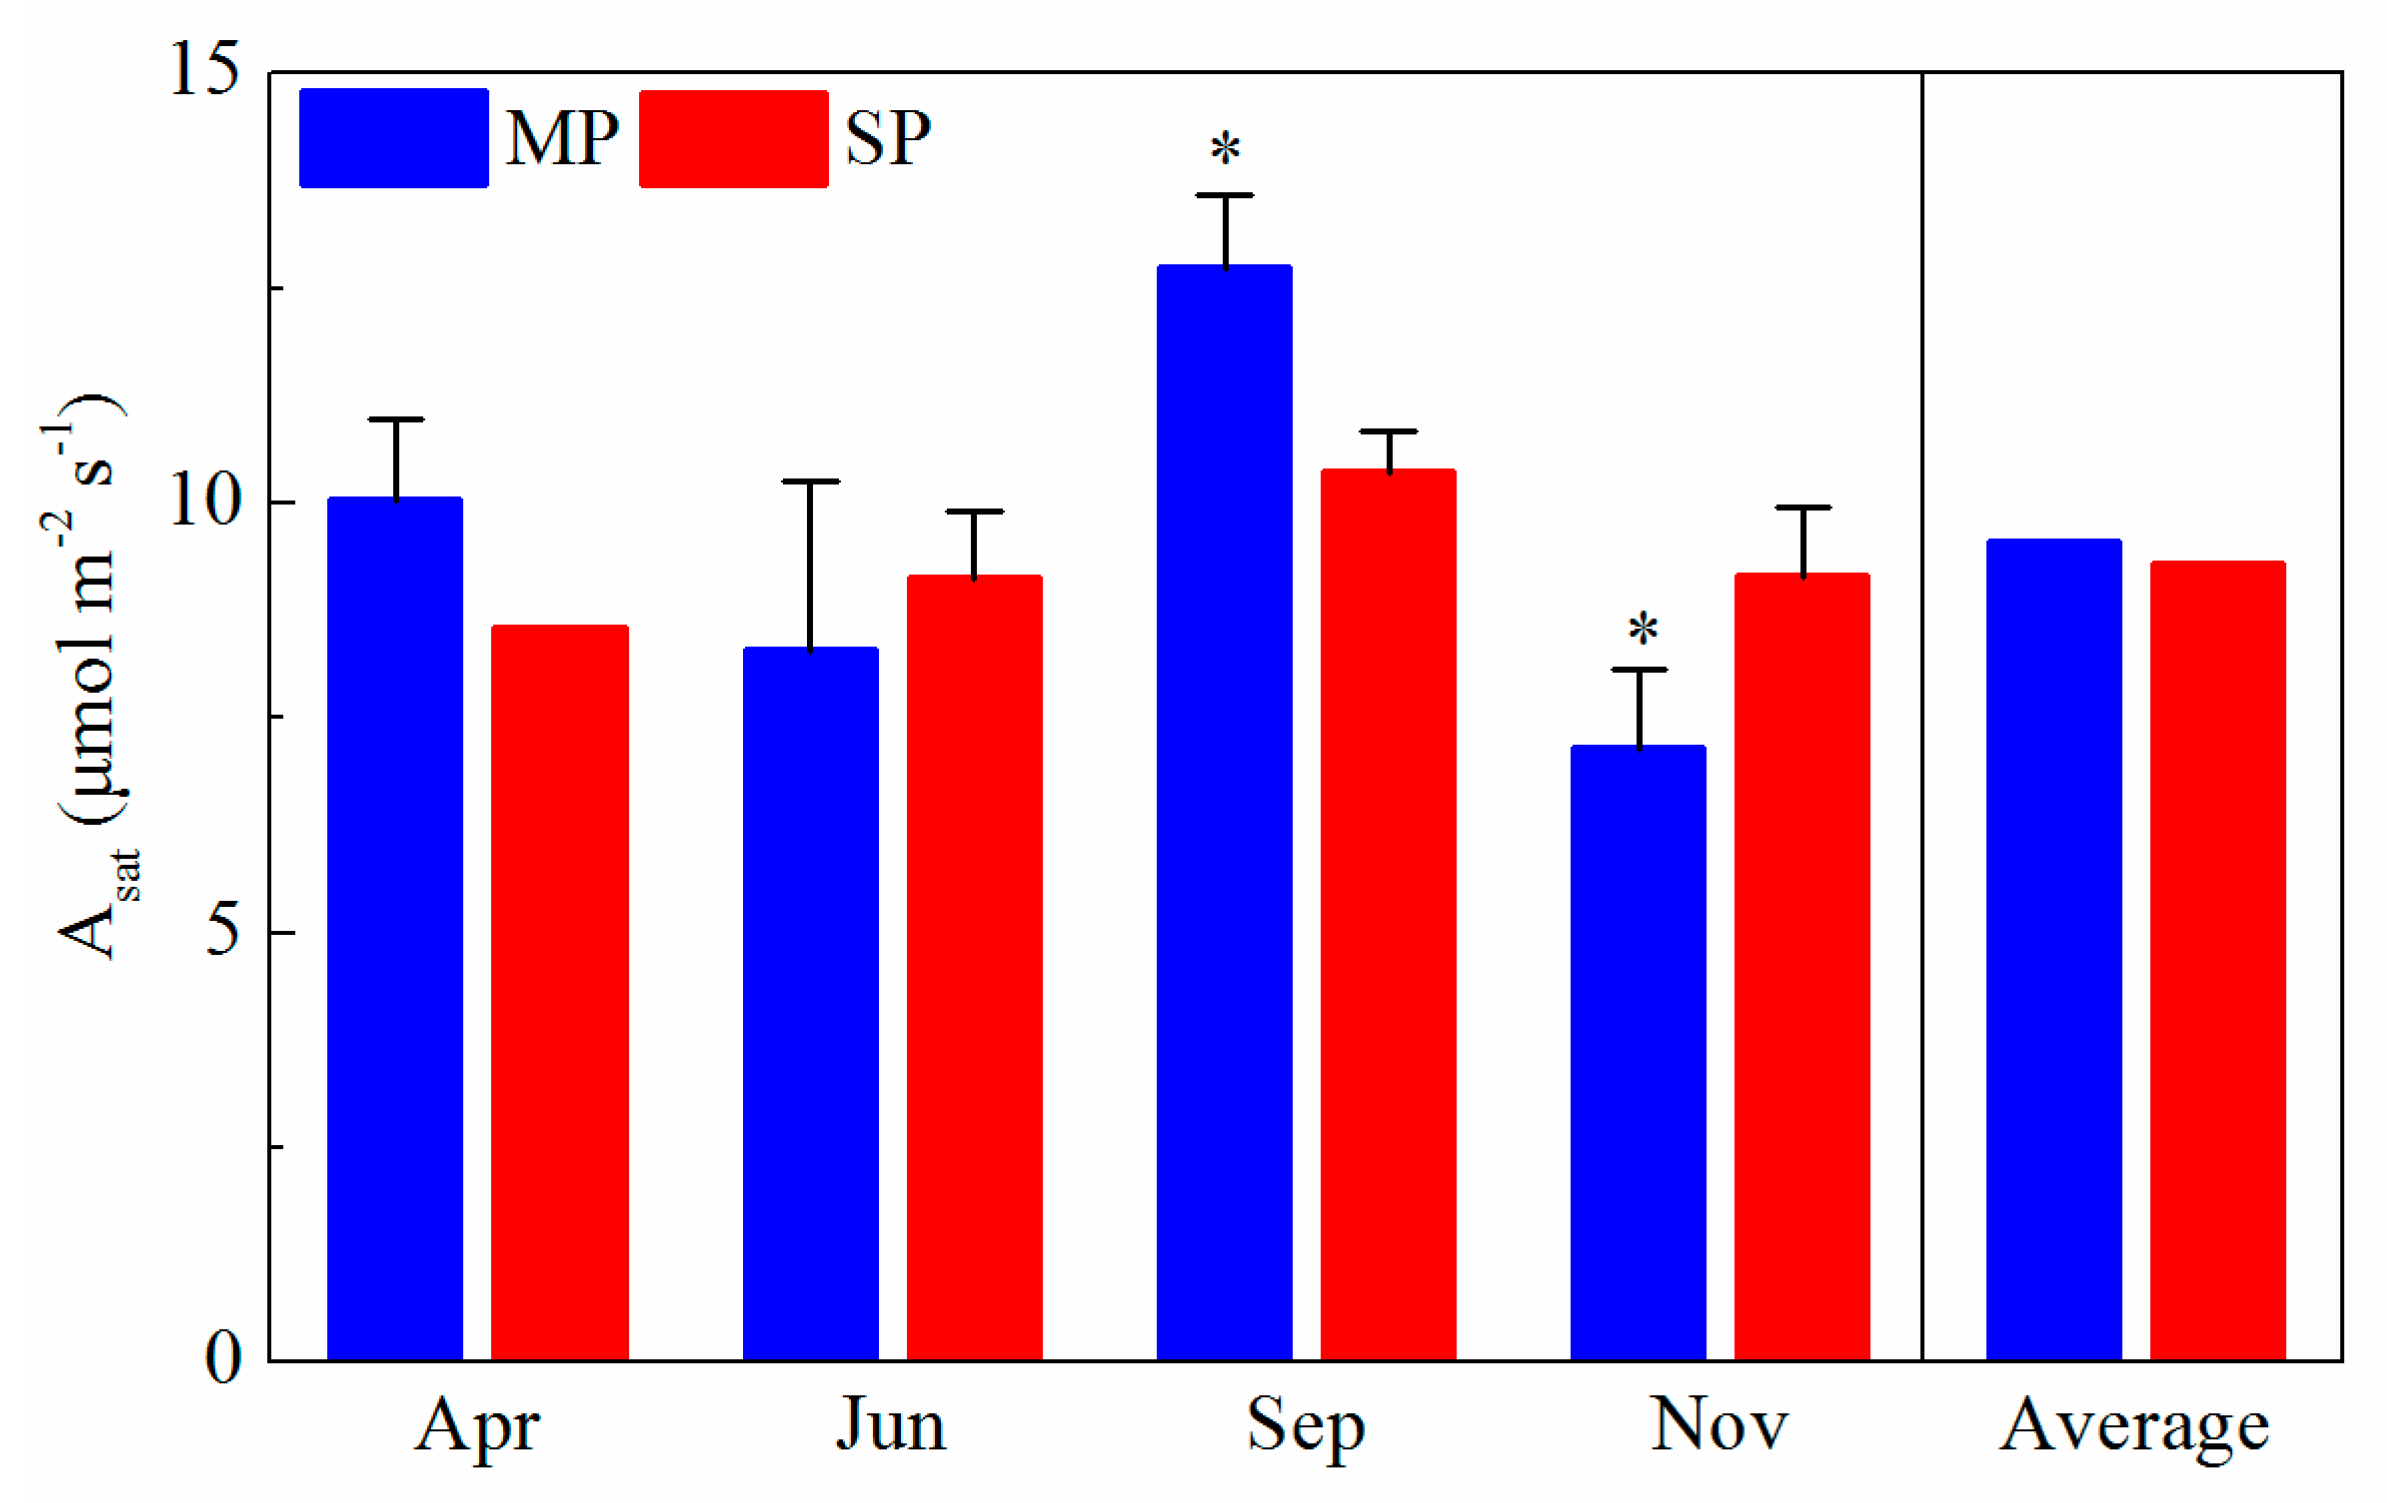
3.1. Seasonal Variations in Environmental Condition, Leaf Traits, and Leaf Photosynthetic Rates

The mean and highest leaf temperatures for MP during the experimental period were 28.2 °C and 33.2 °C, respectively (Table 1). For SP, the mean and highest leaf temperatures were 30.5 °C and 35.3 °C, respectively. The highest leaf temperatures of both species occurred in June. The average leaf temperature of SP was significantly higher than that of MP (p = 0.02) during the entire experimental period. However, there was no significant difference in the average VPD values of MP and SP (p > 0.05). In general, high leaf temperatures were accompanied by high VPD values at the QYZ site. The maxima of VPD appeared in June for both species (Table 1). A significantly lower SLA was observed for SP (p < 0.001) during the measurement period (Table 1).
There exist significant differences in the Asat values of MP and SP (p < 0.001) in September and November (p < 0.05) (Figure 2). However, there was no significant difference in the average Asat values between MP (9.54 μmol m−2 s−1) and SP (9.28 μmol m−2 s−1) (p > 0.05) during the experimental period. The Asat values were higher in MP than in SP in April and September. The maxima of Asat occurred in September for both species, with the value of 12.73 μmol m−2 s−1 and 10.34 μmol m−2 s−1 (Figure 2).

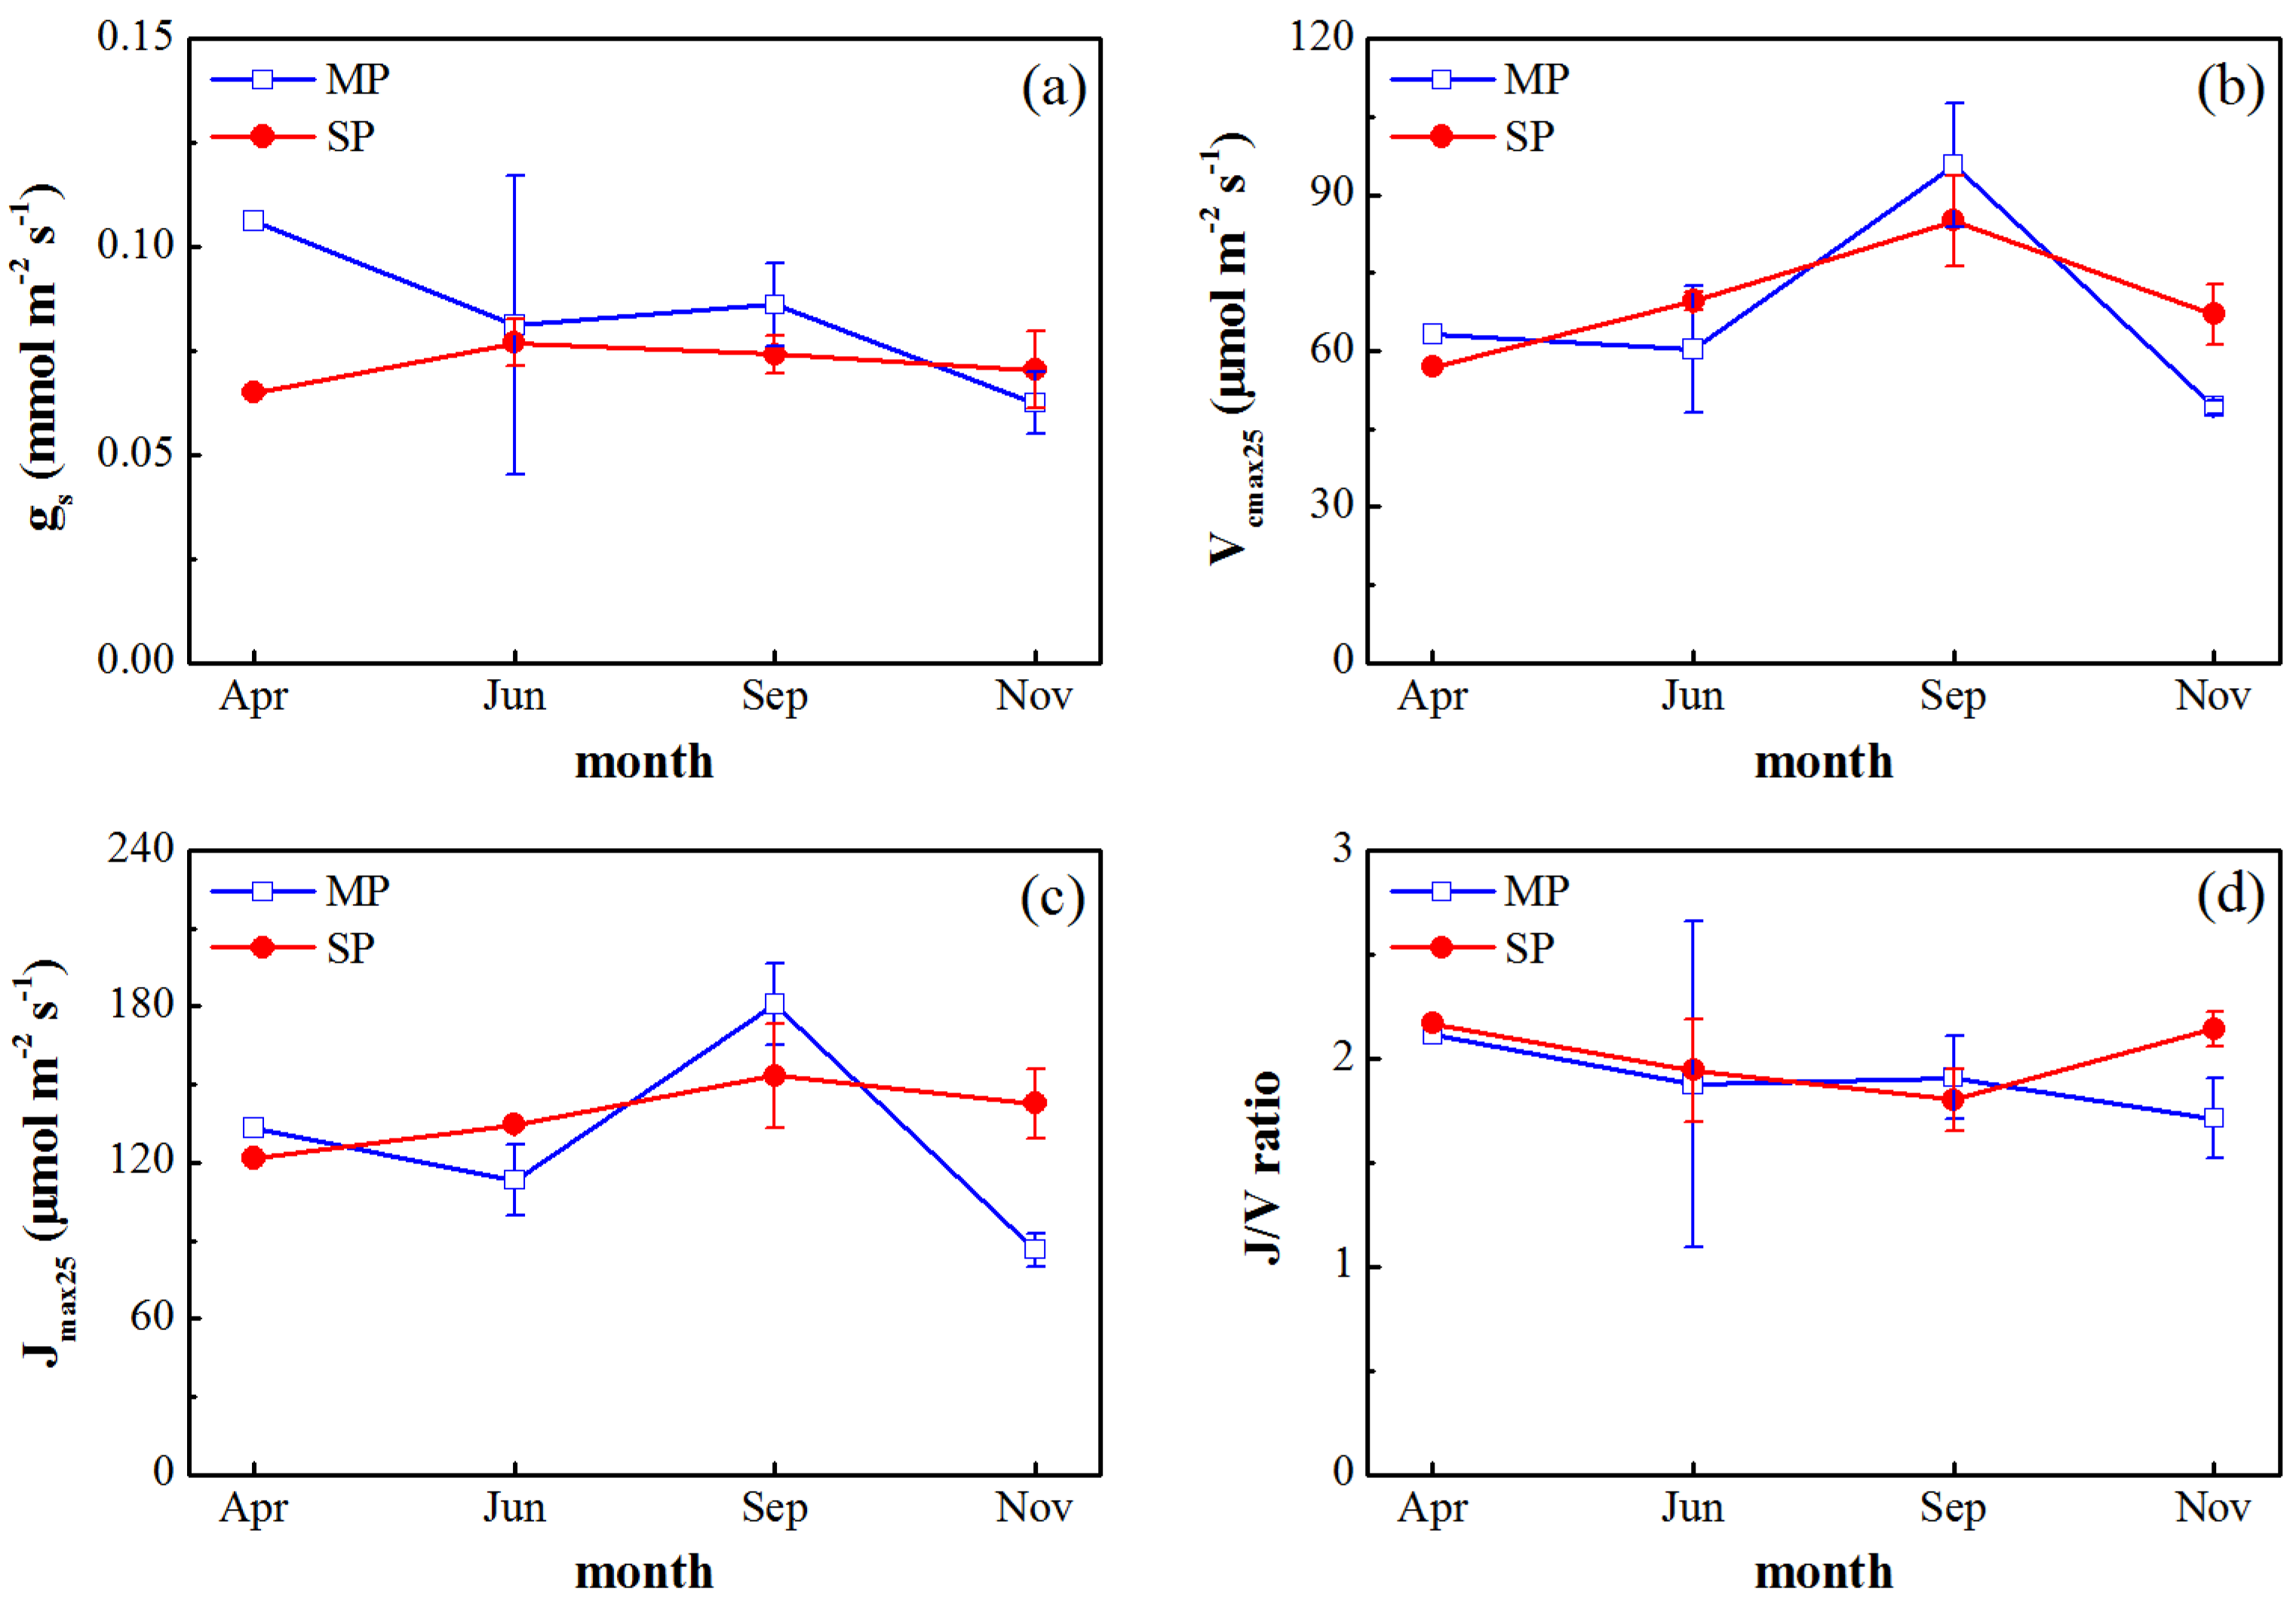
3.2. Seasonal Variations in Gas Exchange Parameters

The average gs values of MP and SP during the experimental period were 0.08 mol m−2 s−1 and 0.07 mol m−2 s−1, respectively. The seasonal patterns of gs differed from those of leaf photosynthetic rate for both species. The maximum of gs occurred in April for MP, with the value of 0.11 mol m−2 s−1. For SP, the maximum of gs occurred in June, with the value of 0.08 mol m−2 s−1 (Figure 3a).
The seasonal patterns of Vcmax25 were consistent with the seasonal patterns of leaf photosynthetic rate for both species (Figure 2 and Figure 3b). The average Vcmax25 values of MP and SP were 67.10 and 69.64 μmol m−2 s−1, respectively. Vcmax25 reached maxima in September for both species, with the values of 95.73 and 85.05 μmol m−2 s−1. For MP, Vcmax25 was higher in April, with the value of 63.16 μmol m−2 s−1. Vcmax25 decreased by 4.5% in June compared to that in April, and then recovered in September. Vcmax25 declined markedly in November. For SP, Vcmax25 was 56.89 μmol m−2 s−1 in April and Vcmax25 was 22.3% higher in June than that in April. Vcmax25 reached its maximum in September, and then declined slightly in November. Vcmax25 values were higher in MP than that in SP in April and September, which were consistent with the patterns of leaf photosynthetic rates (Figure 2 and Figure 3b). The seasonal patterns of Jmax25 were basically consistent with those of Vcmax25 for both species (Figure 3c). J/V ratios of MP and SP reached maxima of 2.11 and 2.17 in April and minima of 1.71 and 1.80 in November and September, respectively (Figure 3d).

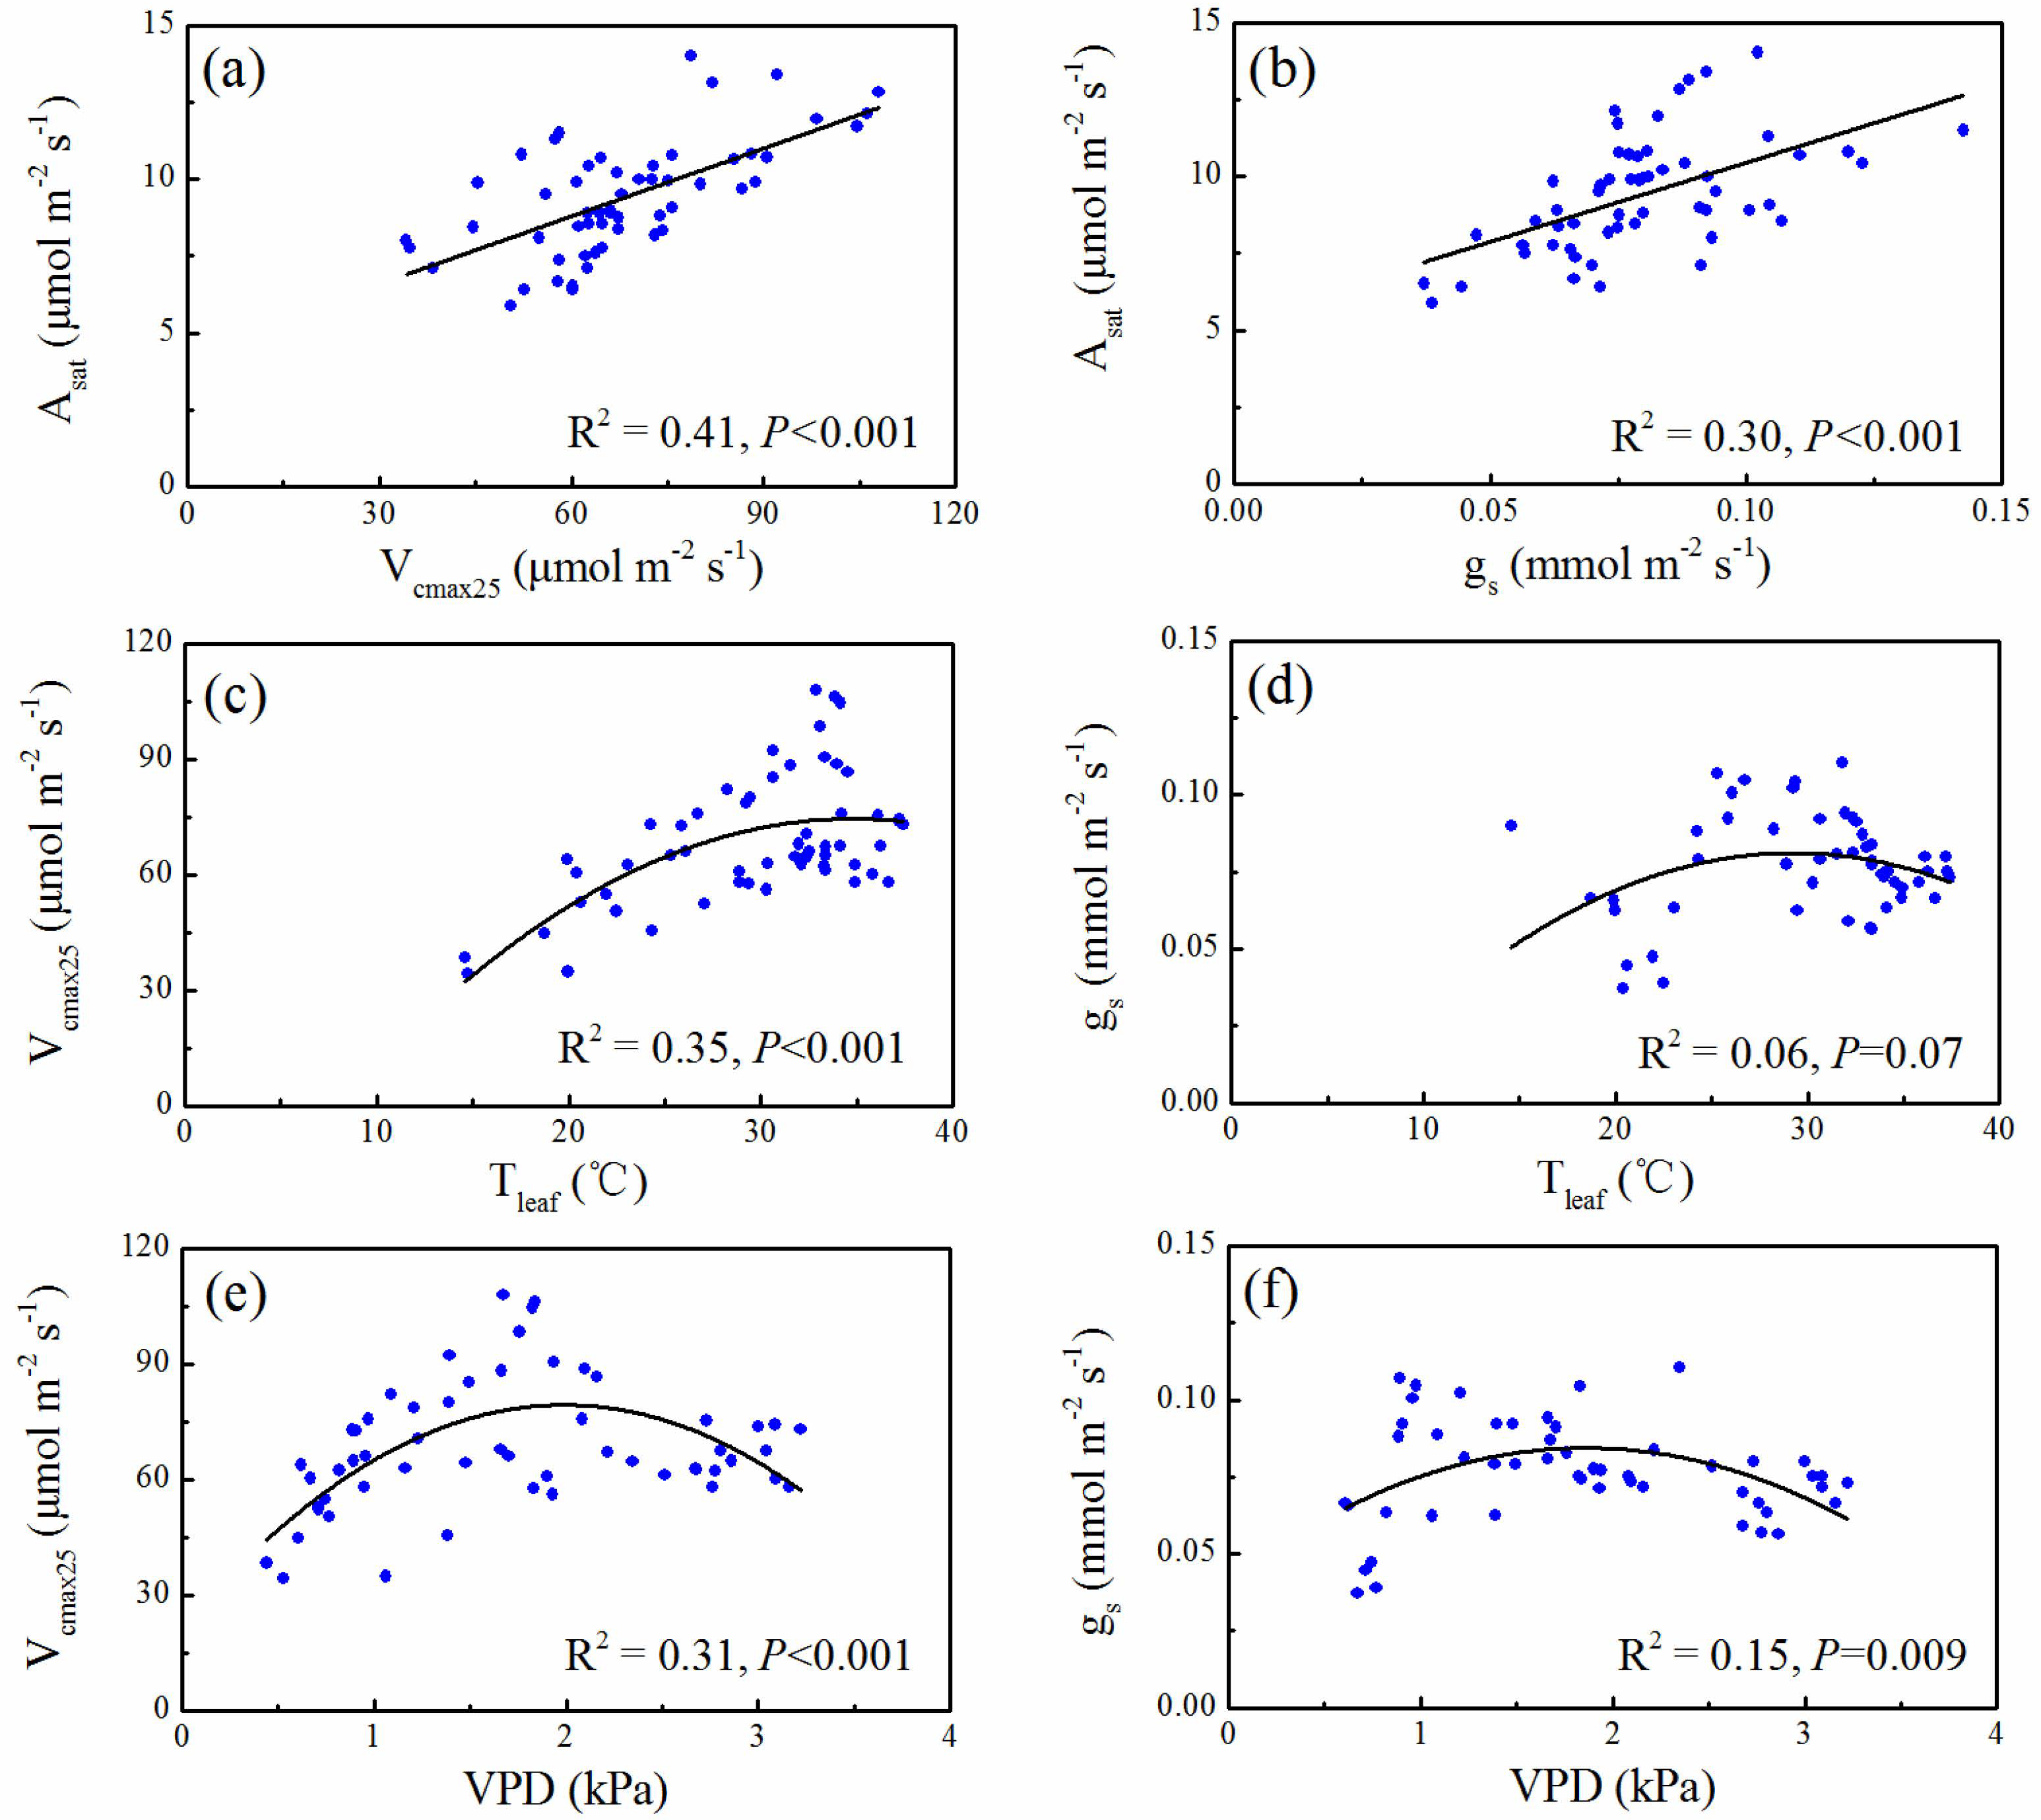
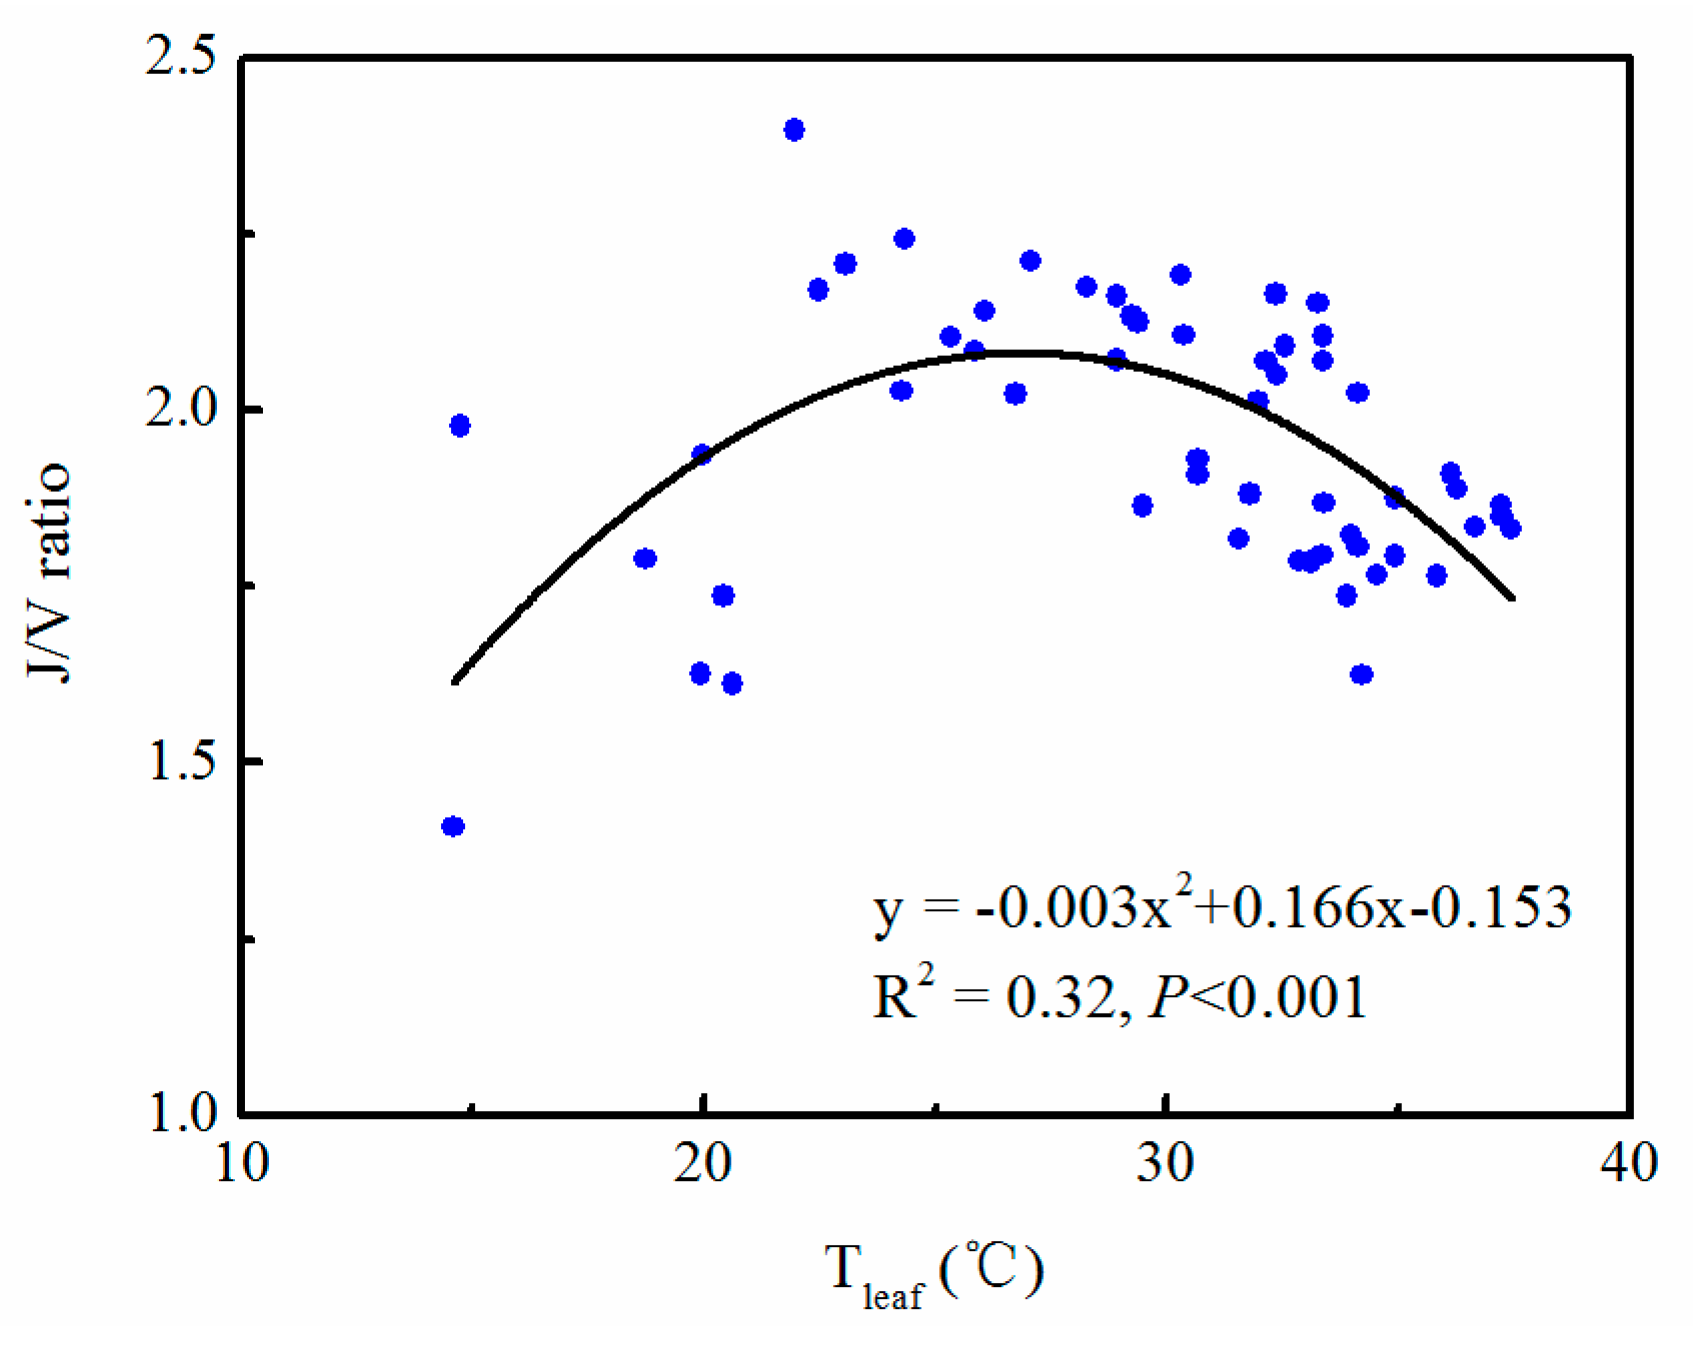
3.3. Correlation between Gas Exchange Parameters and Leaf Temperature and VPD

There were significant positive correlations between photosynthetic rate and both stomatal conductance and biochemical parameter (Vcmax25) (p < 0.001) (Figure 4a,b) for both species. The correlation between biochemical parameter and photosynthetic rate (R2 = 0.41) was larger than the correlation between stomatal conductance and photosynthetic rate (R2 = 0.30) (Figure 4a,b). The effect of leaf temperature on Vcmax25 was significant (R2 = 0.35, p < 0.001), but there was no significant correlation between leaf temperature and gs (p > 0.05) (Figure 4c,d). VPD had significant effects on both biochemical parameter and stomatal conductance (R2 = 0.31, p < 0.001 and R2 = 0.15, p = 0.009) (Figure 4e,f).
In our study, J/V ratio was not constant at seasonal scale (Figure 3d), which was significantly correlated with leaf temperature (Figure 5). The J/V ratio increased with leaf temperature, and then decreased as the leaf temperature continued to rise (Figure 5). J/V ratio reached its maximum at the leaf temperature of 27.27 °C during the experimental period. The highest point of the nonlinear fitting curve was 2.14 (Figure 5).

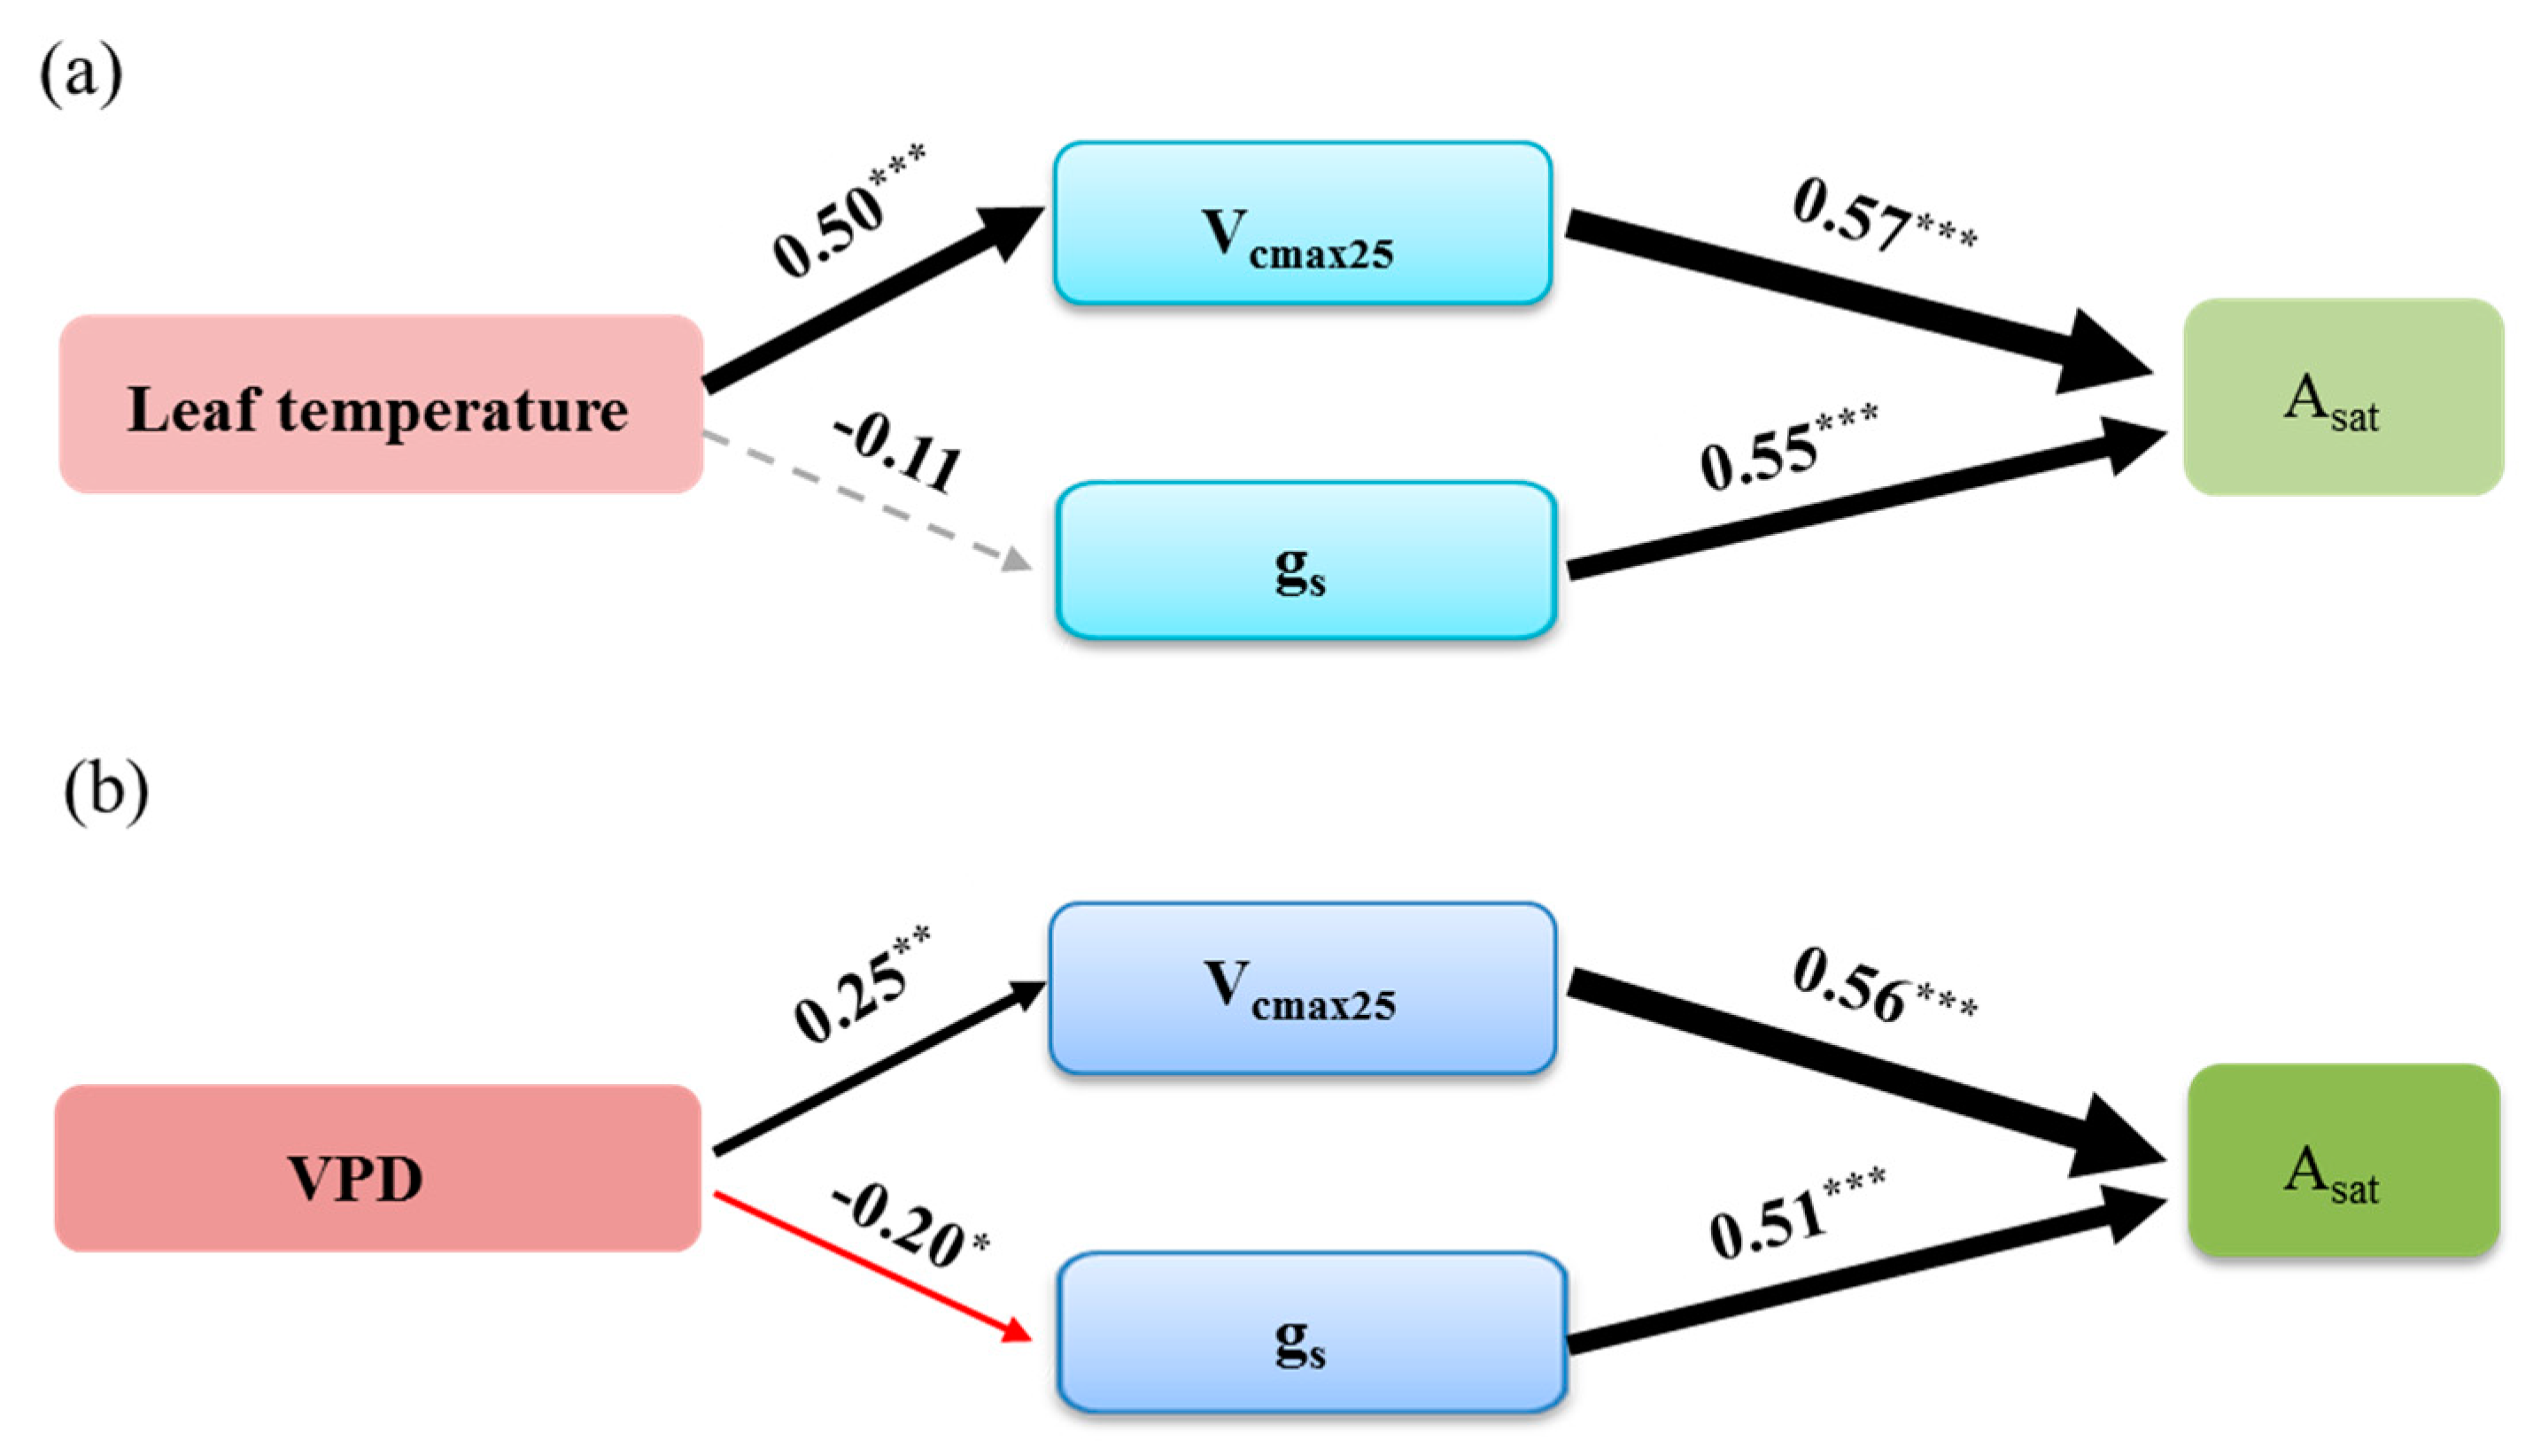
3.4. The Effect of Stomatal and Biochemical Parameters on Asat in Response to Leaf Temperature and VPD

SEM analysis showed that Vcmax25 played an important role in limiting leaf photosynthetic rate in response to leaf temperature and VPD. The positive effect of leaf temperature on Asat was mainly produced through its positive effect on Vcmax25 (the path coefficient was 0.5). Leaf temperature had no significant effect on stomatal conductance (p > 0.05) (Figure 6a). The path coefficients between Vcmax25 and gs with Asat were 0.57 and 0.55, respectively (Figure 6a). The effect of VPD on Asat was mainly derived via its positive effect on Vcmax25 and negative effect on gs (the path coefficients were 0.25 and −0.20, respectively) (Figure 6b). The path coefficients between Vcmax25 and gs with Asat were 0.56 and 0.51, respectively. The effect of biochemical parameter on Asat is greater than the effect of stomatal conductance on Asat (Figure 6b).

4. Discussion

Environmental conditions play an important role in stomatal conductance and biochemical processes and thus regulate leaf photosynthetic rate in forests. Our results highlighted the importance of Vcmax25 in limiting leaf photosynthetic rate in response to leaf temperature and VPD (Figure 6), which confirmed our hypothesis. The positive effects of leaf temperature on photosynthetic rate were mainly due to its positive effect on the biochemical process (Figure 6). We attribute this phenomenon to the fact that Vcmax25 is closely related to temperature [13,36]. Temperature directly influences the reactions catalyzed by Rubisco and the electron transport chain along with stomatal conductance, thus photosynthesis is recognized as a very temperature-sensitive process [13]. Compared with the stomatal conductance, temperature directly impacts Rubisco activity [13,37]. Elevated temperatures can enhance Vcmax25 before reaching an optimum temperature. However, an elevated temperature will lower Vcmax25 when the temperature exceeds its optimum value [36]. For terrestrial ecosystems, plants have adapted to the current regional climate, the highest monthly temperature are generally close to the optimal value for maximal rates of photosynthesis [38]. Thus, Vcmax25 generally showed a positive response to increased temperature because temperatures are frequently lower than optimal (Figure 4 and Figure 6a). Some studies showed that stomatal conductance increased in response to increasing temperature [39,40]. The possible underlying mechanism is that high temperature can decrease water viscosity and increase plant membrane permeability and thus increase water supply to guard cells [39], which will result in higher stomatal conductance. Such behavior of stomatal conductance in response to high temperature can benefit plants by cooling leaves in hot environments [41,42]. However, the increasing temperature can drive the increase of VPD, which will lead to the decrease of stomatal conductance [23,43]. Leaf stomatal conductance could increase as VPD increases when VPD is low but decrease with increasing VPD when it is high [23,44]. Therefore, changes in stomata are the result of multiple environmental factors [45]. In our study, the effect of VPD on Asat was partly through its negative effect on gs (Figure 6b). In addition, the effect of VPD on stomatal conductance also influences carboxylation rate because vegetation absorbs CO2 from the atmosphere through stomata [11,46]. Thus, Vcmax25 and gs simultaneously affect the photosynthetic rates in response to VPD (Figure 6).
The J/V ratio reflects resource allocation between enzymatic (i.e., Rubisco) and light-harvesting (i.e., electron transport) capabilities [47,48,49]. J/V ratio was assumed to be constant in many process-based models. Medlyn et al. [12] reported a J/V ratio of 1.67 across a large range of crops and tree species. However, many studies have indicated the J/V ratio varies with the season [50,51,52]. Our results showed that J/V ratio was significantly correlated with leaf temperature in subtropical evergreen coniferous forests. With the increase of leaf temperature, the J/V ratio increased first and then decreased (Figure 5). The seasonal variation in the J/V ratio is due to the difference in the partitioning of leaf nitrogen between different fractional pools [53]. This partitioning involves the distribution of leaf nitrogen between the Rubisco and light-harvesting fractions [54,55,56]. At low temperatures, More N is allocated to the light-harvesting complex to absorb more light energy for photosynthesis. At high temperatures, previous studies have suggested that more N should be invested in the RuBP carboxylase process to optimize the photosynthesis efficiency [54,55,56,57]. Thus, the response of J/V ratio to leaf temperature is parabolic, with a peak at an optimum temperature in subtropical evergreen plantation (Figure 5).
Previous studies have focused on the growth rates of exotic and native plant species [58,59,60,61]. However, these studies often show inconsistent results due to differences of regions and environments. For example, previous studies showed that the growth rates of exotic species were superior to those of native species [58,59] and have also shown that the native species have higher growth rates [62,63]. In our study, there was no significant difference in Asat of MP and SP (p < 0.05) during the experimental period (Figure 2). SP, as an exotic species, may have showed a faster growth rate than the native species at the beginning of planting. However, there was no significant difference in growth rate between the two species after planting for 20 years [62,63]. Exotic species (SP) can be used as pioneer trees for vegetation restoration in subtropical China. But, there is no obvious growth advantage of exotic species in the late stage of planting compared with native species. This finding can provide an effective approach on how to select exotic or native species for planting in subtropical forest, which may give better suggestions for forest management.
Our study captured the seasonal variations of photosynthetic parameters based on field gas-exchange measurement and thus explored the effect of leaf temperature and VPD on stomatal conductance and biochemical processes of leaf photosynthesis. Studying the environmental factors influencing physiological process of photosynthesis allows us to better understand the mechanism of CO2 uptake and emission by plants under a changing climate. Furthermore, the knowledge about plants’ responses under changing environmental conditions can provide some suggestions for effectively mitigating greenhouse gas emissions and environmental sustainability.
In the future, the cycle of field observation of CO2 response curves can be set for one month. This will reduce uncertainties in measurement data and enhance the reliability of result. In addition, the difficulty in accurately evaluating Vcmax25 has made photosynthetic rate a key source of uncertainty in C cycle modelling. Recent studies have utilized leaf chlorophyll content, instead of leaf total nitrogen content, as a proxy for Vcmax25 in croplands and deciduous forests [6,26]. However, there is limited information in the literature on the relationship between Vcmax25 and leaf chlorophyll content in subtropical evergreen forests. We can evaluate the relationship between Vcmax25 and leaf chlorophyll content and explore the role of leaf chlorophyll content in determining leaf photosynthetic capacity in subtropical evergreen coniferous forests in the future.

5. Conclusions

In conclusion, this study evaluated the effects of stomatal and biochemical parameters on photosynthetic rate in response to leaf temperature and VPD based on leaf gas exchange measurements in subtropical evergreen plantation. Our results showed that there was no significant difference in the light-saturated photosynthetic rate (Asat) between slash pine and Masson’s pine during the experimental period. The seasonal patterns of gs differed from those of leaf photosynthetic rate for both species. However, the seasonal patterns of Vcmax25 were basically consistent with those of Asat. The positive effect of leaf temperature on Asat was mainly produced through its positive effect on Vcmax25 based on SEM. Leaf temperature had no significant effect on stomatal conductance. However, Vcmax25 and gs simultaneously affected Asat in response to VPD. Our results highlighted the importance of Vcmax25 in limiting leaf photosynthetic rate in response to leaf temperature and VPD in subtropical evergreen coniferous plantations.

Author Contributions

Conceptualization, Y.L. and L.Z.; Data curation, Y.L.; Investigation, Y.L. and J.C.; Supervision, L.Z., S.W. and Y.C.; Writing—Original Draft, Y.L.; Writing—Review & Editing, L.Z., S.W. and Y.C.

Funding

This research was funded by the National Key Research and Development Program of China (No. 2017YFC0503803, NO. 2017YFB0504000) and the National Natural Science Foundation of China (No. 41401110, No. 41871084, No. 41571192).

Acknowledgments

We thank Zhaohui Qian for his field assistance. We also thank the staff of Qianyanzhou Ecological Research Station for the use of their facilities.

Conflicts of Interest

The authors declare no conflict of interest.

References

  1. Pan, Y.D.; Birdsey, R.A.; Fang, J.Y.; Houghton, R.; Kauppi, P.E.; Kurz, W.A.; Phillips, O.L.; Shvidenko, A.; Lewis, S.L.; Canadell, J.G.; et al. A Large and Persistent Carbon Sink in the World’s Forests. Science 2011, 333, 988–993. [Google Scholar] [CrossRef] [PubMed]
  2. Yu, G.R.; Chen, Z.; Piao, S.L.; Peng, C.H.; Ciais, P.; Wang, Q.F.; Li, X.R.; Zhu, X.J. High carbon dioxide uptake by subtropical forest ecosystems in the East Asian monsoon region. Proc. Natl. Acad. Sci. USA 2014, 111, 4910–4915. [Google Scholar] [CrossRef] [PubMed] [Green Version]
  3. Dodet, M.; Collet, C. When should exotic forest plantation tree species be considered as an invasive threat and how should we treat them? Biol. Invasions 2012, 14, 1765–1778. [Google Scholar] [CrossRef]
  4. Wang, Y.; Wang, H.; Xu, M.; Ma, Z.; Wang, Z.-L. Soil organic carbon stocks and CO2 effluxes of native and exotic pine plantations in subtropical China. Catena 2015, 128, 167–173. [Google Scholar] [CrossRef]
  5. Ma, Z.; Hartmann, H.; Wang, H.; Li, Q.; Wang, Y.; Li, S. Carbon dynamics and stability between native Masson pine and exotic slash pine plantations in subtropical China. Eur. J. For. Res. 2013, 133, 307–321. [Google Scholar] [CrossRef]
  6. Croft, H.; Chen, J.M.; Luo, X.; Bartlett, P.; Chen, B.; Staebler, R.M. Leaf chlorophyll content as a proxy for leaf photosynthetic capacity. Glob. Chang. Biol. 2017, 23, 3513–3524. [Google Scholar] [CrossRef] [PubMed]
  7. Feng, D.; Wang, Y.W.; Lu, T.G.; Zhang, Z.G.; Han, X. Proteomics analysis reveals a dynamic diurnal pattern of photosynthesis-related pathways in maize leaves. PLoS ONE 2017, 12, e0180670. [Google Scholar] [CrossRef] [PubMed]
  8. Haase, P.; Pugnaire, F.I.; Clark, S.C.; Incoll, L.D. Environmental control of canopy dynamics and photosynthetic rate in the evergreen tussock grass Stipa tenacissima. Plant Ecol. 1999, 145, 327–339. [Google Scholar] [CrossRef]
  9. Hoyaux, J.; Moureaux, C.; Tourneur, D.; Bodson, B.; Aubinet, M. Extrapolating gross primary productivity from leaf to canopy scale in a winter wheat crop. Agric. For. Meteorol. 2008, 148, 668–679. [Google Scholar] [CrossRef]
  10. Xu, Q.Z.; Huang, B.R. Effects of differential air and soil temperature on carbohydrate metabolism in creeping bentgrass. Crop Sci. 2000, 40, 1368–1374. [Google Scholar] [CrossRef]
  11. Li, Y.; Liu, J.; Zhou, G.; Huang, W.; Duan, H. Warming effects on photosynthesis of subtropical tree species: A translocation experiment along an altitudinal gradient. Sci. Rep. 2016, 6, 24895. [Google Scholar] [CrossRef] [PubMed]
  12. Medlyn, B.E.; Dreyer, E.; Ellsworth, D.; Forstreuter, M.; Harley, P.C.; Kirschbaum, M.U.F.; Le Roux, X.; Montpied, P.; Strassemeyer, J.; Walcroft, A.; et al. Temperature response of parameters of a biochemically based model of photosynthesis. II. A review of experimental data. Plant Cell Environ. 2002, 25, 1167–1179. [Google Scholar] [CrossRef] [Green Version]
  13. Yamori, W.; Hikosaka, K.; Way, D.A. Temperature response of photosynthesis in C-3, C-4, and CAM plants: Temperature acclimation and temperature adaptation. Photosynth. Res. 2014, 119, 101–117. [Google Scholar] [CrossRef] [PubMed]
  14. Singh, S.K.; Reddy, V.R. Methods of mesophyll conductance estimation: Its impact on key biochemical parameters and photosynthetic limitations in phosphorus-stressed soybean across CO2. Physiol. Plant 2016, 157, 234–254. [Google Scholar] [CrossRef] [PubMed]
  15. Zhou, L.; Wang, S.Q.; Chi, Y.G.; Li, Q.K.; Huang, K.; Yu, Q.Z. Responses of photosynthetic parameters to drought in subtropical forest ecosystem of China. Sci. Rep. 2015, 5. [Google Scholar] [CrossRef] [PubMed]
  16. Munjonji, L.; Ayisi, K.K.; Boeckx, P.; Haesaert, G. Stomatal Behavior of Cowpea Genotypes Grown Under Varying Moisture Levels. Sustainability 2018, 10, 12. [Google Scholar] [CrossRef]
  17. Craparo, A.C.W.; Steppe, K.; Van Asten, P.J.A.; Laderach, P.; Jassogne, L.T.P.; Grab, S.W. Application of thermography for monitoring stomatal conductance of Coffea arabica under different shading systems. Sci. Total Environ. 2017, 609, 755–763. [Google Scholar] [CrossRef] [PubMed]
  18. Egea, G.; Verhoef, A.; Vidale, P.L. Towards an improved and more flexible representation of water stress in coupled photosynthesis-stomatal conductance models. Agric. For. Meteorol. 2011, 151, 1370–1384. [Google Scholar] [CrossRef]
  19. Farquhar, G.D.; Caemmerer, S.V.; Berry, J.A. A Biochemical-Model of Photosynthetic CO2 Assimilation in Leaves of C-3 Species. Planta 1980, 149, 78–90. [Google Scholar] [CrossRef] [PubMed]
  20. Sharkey, T.D.; Bernacchi, C.J.; Farquhar, G.D.; Singsaas, E.L. Fitting photosynthetic carbon dioxide response curves for C-3 leaves. Plant Cell Environ. 2007, 30, 1035–1040. [Google Scholar] [CrossRef] [PubMed]
  21. Wang, Q.G.; Chun, J.A.; Fleisher, D.; Reddy, V.; Timlin, D.; Resop, J. Parameter Estimation of the Farquhar-von Caemmerer-Berry Biochemical Model from Photosynthetic Carbon Dioxide Response Curves. Sustainability 2017, 9, 1288. [Google Scholar] [CrossRef]
  22. Lin, H.; Chen, Y.J.; Zhang, H.L.; Fu, P.L.; Fan, Z.X. Stronger cooling effects of transpiration and leaf physical traits of plants from a hot dry habitat than from a hot wet habitat. Funct. Ecol. 2017, 31, 2202–2211. [Google Scholar] [CrossRef]
  23. Damour, G.; Simonneau, T.; Cochard, H.; Urban, L. An overview of models of stomatal conductance at the leaf level. Plant Cell Environ. 2010, 33, 1419–1438. [Google Scholar] [CrossRef] [PubMed]
  24. Grassi, G.; Vicinelli, E.; Ponti, F.; Cantoni, L.; Magnani, F. Seasonal and interannual variability of photosynthetic capacity in relation to leaf nitrogen in a deciduous forest plantation in northern Italy. Tree Physiol. 2005, 25, 349–360. [Google Scholar] [CrossRef] [PubMed] [Green Version]
  25. Zhou, H.R.; Xu, M.; Pan, H.L.; Yu, X.B. Leaf-age effects on temperature responses of photosynthesis and respiration of an alpine oak, Quercus aquifolioides, in southwestern China. Tree Physiol. 2015, 35, 1236–1248. [Google Scholar] [CrossRef] [PubMed] [Green Version]
  26. Alton, P.B. Retrieval of seasonal Rubisco-limited photosynthetic capacity at global FLUXNET sites from hyperspectral satellite remote sensing: Impact on carbon modelling. Agric. For. Meteorol. 2017, 232, 74–88. [Google Scholar] [CrossRef]
  27. Medlyn, B.E.; Zaehle, S.; De Kauwe, M.G.; Walker, A.P.; Dietze, M.C.; Hanson, P.J.; Hickler, T.; Jain, A.K.; Luo, Y.Q.; Parton, W.; et al. Using ecosystem experiments to improve vegetation models. Nat. Clim. Chang. 2015, 5, 528–534. [Google Scholar] [CrossRef] [Green Version]
  28. Zaehle, S.; Medlyn, B.E.; De Kauwe, M.G.; Walker, A.P.; Dietze, M.C.; Hickler, T.; Luo, Y.Q.; Wang, Y.P.; El-Masri, B.; Thornton, P.; et al. Evaluation of 11 terrestrial carbon-nitrogen cycle models against observations from two temperate Free-Air CO2 Enrichment studies. New Phytol. 2014, 202, 803–822. [Google Scholar] [CrossRef] [PubMed]
  29. Zhang, Y.G.; Guanter, L.; Berry, J.A.; Joiner, J.; van der Tol, C.; Huete, A.; Gitelson, A.; Voigt, M.; Kohler, P. Estimation of vegetation photosynthetic capacity from space-based measurements of chlorophyll fluorescence for terrestrial biosphere models. Glob. Chang. Biol. 2014, 20, 3727–3742. [Google Scholar] [CrossRef] [PubMed] [Green Version]
  30. Smith, N.G.; Malyshev, S.L.; Shevliakova, E.; Kattge, J.; Dukes, J.S. Foliar temperature acclimation reduces simulated carbon sensitivity to climate. Nat. Clim. Chang. 2016, 6, 407. [Google Scholar] [CrossRef]
  31. Wang, Y.-S.; Cheng, S.-L.; Yu, G.-R.; Fang, H.-J.; Mo, J.-M.; Xu, M.-J.; Gao, W.-L. Response of carbon utilization and enzymatic activities to nitrogen deposition in three forests of subtropical China. Can. J. For. Res. 2015, 45, 394–401. [Google Scholar] [CrossRef]
  32. Sharkey, T.D. What gas exchange data can tell us about photosynthesis. Plant Cell Environ. 2016, 39, 1161–1163. [Google Scholar] [CrossRef] [PubMed]
  33. Gower, S.T.; Kucharik, C.J.; Norman, J.M. Direct and indirect estimation of leaf area index, f(APAR), and net primary production of terrestrial ecosystems. Remote Sens. Environ. 1999, 70, 29–51. [Google Scholar] [CrossRef]
  34. Chen, J.M.; Rich, P.M.; Gower, S.T.; Norman, J.M.; Plummer, S. Leaf area index of boreal forests: Theory, techniques, and measurements. J. Geophys. Res. Atmos. 1997, 102, 29429–29443. [Google Scholar] [CrossRef] [Green Version]
  35. Li, X.R.; Liu, Q.J.; Cai, Z.; Ze Qing, M.A. Leaf area index measurement of Pinus elliotii plantation. Acta Ecol. Sin. 2006, 26, 4099–4105. [Google Scholar]
  36. Berry, J.; Bjorkman, O. Photosynthetic Response and Adaptation to Temperature in Higher-Plants. Annu. Rev. Plant Phys. 1980, 31, 491–543. [Google Scholar] [CrossRef]
  37. Li, R.S.; Yang, Q.P.; Zhang, W.D.; Zheng, W.H.; Chi, Y.G.; Xu, M.; Fang, Y.T.; Gessler, A.; Li, M.H.; Wang, S.L. Thinning effect on photosynthesis depends on needle ages in a Chinese fir (Cunninghamia lanceolata) plantation. Sci. Total Environ. 2017, 580, 900–906. [Google Scholar] [CrossRef] [PubMed]
  38. Wan, S.Q.; Hui, D.F.; Wallace, L.; Luo, Y.Q. Direct and indirect effects of experimental warming on ecosystem carbon processes in a tallgrass prairie. Glob. Biogeochem. Cycles 2005, 19. [Google Scholar] [CrossRef] [Green Version]
  39. Fredeen, A.L.; Sage, R.F. Temperature and humidity effects on branchlet gas-exchange in white spruce: An explanation for the increase in transpiration with branchlet temperature. Trees Struct. Funct. 1999, 14, 161–168. [Google Scholar] [CrossRef]
  40. Mott, K.A.; Peak, D. Stomatal responses to humidity and temperature in darkness. Plant Cell Environ. 2010, 33, 1084–1090. [Google Scholar] [CrossRef] [PubMed]
  41. Fischer, R.A.; Rees, D.; Sayre, K.D.; Lu, Z.M.; Condon, A.G.; Saavedra, A.L. Wheat yield progress associated with higher stomatal conductance and photosynthetic rate, and cooler canopies. Crop Sci. 1998, 38, 1467–1475. [Google Scholar]
  42. Lu, Z.M.; Radin, J.W.; Turcotte, E.L.; Percy, R.; Zeiger, E. High Yields in Advanced Lines of Pima Cotton Are Associated with Higher Stomatal Conductance, Reduced Leaf-Area and Lower Leaf Temperature. Physiol. Plantarum 1994, 92, 266–272. [Google Scholar] [CrossRef]
  43. Farquhar, G.D. Feedforward Responses of Stomata to Humidity. Aust. J. Plant Physiol. 1978, 5, 787–800. [Google Scholar] [CrossRef]
  44. Shirke, P.A.; Pathre, U.V. Influence of leaf-to-air vapour pressure deficit (VPD) on the biochemistry and physiology of photosynthesis in Prosopis juliflora. J. Exp. Bot. 2004, 55, 2111–2120. [Google Scholar] [CrossRef] [PubMed] [Green Version]
  45. Thomas, D.S.; Eamus, D.; Bell, D. Optimization theory of stomatal behaviour—II. Stomatal responses of several tree species of north Australia to changes in light, soil and atmospheric water content and temperature. J. Exp. Bot. 1999, 50, 393–400. [Google Scholar] [CrossRef]
  46. Brestic, M.; Zivcak, M.; Hauptvogel, P.; Misheva, S.; Kocheva, K.; Yang, X.H.; Li, X.N.; Allakhverdiev, S.I. Wheat plant selection for high yields entailed improvement of leaf anatomical and biochemical traits including tolerance to non-optimal temperature conditions. Photosynth. Res. 2018, 136, 245–255. [Google Scholar] [CrossRef] [PubMed]
  47. Chen, J.W.; Kuang, S.B.; Long, G.Q.; Meng, Z.G.; Li, L.G.; Chen, Z.J.; Zhang, G.H.; Yang, S.C. Steady-state and dynamic photosynthetic performance and nitrogen partitioning in the shade-demanding plant Panax notoginseng under different levels of growth irradiance. Acta Physiol. Plant 2014, 36, 2409–2420. [Google Scholar] [CrossRef]
  48. Walker, A.P.; Beckerman, A.P.; Gu, L.H.; Kattge, J.; Cernusak, L.A.; Domingues, T.F.; Scales, J.C.; Wohlfahrt, G.; Wullschleger, S.D.; Woodward, F.I. The relationship of leaf photosynthetic traits—V-cmax and J(max)—To leaf nitrogen, leaf phosphorus, and specific leaf area: A meta-analysis and modeling study. Ecol. Evol. 2014, 4, 3218–3235. [Google Scholar] [CrossRef] [PubMed]
  49. Xiang, S.; Reich, P.B.; Sun, S.C.; Atkin, O.K. Contrasting leaf trait scaling relationships in tropical and temperate wet forest species. Funct. Ecol. 2013, 27, 522–534. [Google Scholar] [CrossRef] [Green Version]
  50. Chi, Y.G.; Xu, M.; Shen, R.C.; Yang, Q.P.; Huang, B.R.; Wan, S.Q. Acclimation of Foliar Respiration and Photosynthesis in Response to Experimental Warming in a Temperate Steppe in Northern China. PLoS ONE 2013, 8, e0056482. [Google Scholar] [CrossRef] [PubMed]
  51. Onoda, Y.; Hikosaka, K.; Hirose, T. Seasonal change in the balance between capacities of RuBP carboxylation and RuBP regeneration affects CO2 response of photosynthesis in Polygonum cuspidatum. J. Exp. Bot. 2005, 56, 755–763. [Google Scholar] [CrossRef] [PubMed]
  52. Onoda, Y.; Hikosaka, K.; Hirose, T. The balance between RuBP carboxylation and RuBP regeneration: A mechanism underlying the interspecific variation in acclimation of photosynthesis to seasonal change in temperature. Funct. Plant Biol. 2005, 32, 903–910. [Google Scholar] [CrossRef]
  53. Xu, C.G.; Fisher, R.; Wullschleger, S.D.; Wilson, C.J.; Cai, M.; McDowell, N.G. Toward a Mechanistic Modeling of Nitrogen Limitation on Vegetation Dynamics. PLoS ONE 2012, 7, e0037914. [Google Scholar] [CrossRef] [PubMed]
  54. Hikosaka, K. Nitrogen partitioning in the photosynthetic apparatus of Plantago asiatica leaves grown under different temperature and light conditions: Similarities and differences between temperature and light acclimation. Plant Cell Physiol. 2005, 46, 1283–1290. [Google Scholar] [CrossRef] [PubMed]
  55. Hikosaka, K.; Ishikawa, K.; Borjigidai, A.; Muller, O.; Onoda, Y. Temperature acclimation of photosynthesis: Mechanisms involved in the changes in temperature dependence of photosynthetic rate. J. Exp. Bot. 2006, 57, 291–302. [Google Scholar] [CrossRef] [PubMed]
  56. Mediavilla, S.; Gonzalez-Zurdo, P.; Babiano, J.; Escudero, A. Responses of photosynthetic parameters to differences in winter temperatures throughout a temperature gradient in two evergreen tree species. Eur. J. For. Res. 2016, 135, 871–883. [Google Scholar] [CrossRef]
  57. Kenzo, T.; Ichie, T.; Watanabe, Y.; Yoneda, R.; Ninomiya, I.; Koike, T. Changes in photosynthesis and leaf characteristics with tree height in five dipterocarp species in a tropical rain forest. Tree Physiol. 2006, 26, 865–873. [Google Scholar] [CrossRef] [PubMed] [Green Version]
  58. Mcalpine, K.G.; Jesson, L.K.; Kubien, D.S. Photosynthesis and water-use efficiency: A comparison between invasive (exotic) and non-invasive (native) species. Aust. Ecol. 2008, 33, 10–19. [Google Scholar] [CrossRef]
  59. Wang, F.; Zhu, W.; Zou, B.; Neher, D.A.; Fu, S.; Xia, H.; Li, Z. Seedling growth and soil nutrient availability in exotic and native tree species: Implications for afforestation in southern China. Plant Soil 2012, 364, 207–218. [Google Scholar] [CrossRef]
  60. Xu, Z.L.; Peng, H.H.; Feng, Z.D.; Abdulsalih, N. Predicting Current and Future Invasion of Solidago Canadensis: A Study from China. Pol. J. Ecol. 2014, 62, 263–271. [Google Scholar] [CrossRef]
  61. Zhang, X.H.; Wang, H.; Wang, S.L.; Wang, R.Q.; Wang, Y.T.; Liu, J. Factors affecting alien and native plant species richness in temperate nature reserves of northern China. Pol. J. Ecol. 2017, 65, 320–333. [Google Scholar] [CrossRef]
  62. Lin, Q.L. Adaptability analysis of Pinus taeda and Pinus elliottii. J. Fujian For. Sci. Technol. 2007, 34, 102–105. [Google Scholar]
  63. Ma, Z.; Liu, Q.; Wang, H. The growth pattern of Pinus elliottii Plantation in central subtropical China. Acta Ecol. Sin. 2011, 31, 1525–1537. [Google Scholar]
Figure 1. The location of the study site. The green areas represent forests. The red solid circle represents the Qianyanzhou (QYZ) Ecological Station.
Sustainability 10 04063 g001
Figure 2. The seasonal variations of leaf photosynthetic rates (Asat) of MP (Pinus massoniana Lamb.) and SP (Pinus elliottii Engelm.) during the experimental period. ANOVA: * p < 0.05; ** p < 0.01; and *** p < 0.001.
Sustainability 10 04063 g002
Figure 3. Seasonal patterns in (a) gs, (b) Vcmax25, (c) Jmax25, and (d) J/V ratio, ±SD, for MP (blue line) and SP (red line) during the experimental period (April, June, September, and November). Each value represents the average of the total measured data for three days or for one day (only SP in April).
Sustainability 10 04063 g003
Figure 4. Relationships between leaf photosynthetic rate and photosynthetic parameters with leaf temperature and VPD during the experimental period in subtropical evergreen coniferous plantation.
Sustainability 10 04063 g004
Figure 5. Relationship between J/V ratio and leaf temperature during the experimental period.
Sustainability 10 04063 g005
Figure 6. Structural equation models of the effects of stomatal and biochemical parameters on Asat in response to (a) leaf temperature and (b) VPD in subtropical evergreen coniferous plantation. The bold numbers indicate the standard path coefficients. The grey dashed arrows indicate nonsignificant pathways, and the red and black arrows represent significant negative and positive pathways, respectively. The arrow width represents the strength of the relationship. * p < 0.05; ** p < 0.01; and *** p < 0.001. (a) RMSEA = 0.00, χ2 = 0.61, p = 0.44, (b) RMSEA = 0.00, χ2 = 0.39, p = 0.53.
Sustainability 10 04063 g006
Table 1. The differences in the seasonal variations of Tleaf, VPD and leaf trait of MP and SP.
MonthTleaf (°C)VPD (kPa)SLA (m2 kg−1)
MPApr28.68 ± 3.011.27 ± 0.105.66 ± 0.90
Jun33.19 ± 4.492.63 ± 0.795.67 ± 0.32
Sep31.64 ± 1.151.54 ± 0.205.83 ± 0.53
Nov19.15 ± 3.350.62 ± 0.165.43 ± 0.32
SPApr29.452.214.00
Jun35.33 ± 0.932.75 ± 0.254.02 ± 0.22
Sep32.50 ± 0.431.83 ± 0.153.71 ± 0.17
Nov24.69 ± 1.570.88 ± 0.093.34 ± 0.05
p value 0.0200.0520.000
Note: The available observation days for SP in April included only one day and thus there was no standard deviation. The differences among the variables were evaluated using the independent sample t-tests. The significant values (p < 0.05) between the two species during the entire measurement period are shown in bold (Mean ± SD).

