1. Introduction
The rapid development of electronic markets and their increasing encroachment on the role played in the economy by traditional markets are the most important phenomena connected with the entry of the Internet into the economy. At the same time, the creation of new market infrastructures based on the use of information technologies and the increasing replacement of traditional markets by electronic markets have naturally led to the rapid development of e-commerce [
1]. Although its origins date back to the 1960s, before the emergence of the Internet in the economy, it developed primarily in the B2B (business-to-business) sector [
2]. The development of e-commerce in the B2C (business-to-consumer) sector, in addition to some earlier local trials, is closely linked to the emergence of the multimedia part of the Internet [
3].
Although the beginnings of retail e-commerce were rather modest, its growth rate has been high since its inception [
4]. At the same time, with the improvement of elements perceived as barriers to its development, such as reliability and speed of network infrastructure, efficiency of logistics systems, or the development of secure payment systems, electronic commerce in the B2C sector has become an increasingly important element of modern economic reality.
Digital advertising is an element that is closely linked to and stimulating the development of e-commerce at the retail level. Its market was created practically in parallel with the B2C e-commerce market, and its growth dynamics were almost identical. At the same time, despite the rapidly growing expenditure on digital advertising, the phenomenon of decreasing effectiveness of the digital advertising ecosystem is becoming more and more visible. This is related to the fact that only a small part of the outlays incurred by companies on various forms of digital advertising brings the expected results. This is mainly due to the fact that a large part of the resources is sucked out from the system through various forms of fraud and through the ad fraud ecosystem. At the same time, for several years now, a phenomenon which has further hindered the effectiveness of the digital advertising ecosystem and worsened the ROI of advertisers has been the widespread practice of blocking advertising known as ad-blocking [
5]. This has become more and more common not only for desktop computers but also for mobile devices, affecting the development of the increasingly important retail sphere of e-commerce—mobile e-commerce.
In this context, the aim of this article is to analyze the scale of the phenomenon of ad-blocking and its causes in the context of its impact on the effectiveness of the functioning of the digital advertising ecosystem and its sustainable development, which is extremely important from the point of view of the development of electronic commerce.
2. Development of Global Retail E-Commerce in the World and Factors Impacting This Process
As already mentioned, the development of retail e-commerce is closely linked to the emergence of the multimedia part of the Internet and its entry into economic reality. In 1994, the first on-line shopping malls appeared, but in the first period, its value was very low [
6]. According to Forrester Research, in 1996, it was only USD 518 million, but the company’s forecast showed USD 6.379 billion at the end of the first phase of Internet development, which was slated to happen in 2000—that meant an enormous growth rate of over 1170% [
4].
At present, retail e-commerce is growing steadily, albeit not as dynamically as in the early years. In 2015, retail e-commerce accounted for 7.4% of global retail trade and amounted to more than USD 1.5 trillion. Forecasts for 2021 are 15.5% and more than USD 4.4 trillion (see
Figure 1 and
Figure 2), respectively.
Desktop and laptop computers are still the most commonly used devices for this purpose, but an increasing number of consumers are using mobile devices when shopping [
9]. This important trend is also strongly reflected in surveys concerning specific countries, although there is a wide variation. In Europe, for example, the dominant countries in this respect are the United Kingdom and Denmark. In 2016, mobile devices accounted for as much as 31.1% and 29.7%, respectively, of retail e-commerce [
10].
In addition to the growing popularity of mobile devices, progress in technologies such as artificial intelligence and augmented reality will undoubtedly also stimulate the development of e-commerce. In the case of the former, there are a number of possibilities related to the automation of various elements of the sales process or the use of predictive analytics in the context of predicting what a specific customer might be interested in [
11]. On the other hand, augmented reality provides completely new opportunities in terms of the way products are presented [
12].
3. The Digital Advertising Market and Elements Influencing Its Functioning and Development
The digital advertising ecosystem has developed in parallel with the retail e-commerce market. In October 1994, the first advertising banner of AT&T appeared on hotwired.com website [
5,
6]. Although, as in the case of retail Internet commerce, the level of companies’ spending on this form of advertising was low, from the very beginning, it was visible that it was growing at a high rate. In 1996, the expenditure on Internet advertising amounted to only USD 0.267 billion, compared to USD 8.087 billion in 2000. The bursting of the so-called dotcom bubble caused a three-year collapse in this market, and it was not until 2004 that Internet advertising expenditure, amounting to USD 9.626 billion, surpassed the figures noted in 2000 [
13].
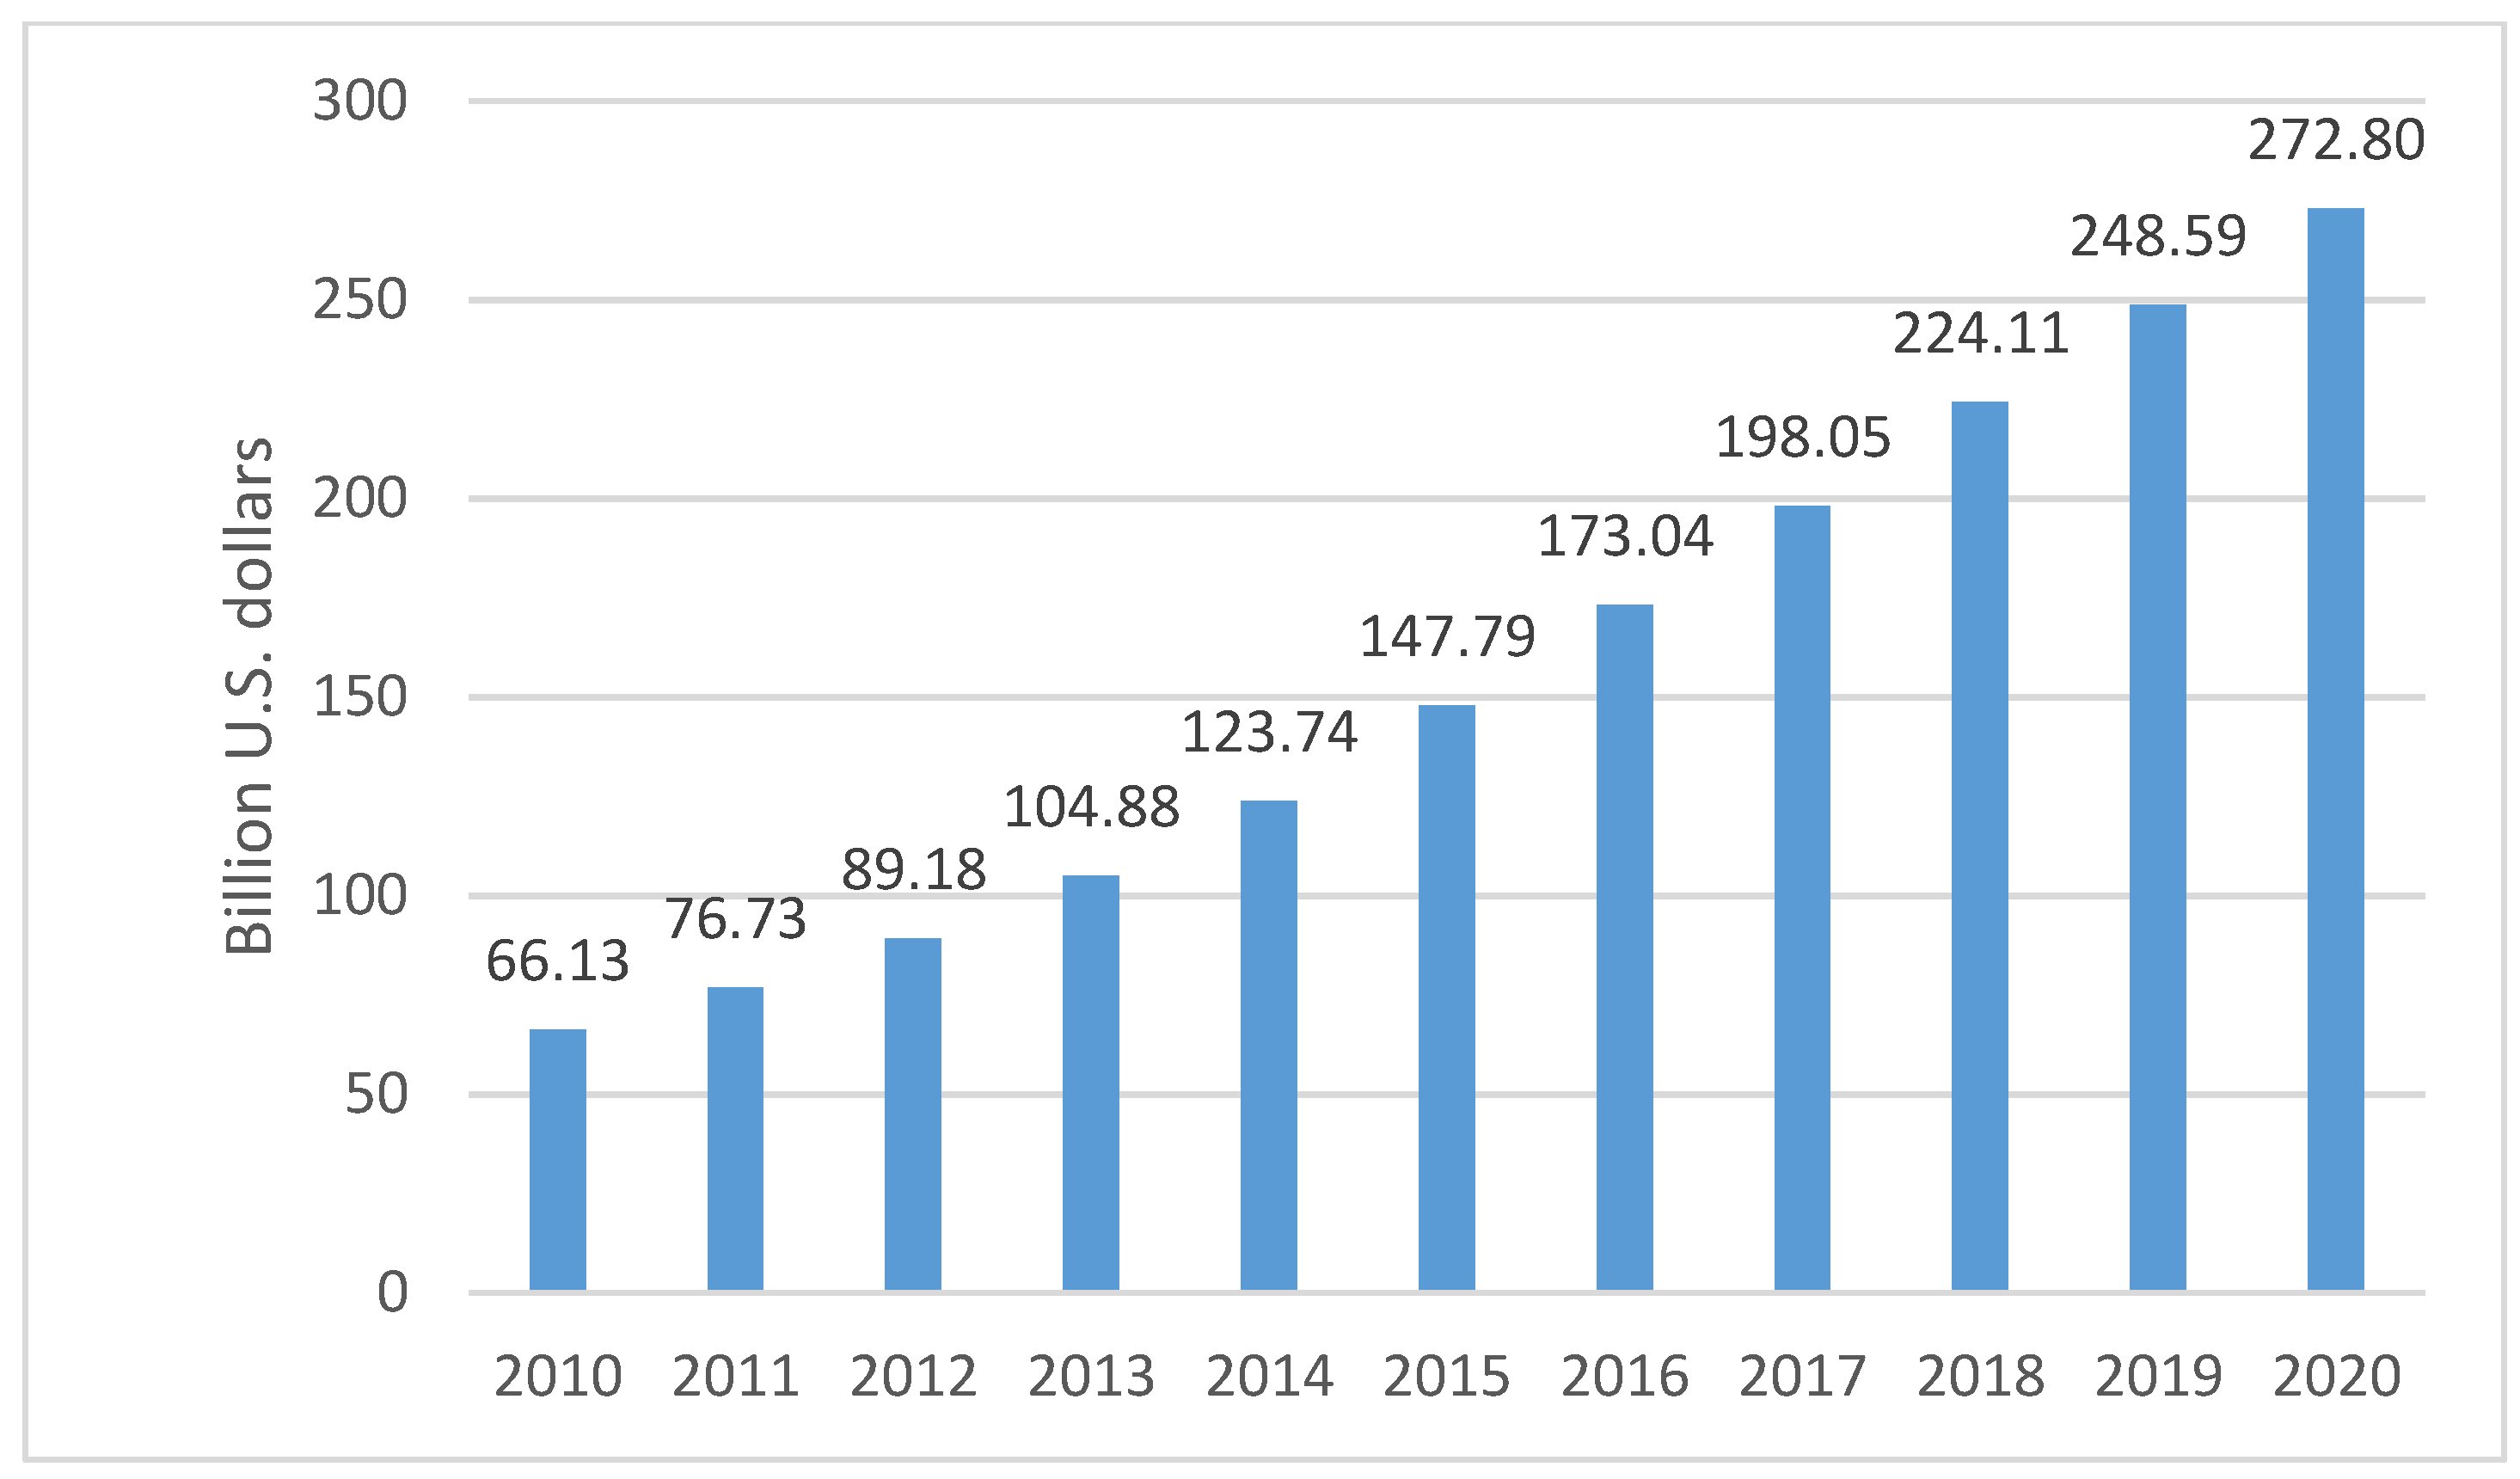
The following years saw the Internet entering the Web 2.0 phase and dynamically developing social media, which were increasingly used for advertising purposes [
14]. As a result, in 2010, global spending on on-line advertising exceeded USD 66 billion, and, in 2020, it is expected to reach the level of nearly USD 273 billion (
Figure 3).
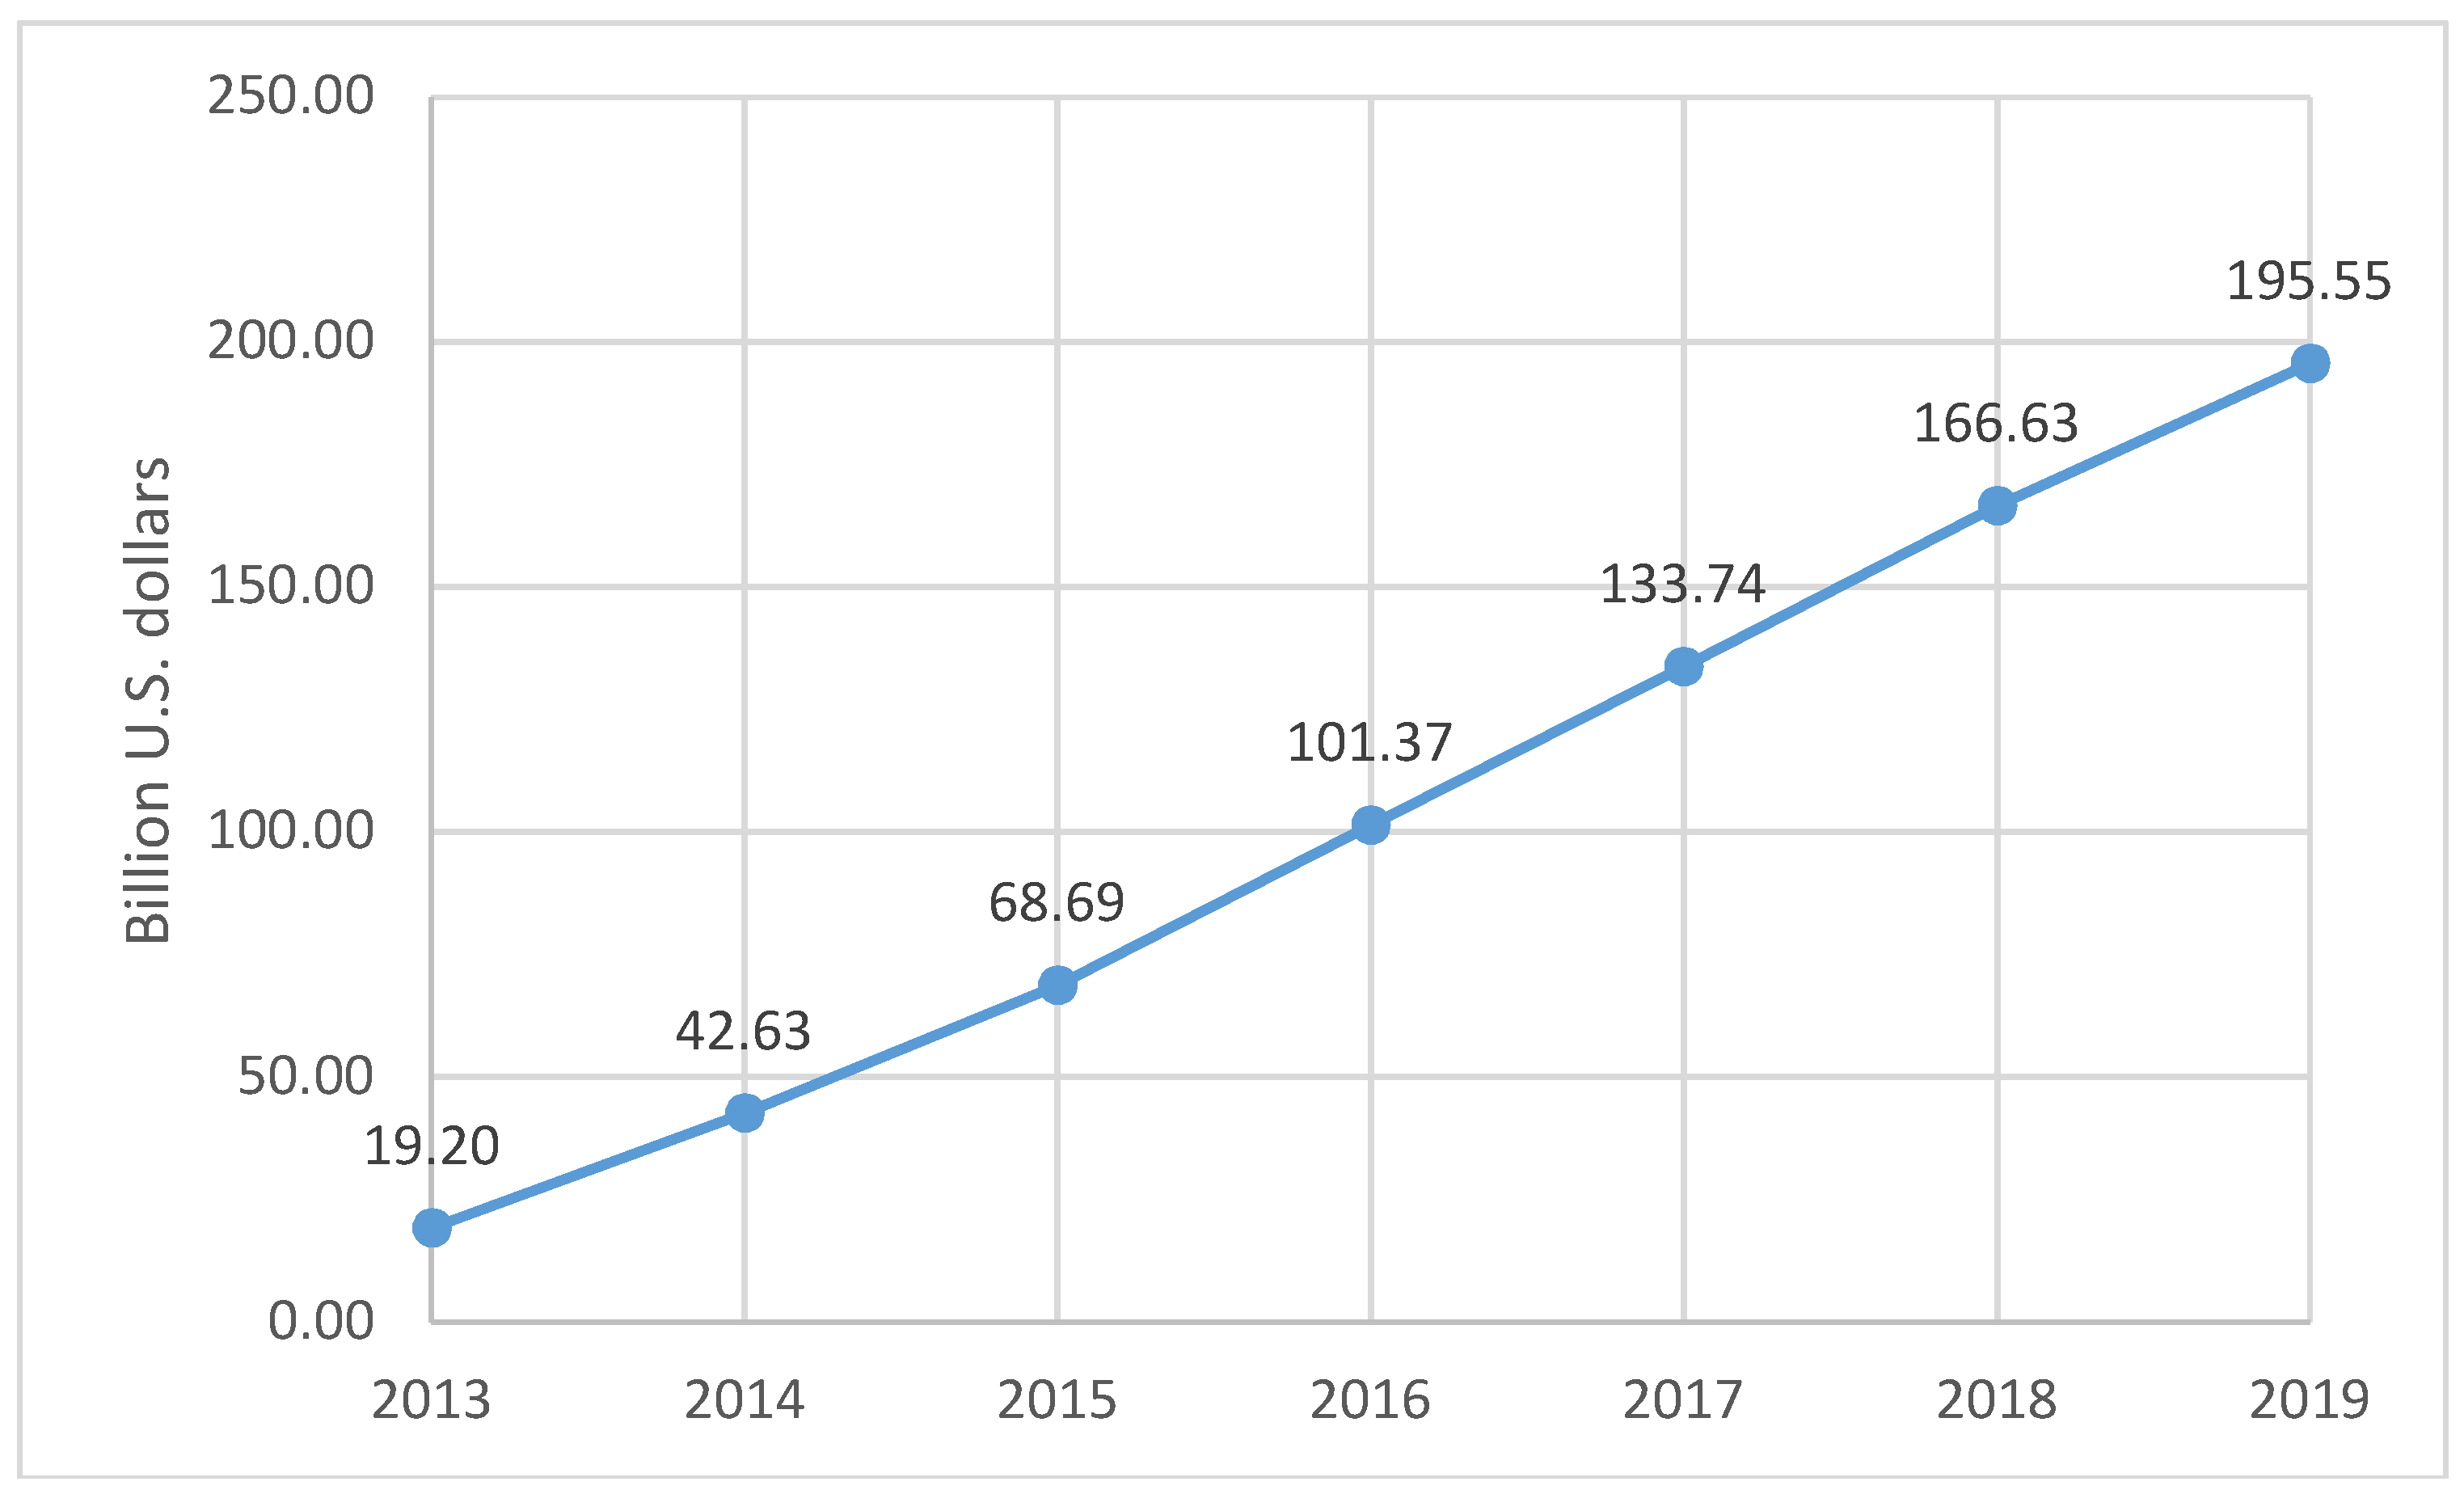
At the same time, over the last few years, the widespread use of mobile devices—particularly smartphones, when it comes to access to the Internet and on-line shopping—has become a factor which has greatly influenced the dynamic of spending on digital advertising [
16]. Because of this trend, companies allocate increasingly higher amounts of money spent on digital advertising in mobile advertising (
Figure 4). In 2019, the spending is to reach the level of over USD 195 billion, and the dynamics of their growth between 2013 and 2019 is to reach 430%. It should also be noted that in the USA, for example, the mobile advertising revenue already accounted for 50.52% of the total revenue from digital advertising in 2016 [
15].
However, the constant and dynamic growth of expenditures on digital advertising does not mean that the expenditures incurred by enterprises translate into their effective use in the context of such objectives as brand awareness or purchasing influence, which are important from the point of view of organizations investing in this form of advertising. This is due to the fact that a significant part of their resources is funnelled through the fraud ecosystem. Its elements include fake sites, bots imitating visitors to the website (fake visitors/bots), fake accounts on websites such as Facebook or Twitter, and many others. It is estimated that about fifty percent of the funds are funnelled from the digital advertising ecosystem using these methods and, in the worst-case scenarios, advertisers can receive only 30% of the expenditure that businesses spend on digital advertising [
18,
19,
20]. In the last few years, the stream of funds that ultimately reaches advertisers has been additionally and increasingly depleted by the phenomenon of ad-blocking [
21].
4. Development of the Ad-Blocking Phenomenon and Its Impact on the Digital Advertising Ecosystem
In 2012, the phenomenon of blocking ads by end users was hardly noticeable. Its rapid growth began in the following year [
22]. In 2013–2017, the number of people blocking ads on desktop computers grew from 54 million to 236 million. At the same time, since 2015, the number of people blocking ads on mobile devices has also been growing rapidly, reaching 380 million in 2017. This phenomenon is developing mainly in Asian countries [
23,
24]. In the vast majority of cases, advertisements are blocked by end users who use extensions available for practically all Internet browsers [
25,
26]. By far the best known and most widespread among them is Adblock Plus by Eyeo, which has been downloaded more than a billion times by 2017 [
27]. From the point of view of the users, the adoption of such solutions provides a number of benefits, such as the convenience of using on-line resources, as well as addressing privacy and security issues.
It is clear that the development of the phenomenon of ad-blocking has concrete economic consequences. As part of the functioning of the digital advertising ecosystem, advertisers pay publishers a certain amount of money for each display of their advertisement to a visitor on their website. When the latter use ad-block solutions on their devices, they cut off the revenue stream reaching the publishers, for whom it is the main source of revenue in many cases [
28]. According to AdBack, which ranked the top 100 sites by their lost ad revenue, the top publishers with the highest losses, who had lost more than
$1 billion, are sina.com.cn (China, annual loss of USD 1,129,741,000) and youtube.com (USA, annual loss of USD 1,125,313,000) [
29]. As far as global lost revenue from ad-blocking is concerned, in 2013, it amounted to USD 7.2 billion, whereas. three years later, it was estimated at USD 41.4 billion [
30]. At the same time, according to Ovum consulting company’s estimates, they may reach the level of USD 75 billion in 2020 [
31].
However, the loss of advertising revenue is only part of the losses connected with ad-blocking. According to research by Ryan, Shiller, and Waldfogel, small and medium-sized publishers also incur some hidden costs. In their case, blocking advertising causes, as in the case of all publishers, a decrease in advertising revenue. This in turn reduces their ability to invest in the content presented on the website. As a result, they become less attractive for consumers, which further reduces the traffic generated on the website, thus further decreasing their advertising revenues. A decrease in traffic levels is observed after 1.5 years on average. At the same time, this phenomenon is not observed in the case of 20% of the most popular websites [
22,
32]. As a result of such mechanisms, publishers with weaker financial standing will cease to operate, which will lead to a weakening of competition and a reduction in the number of entities offering content to users [
28].
5. Materials, Methods, and Hypothesis
The aim of this article is to analyze the scale of the phenomenon of ad-blocking and its causes in the context of its impact on the effectiveness of the functioning of the digital advertising ecosystem and its sustainable development, which is crucial from the point of view of the development of e-commerce. In order to carry it out, a literature analysis was conducted on the genesis of this phenomenon, its scale, causes, and economic effects. After this stage of research, in order to obtain primary data, a questionnaire survey was conducted on a group of individual Internet users. The group was selected deliberately, according to three criteria, namely, country of origin, age, and education. Such a selection of population resulted from the following premises. First, according to the 2017 OnAudience.com report, Poland is the leading nation when it comes to Internet users blocking digital advertising [
33]. As regards the second criterion, a decision was made to select a sample of 19–25-year-olds, based on the assumption that this age group uses the Internet intensively or very intensively. The most active Internet users, as the literature analysis shows, often use various types of solutions to block advertising [
34]. At the same time, as the data from the reports indicate, the users of ad-block solutions are better educated [
24]. Therefore, undergraduate, graduate, and doctoral students were included in the cohort. It should also be stressed that, although the selection of the population for this research was a deliberate choice, the research itself was carried out on randomly selected groups of students.
The research conducted in order to obtain primary data was carried out on three cohorts. The first cohort encompassed 178 students of the Faculty of Economics and Management of the Opole University of Technology (OUT), and the research was conducted in the period between January 2, 2017 and May 19, 2017. Research on the second cohort was conducted between November 4 2017 and February 18, 2018 and encompassed 242 students of the Faculty of Economics of the University of Economics in Katowice (UEK). The last, smallest cohort of the survey included another group of students from the Faculty of Economics and Management of the Opole University of Technology (116 persons), and the research was conducted in the period between January 9, 2018 and April 19, 2018. In total, 536 respondents took part in the research conducted in the form of a survey using Google Forms.
The following main hypothesis (H1) is adopted in the paper: “The development of ad-blocking has a destructive effect on the stable functioning of the digital advertising ecosystem and is directly linked to the number and forms of advertising affecting the viewer in electronic space and their mismatch with the viewer’s preferences and expectations”. At the same time, an auxiliary hypothesis (H2) was formulated: “Respondents belonging to the group of people who are always connected to the Internet are more likely to use ad-blocking solutions”.
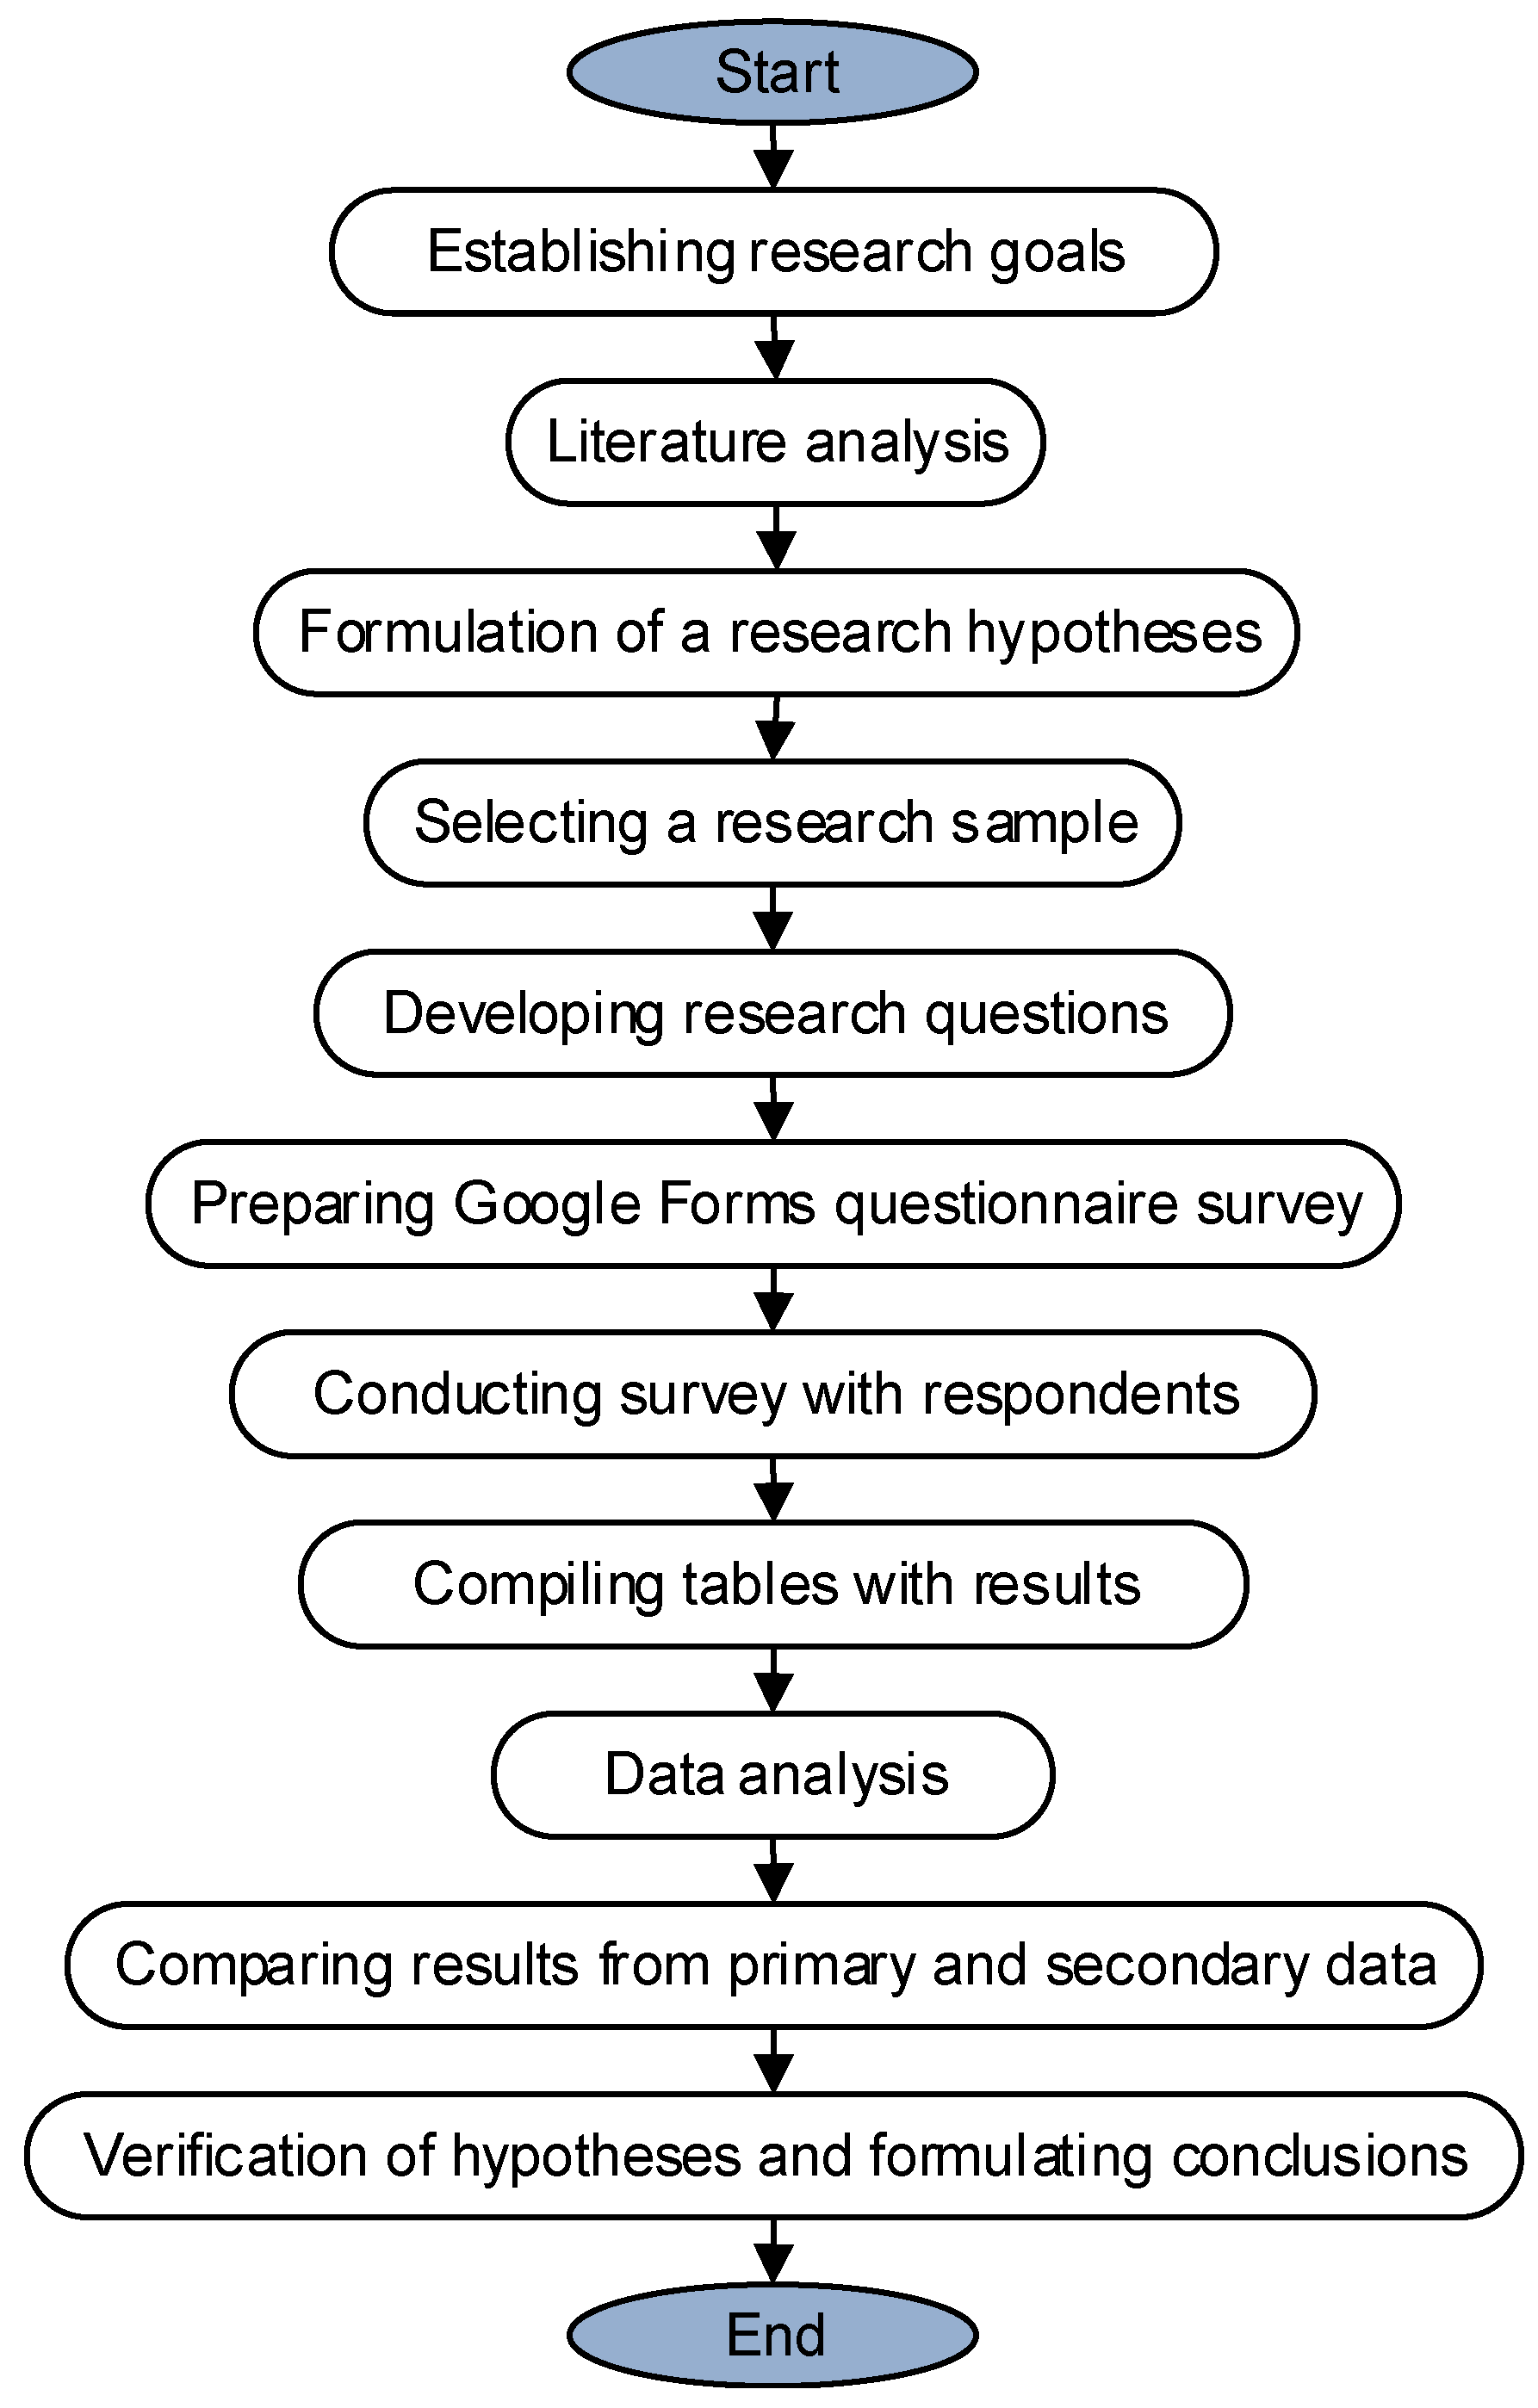
In order to verify both hypotheses, as broad a range of secondary data as possible was obtained. The data came mainly from various types of reports concerning the phenomenon of ad-blocking. The second data stream was primary data obtained from surveys. The comparison of primary and secondary data and their analysis led to the verification of the adopted research hypotheses. The entire research procedure is shown in
Figure 5.
6. Results
The main objective of the survey was to gain knowledge about the scale of advertising blocking in the studied population, the reasons for using ad-block solutions by the respondents, and the conditions that would have to be met in order for them to resign their use. The structure of the studied population is shown in
Table 1.
As far as Internet usage time is concerned, the assumption that the surveyed group used the Internet very intensively was confirmed. On average, 40.4% of them were on-line for more than five hours, and 31.6% for three to five hours a day. Only 1.6% of respondents declared using the Internet for up to one hour a day. At the same time, as many as 63.8% of respondents admitted that they were constantly connected to the Internet (see
Table 2).
An extremely important question in the context of the research was the issue of intensification of the use of ad-blocking solutions in the studied population. It was very high and amounted to over 60% of the respondents (see
Table 3).
At the same time, it was interesting to find out on which devices the respondents most often install ad-blocking solutions. It turned out that they were by far the most popular on laptop computers (see
Table 4).
One of the key questions in the study concerned the reasons for using ad-blocking solutions. Two additional questions were added to the second and third editions of the survey. The first concerned the number of advertisements displayed on-line, the second concerned the issue of on-line security.
Table 5 shows that there were three main reasons why the respondents used solutions that blocked digital advertisements.
The following question served as a control question in relation to the question about the reasons for using ad-blocking solutions. It concerned the situations in which the respondents would be ready to uninstall such solutions. As can be seen from
Table 6, the two most important situations motivating them to do so were if the advertisements were less invasive and if there were fewer of them. At the same time, from the perspective of managing the phenomenon of blocking ads, the next two items in the table are important. Nearly 40% of respondents would be willing to uninstall ad-blocking solutions if the alternative was to pay for access to content, and almost 30% would do so if they prevented access to content.
The respondents were asked one more question regarding the services in which on-line advertising is the most burdensome. From
Table 7, you can clearly see that this applied mostly to browsing the web content and using social media.
At the same time, the collected primary data were used to build the following formal logit model, in the context of verification of the auxiliary hypothesis (H2):
where:
Y—use ad-blocking solutions such as Adblock
X1—belong to a group of people connected to the Internet at all times
ai—structural parameters of the model
7. Discussion
By analyzing the primary data collected during the survey and comparing them with the secondary data collected beforehand, several important conclusions can be drawn. The assumption that the group of respondents selected for the study belongs to the group of heavy Internet users, who intensively use the available resources along with ad-blocking solutions, was confirmed. In the surveyed population, over 60% of respondents used this type of solutions, which is above average, in comparison to both users from their own country and users from other countries. According to PageFair’s report, the percentage of Internet users blocking advertising on desktop computers was 33% in Poland in 2017. At the same time, Ireland and Greece recorded the highest percentage—39% [
24]. According to the report by OnAudience.com, this number was the highest in Poland among the countries surveyed and amounted to 46% of the population of Internet users (an increase from 42% in 2016) [
33]. The significantly higher level of blocking advertising that emerges from our own research means that in certain market segments, ad-blocking can be significantly higher than the national average and thus can have an even more destructive impact on the digital advertising ecosystem and on the development of closely related e-commerce in these segments. This is all the more important, as it may concern significant market segments. The surveyed cohort belonged to the so-called Millennials group, which conducts 30% of global e-commerce [
35]. In the context of the impact of ad-blocking on e-commerce, it is also worth noting that OnAudience.com research shows an increasing share of users blocking ads in subsequent phases of the on-line shopping process. In Europe, this figure is 32% for visitors, 34% for shoppers, and 38% for those who are already shopping [
33].
At the same time, the results of our own research indicate that, despite the fact that the most popular devices in the context of Internet access are laptop computers (90.6%) and smartphones (86.7%), these two devices do not predominate in terms of blocking advertising (see
Table 4). Despite the fact that a very similar percentage of respondents used laptop computers and smartphones as an Internet access tool, users installed ad-block solutions on just over 16% of smartphones. This is still a high percentage considering PageFair research, which shows that the use of mobile solutions in European countries is, to date, either insignificant or marginal (in the case of France, Germany, and the UK, it amounts to 1% of Internet users) [
24]. This may be due to the fact that, according to comScore research, users of mobile devices spend more than 80% of their time using various types of applications installed on them, and the problem of excessive and aggressive advertising is likely not so troublesome in this case. They spend only a small part of their time browsing the Web using mobile browsers, and it is in this type of activity that advertisements are the most burdensome for Internet users (see
Table 7) [
36].
Regarding the key issue of the reasons for using ad-blocking solutions, the results of our own research indicate three key issues underlying the development of the phenomenon. These are: excessive number of advertisements, their excessive invasiveness, and the mismatch between the advertisements displayed to the users and the users’ interests (see
Table 5 and
Table 6). At the same time, it should be noted that the results obtained are to a large extent the same as those found by other studies [
24,
37,
38,
39]. It is also worth noting one more issue that arises from the results of research in the context of the destructive impact of ad-blocking on the functioning of the digital advertising ecosystem, namely, the services where the respondents found advertising to be the most burdensome were browsing web content and using social media. Meanwhile, websites and social media remain the main areas of interest for advertisers (see
Table 7). Therefore, in the context of the above arguments, it should be concluded that the results obtained in the research do not justify the rejection of the research hypothesis H1. The conducted research clearly indicates the destructive nature of the phenomenon of ad-blocking in the context of its impact on the functioning of the digital advertising ecosystem and its close correlation with the number and forms of digital advertisements impacting on the recipients and their mismatch with the users’ preferences.
In order to verify the formulated auxiliary hypothesis (H2), the structural parameters of the logit model presented earlier were estimated using the Quasi-Newton method (see
Table 8.)
The estimated model is statistically insignificant, as evidenced by the value of p = 0.85270. A statistically significant model is characterized by a p-value lower than the assumed significance level. The study assumed the significance level of α = 0.05.
Taking the conducted analyses into account, it should be stated that the auxiliary hypothesis (H2) is disproved. This means that we cannot claim that people who are connected to the Internet at all times are more likely to use ad-blocking solutions.
8. Conclusions
Since its inception, the functioning and development of the digital advertising ecosystem has required dealing with various types of challenges, such as spam, ad frauds, and issues related to cyber security. In recent years, another phenomenon—ad-blocking—has joined the list. In a short period of time, it has started to grow into a significant problem, and its scale is expanding as it enters the sphere of mobile devices and spreads within it. Its increasing intensity exacerbates the existing problems not only for the advertising industry itself, but also for the digital advertising ecosystem as a whole and hampers its sustainable development—on the one hand, by affecting publishers, who suffer concrete economic losses, and on the other hand, by affecting advertisers, whose expenditures on digital advertising do not translate into their effective use in the context of achieving their business objectives. Ad-blocking has a destructive effect on the functioning of the electronic commerce system, which is closely connected with the digital advertising ecosystem.
The results of the research clearly indicate three main reasons for the development of ad-blocking. These are: the number of advertisements encountered by Internet users in electronic space, their unusually high aggressiveness, and the mismatch between digital advertisements and Internet users’ interests. As regards the first issue, as has been shown, as e-commerce continues to grow, investment in digital advertising is also on the rise, which means that it will increase even more in the coming years. Therefore, it seems that in the context of minimizing the effects of ad-blocking, entities operating in digital advertising ecosystem, publishers in particular, should focus primarily on the other two reasons linked to the development of this phenomenon. The key issue seems to be reducing the forms of advertising that are aggressive and annoying for the user as much as possible. Some initiatives have already been taken in this respect, as shown by the activities initiated by The Digital Advertising Alliance and the Coalition for Better Ads. However, their success will be determined by the publishers’ renouncement of the use of forms of advertising that are aggressive and burdensome for the users. As it also results from the research, a significant problem is the mismatch between the advertisements displayed to the user and the user’s interests. However, although, technically, this issue is relatively easy to resolve, in general it is quite a complicated one. A major challenge here is the question of the data that are used for this purpose and the ways in which they are collected and the reconciliation of these two aspects—personalization and privacy [
40,
41,
42]. The growing awareness of Internet users makes this task difficult and its nature very delicate. Moreover, the presented problem should be also examined on a wider scale, considering new technologies linked to the Internet [
43,
44,
45,
46].
However, notwithstanding the various difficulties and challenges, the advertising industry will have to offer users alternatives to ad-blocking that they consider valuable from their own point of view and that take the users’ expectations and preferences into account. Otherwise, the entire functioning of the digital ecosystem could be seriously hampered, which would undoubtedly have a significant impact on the sustainable development not only of e-commerce but also of the future of the Web.


