Article

Trends of Ecological Footprints and Policy Direction for Sustainable Development in Mongolia: A Case Study

1
Department of Environmental Science and Engineering, Ewha Womans University, 52, Ewhayeodae-gil, Seodaemungu, Seoul 03760, Korea
2
Department of Chemical Engineering & Materials Science, Ewha Womans University, 52, Ewhayeodae-gil, Seodaemungu, Seoul 03760, Korea
*
Authors to whom correspondence should be addressed.
Sustainability 2018, 10(11), 4026; https://doi.org/10.3390/su10114026
Submission received: 23 August 2018 / Revised: 29 October 2018 / Accepted: 31 October 2018 / Published: 2 November 2018

Abstract

:
In Mongolia, the Ecological Footprint (EF) has increased from 6.8 million global hectares (gha) in 1961 to 14.6 million gha in 2012; whilst the Biological capacity (BC) has decreased from 50.6 million gha in 1961 to 39.0 million gha in 2012. Throughout the study period, the grazing land footprint and carbon uptake land footprint have been the two major contributors to the EF variation. If the current trend continues, the EF will surpass the BC by around 2083. To ensure sustainable development in Mongolia, policy directions are advised. For the grazing land footprint, regulating the livestock numbers and herding practice changes are suggested. For the carbon uptake footprint, an increase in the combustion efficiency of the coal fired power plants and the extensive utilization of the renewable energy are suggested. Simple estimations of future carbon dioxide (CO2) emission changes based on various scenarios have been carried out. The amount of CO2 emissions in the mitigation scenarios decreased by up to 31.4% compared with the baseline scenario in 2030 in Mongolia. This case study is the first attempt to propose sustainable development strategies based on the estimation of Mongolia’s ecological consumption pattern.

1. Introduction

Mongolia is a landlocked country with an area of 1.6 million km2, and is surrounded by Russia and China. Its topography is comprised of the Gobi Desert to the south, and hilly mountainous areas to the north [1]. Mongolia’s population reached 3.17 million in 2017 [2]. Mongolia is one of the least densely populated countries, yet two-thirds of the population live in the capital, Ulaanbaatar. After the transition from a socialist economy to a market economy in the early 1990s, there has been a remarkable increase in economic growth and population size, accompanying urbanization. Cashmere production has significantly increased, and Mongolia has become the second largest producer of cashmere after China [3]. In addition, its mining sector witnessed rapid growth due to the country’s vast mineral resources, such as copper, gold, and coal [4]. Accordingly, the gross domestic product (GDP) per capita has grown six-fold in the last two decades [5].
The natural resource reliant economy supports Mongolian rapid development, yet, combined with natural factors, such as climate change, it is posing danger to the environmental balance. The studies of Noy-Meir [6], Batima and Dagvadorj [7], and Reynolds et al. [8] have shown that the ecosystems in Mongolia are particularly vulnerable to climate change, because of its high altitude and inconsistent low level of precipitation. Increased anthropogenic disturbances—mining, overgrazing pasture lands, inappropriate usage of crop lands, and deforestation—cause extreme soil destruction, intensified land degradation, and frequent sand storms. The fifth national report on biodiversity [9] states that around 90% of Mongolia’s pasture land has been disturbed by land degradation. In addition, cold winters that follow a period of drought can lead to a “zud”, a natural disaster when thick snow prevents animals from consuming fodder, causing livestock to die of starvation [10]. As a result of three consecutive zuds occurring between 1999–2002, about 11 million livestock, one-fourth of the total population, were lost [11]. Subsequently, residents moved into the capital, and many of them settled down in the “ger districts”, where the use of wood- or coal-burning stoves for heating and cooking is common, leading to a major increase in air pollution in the capital [12,13].
Mongolia’s energy supply mostly relies on domestic coal production and imported petroleum. While coal burning for heating and cooking in most developed countries has diminished significantly because of its impact on air pollution and climate change, the combined heat and power (CHP) plants in Mongolia are all coal-based. As of 2015, coal alone accounts for the 84% (or 2765 ktoe) of the total energy consumption that feeds power stations [14]. Recently, there has been an increasing shortage of load in the power system, and the unabated industrial demand is compensated by additional purchases from Russia. In the assessment of these challenges, the government of Mongolia (GoM) is well aware of these problems and is seeking to advance energy efficiency and security. Alternative fuel solutions include introducing super-critical pressure coal combustion technology and gas-based power plants in the power system [15]. To improve the current situation, Mongolia should use natural resources more efficiently and reduce its consumption impacts on the environment.
Several approaches have been developed to simultaneously assess the sustainability of the environmental side and the anthropogenic impact on the earth. For example, Odum’s studies [16,17] provide a comprehensive analysis on how to scale and measure the combined societal factors to environmental conditions. For a specific sector, such as greenhouse gas measurements, Kennedy et al. [18] gives a clear structure on how certain population activities influence the environment. On a national level, Wackernagel et al. [19] demonstrated an accounting framework that compares human consumption to the natural capital production using existing data. Their study established the concept of the ecological footprint (EF), and it has become a widely acknowledged method as it employs a consistent and appropriate measurement of the mass unit [20]. As for the contributors of the EF concept, it systematically evaluates environmental pressures and the biologically useful area needed to support people’s activities or progress [21,22,23]. Also, according to Borucke et al. [24], the EF measures impact on the area that is identified as being exploited, and it can assist for developing targets, as well as tracking the progress for reaching ecological balance. One of the important advantages of the EF approach is that it consists of several categories of environmental burdens, and thus, one can carry out sectoral a analysis of the environmental burdens systematically [25].
In this study, the concept of EF is used (1) to analyze the trend of environmental status; (2) to identify the current major environmental problems; and (3) to present possible policy directions for sustainable development, especially on the grazing land (livestock) and carbon uptake land (energy) in Mongolia. This is the first study on the EF analysis in Mongolia, and can be a starting point to further examine the environmental problems in more detail.
The rest of the paper is structured as follows. Section 2 presents the socio-economic data that are related to the EF and the analytical framework of the study. The results and discussions are described in Section 3, followed by conclusions in Section 4.

2. Materials and Methods

The EF data and other socio-economic data of Mongolia were collected and analyzed as shown in Section 2.1. The methods used in this study are described in Section 2.2.

2.1. Data and Materials
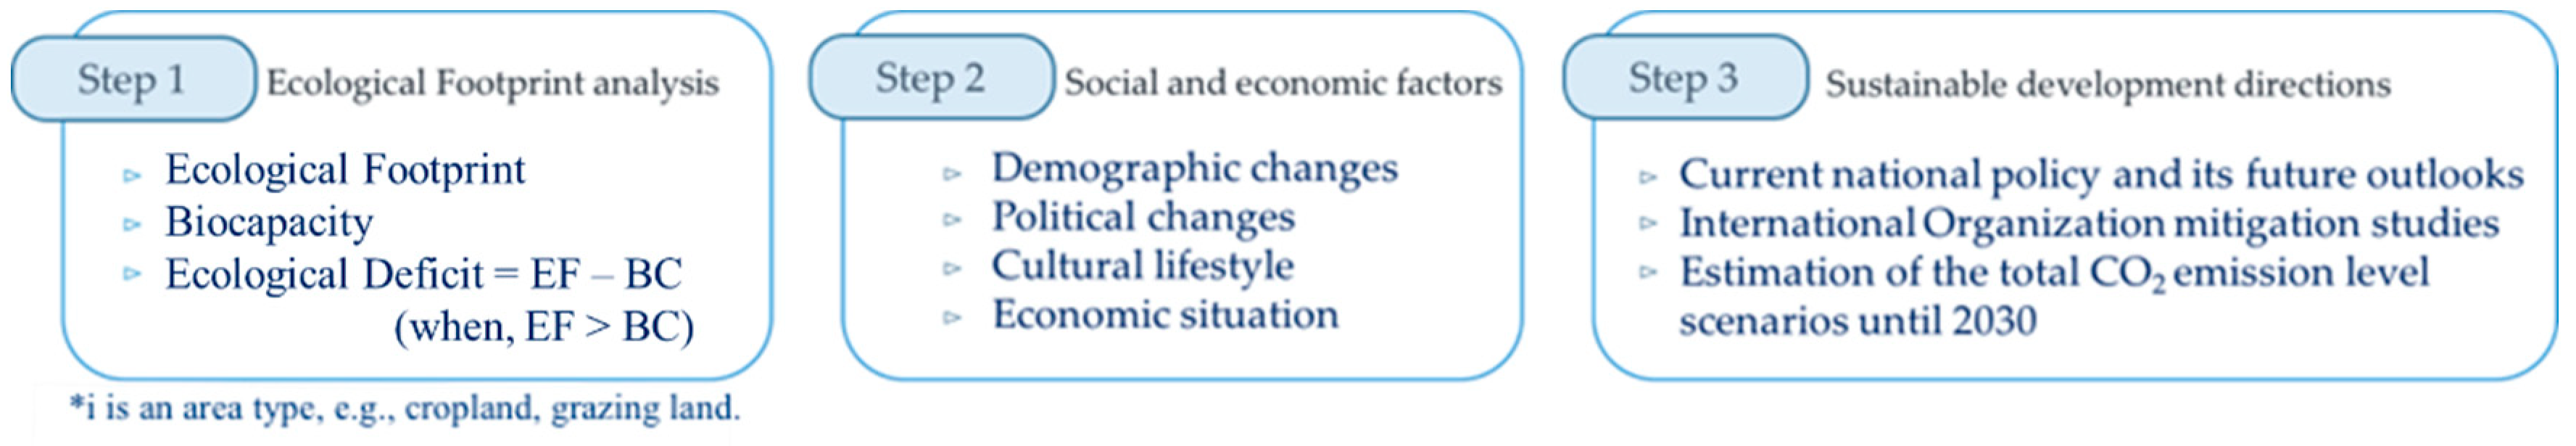
In addition to the EF related data, several socio-economic data have been used in this study and are listed in Table 1. The Global Footprint Network (GFN) calculated the EF of more than 200 countries in its 2016 edition of the National Footprint Accounts (NFA) [25], which covers 1961 to 2012, incorporating data from around 20 other sources [26]. Along with the EF, the calculation result of the biological capacity (BC), or in short biocapacity, is presented in the NFA. As defined in The Guidebook 2016 to NFA, BC is the ecosystem’s capacity to regenerate and produce biological recourses that are used by the population. In this study, the Mongolian EF and BC data obtained from the 2016 edition of NFA were used to analyze the country’s natural resource usage trends during the past half-century [25].
There are six types of land use that EF examines—cropland, grazing land, fishing ground, forest land, carbon uptake land, and built-up land. For a consistent global scale calculation, they are expressed in the unit of global hectares (gha), which is the accounting unit for the world average biologically productive area given for a specific year [26].
In the EF methodology, as Galli et al. [27] and Marcini et al. [28] clarified, carbon uptake land refers to the forest area required to absorb anthropogenic carbon dioxide (CO2) emissions. Hence, instead of the commonly used carbon dioxide equivalent emission amount, the forest area equivalent factor is used to convert the amount of emissions to the carbon footprint with the consistent unit, gha, as presented in the Equation (1), as follows:
carbon Footprint ( gha )    ( CO 2   e m i s s i o n   ( Mt   CO 2 ) C a r b o n   U p t a k e   f a c t o r   ( wha   nha 1 ) ) f forest eq ,   ( gha   wha 1 )
where carbon Footprint is the annual average amount of biologically productive forest area needed to absorb CO2 emissions (gha), CO2 emission is the amount of anthropogenic carbon dioxide emissions allocated to a specific country based on the country’s fossil fuel usage and the share of international imports in million tonnes (Mt CO2), Carbon Uptake factor or the yield factor for carbon is the world annual average yield of forest land (wha nha−1), and fforest-eq is the equivalent factor of the forest land that is needed to absorb the CO2 emissions (gha wha−1).

2.2. Methods

The research framework carried out in this study is shown in Figure 1. In the first step, the six categories of the EF changes in Mongolia are illustrated using the data obtained from NFA [25]. With the same data, the year the ecological overshoot is most likely to be reached was estimated by employing the linear regression analysis method, built on the increase rate of the total EF and the decrease rate of the total BC. Among the six types of footprints, the two major footprints that made up most of the EF in Mongolia between 1961–2012 were focused on.
Secondly, the impact from the country’s social and economic changes on the environment and vice versa, throughout the timeline, is examined. Open data sources were referred to, such as the World Bank statistics [5], the National Statistical Office [2,11,29], the International Energy Agency [14], and the Ministry of Energy of Mongolia [30], so as to elaborate the correlations. The data and materials used in the steps are shown, followed by their sources, in Table 1.
For the third step, further sustainable development options in Mongolia are explored. It has been studied and compared to the additional carbon Footprint mitigation options presented by the international organizations (e.g., Asian Development Bank [32] and Global Green Growth Institute [31]). In addition to these studies scenario and values, two scenarios were developed based on the current government policy targets [15], and the compared outcomes are presented.
In the process of estimating the CO2 emissions, scenarios are developed based on the Asian Development Bank (ADB) business as usual (BAU) case and on an alternative case, each of which reflect the socioeconomic indicator’s gross domestic product (GDP), population, GDP per capita in the estimation of primary energy demand in million tons of oil equivalent (Mtoe), final energy demand amounts (Mtoe), thermal power generation input (Mtoe), power generation output terawatt hours (TWh), and carbon dioxide emissions (Mt CO2) for the years 2015, 2020, and 2035 [32]. The average annual growth rate (AAGR) for these five categories are also provided, ranging differently between 2010–2020, 2020–2035, and 2010–2035. Then, using the AAGR of the CO2 emissions between 2020–2035, the carbon emissions for the ADB BAU case and the ADB alternative case in 2023 and 2030 were estimated, along with the values of coal usage (TWh) and renewables share (%) in 2023 and 2030. As the share of coal makes up the most, excluding the oil amount, we replaced the increased share of renewables with the decreased equivalent electricity generation from the primary energy demand of coal share in our two scenarios. In our scenarios, the potential CO2 emission cutback amounts were estimated using the default emission factors presented in the Guidelines for National Greenhouse Gas Inventories [33]. The resulting amount (Mt CO2) is then subtracted from the base line ADB alternative case CO2 emission levels.

3. Results and Discussion

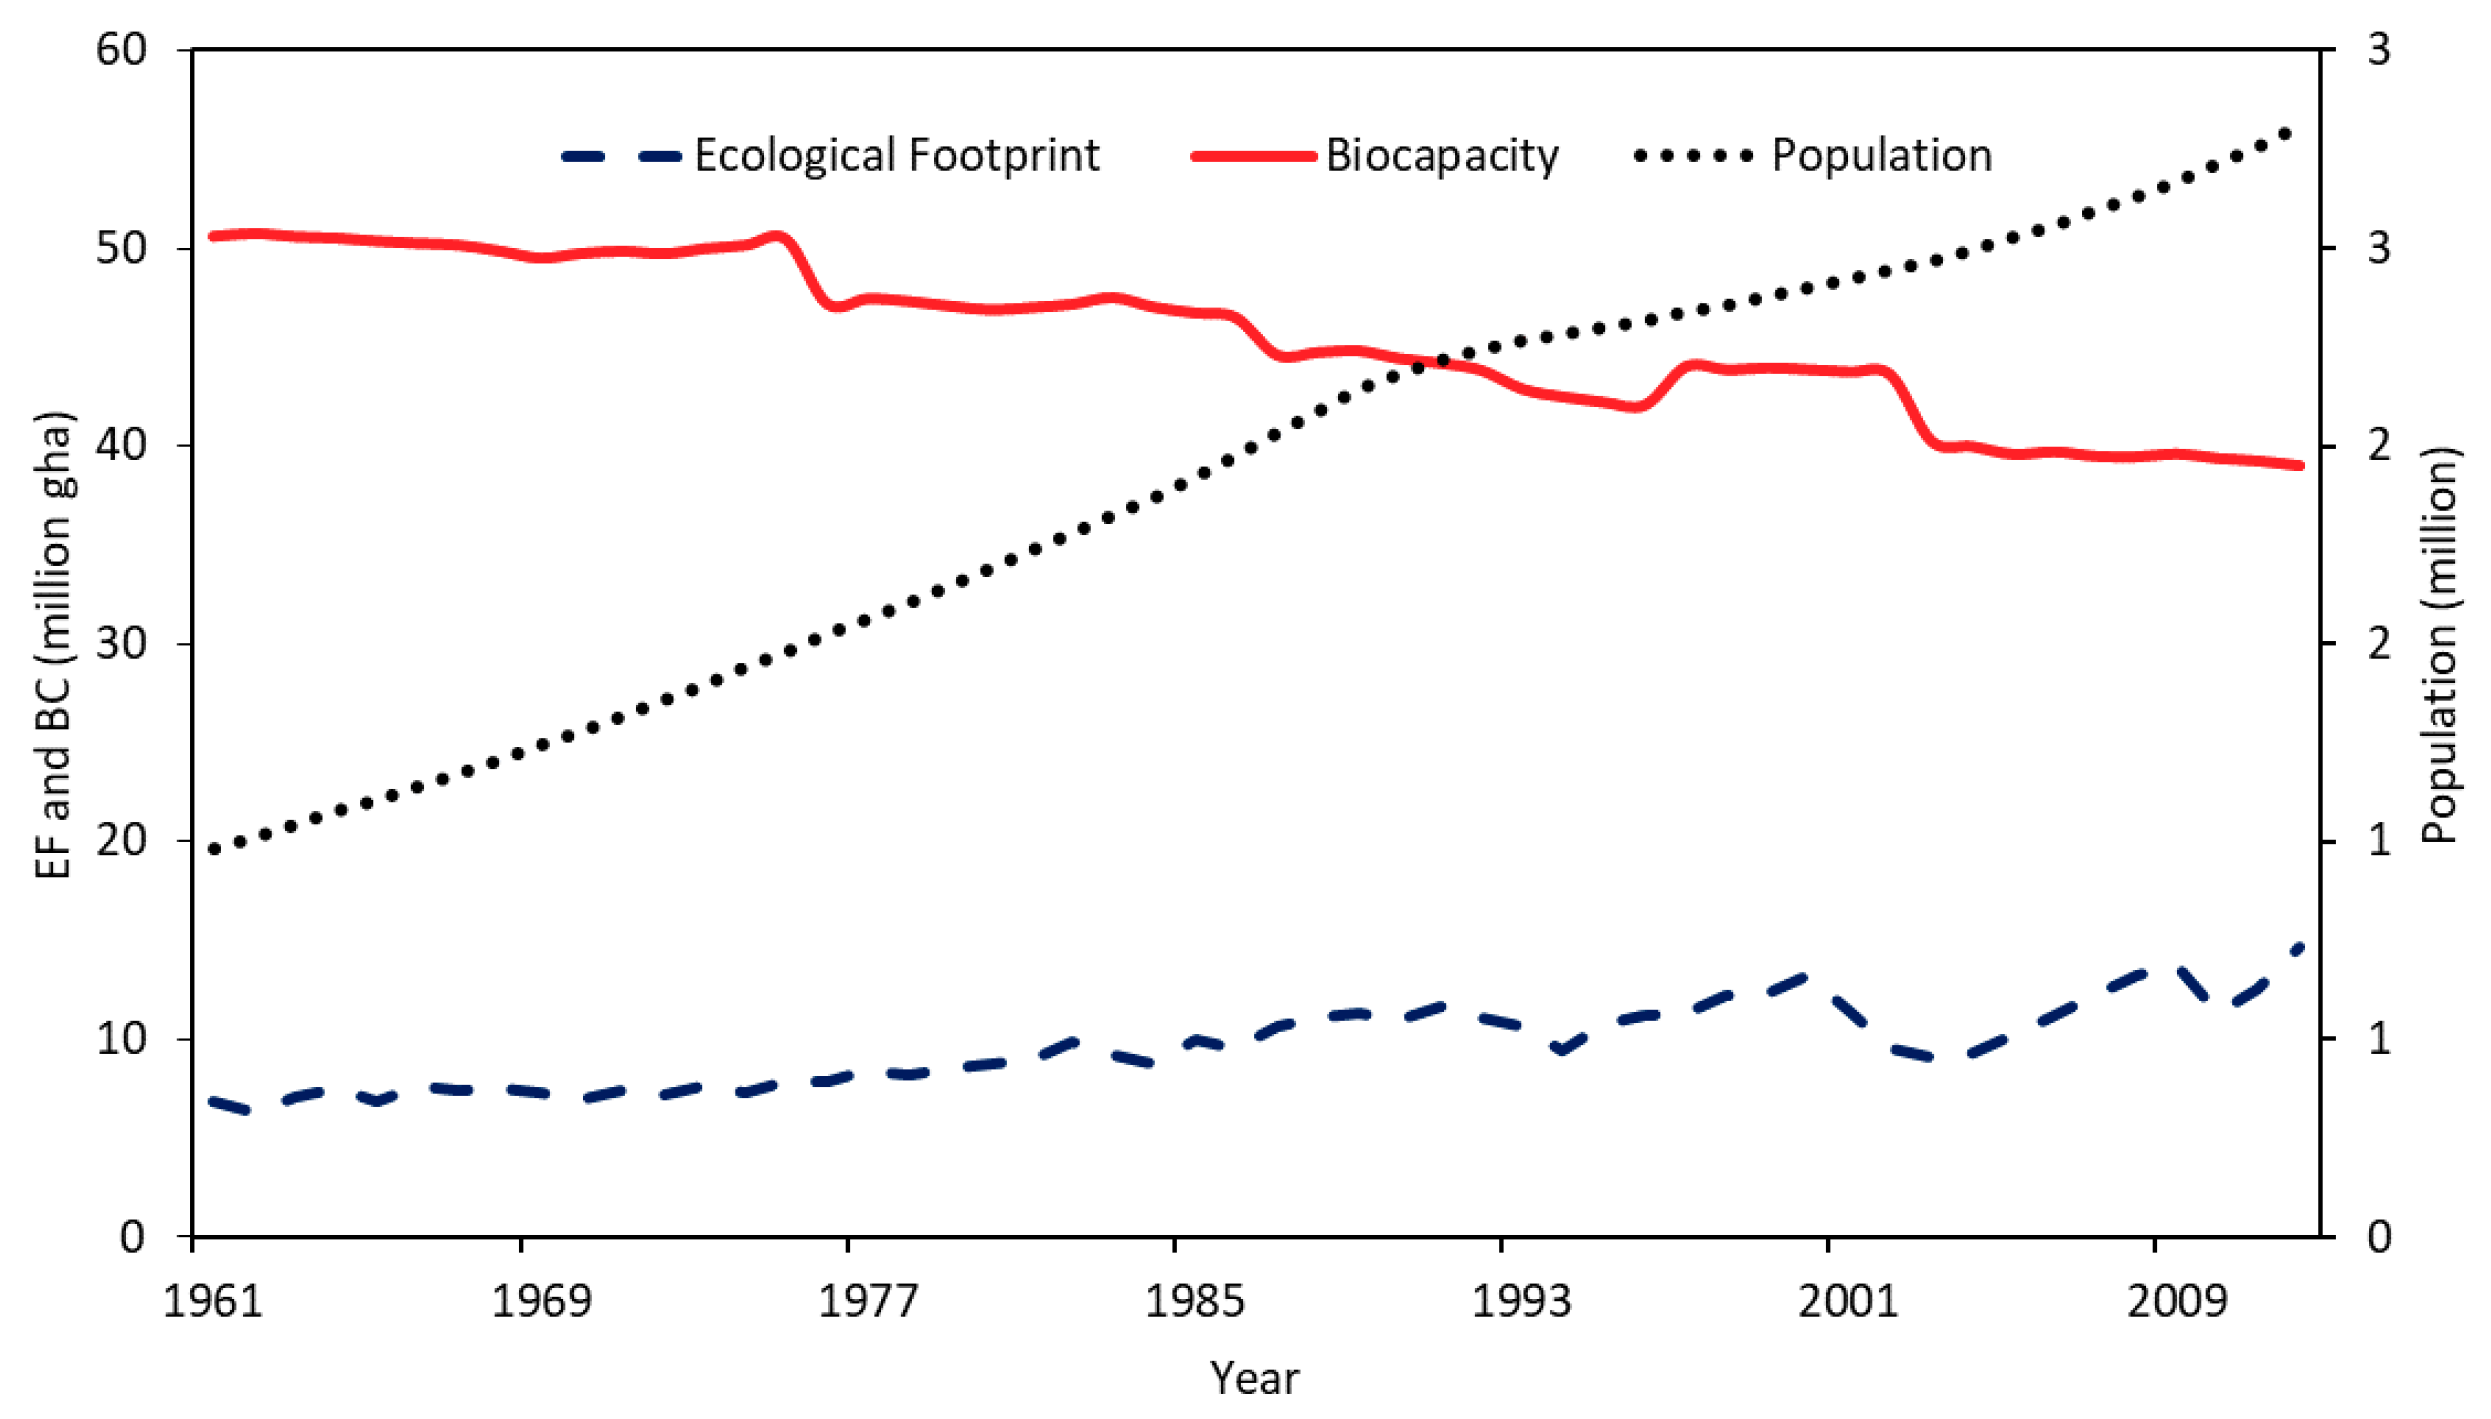
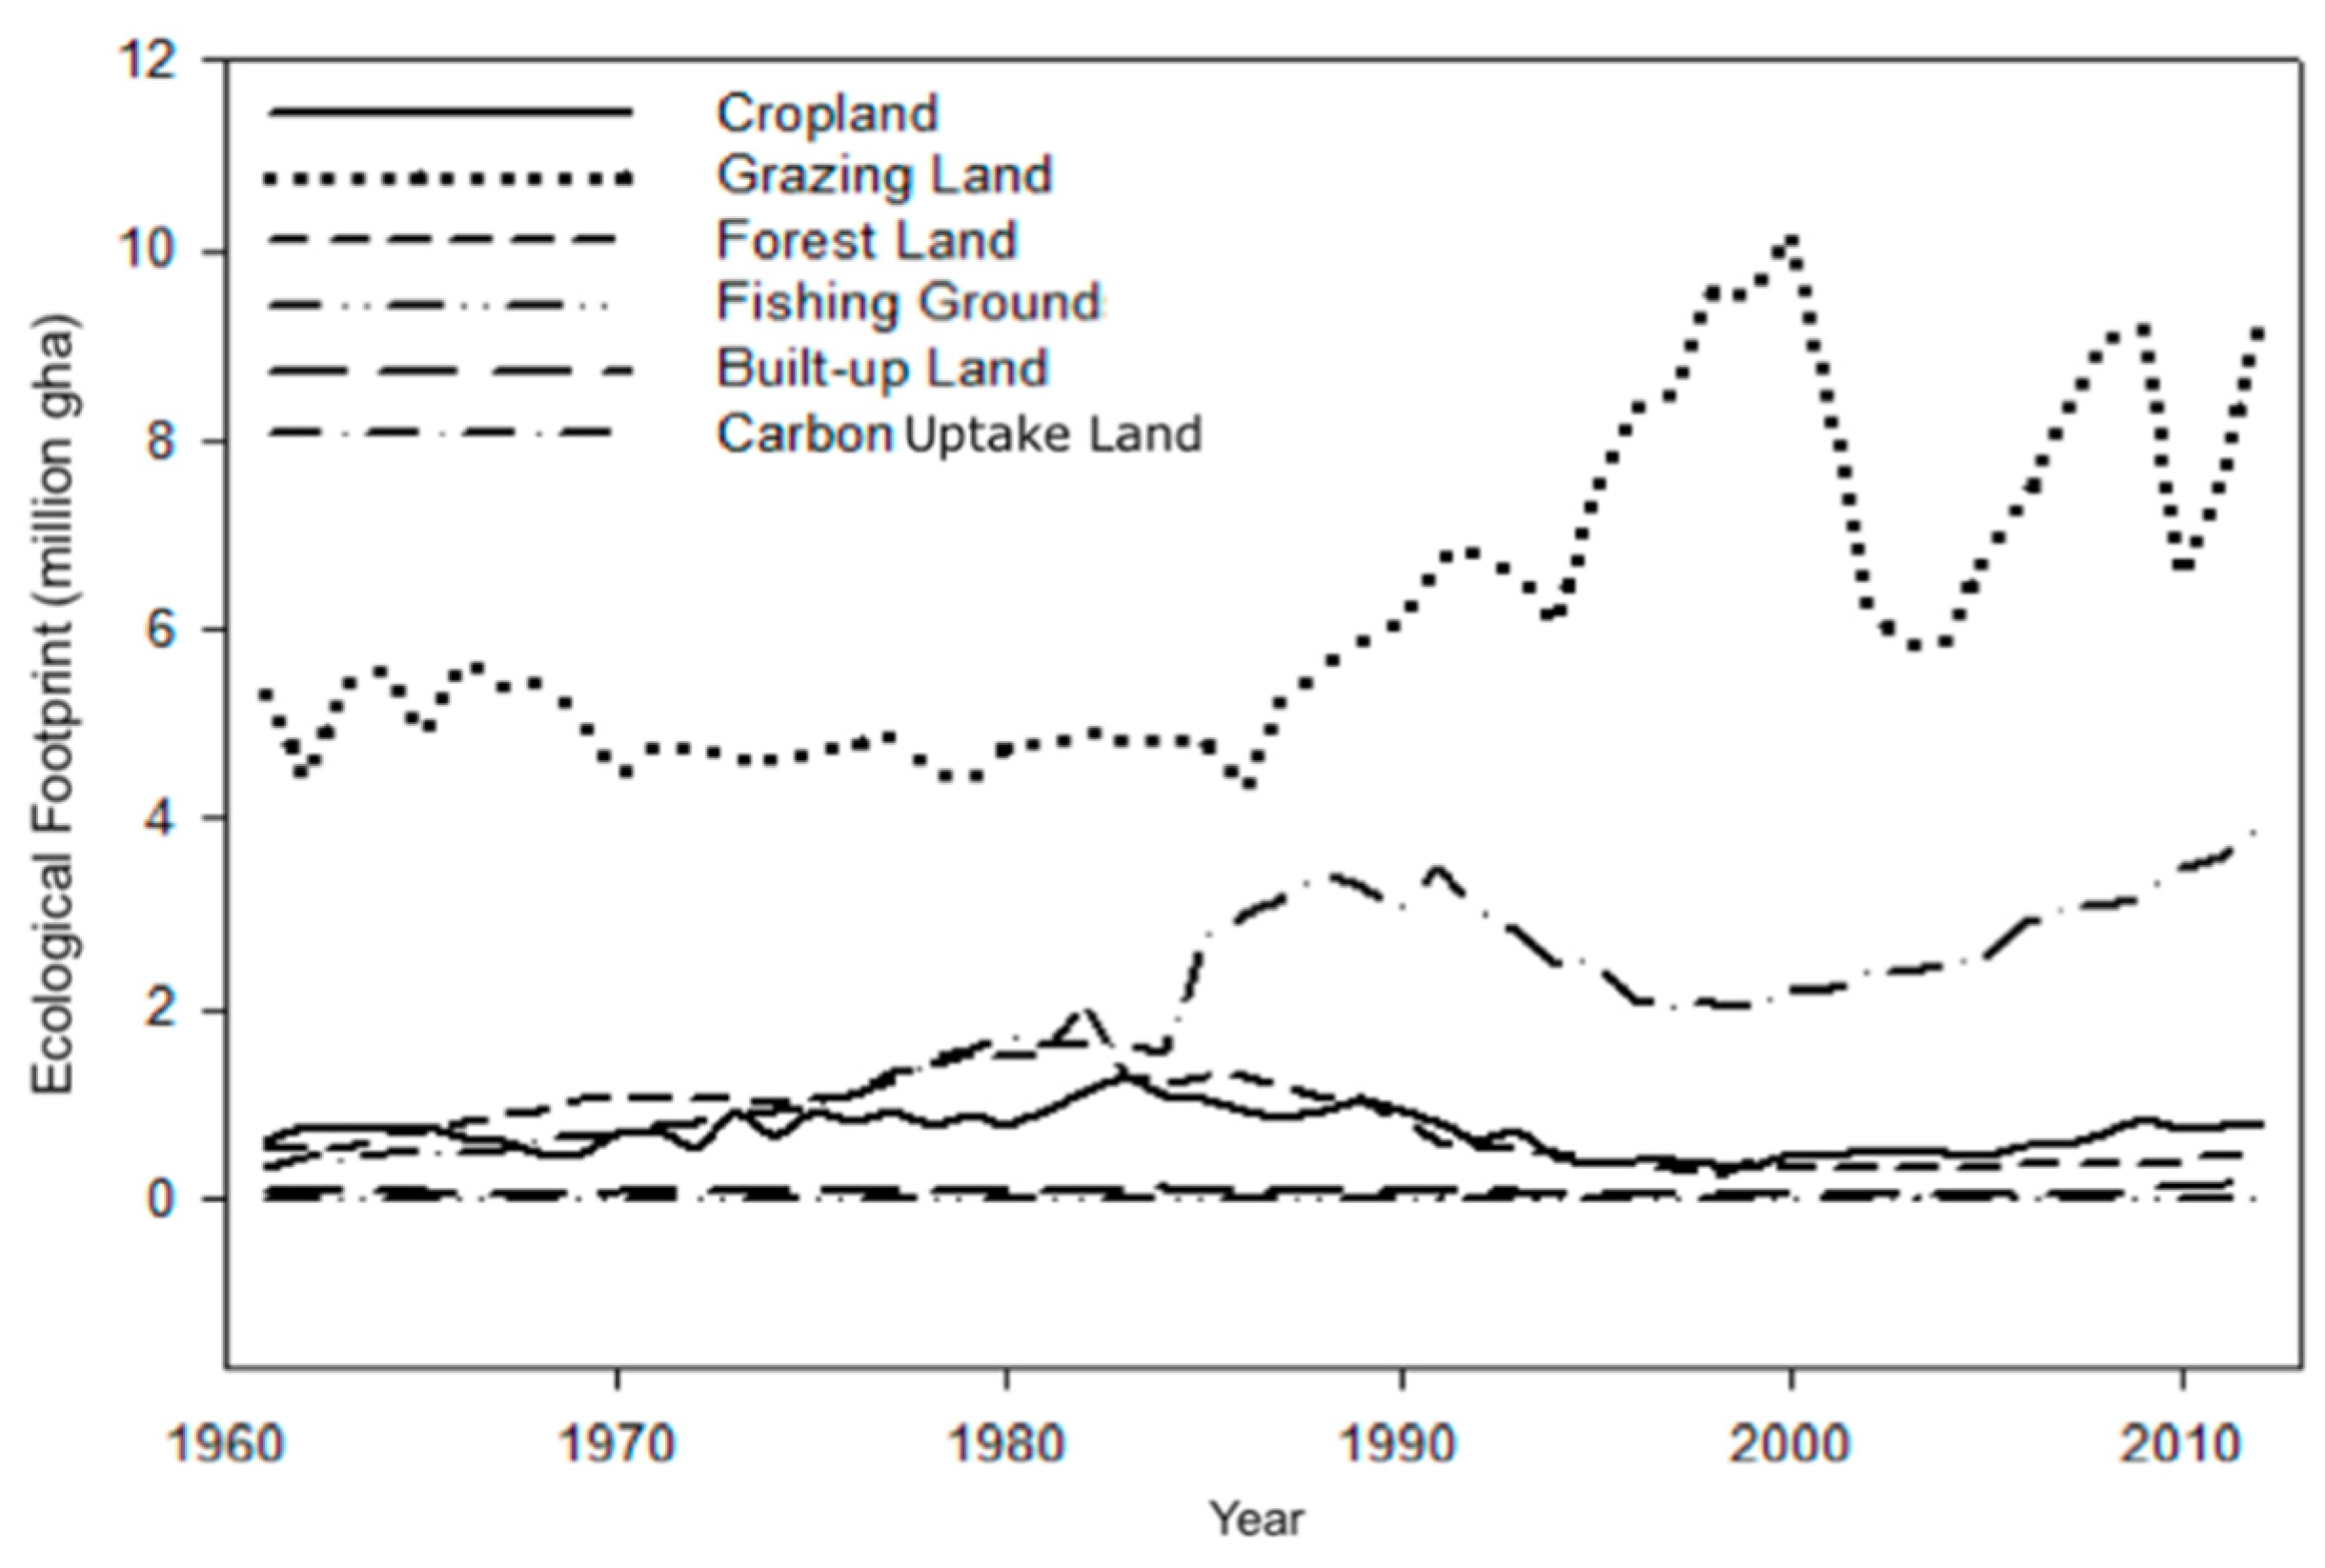
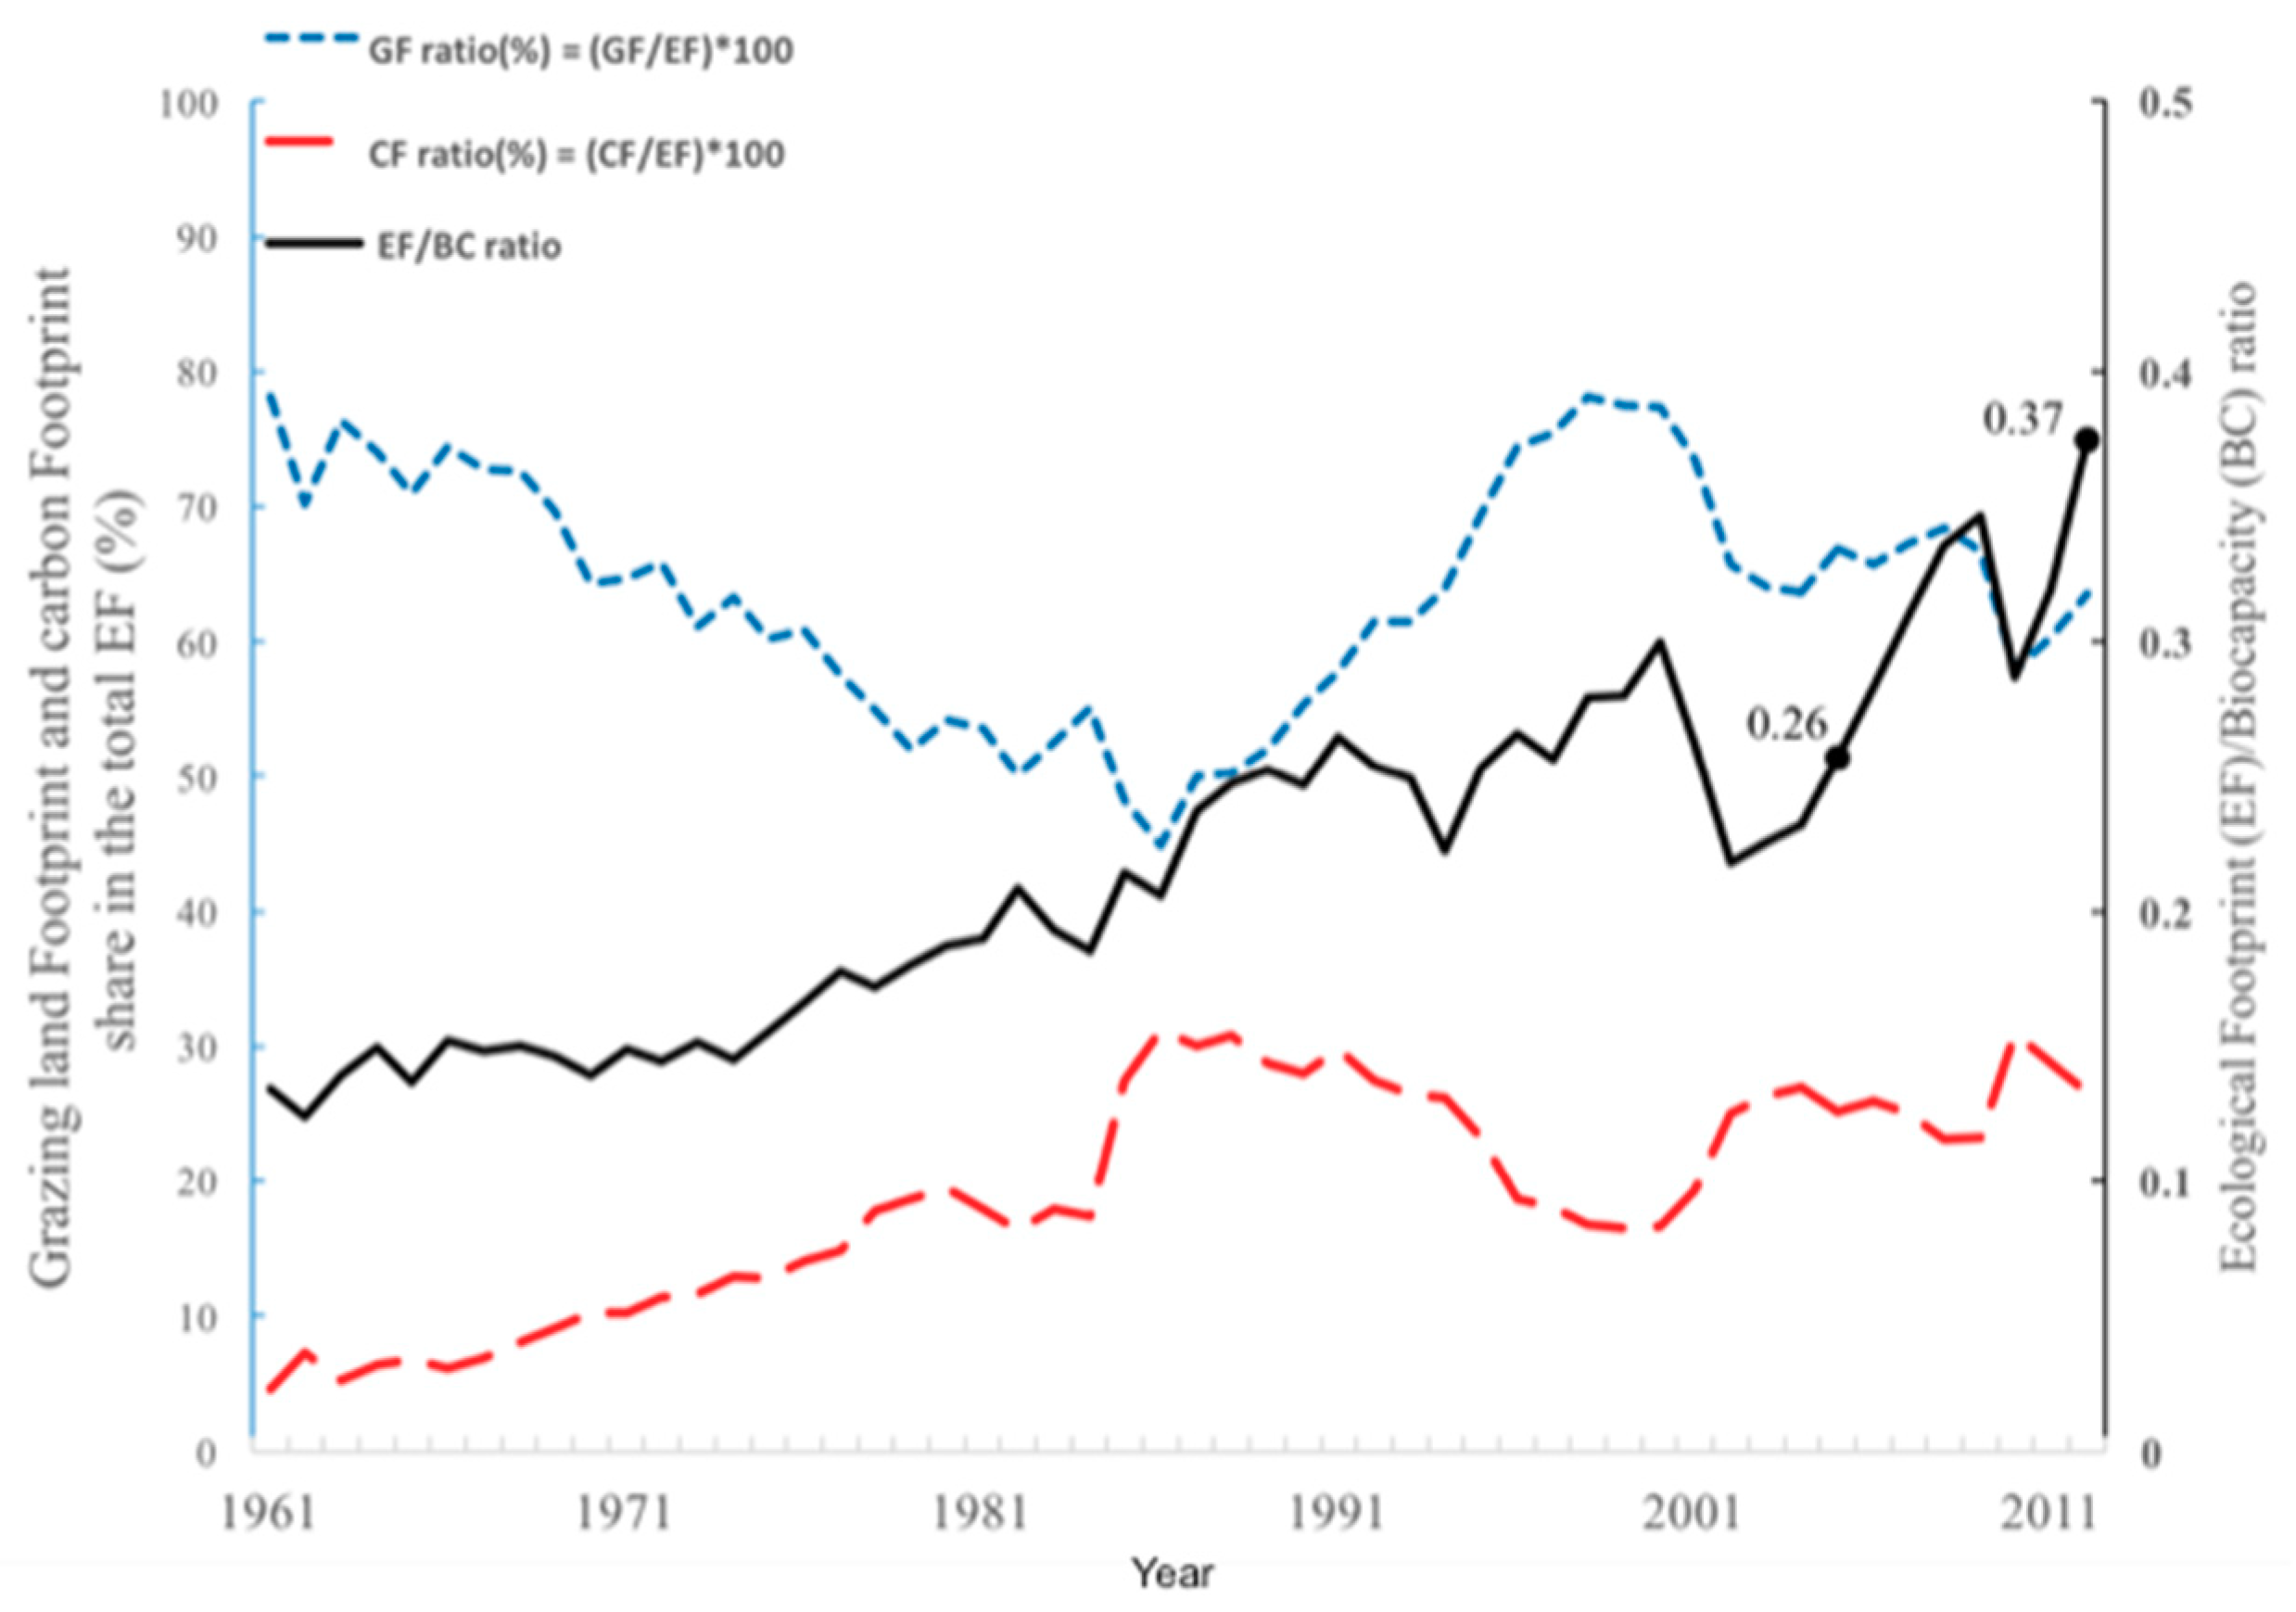
3.1. Variation of the Ecological Footprint

The variations of the total EF, BC, and population growth of Mongolia between 1961–2012 are shown in Figure 2. Mongolia’s total EF consumption in 2012 was estimated to be 14.6 million gha or 5.23 gha per capita. Over the period of 1961–2012, the population grew significantly, from about 982 thousand to 2.8 million [2]. Correspondingly, the total EF doubled, as it was 6.8 million gha in 1961. The total BC in 1961 was 50.6 million gha, and by the year 2012 it had declined to 39.0 million gha, and same as for the per capita of BC, from 51.52 gha per capita to 13.92 gha per capita, respectively. The EF accounts for Mongolia depict an increasing trend, indicating that the resource consumption in the country has risen, yet the BC remains larger than the EF.
More in detail, Figure 3 shows the Mongolian biologically productive area footprints of six categories. Among these categories, the footprints of grazing land and carbon uptake land have risen recently, while those of forest land, cropland, fishing grounds, and built-up land have gone down heavily since the early 1980s. In the case of fishing grounds and built-up land footprints, the EF has been equal to or less than 1% of the total EF, respectively, throughout the timeline. The footprints of the cropland and forest land reached their peak in 1981, accounting for 10.3% and 17.3% of the total EF, respectively, but have declined significantly since then.
Additionally, the fraction of each sector (in percent) to the total EF for every 10 years, and the maximum value of each sector are shown in Table 2. In 2012, 63.5% of Mongolia’s EF was from the grazing land footprint, and 26.6% was from the carbon footprint, while the sum of the other footprints was only 9.9%. Thus, further analysis has been carried out for the grazing land footprint and the carbon footprint, as these two categories generally account for most of the EF in Mongolia.

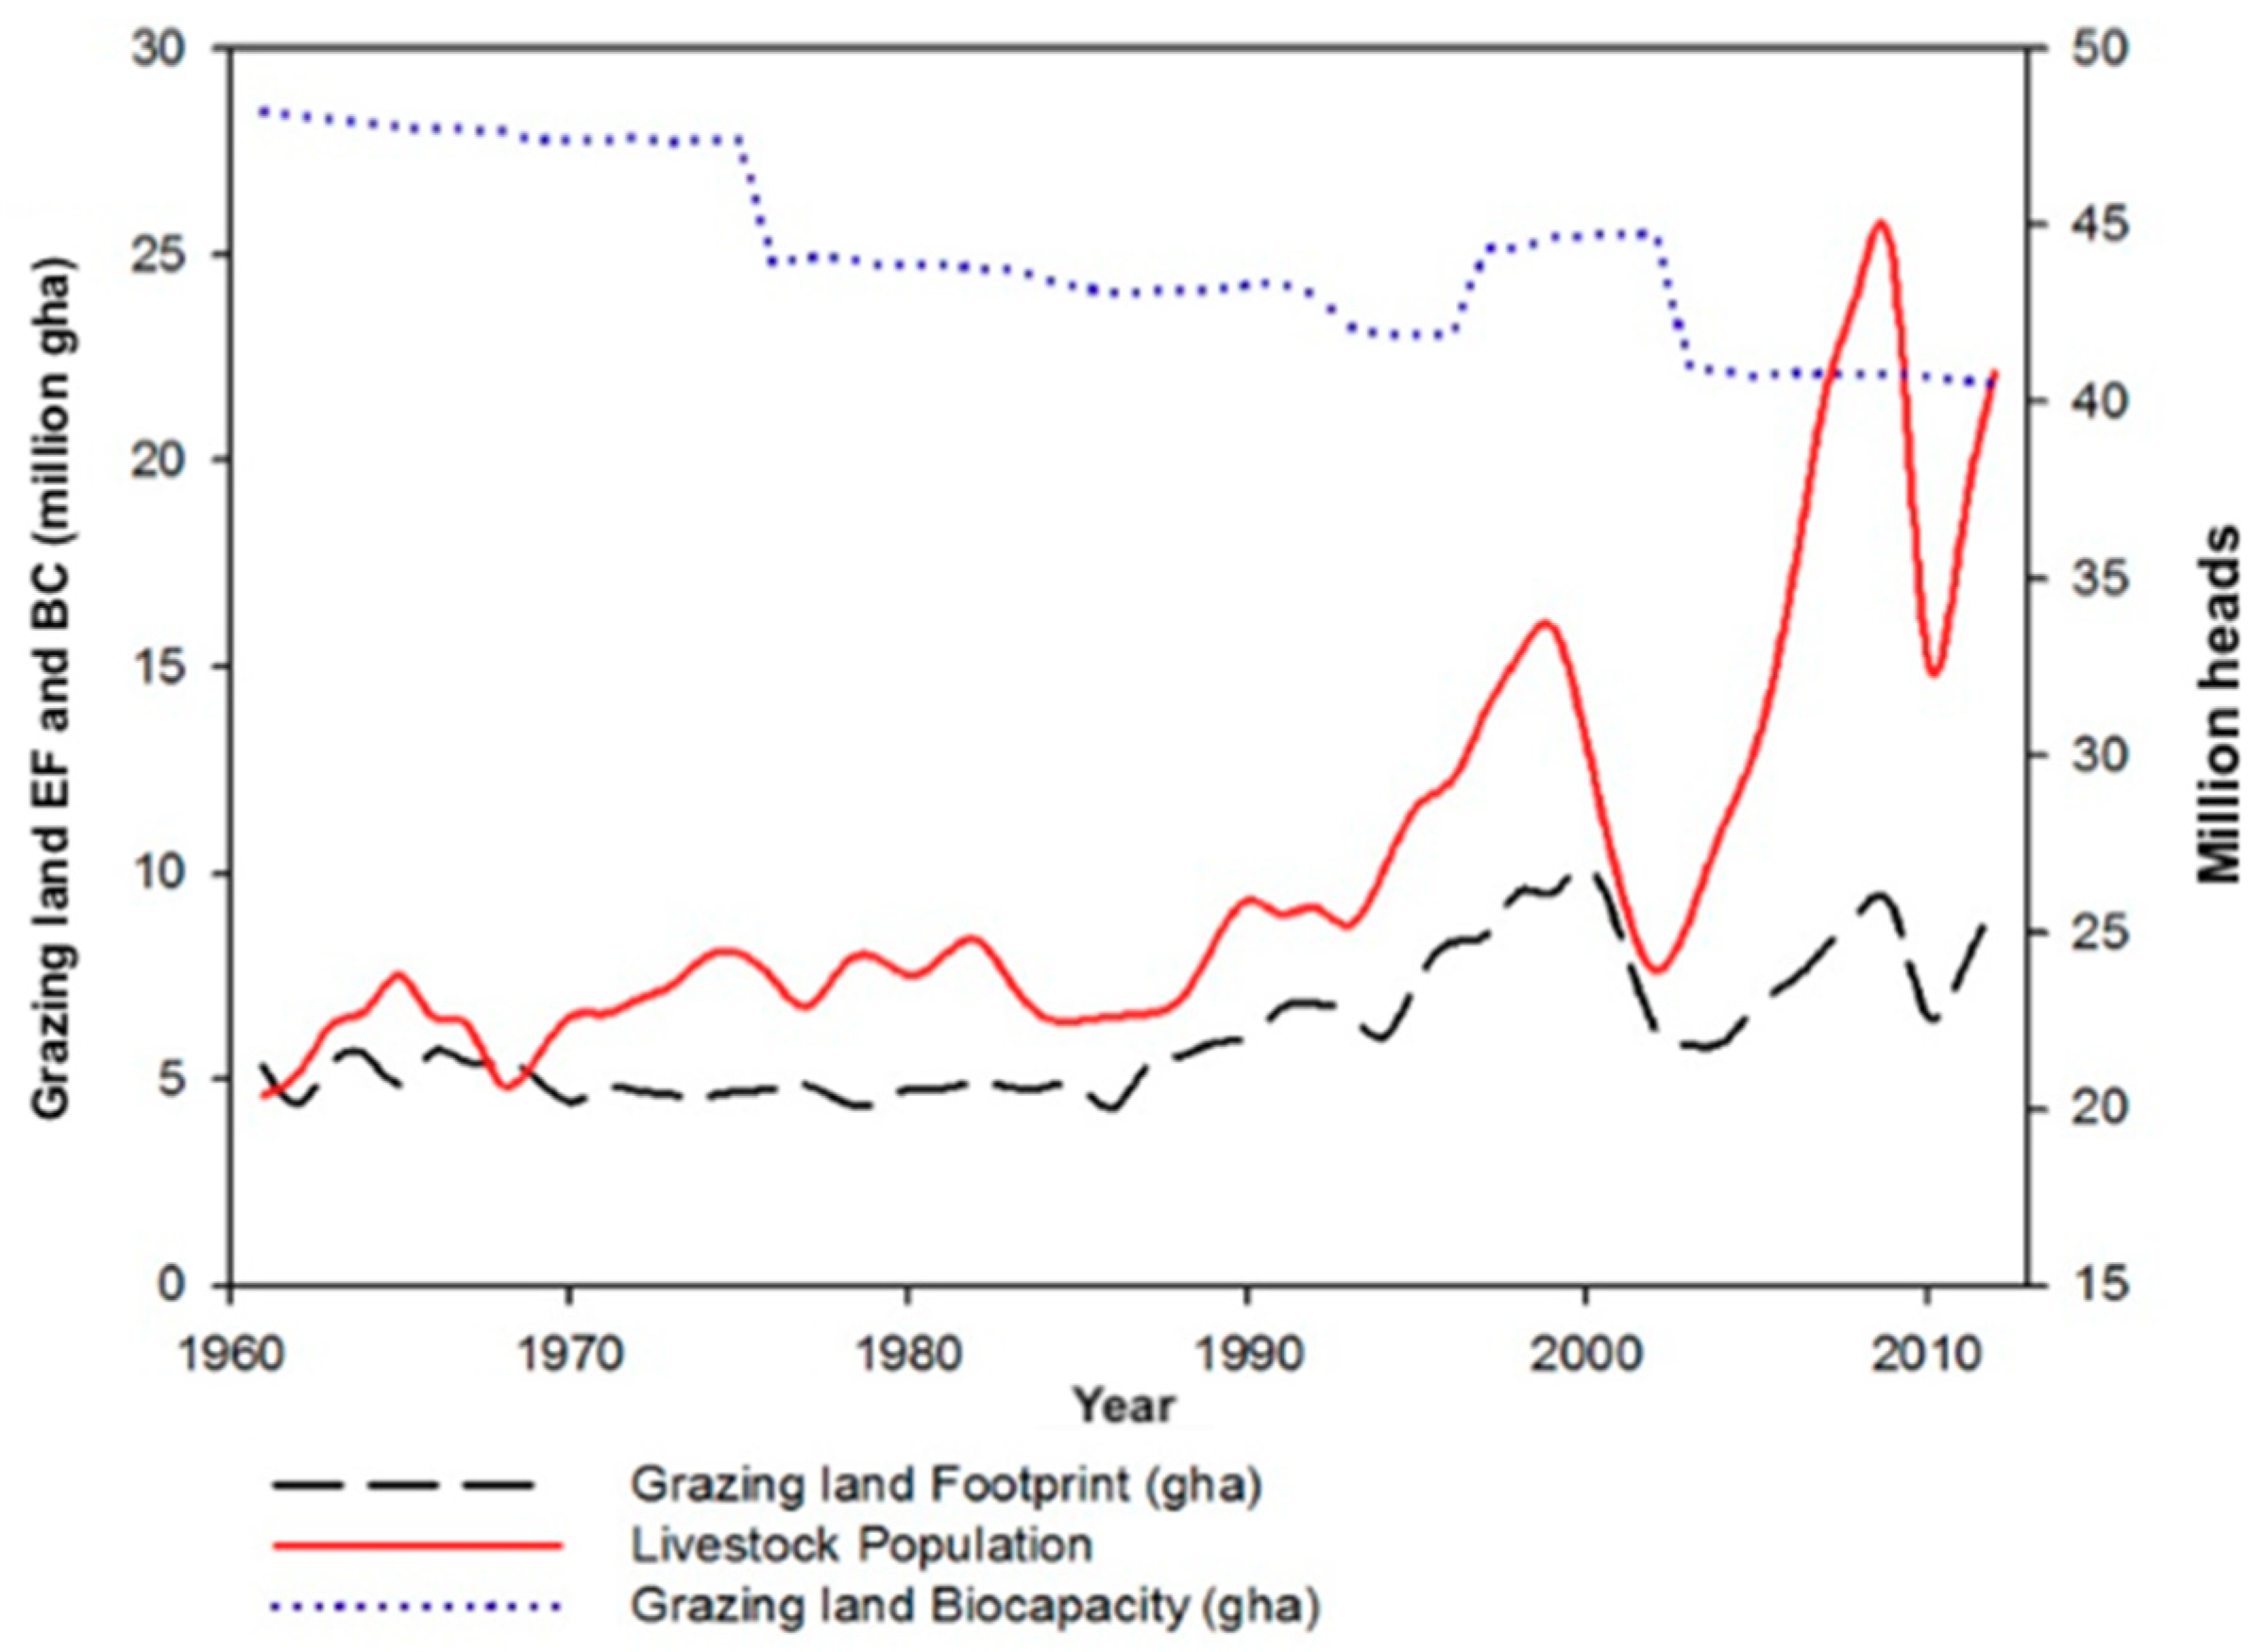
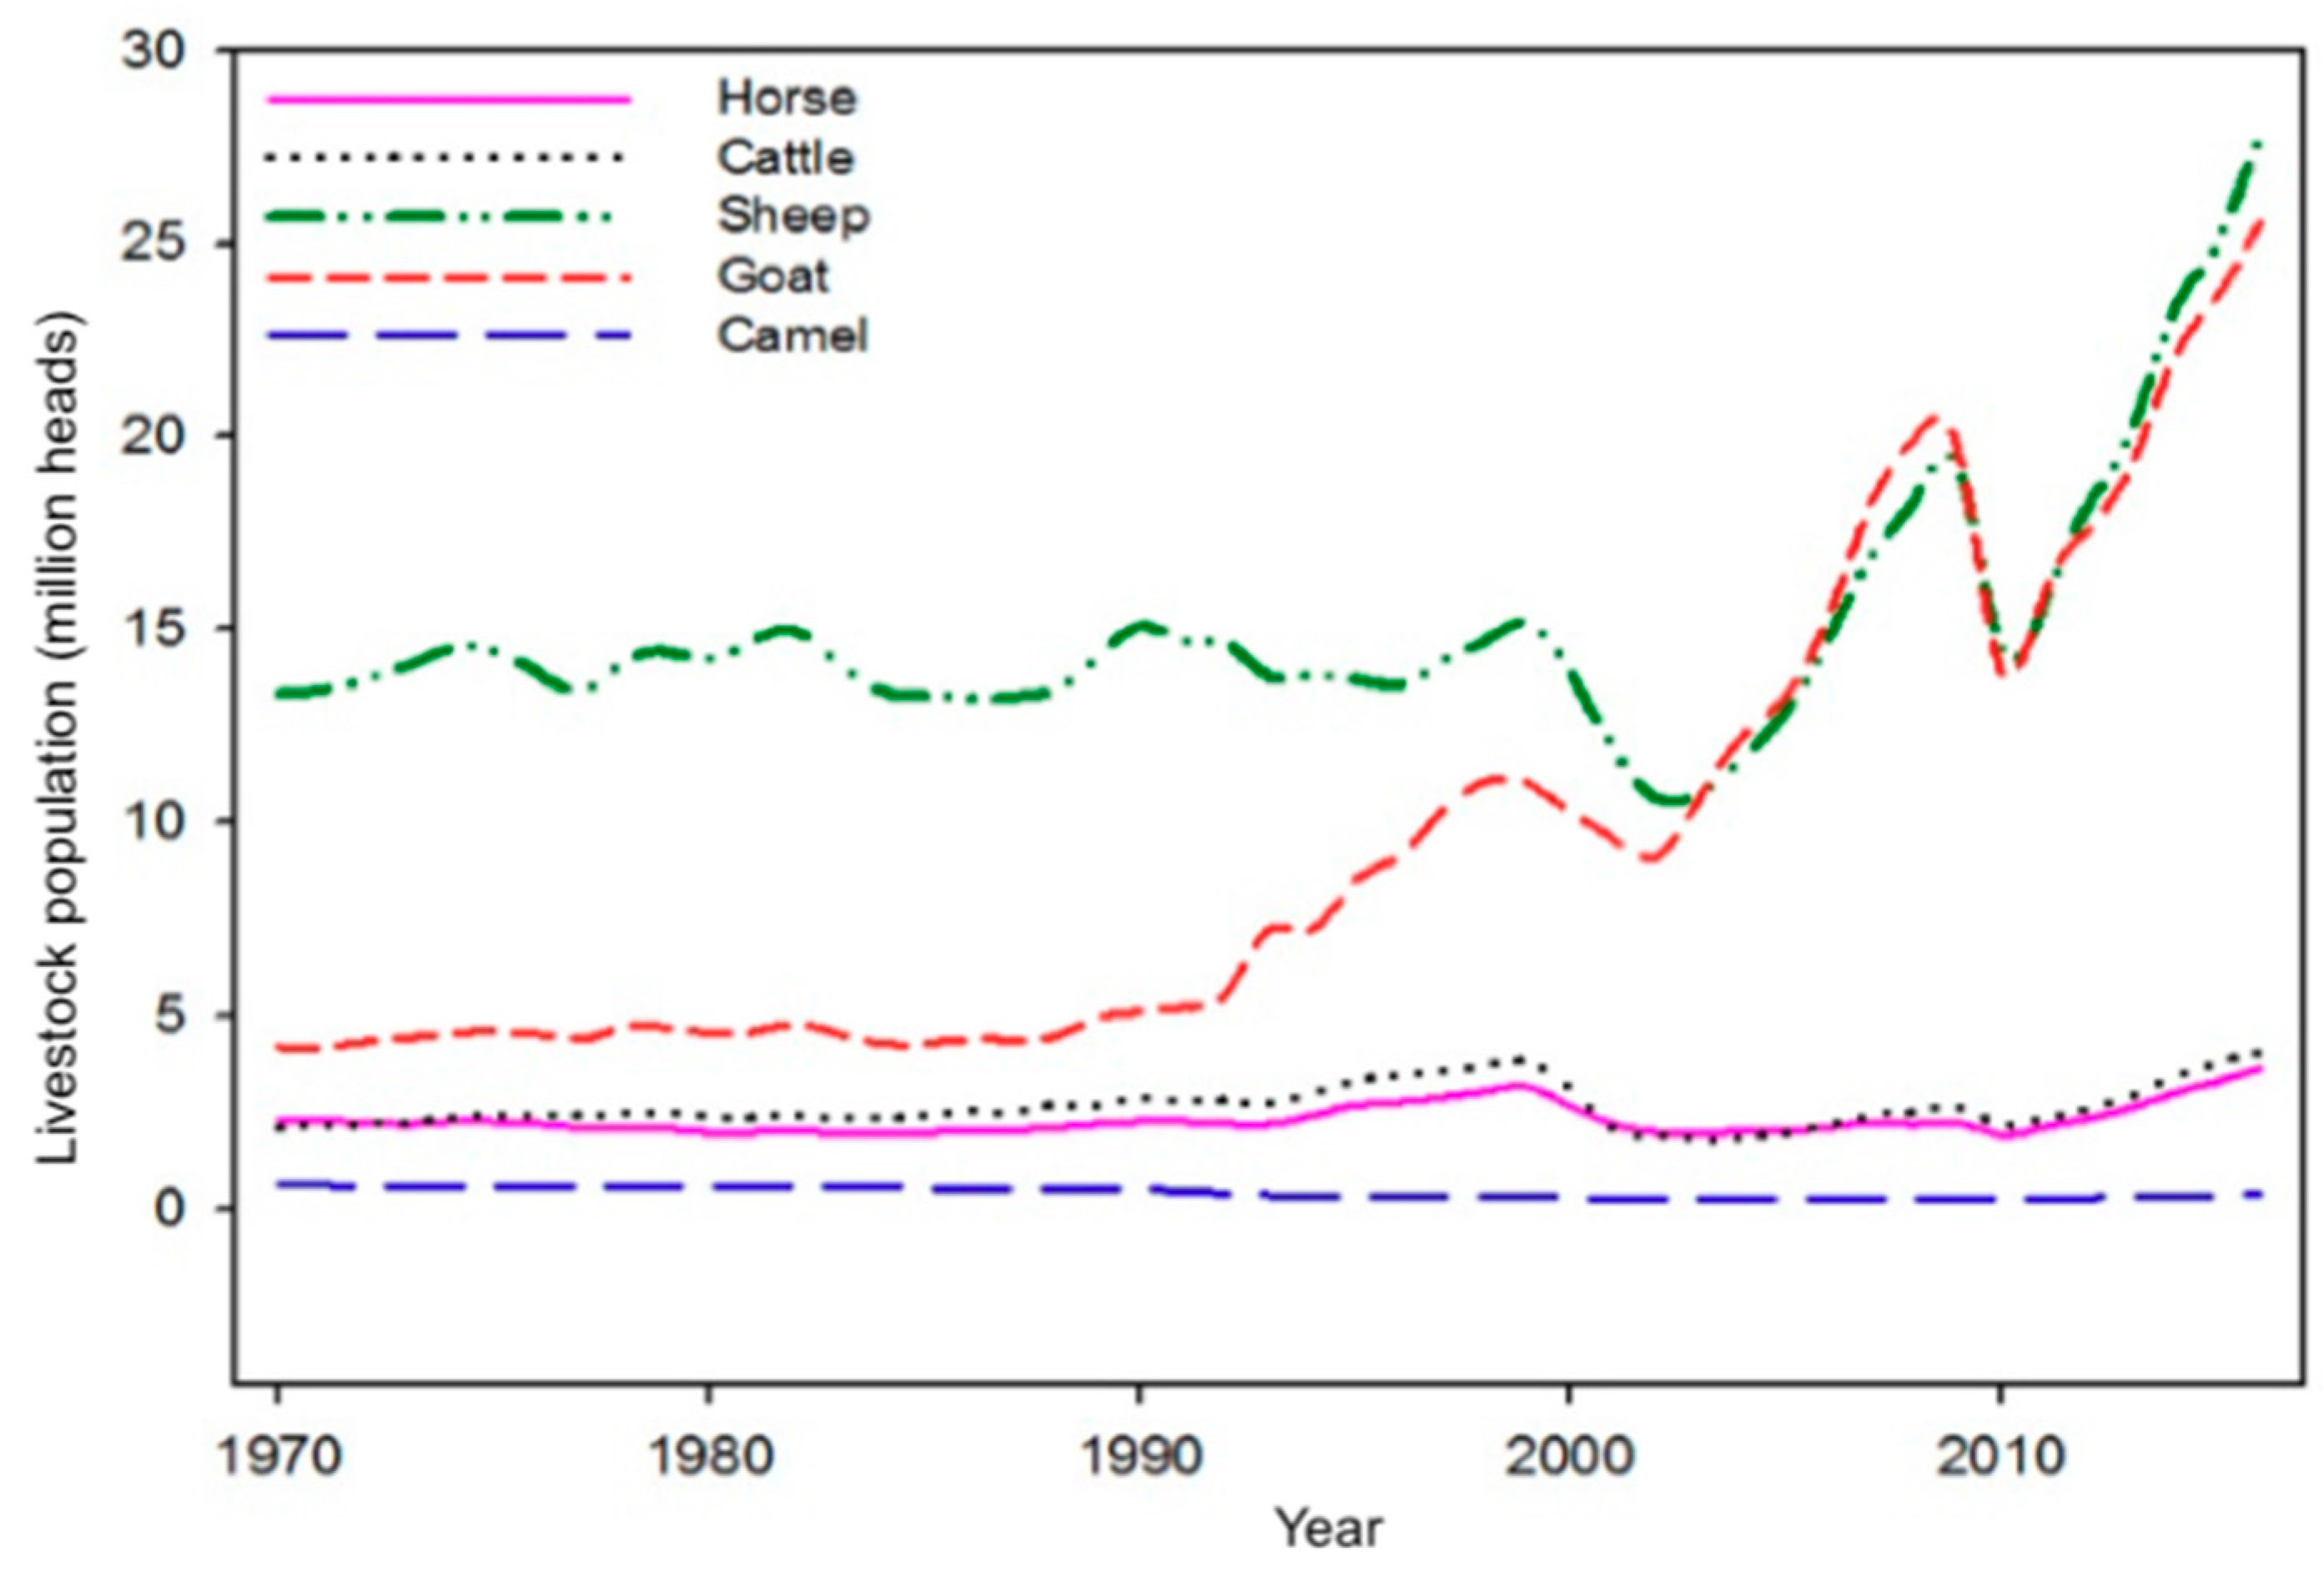
3.1.1. Grazing Land Footprint

The grazing land, which occupied more than 63% of the total EF in 2012, is a vital livelihood natural resource for Mongolia. In 1961, the grazing land footprint was 5.3 million gha, and by the year 2012, it had grown to 9.3 million gha. Over the period of 51 years, the grazing land footprint has been fluctuating as a result of the interaction between human activity, such as overgrazing, and climate conditions, such as severe winter or zud for consecutive years.
Between 1961–1991, the livestock population was relatively stable, ranging from 20.4 million to 25.5 million [29] (see Figure 4). However, in the early 1990s, after the political and economic transition, the collective patrol system was dismantled, and the previously state-owned livestock was privatized, which resulted in rising livestock numbers and a reduction in the overall mobile pastoralism [34]. The studies of Lise et al. [35] and Hilker et al. [36] showed that this privatized management led to not only to an upsurge in livestock density, but it also increased the grazing pressure in certain places near settlements and water sources. Particularly, the number of goats has progressively grown throughout the country, as the rural residents’ income has been mostly met by cashmere products [37], which in turn resulted in grassland degradation [37,38].
The livestock population and grazing land footprint both have been increasing in the past two decades, and show a positive correlation. During 1992 and 1999, the total livestock population rapidly increased. Same as was true for the grazing land footprint, which grew gradually until 2000, which indicated the first peak, as shown in Figure 4. This peak was followed by a rapid and steady decline from 2000 to 2003, due to consecutive years of drought and zud [39,40], and it reached its lowest point throughout the grazing land footprint timeline. Another increase for the second peak was in 2009. And from the following year, 2010, the livestock number showed a declining trend due to the historically exceptional harsh winter of 2009–2010 [41,42], and consequently, the grazing land footprint dropped from 9.2 million gha to 6.5 million gha.
From 1961 to 2012, the grazing land BC declined from 28.5 million gha to 21.8 million gha, as shown in Figure 4. According to Fensham [43] and Bertiller [44], this weakening in BC was due to heavy grazing, which led to a decline in plant diversity, vegetation cover, and to a disturbance in the seed production of the soil. Also, recent studies based on satellite measurements, such as the vegetation optical depth (VOD), which measures the biomass water content in vegetation, and the normalized difference vegetation index (NDVI), which graphically indicates the chlorophyll richness in green plants cover, demonstrated that from 1993 to 2012, the grassland cover in Mongolia has degraded because of the rapid growth in livestock population [45].

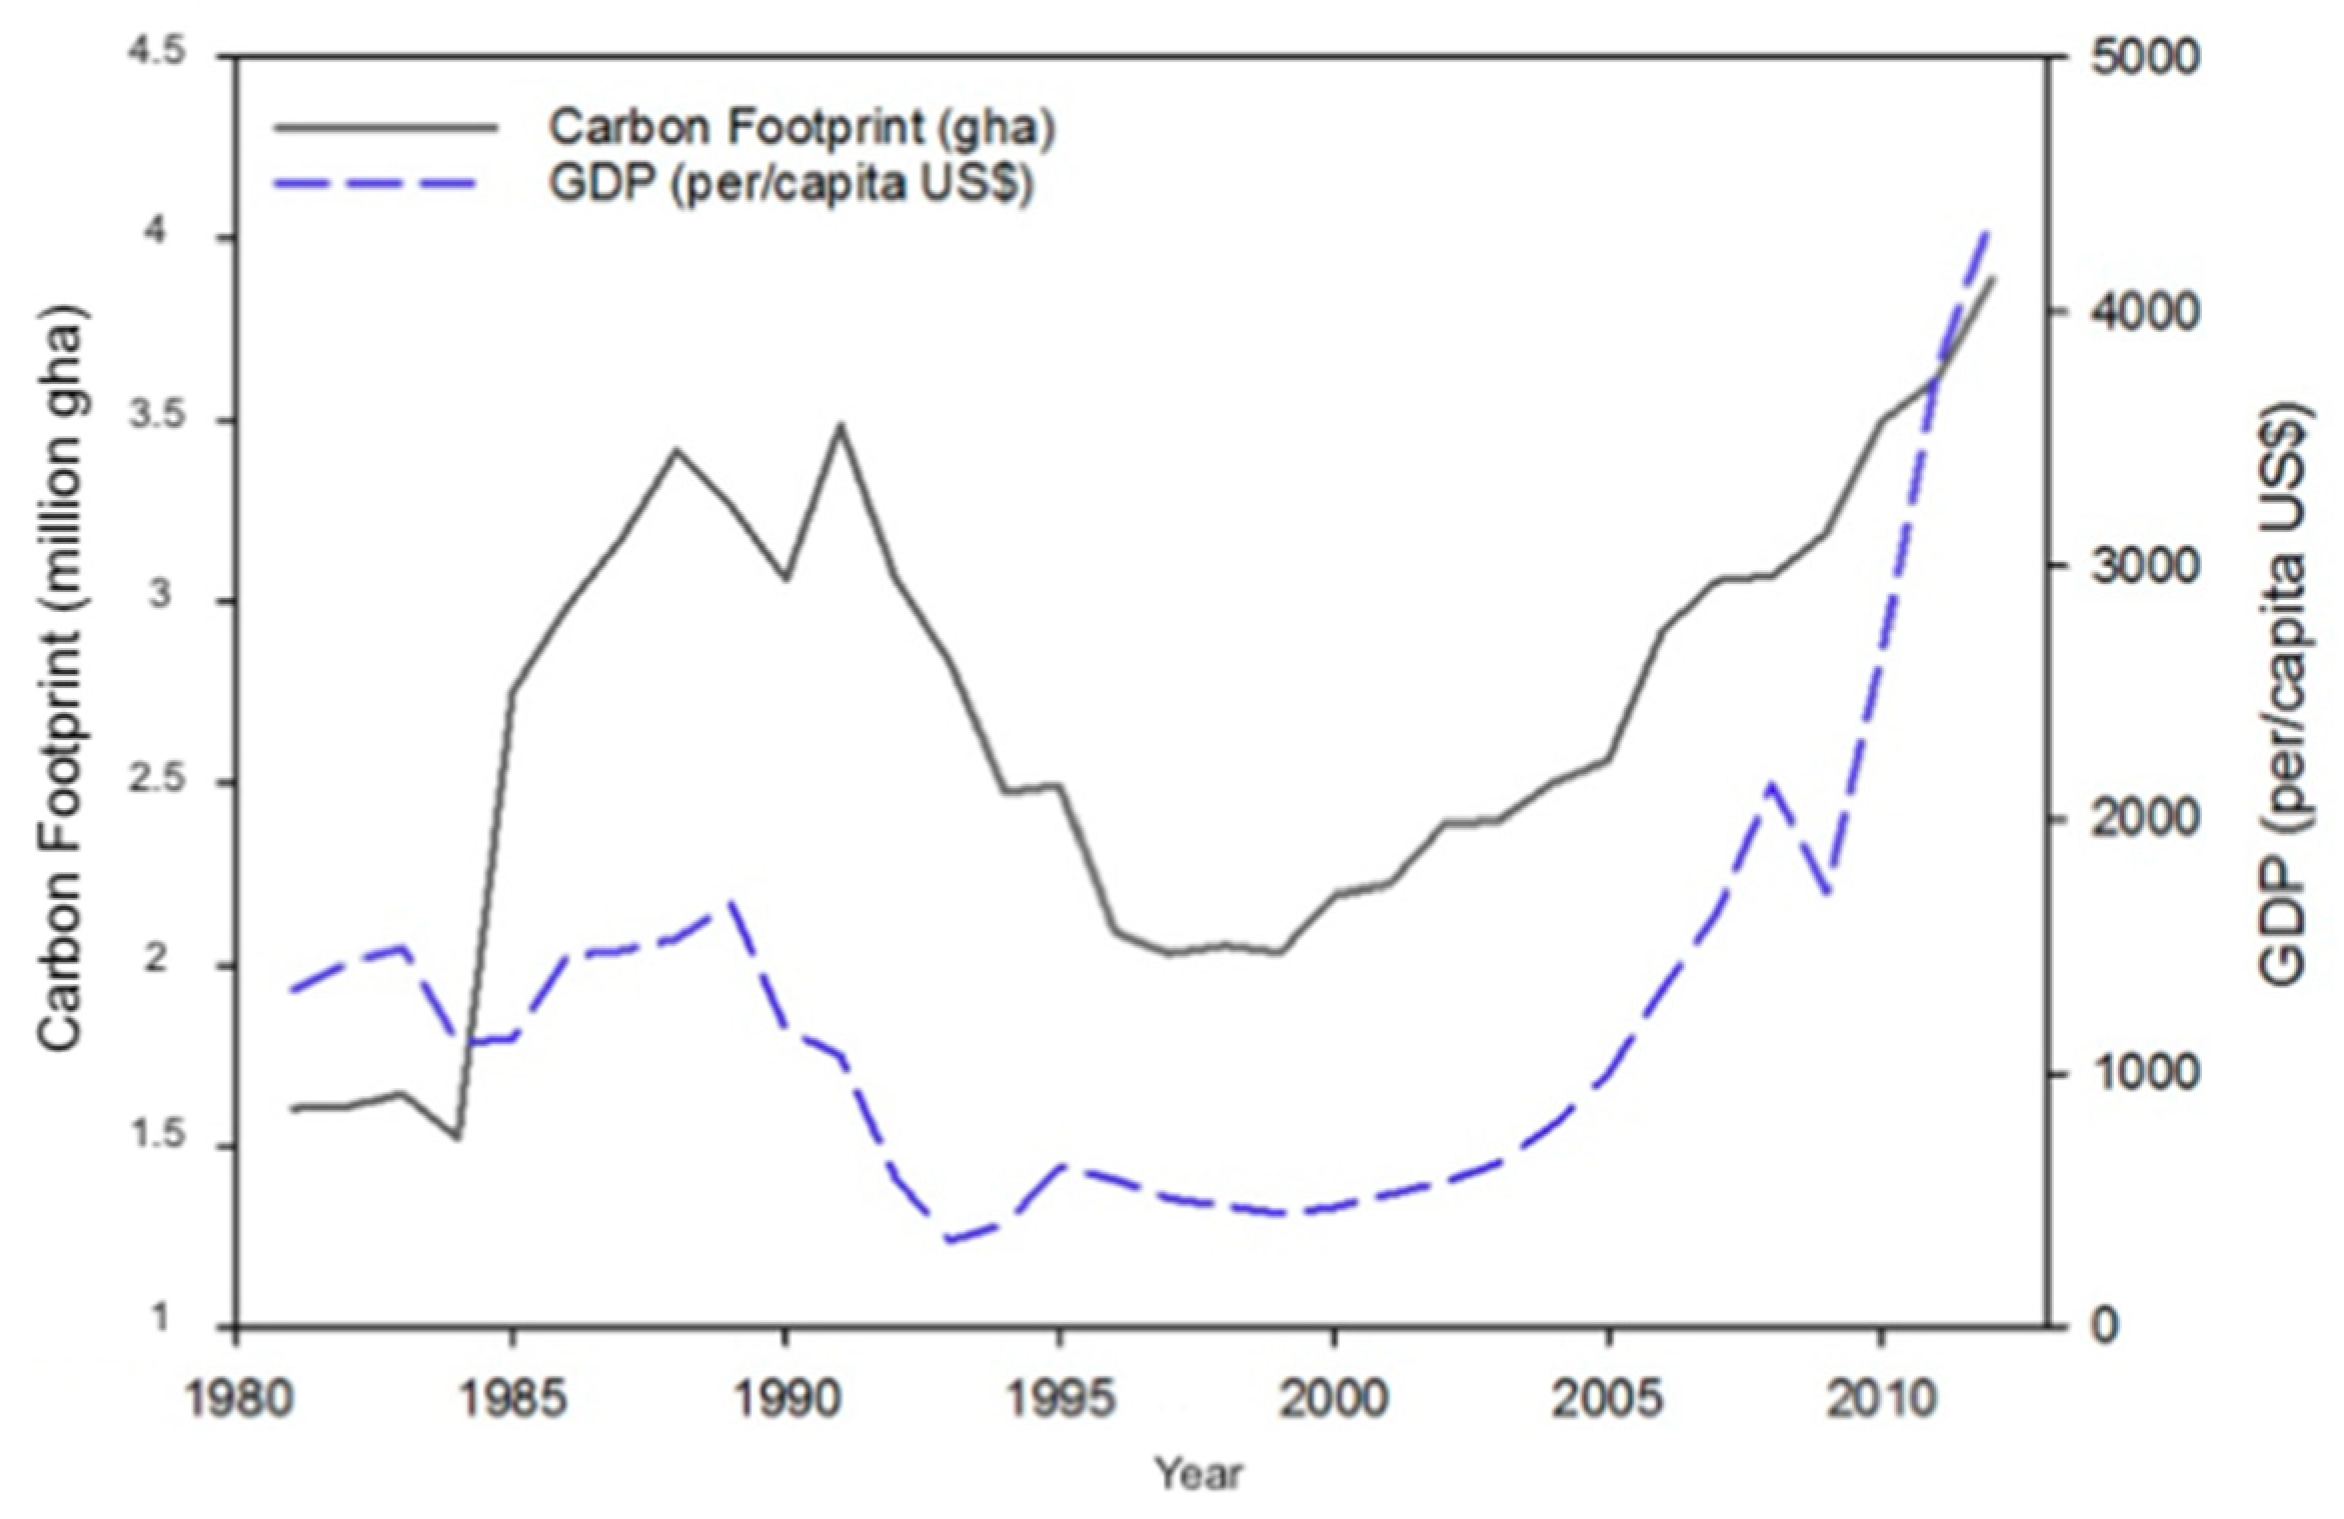
3.1.2. Carbon Uptake Land Footprint

The carbon uptake land footprint, or the carbon footprint, is estimated by totaling the biologically productive area, such as forest land, required to assimilate the emission from burning fossil fuels. In other words, it is the amount of forest area (gha) that is needed to absorb CO2 [46]. In Mongolia, the carbon footprint increased from 0.32 million gha in 1961, to 3.5 million gha in 1991. The biologically productive area needed to assimilate carbon dioxide has increased by more than 11 times in last 30 years. Over the period of 1992–1999, the carbon footprint showed a downward trend as the economy declined during the transition period [47,48]. After 2000, however, the CO2 emissions from fuel combustion have continuously increased, and the carbon Footprint reached 3.9 million gha in 2012, of which about 60% accounted for heat and power production, 14% for industrial processes, 13% for transportation, and 13% for other. Heat and power generation dominated and made up most of the carbon footprint in Mongolia, as shown in Figure 5.
The power demand throughout the country is expected to rise. Growing levels of urbanization combined with mining activity expansions have become the leading forces of the country’s intensified energy demand. In the business as usual (BAU) scenario, Mongolia’s demand for primary energy is estimated to grow from 3.3 Mtoe in 2010 to 12.1 Mtoe in 2035, as shown in Figure 6. For the energy usage type, the coal share will remain dominant, reaching 74.9% in 2035, and the leading force will be the power generation [32].
In addition, the amount of the carbon footprint in Mongolia rises due to increased economic activity. The mining sector output makes up for around 33% of the country’s GDP and around 70.3% of the total value of industrial productivity [49]. In Figure 7, the estimated trend of GDP per capita (US $) and the carbon footprint (gha) in Mongolia over the period of 1981–2012 are shown. Both trends display a positive correlation throughout the period, and have shown a constant increase in the last decade.

3.1.3. Estimated Time Span for the Ecological Deficit

Ecological deficit is a state where the EF surpasses the BC [26]. Accordingly, its ratio can be determined by comparing the two amounts (EF/BC). A ratio over 1 indicates that the total EF amount exceeds the BC, whereas a ratio below 1 means that the total EF amount is lower than the BC. In Figure 8, throughout the timeline, the BC has been the dominant factor, yet, but the EF/BC ratio increased. For instance, discounting the year 2010, when the harsh winter of 2009–2010 occurred, cutting the number of livestock, the EF/BC ratio of 0.26 in 2005 gradually expanded to 0.37 in 2012 [25].
To estimate a point where Mongolia’s total BC is no longer sufficient to support the competing demands or the EF, a linear regression analysis method is applied using the past 51 years of the total EF and BC data. As presented in Figure 9, if the development of Mongolia continues in the same way, that is, a linear trend, the county’s ecological deficit (or overshoot) point is likely to be reached by the year 2083.
In other words, with the current rate of the population and economic growth’s demand on nature, overshoot is possible to occur in about 70 years in Mongolia. On the global scale, the EF surpassed the BC in the early 1970s. As of 2012, it was estimated that 1.6 of the Earth BC equivalent will be required to replenish the natural resources [50]. According to the assessment, this is due to the high-income countries having maintained an EF per capita that is greater than the BC available per capita.

3.1.4. Limitations in the Ecological Footprint Analysis

As a measurement of sustainability in Mongolia, there are some limitations in the EF method due to its theoretical structure, although its core ability to address the sustainability assessment is widely recognized [51], as Jarvis noted [20]. For example, when converting regional scales into global average productivity quantity, there could be possible numerical errors [52].
There is mutual land usage of the equivalence factor, for example, the forest land equivalence factor is used in the carbon footprint as well as the forest land footprint, and the crop land equivalence factor is also used in the built-up land footprint as well as the cropland footprint.
Also, Venetoulis and Talberth [53] further identified that the equivalence factors may vary each year within the range of the available information. The Global Footprint Network utilizes the annual data obtained from the International Energy Agency (IEA) and the Food and Agriculture Organization of the United Nations (FAO), yet in the same period, the domestic statistics may differ slightly. For a more comprehensive EF analysis, an indicator of freshwater consumption, water Footprint, should be included. Also, economic and social factors are considered highly correlated to the amount of EF and BC of a nation, yet the characteristics of income and environmental variation among countries are not included in the explaining variables [54].
To overcome these limitations, more precise and comprehensive data analyses and integrations are needed. Further research on these problems is needed, and can be carried out with the help of international organizations.

3.2. Future Policy Directions

After rapid economic growth, concern over environmental degradation is rising in Mongolia, and demands for adaptation strategies and policy planning relevant to ecological impact are increasing. To respond to these challenges, the Ministry of Environment and Green Development (MEGD) was established in August 2012, with the status of a core ministry. Also, in June 2014, to address the fundamental goals of sustainability, the Mongolian parliament approved the Green Development Policy [55]. The national strategic plan for effective grazing land usage focusses mainly on livestock number regulation, improved carrying capacity, and the development of local farming. For an efficient energy usage strategy, the Green Development Policy addresses the development of low carbon consumption and the promotion of clean technology [15]. As two types of land, grazing land and carbon uptake land, are the major EFs, policy directions for these two are suggested.

3.2.1. Grazing Land Footprint

The steppes of the Mongolian Plateau are high in grassland diversity and make up most of the Eurasian Steppe region [34,56,57]. Also, in Mongolia, sustainable livestock use to satisfy social, economic, and dietary needs is one of the vital assets. Grazing management strategy using values derived only from economic factors that are irrelevant to ecological principles has been used, but it is impractical for sustainable development [58]. Management decisions should take the limitations of the grazing land footprint and sustainable usage of BC into consideration.
During the latter part of the 20th century, Mongolia’s grazing land BC has been declining. To distinguish the effects of climate conditions from human-induced grazing land dynamics, Zhou et al. [45], John et al. [34], and Li et al. [59] conducted evaluations based on the residual trend method (RESTREND) [60] of the grazing land areas in Mongolia and Inner Mongolia during 1981–2006, 1981–2010, and 1993–2012, respectively. The results of these studies showed that a combination of anthropogenic factors was the main cause of the degradation in the above-ground biomass (VOD) and canopy greenness (NDVI) in the Mongolia Plateau. Climate conditions such as precipitation and temperature levels, on the contrary, showed a positive impact on grassland restoration in Mongolia [61]. Human-induced factors attribute to the growth in livestock number and grazing pressure in certain areas stimulated by livestock privatization. Accordingly, for grazing land management, two objectives can be considered—(a) regulating the livestock population with improved efficiency output and (b) resting the affected areas by encouraging the long-distance movement of livestock.
a. Regulating the livestock population with improved output efficiency
After the privatization of livestock management in the early 1990s, the total number of livestock surged from 25.1 million in 1993 to 66.2 million in 2016 [29]. Horse, cattle, sheep, goat, and camel are the five major animals used for livestock in Mongolia. Their population fluctuations for each animal type from 1970 to 2016 are illustrated in Figure 10. The proportions of sheep and goat showed drastic growth, while horse, cattle, and camel maintained a relatively stable trend in the total livestock number.
The numbers of sheep and goat continuously increased because of the encouragement of cashmere sales, except for the periods when zud (or extremely cold winter) occurred. In terms of pasture grazing patterns, active forager sheep and goat graze more intensively from top to the bottom, while horse, cattle, and camel consume the upper part of plants [55]. Additionally, for production-wise, an incentive system for the quality improvement of livestock output has not been introduced in the current marketplace [62]. Thus, for prevention of further grazing land BC loss, livestock management should take into account livestock reproduction rates with increasing livestock off-take product efficiency
b. Resting the affected areas by encouraging the long-distance movement of livestock
The Mongolian grazing land footprint increased and the BC decreased significantly, because of overgrazing. The local system and policies prevent the long distance movement and seasonal traveling of livestock. In fact, some sums (a district of a province) have disintegrated foraging lands that are impractical to use year around, which in turn intensifies overgrazing in certain areas [55]. The effect of continuous grazing is a substantial decrease in soil biological properties such as soil organic carbon (SOC) and soil nitrogen (N) [63,64], which controls the vegetation’s ability to recover and regenerate. To reduce the rate of grazing land degradation and to increase the frequency of pasture land rest, it is important to improve the herders’ access to participate in otor, which is the Mongolian herders’ traditional way of long-distance migration. As Xie and Li [65] illustrated, this practice has positive consequences on rangelands’ sustainability and on the livelihood of pasture.
To mitigate human-induced grassland degradation, numerous ecological restoration programs have been introduced in many countries [66,67]. Among these, China, notably, has implement several ecological restoration programs that have resulted in reduced grassland degradation and pastureland restoration [68,69,70], or presumably an increase in grazing land BC.
Key grassland ecosystem restoration programs include Returning Grazing Lands to Grassland (RGLG), the Green for Grain Project (GGP), the Ecological Subsidy and Award System (ESAS), and the Beijin–Tianjin Wind/Sandstorm Source Control (BTWSSC) project [71,72,73]. The projects’ implementation process includes moving families to another region with livelihood supports, resting the affected areas for a longer period, and compensating farmers or herders, by the government, for controlling the livestock populations. For instance, the RGLG programs have financed livestock herders who have changed their grazing land to grassland around the Hulun Buir area in 3–5 years, since 2000 [73]. In the Xilingol region and Loess Plateau, through the conservation program of GGP, herders have also transferred their land to grassland or have relocated their pasture land. Although these positive effects vary over location and environmental conditions, the project objectives were to restore grazing land BC. Following the implementation of vegetation protection policies, starting from 2000, there have been progressive effects on arid and semi-arid regions—Loess Plateau, Xilingol region, grassland of Hulun Buir, and Ordos, Inner Mongolian [74,75]. From the environmental perspective, these regions are similar to that of Mongolia’s; accordingly, comparable practices can be considered to have potential implications and effects in the improvement of Mongolian grazing land.

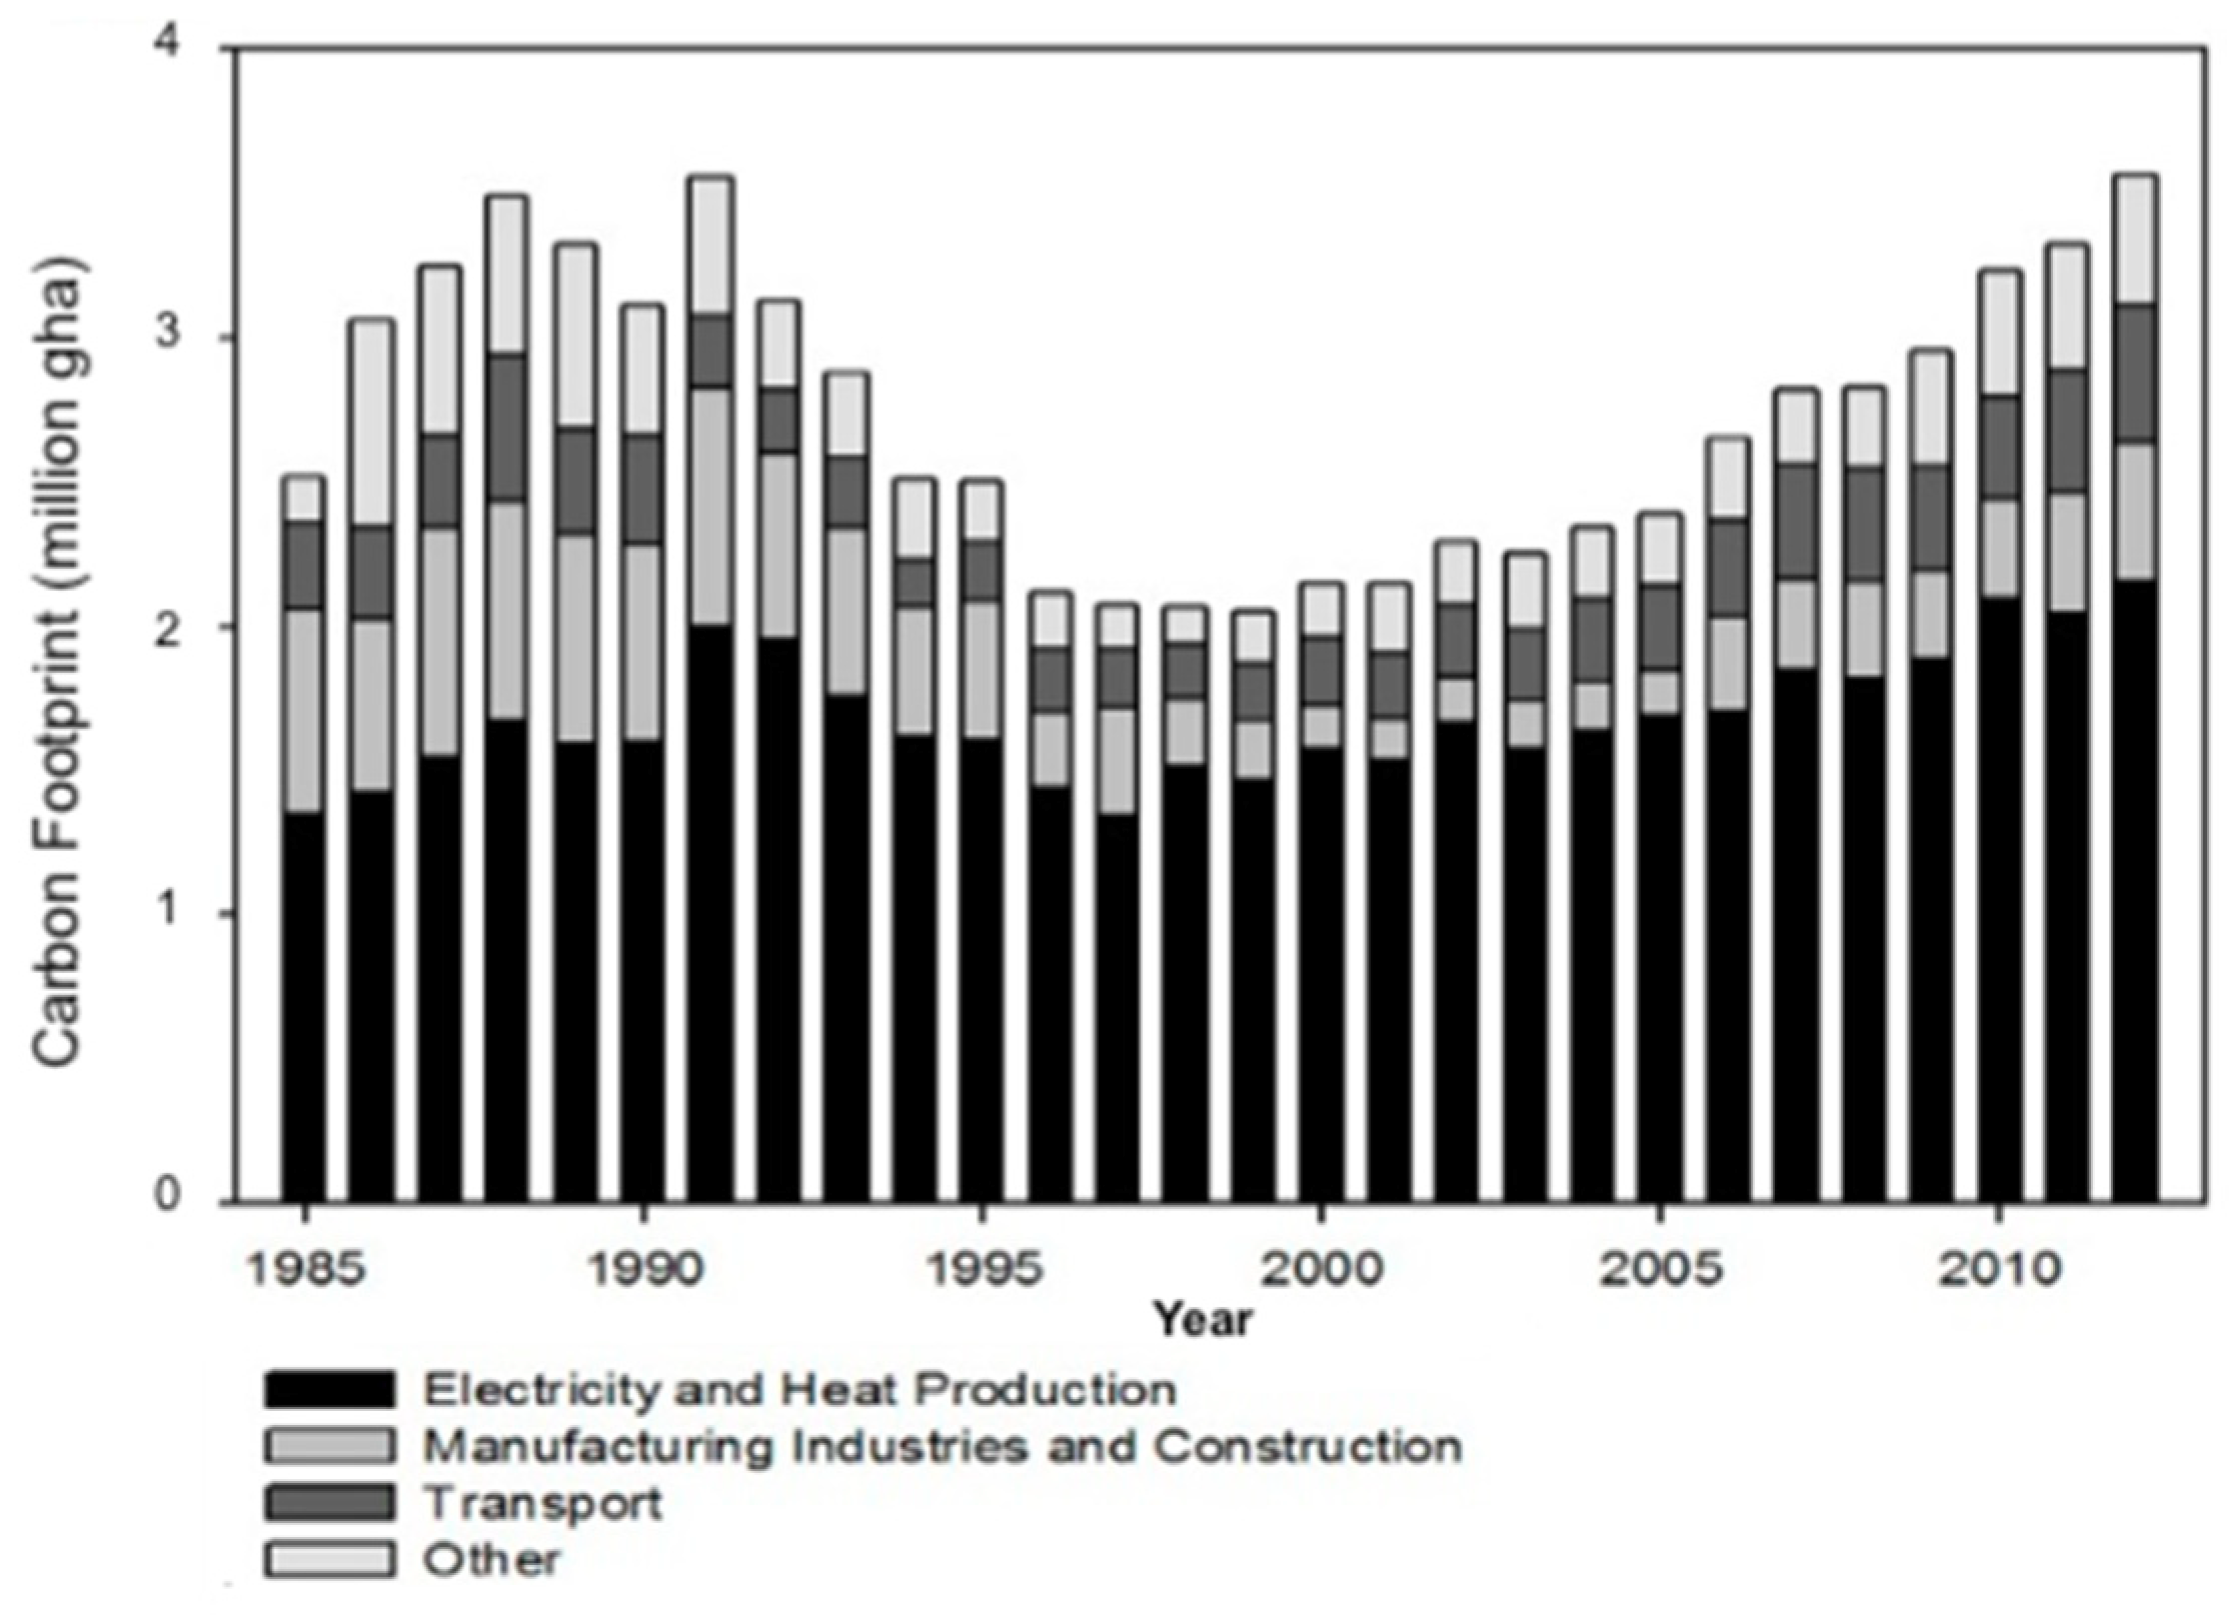
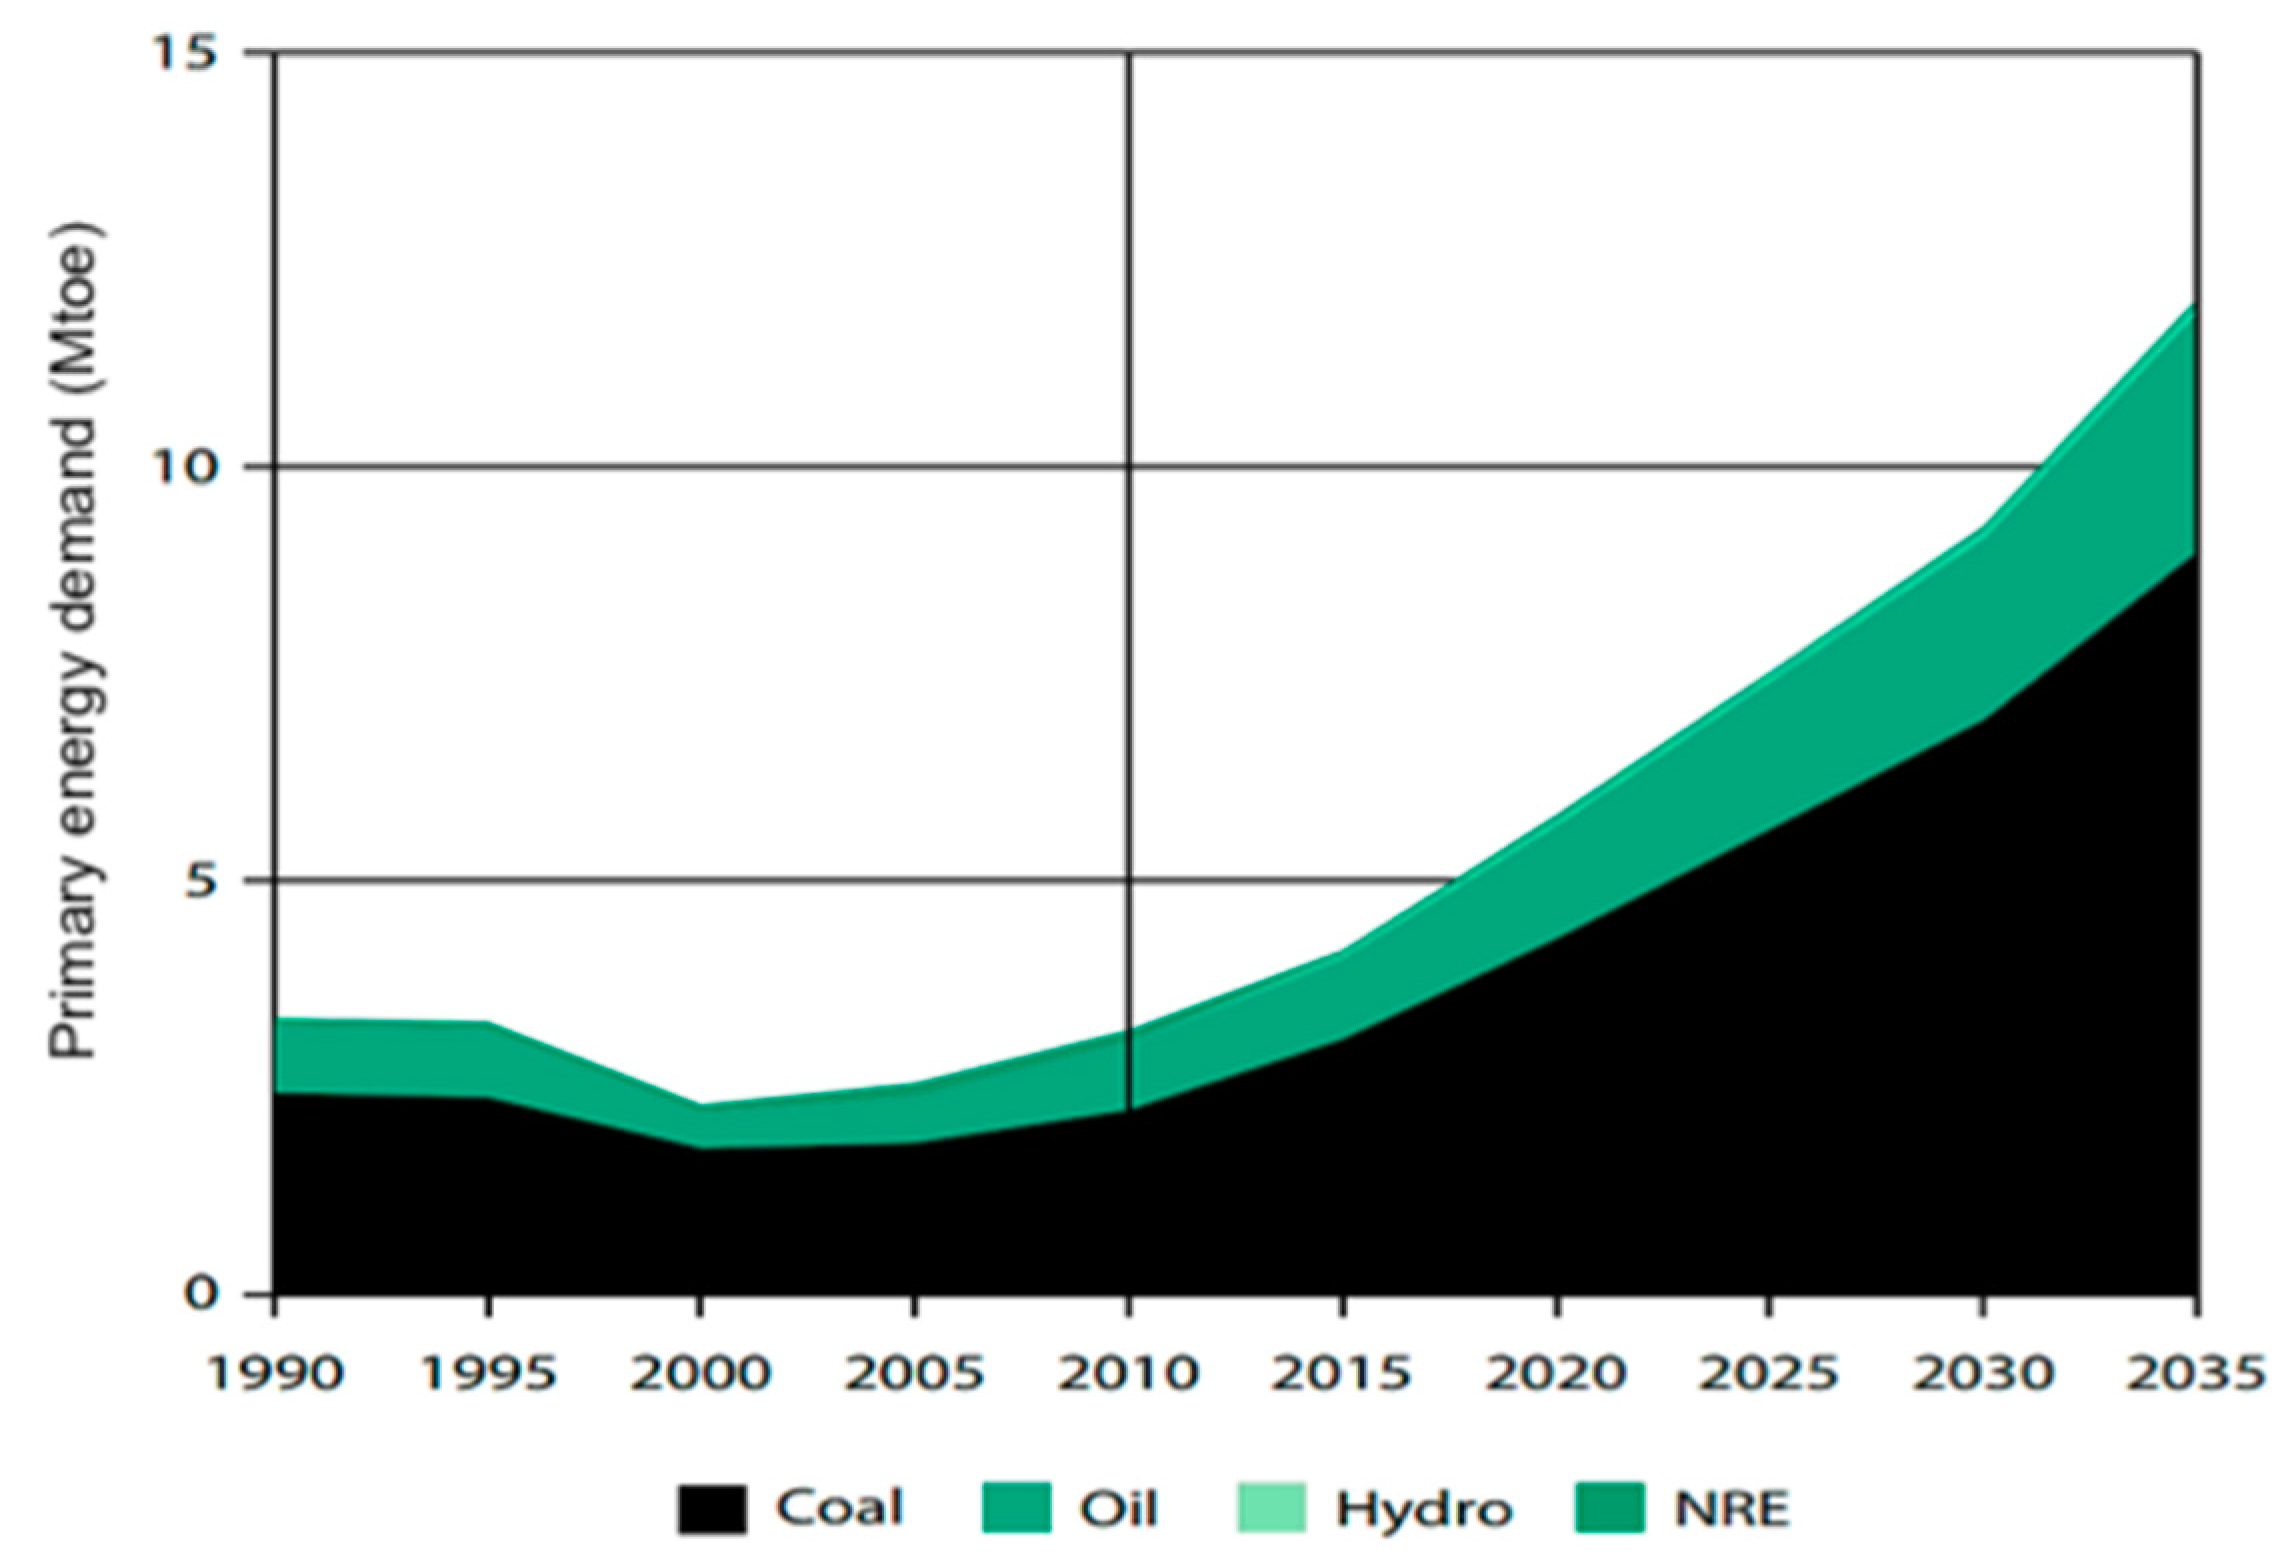
3.2.2. Carbon Footprint

More than an 80% share of the total primary energy supply in Mongolia comes from coal and oil, of which a majority goes to coal-based combined heat and power (CHP) plants [14]. Because of aging facilities and high internal electricity usage, the efficiency of the CHPs is low, between 20–44%. For instance, out of three coal-based CHP plants located in Ulaanbaatar, two CHPs have operated for more than 50 years without proper emission control devices, and the one, which has the highest capacity, CHP 4, has operated for more than 35 years [30] (see Table 3). Although other sources of energy, such as hydro, wind, and solar installments, have been introduced, their overall installed capacity in 2016 took around 4.2% of the total electricity generation, as shown in Table 4. Also, as shown in Table 4, the electricity output is increasing and the power demand is estimated to grow continuously [30]. To supply the Mongolia’s ever-increasing energy demand, efficient and sustainable energy development strategies ought to focus on rehabilitation in the current existing CHPs, as well as on intensive investment in renewable energy sources. Accordingly, the mitigation possibilities for the reduced the carbon Footprint can be grouped into (a) efficiency improvement in the existing system and (b) shifting to less carbon-intensive energy sources.
a. Improvements in the efficiency
The total current capacity of the installed CHP plants is 1031.8 MW, which is not sufficient to meet even the present demand in Mongolia. The electricity generation covers around 80% of the demand, and the remaining amount is purchased from Russia [30]. Because of various reasons, such as the low efficiencies of the boilers and steam generation, excessive internal heat and power consumption, and low condensate yield, the fuel utilization is inefficient, at 20–44% [76]. In comparison, a modern coal-fired CHP plant can achieve 50–80% fuel utilization efficiencies, depending on the technologies and heat load profiles [77]. Presently, supercritical and ultra-supercritical power plants are the option for a new CHP.
To introduce these technologies efficiently, building a new CHP plant at the existing site of an old and inefficient CHP is practical. The equipment in CHP Plant 2 and Plant 3 has been operating for over fifty years. The expected lifespan of CHP Plant 2 ended in 2005, and that of CHP Plant 3 ended in 2011 [30]. Therefore, using existing land and infrastructure, such as roads and water supply sources, is economically advantageous for building a new coal-fired CHP plant.
Another possible way is constructing a new CHP plant near the coal mine area of Baganuur, located approximately 120 km east of Ulaanbaatar. This option is intended to relocate the power plant from an urban area to a coal mine area, thus mitigating air pollution in urban areas and at the same time avoiding the long distance transportation of coal for heat and power generation.
b. Shift to less carbon-intensive energy sources
Encouraging the installment of low carbon emission energy sources can significantly reduce the carbon footprint. Renewable energy is a clean and economical competitor that can replace the existing power generation system [78], as the country is rich in solar and wind energy resources, because of geographical distinctiveness. The IEA has evaluated that Mongolia has the potential to generate around 2.6 million MW using renewables [79]. This potential power generation presents an opportunity to accelerate the overall economic activity, also it can play a major role in meeting the CO2 emission reduction targets set by the government.
Another less carbon-intensive energy source that is simultaneously applicable in Mongolia is to construct a facility that combusts waste to produce electricity. Currently, there is no waste incineration for generating power in Mongolia. According to the Japan International Cooperation Agency (JICA) [80], more than 90% of Ulaanbaatar’s waste goes to the Ulaan Chuluut disposal site. Based on the assumption that the rate of waste generation will intensify in proportion to the population growth rate and increase in GDP, the study evaluated the total aggregated municipal solid waste (MSW) in the year 2020. The estimation showed that 79.8% of MSW generated in the summer and 56.4% of MSW generated in the winter was combustibles, and the rest consisted of non-combustibles and ash. Thus, there is a room for obtaining energy by waste incineration.

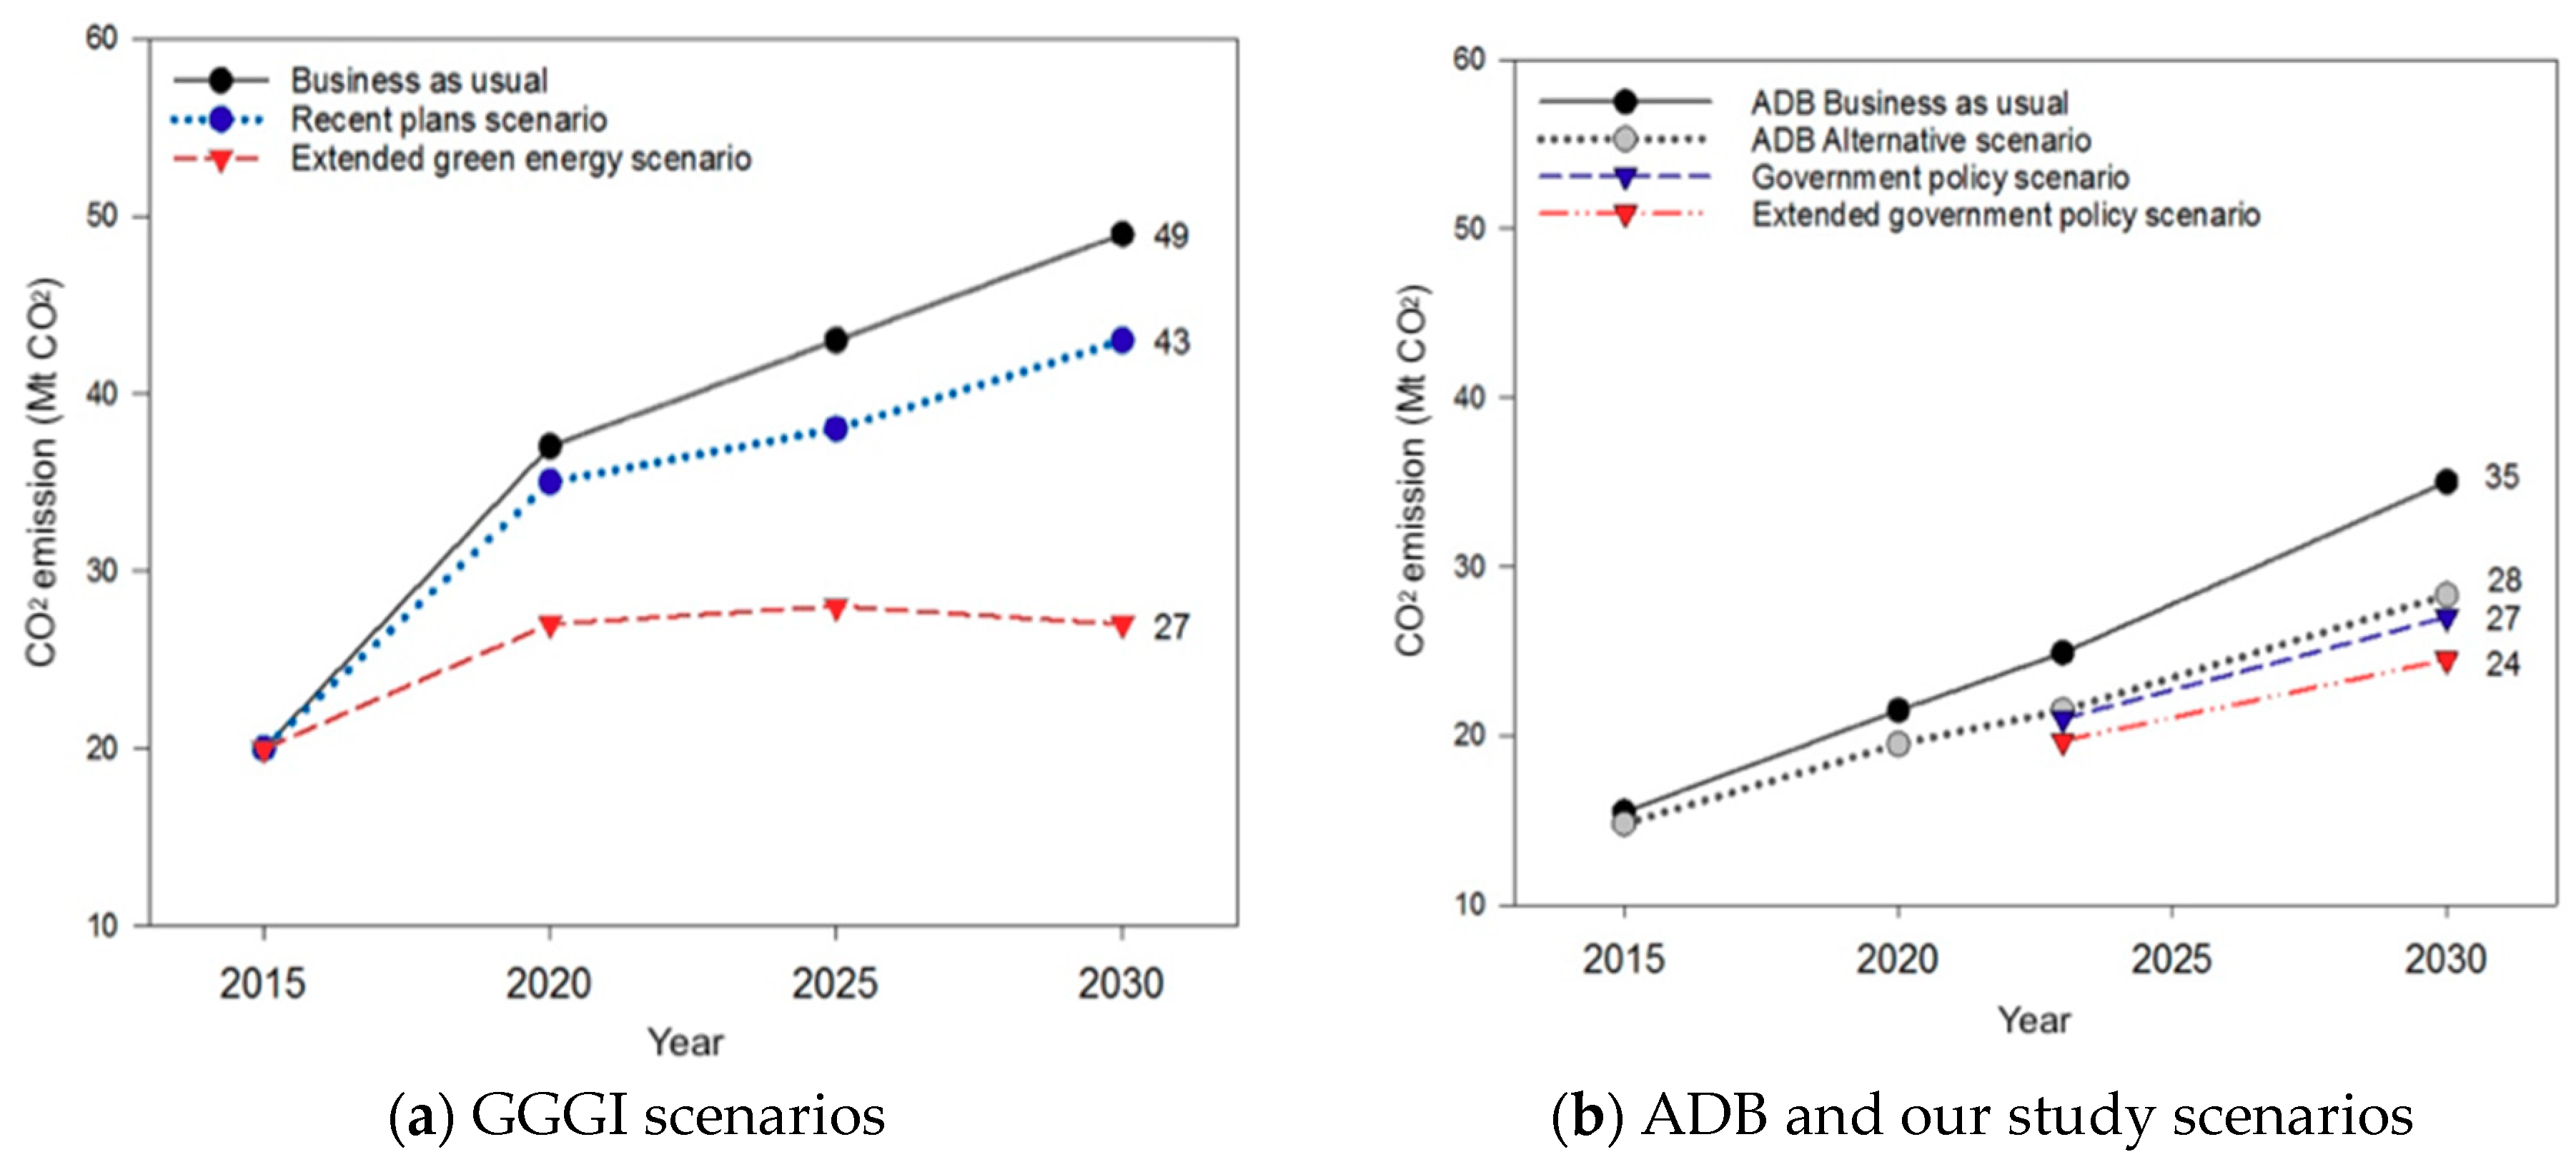
3.2.3. Estimation of the Carbon Dioxide Reduction by Options

In this study, the CO2 emission level in Mongolia was predicted based on existing scenarios, such as the Asian Development Bank (ADB) study [32] and the Mongolian government’s goal [15], and was compared with the Global Green Growth Institute (GGGI) study result [31].
The GGGI used the Long-range Energy Alternatives Planning (LEAP), a software tool developed by the Stockholm Environment Institute, to analyze the low emission strategy developments in Mongolia between 2010–2035 [31]. Assuming that there will be a rapid increase in the industrial sector, and based on the same economic and population growth rate calculation, the GGGI presented three scenarios, the reference or the business as usual (BAU) scenario, a scenario implementing recent plans by the government on energy usage, and the one with extended green energy policies beyond the government’s plans. For comparison purpose, three scenarios’ outcomes from the year 2015 to 2030 on the CO2 emission amount are shown in Figure 11a, where the estimated amount of 20 Mt CO2 emission in 2015 is projected to rise to 49Mt CO2 for BAU, 43Mt CO2 for the recent plans scenario, and 27Mt CO2 for the extended green energy scenario in year 2030.
ADB’s BAU case presents an outlook on coal usage using existing level of technology applications, while the alternative case assumes the use of advanced thermal technologies. Two cases’ outcomes from the year 2015 to 2030 on the CO2 emission amount are shown in Figure 11b [32].
The government of Mongolia has announced a two-phase renewable energy target to expand the efficiency of energy use. The aim is increasing renewables as a portion of total electricity generation capacity up to 20% and decrease building heating loss 20% by 2023, and to further increase the renewables to 30% and the heating loss 40% by 2030 [15].
If the government’s renewable energy target is included to the ADB’s alternative scenario (i.e., a part of electricity supply from CHPs is replaced by renewables), the total coal usage can be effectively decreased, resulting in a proportionate decrease in the primary energy demand. Two scenarios were developed in this study, the Government Policy Scenario (GPS) and the Extended Government Policy Scenario (EGPS).
In the GPS, the government of Mongolia’s goal of replacing 20% of the electricity production in 2023 and 30% of the electricity production in 2030 using renewable energy, was used as the guideline. The CO2 emissions are estimated to drop by 16% in 2023 and 22.9% in 2030, compared to the baseline ADB BAU case. The EGPS is built on the previous scenario and assumes that the same amount of heat generation is also replaced by the power of renewable energies. From the outcome it can be seen that, compared to the ADB BAU case, the CO2 emissions will be reduced by 21% in 2023 and 31.4% in 2030 by cutting 5.2 Mt CO2 and 11 Mt CO2, respectively. In Figure 11b, these results are summarized, and it is found that the ambitious proposal is useful in creating a broader consensus, as the technology advancement is exponentially growing.

4. Conclusions

Mongolia is experiencing drastic development and urbanization, and is facing challenges to address its sustainability. With the help of the EF analysis, regardless of the limitations, a general view on how the environmental resources are utilized by Mongolia is projected. This is the first study on the characteristic of environmental problems in Mongolia using EF, and can be a starting point to further analyzing the environmental problems in more detail.
The study shows the overall EF of the productive lands enlarged more than double in Mongolia between 1961–2012. The grazing land footprint and the carbon footprint made up 63.5% and 26.6% of the total EF in 2012, respectively. The sum of the cropland, the forest land, the fishing ground, and the built-up land footprints accounted for the remaining 9.9% of the total EF in the same year. The growth in the grazing land footprint in the last two decades indicates that the ecological-based manufacturing and consumption impact has intensified. Also, the rising trend of the carbon footprint implies that the overall energy consumption has increased and the further demand is expected to intensify. Correspondingly, the total BC has been declining and will gradually aggravate and reach the ecological deficit, in some cases not reducing the vulnerability of the socio-economic factors.
To improve the situation, for sustainable grazing land practice, management decisions should consider reducing the rate of grazing land degradation by advancing the current regulatory system. For reducing the amount of area needed to absorb the CO2 emission (or carbon uptake land footprint) generated from fossil fuel combustion, especially, the coal-based CHPs, options are advancing in the current technological utilization, and there are increasing new power supplies such as wind and solar energy. The amount of CO2 emissions decreased by 22.9% and 31.4% in the GPS and EGPS mitigation scenarios, respectively, compared to the baseline ADB BAU scenario in 2030.
To accomplish these policy directions, it is vital to develop a long-term plan by the Mongolian government. To do that, it is essential for the Mongolian government to cooperate with international organization such as ADB, who have an intensive data base and knowledge on policy development.

Author Contributions

E.V. prepared the original draft, developed the methodology, and visualized the results. M.J.Y. conceptualized the framework of the article, developed the methodology, reviewed the paper, and set directions for the revision. Y.P.K. conceptualized the framework of the article, prepared the original draft, reviewed the paper, and supervised the team. All of the authors read, revised, and approved the manuscript.

Funding

This work was supported by the National Research Foundation of Korea (NRF) grant, funded by the Korea government; the Ministry of Science, ICT, and Future Planning (MSIP) (NRF-2017R1A2B4006760); and the Ministry of Education (MOE) (NRF-2017R1A6A3A11029726).

Acknowledgments

One of the authors (Volodya, E.) is grateful to the EGPP scholarship from Ewha Womans University. All of the authors would like to thank to the editor and the anonymous reviewers for their valuable comments and suggestions on the manuscript.

Conflicts of Interest

The authors declare no conflict of interest.

References

  1. Dugarsuren, N.; Lin, C.; Tsogt, K. Land Cover Change Detection in Mongolia in Last Decade Using MODIS Imagery. In Proceedings of the Asian Conference on Remote Sensing, Taipei, Taiwan, 3–7 October 2011. [Google Scholar]
  2. National Statistical Office of Mongolia (NSO). Statistics on Population. Available online: http://www.1212.mn/statHtml/statHtml.do?orgId=976&tblId=DT_NSO_0300_003V1&conn_path=I2 (accessed on 30 September 2018). (In Mongolian).
  3. Lecraw, D.J.; Eddleston, P.; McMahon, A. A Value Chain Analysis of the Mongolian Cashmere Industry; Economic Policy Reform Competitiveness Project; United States Agency for International Development (USAID): Ulaanbaatar, Mongolia, 2005. [Google Scholar]
  4. Zhang, Y.; Nie, F.; Jiang, S.; Hu, P. Discovery of the Oyu Tolgoi copper-gold deposit in the Sino-Mongolia border region and its significance for mineral exploration. Reg. Geol. China 2003, 9, 14. [Google Scholar]
  5. World Bank. Country Profile for Mongolia. Available online: https://data.worldbank.org/country/mongolia (accessed on 30 September 2018).
  6. Noy-Meir, E. Desert ecosystems: Environment and producers. Annu. Rev. Ecol. Syst. 1973, 4, 23–51. [Google Scholar] [CrossRef]
  7. Batima, P.; Dagvadorj, P. Climate Change and Its Impacts in Mongolia; JEMR Publishing: Ulaanbaatar, Mongolia, 2000. [Google Scholar]
  8. Reynolds, J.F.; Stafford Smith, D.M.; Lambin, E.F.; Turner, B.L.; Mortimore, M.; Batterbury, S.P.J.; Downing, T.E.; Dowlatabadi, H.; Fernández, R.J.; Herrick, J.E.; et al. Ecology: Global desertification: Building a science for dryland development. Science 2007, 316, 847–851. [Google Scholar] [CrossRef] [PubMed]
  9. Convention on Biological Diversity (CBD). The Fifth National Report of Mongolia; Steppe Forward Programme in National University of Mongolia and Ministry of Environment and Green Development: Ulaanbaatar, Mongolia, 2014. [Google Scholar]
  10. Tortell, P.; Borjigdkhan, A.; Naidansuren, E. Institutional Structures for Environmental Management in Mongolia; Project MON/07/104; UNDP: Ulaanbaatar, Mongolia; Wellington, New Zealand, 2008. [Google Scholar]
  11. National Statistical Office of Mongolia (NSO). Mongolian Statistical Yearbook 2011; National Scientific Office of Mongolia: Ulaanbaatar, Mongolia, 2012. [Google Scholar]
  12. Guttikunda, S. Urban Air Pollution Analysis for Ulaanbaatar; World Bank Consultant Report; World Bank: Washington, DC, USA, 2007. [Google Scholar]
  13. Guttikunda, S.; Lodoysamba, S.; Bulgansaikhan, B.; Dashdondog, B. Particulate pollution in Ulaanbaatar, Mongolia. Air Qual. Atmos. Health 2013, 6, 589–601. [Google Scholar] [CrossRef]
  14. International Energy Agency (IEA). Coal Statistics for 2015. Available online: https://www.iea.org/sankey/#?c=Mongolia&s=Balance (accessed on 15 May 2018).
  15. Intended Nationally Determined Contribution (INDC). Submission by Mongolia to the Ad-Hoc Working Group on the Durban Platform for Enhanced Action, UNFCCC; INDC: Ulaanbaatar, Mongolia, 2014. [Google Scholar]
  16. Odum, H.T. Scales of ecological engineering. Ecol. Eng. 1996, 6, 7–19. [Google Scholar] [CrossRef]
  17. Odum, H.T.; Odum, B. Concepts and methods of ecological engineering. Ecol. Eng. 2003, 20, 339–361. [Google Scholar] [CrossRef]
  18. Kennedy, C.; Steinberger, J.; Gasson, B.; Hansen, Y.; Hillman, T.; Havranek, M.; Pataki, D.; Phdungsilp, A.; Ramaswami, A.; Mendez, G.V. Methodology for inventorying greenhouse gas emissions from global cities. Energy Policy 2010, 38, 4828–4837. [Google Scholar] [CrossRef]
  19. Wackernagel, M.; Onisto, L.; Bello, P.; Linares, A.C.; Falfán, I.S.L.; García, J.M.; Guerrero, A.I.S.; Guerrero, M.G.S. National natural capital accounting with the ecological footprint concept. Ecol. Econ. 1999, 29, 375–390. [Google Scholar] [CrossRef]
  20. Jarvis, P. Never mind the footprint, get the mass right. Nature 2007, 446, 24. [Google Scholar] [CrossRef] [PubMed]
  21. Wackernagel, M.; Rees, W.E. Our Ecological Footprint: Reducing Human Impact on the Earth; New Society Publishers: Gabriola Island, BC, Canada, 1996. [Google Scholar]
  22. Monfreda, C.; Wackernagel, M.; Deumling, D. Establishing national natural capital accounts based on detailed ecological footprint and biological capacity accounts. Land Use Policy 2004, 21, 231–246. [Google Scholar] [CrossRef]
  23. Wackernagel, M.; Kitzes, J.; Moran, D.; Goldfinger, S.; Thomas, M. The ecological footprint of cities and regions: Comparing resource availability with resource demand. Environ. Urban. 2006, 18, 103–112. [Google Scholar] [CrossRef]
  24. Borucke, M.; Moore, D.; Cranston, G.; Gracey, K.; Iha, K.; Larson, J.; Lazarus, E.; Morales, J.C.; Wackernagel, M.; Galli, A. Accounting for demand and supply of the biosphere’s regenerative capacity: The National Footprint Accounts’ underlying methodology and framework. Ecol. Indic. 2013, 24, 518–533. [Google Scholar] [CrossRef]
  25. Global Footprint Network (GFN). National Footprint Accounts; Global Footprint Network: Oakland, CA, USA, 2016. [Google Scholar]
  26. Lin, D.; Hanscom, L.; Martindill, J.; Borucke, M.; Cohen, L.; Galli, A.; Lazarus, E.; Zokai, G.; Iha, K.; Eaton, D.; et al. Working Guidebook to the National Footprint Accounts: 2016 Edition; Global Footprint Network: Oakland, CA, USA, 2016. [Google Scholar]
  27. Galli, A.; Wiedmann, T.; Ercin, E.; Knoblauch, D.; Ewing, B.; Giljum, S. Integrating Ecological, Carbon and Water footprint into a “Footprint Family” of indicators: Definition and role in tracking human pressure on the planet. Ecol. Indic. 2012, 16, 100–112. [Google Scholar] [CrossRef]
  28. Mancini, S.M.; Galli, A.; Niccolucci, V.; Lin, D.; Bastianoni, S.; Wackernagel, M.; Marchettini, N. Ecological Footprint: Refining the carbon Footprint calculation. Ecol. Indic. 2016, 61, 390–403. [Google Scholar] [CrossRef]
  29. National Statistical Office of Mongolia (NSO). Statistics on Livestock Population. Available online: http://www.1212.mn/statHtml/statHtml.do?orgId=976&tblId=DT_NSO_1001_005V1&conn_path=I2 (accessed on 9 April 2018). (In Mongolian).
  30. Ministry of Energy. Statistics Book; Ministry of Energy: Ulaanbaatar, Mongolia, 2017. (In Mongolian) [Google Scholar]
  31. Global Green Growth Institute (GGGI). Strategies for Development of Green Energy Systems in Mongolia; Final Report; GGGI: Ulaanbaatar, Mongolia, 2014. [Google Scholar]
  32. Asian Development Bank (ADB). Energy Outlook for Asia and the Pacific; Asian Development Bank: Mandaluyong, Philippines, 2015. [Google Scholar]
  33. Intergovernmental Panel on Climate Change (IPCC). 2006 IPCC Guidelines for National Greenhouse Gas Inventories; Prepared by the National Greenhouse Gas Inventories Programme; Eggleston, H.S., Buendia, L., Miwa, K., Ngara, T., Tanabe, K., Eds.; IGES: Kanagawa Prefecture, Japan, 2006; Volume 3. [Google Scholar]
  34. John, R.; Chen, J.Q.; Kim, Y.; Ou-yang, Z.T.; Xiao, J.F.; Park, H.; Shao, C.; Zhang, Y.; Amarjargal, A.; Batkhishig, O.; et al. Differentiating anthropogenic modification and precipitation-driven change on vegetation productivity on the Mongolian Plateau. Landsc. Ecol. 2016, 31, 547–566. [Google Scholar] [CrossRef]
  35. Lise, W.; Hess, S.; Purev, B. Pastureland degradation and poverty among herders in Mongolia: Data analysis and game estimation. Ecol. Econ. 2006, 58, 350–364. [Google Scholar] [CrossRef] [Green Version]
  36. Hilker, T.; Natsagdorj, E.; Waring, R.H.; Lyapustin, A.; Wang, Y.J. Satellite observed widespread decline in Mongolian grasslands largely due to overgrazing. Glob. Chang. Biol. 2014, 20, 418–428. [Google Scholar] [CrossRef] [PubMed]
  37. Asian Development Bank (ADB). Making Grasslands Sustainable in Mongolia: Adapting to Climate and Environmental Change; Asian Development Bank: Mandaluyong, Philippines, 2013. [Google Scholar]
  38. Rao, M.P.; Davi, N.K.; D’Arrigo, R.D.; Skees, J.; Nachin, B.; Leland, C.; Lyon, B.; Wang, S.Y.; Byambasuren, O. Dzuds, droughts, and livestock mortality in Mongolia. Environ. Res. Lett. 2015, 10, 7. [Google Scholar] [CrossRef]
  39. Janzen, J. Mobile livestock-keeping in Mongolia: Present problems, spatial organization, interactions between mobile and sedentary population groups and perspectives for pastoral development. Senri Ethnol. Stud. 2005, 69, 69–97. [Google Scholar]
  40. Liu, Y.Y.; Evans, J.P.; McCabe, M.F.; de Jeu, R.A.M.; van Dijk, A.; Dolman, A.J.; Saizen, I. Changing climate and overgrazing are decimating Mongolian steppes. Changing climate and overgrazing are decimating Mongolian steppes. PLoS ONE 2013.
  41. Fratkin, E.; Mearns, R. Sustainability and pastoral livelihoods: Lessons from East African Maasai and Mongolia. Hum. Organ. 2003, 62, 112–122. [Google Scholar] [CrossRef]
  42. Sternberg, T. Unravelling Mongolia’s extreme winter disaster of 2010. Nomadic Peoples 2010, 14, 72–86. [Google Scholar] [CrossRef]
  43. Fensham, R.J. Grassy vegetation of the Darling Downs, southeastern Queensland, Australia: Floristics and grazing effects. Biol. Conserv. 1998, 84, 301–310. [Google Scholar] [CrossRef]
  44. Bertiller, M.B. Grazing effects on sustainable semiarid rangelands in Patagonia: The state and dynamics of the soil seed bank. Environ. Manag. 1996, 20, 123–132. [Google Scholar] [CrossRef]
  45. Zhou, X.; Yamaguchi, Y.; Arjasakusuma, S. Distinguishing the vegetation dynamics induced by anthropogenic factors using vegetation optical depth and AVHRR NDVI: A cross-border study on the Mongolian Plateau. Sci. Total Environ. 2018, 617, 730–743. [Google Scholar] [CrossRef] [PubMed]
  46. Wiedmann, T.; Minx, J. A definition of ‘carbon footprint’. Ecol. Econ. Res. Trends 2008, 1, 1–11. [Google Scholar]
  47. Dorj, T.; Yavuuhulan, D. Mongolian economic development strategy. Int. J. Asian Manag. 2003, 2, 93–98. [Google Scholar] [CrossRef]
  48. Griffin, K. Poverty and Transition to a Market Economy in Mongolia; Springer: New York, NY, USA, 1995. [Google Scholar]
  49. MRPAM (Mineral Resources and Petroleum Authority of Mongolia). Sustainable Artisanal Mining’ Internal Project Document; MRPAM: Ulaanbaatar, Mongolia, 2008. [Google Scholar]
  50. WWF (World Wild Fund). Living Planet Report 2016. Risk and Resilience in a New Era; WWF International: Gland, Switzerland, 2016. [Google Scholar]
  51. Huang, L. Exploring the Strengths and Limits of Strong and Weak Sustainability Indicators: A Case Study of the Assessment of China’s Megacities with EF and GPI. Sustainability 2018, 10, 349. [Google Scholar] [CrossRef]
  52. Erb, K.H. Actual land demand of Austria 1926–2000: A variation on Ecological Footprint assessment. Land Use Policy 2004, 21, 247–259. [Google Scholar] [CrossRef]
  53. Venetoulis, J.; Talberth, J. Refining the ecological footprint. Environ. Dev. Sustain. 2008, 10, 441–469. [Google Scholar] [CrossRef]
  54. Duro, J.A.; Teixido-Figueras, J. Ecological footprint inequality across countries: The role of environment intensity, income and interaction effects. Ecol. Econ. 2013, 93, 34–41. [Google Scholar] [CrossRef] [Green Version]
  55. MARCC (Mongolian Second Assessment Report on Climate Change). Ministry of Environment, Nature and Tourism; MARCC: Ulaanbaatar, Mongolia, 2014. [Google Scholar]
  56. Bai, Y.; Wu, J.; Xing, Q.; Pan, Q.; Huang, J.; Yang, D.; Han, X. Primary production and rain use efficiency across a precipitation gradient on the Mongolia Plateau. Ecology 2008, 89, 2140–2153. [Google Scholar] [CrossRef] [PubMed]
  57. Shimada, S.; Matsumoto, J.; Sekiyama, A.; Aosier, B.; Yokohana, M. A new spectral index to detect Poaceae grass abundance in Mongolian grasslands. Adv. Space Res. 2012, 50, 1266–1273. [Google Scholar] [CrossRef]
  58. Sheehy, D. Grazing management strategies as a factor influencing ecological stability of Mongolian grasslands. Nomadic Peoples 1993, 33, 17–30. [Google Scholar]
  59. Li, A.; Wu, J.; Huang, J. Distinguishing between human-induced and climate-driven vegetation changes: A critical application of RESTREND in Inner Mongolia. Landsc. Ecol. 2012, 27, 969–982. [Google Scholar] [CrossRef]
  60. Wessels, K.J.; Prince, S.D.; Malherbe, J.; Small, J.; Frost, P.E.; Van Zyl, D. Can human-induced land degradation be distinguished from the effects of rainfall variability? A case study in South Africa. J. Arid Environ. 2007, 68, 271–297. [Google Scholar] [CrossRef]
  61. Yang, Y.; Wang, Z.; Li, J.; Gang, C.; Zhang, Y.; Zhang, Y.; Odeh, I.; Qi, J. Comparative assessment of grassland degradation dynamics in response to climate variation and human activities in China, Mongolia, Pakistan and Uzbekistan from 2000 to 2013. J. Arid Environ. 2016, 135, 164–172. [Google Scholar] [CrossRef]
  62. Ykhanbai, H.; Bulgan, E.; Beket, U.; Vernooy, R.; Graham, J. Reversing grassland degradation and improving herders’ livelihoods in the Altai Mountains of Mongolia. Mt. Res. Dev. 2004, 24, 96–100. [Google Scholar] [CrossRef]
  63. Su, Y.-Z.; Li, Y.-L.; Cui, J.-Y.; Zhao, W.-Z. Influences of continuous grazing and livestock exclusion on soil properties in a degraded sandy grassland, Inner Mongolia, northern China. Catena 2005, 59, 267–278. [Google Scholar]
  64. Liebig, M.A.; Gross, J.R.; Kronberg, S.L.; Hanson, J.D.; Frank, A.B.; Phillips, R.L. Soil response to long-term grazing in the northern Great Plains of North America. Agric. Ecosyst. Environ. 2006, 115, 270–276. [Google Scholar] [CrossRef]
  65. Xie, Y.; Li, W. Why do herders insist on “Otor?” Maintaining Mobility in Inner Mongolia. Nomadic Peoples 2008, 12, 35–52. [Google Scholar] [CrossRef]
  66. Doren, R.F.; Trexler, J.C.; Gottlieb, A.D.; Harwell, M.C. Ecological indicators for system-wide assessment of the greater everglades ecosystem restoration program. Ecol. Indic. 2009, 9, S2–S16. [Google Scholar] [CrossRef]
  67. Petursdottir, T.; Arnalds, O.; Baker, S.; Montanarella, L.; Aradottir, A.L. A social-ecological system approach to analyze stakeholders’ interactions within a large-scale rangeland restoration program. Ecol. Soc. 2013.
  68. Cao, S.X. Impact of China’s large-scale ecological restoration program on the environment and society in arid and semiarid areas of China: Achievements, problems, synthesis, and applications. Crit. Rev. Environ. Sci. Technol. 2011, 41, 317–335. [Google Scholar] [CrossRef]
  69. Fan, J.W.; Shao, Q.Q.; Liu, J.Y.; Wang, J.B.; Harris, W.; Chen, Z.Q.; Zhong, H.P.; Xu, X.L.; Liu, R.G. Assessment of effects of climate change and grazing activity on grassland yield in the Three Rivers Headwaters Region of Qinghai–Tibet Plateau, China. Environ. Monit. Assess. 2010, 170, 571–584. [Google Scholar] [CrossRef] [PubMed]
  70. Chen, B.X.; Zhang, X.Z.; Tao, J.; Wu, J.S.; Wang, J.S.; Shi, P.L.; Zhang, Y.J.; Yu, C.Q. The impact of climate change and anthropogenic activities on alpine grassland over the Qinghai-Tibet Plateau. Agric. For. Meteorol. 2014, 189, 11–18. [Google Scholar] [CrossRef]
  71. Zhang, J.; Niu, J.M.; Bao, T.; Buyantuyev, A.; Zhang, O.; Dong, J.J.; Zhang, X.F. Human induced dryland degradation in Ordos Plateau, China, revealed by multilevel statistical modeling of normalized difference vegetation index and rainfall time-series. J. Arid Land 2014, 6, 219–229. [Google Scholar] [CrossRef]
  72. Cao, S.; Xu, C.; Chen, L.; Wang, X. Attitudes of farmers in China’s northern Shaanxi Province towards the land-use changes required under the Grain for Green Project, and implications for the program’s success. Land Use Policy 2009, 26, 1182–1194. [Google Scholar] [CrossRef]
  73. Cai, H.Y.; Yang, X.H.; Xu, X.L. Human-induced grassland degradation/restoration in the central Tibetan Plateau: The effects of ecological protection and restoration projects. Ecol. Eng. 2015, 83, 112–119. [Google Scholar] [CrossRef] [Green Version]
  74. Gang, C.; Zhao, W.; Zhao, T.; Zhang, Y.; Gao, X.; Wen, Z. The impacts of land conversion and management measures on the grassland net primary productivity over the Loess Plateau, Northern China. Sci. Total Environ. 2018, 645, 827–836. [Google Scholar] [CrossRef] [PubMed]
  75. Huang, L.; Xiao, T.; Zhao, Z.; Sun, C.; Liu, J.Y.; Shao, Q.; Fan, J.G.; Wang, J.W. Effects of grassland restoration programs on ecosystems in arid and semiarid China. J. Environ. Manag. 2013, 117, 268–275. [Google Scholar] [CrossRef] [PubMed]
  76. JBIC (Japan Bank for International Cooperation). Feasibility Study on a Thermal Power Plant for Oyu Tolgoi Copper/Gold Mine Project; Japan Bank for International Cooperation: Tokyo, Japan, 2006. [Google Scholar]
  77. IEA (International Energy Agency). Technology Roadmap: High-Efficiency, Low-Emissions Coal-Fired Power Generation; OECD/IEA: Paris, France, 2012. [Google Scholar]
  78. IRENA (International Renewable Energy Agency). Renewable Power Generation Costs in 2014: An Overview; IRENA: Bonn, Germany, 2015. [Google Scholar]
  79. Minchener, A. Energy Issues for Mongolia; International Energy Agency Clean Coal Centre: London, UK, 2013. [Google Scholar]
  80. JICA (Japan International Cooperation Agency). The Study on Solid Waste Management Plan for Ulaanbaatar City in Mongolia, Summary: Final Report; JICA: Tokyo, Japan, 2007. [Google Scholar]
Figure 1. Research framework: three steps of content analysis. EF—Ecological Footprint; BC—Biological capacity.
Sustainability 10 04026 g001
Figure 2. Trend of the total ecological footprint, the total biocapacity, and the population change in Mongolia during 1961–2012. Data sources: Global Footprint Network (GFN) 2016 [25], and National Statistical Office of Mongolia (NSO) 2017 [2].
Sustainability 10 04026 g002
Figure 3. Trends of the ecological footprint by land type in Mongolia during 1961–2012. Data source: GFN 2016 [25].
Sustainability 10 04026 g003
Figure 4. Grazing land footprint, grazing land BC, and livestock population fluctuations in Mongolia between 1961–2012. Data source: GFN 2016 [25] and NSO 2017 [29].
Sustainability 10 04026 g004
Figure 5. Formation of the carbon footprint by source in Mongolia between 1985–2012. Data source: GFN 2016 [25].
Sustainability 10 04026 g005
Figure 6. Coal and oil estimated primary energy demand in Mongolia between 1990–2035. Data source: Asian Development Bank (ADB) 2013 [32].
Sustainability 10 04026 g006
Figure 7. Gross domestic product (GDP) (per/capita US $) and the carbon footprint (gha) increase in Mongolia between 1981–2012. Data source: World Bank 2017 [5] and GFN 2016 [25].
Sustainability 10 04026 g007
Figure 8. Grazing land footprint (GF) ratio, carbon footprint ratio (CF), and EF/BC ratio in Mongolia between 1961–2012. The EF/BC ratio expanded from 0.26 in 2005 to 0.37 in 2012. Data source: GFN 2016 [25].
Sustainability 10 04026 g008
Figure 9. Ecological deficit trend in Mongolia, starting from 1960 and reaching overshoot in 2083.
Sustainability 10 04026 g009
Figure 10. Livestock population trends in Mongolia between 1970–2016. Data source: NSO 2017 [29].
Sustainability 10 04026 g010
Figure 11. Comparison of estimated CO2 emission from the power plants. (a) The Global Green Growth Institute (GGGI) study on three different emission scenario results from 2015 to 2030 [31]. (b) ADB analysis on two emission scenarios from 2015 to 2030 [32] and our proposed two emission scenarios based on the government policy from 2023 to 2030.
Sustainability 10 04026 g011
Table 1. Data and materials used in this study.
DataSource
(1)
Ecological Footprints and Biocapacity
-
Cropland
-
Grazing land
-
Forest land
-
Fishing ground
-
Built-up land
-
Carbon uptake land
Used Mongolian data between 1961–2012, provided by the Global National Footprint [25].
(2)
Estimation of the ecological deficit point
Calculated based on the total ecological footprint and the total biocapacity data between 1961–2012, provided by the Global Footprint Network [25].
(3)
Mongolian population and population per/capita (US$)
Used the National Statistics Office data in 2017 [2] and the World Bank statistics data on Mongolia in 2018 [5].
(4)
Livestock population
Used the data presented in the National Statics Office in 2017 [29].
(5)
Electricity generation from coal-fired power plants between 2012–2016
Referred to the annual statistics book published by the Ministry of Energy in 2017 [30].
(6)
CO2 mitigation target levels and policy measurements for 2023 and 2030
Referred to the Intended Nationally Determined Contributions submitted by Mongolia to the United Nations Framework Convention on Climate Change (UNFCCC) [15].
(7)
Estimation of CO2 reduction options
  • Long-range Energy Alternatives Planning (LEAP) program-based power plants’ CO2 emission scenarios between 2015–2035
  • ADB study on CO2 emission mitigation scenarios 2015–2035
  • Our scenarios based on (6) on the government CO2 mitigation targets for 2023 and 2030
Referred to the Strategies for Development of Green Energy Systems in Mongolia, presented by the Global Green Growth Institute in 2014 [31].
Referred to the Mongolian emission scenarios of the Energy Outlook for Asia and the Pacific, published by the Asian Development Bank (ADB) in 2015 [32].
Calculated assuming the ADB scenarios as base lines [32]. After applying the government measures and extended scenario measures, the reduced coal usage amount was converted to the CO2 emission scenarios, using default emission factors presented in the Guidelines for National Greenhouse Gas Inventories in 2006 [33].
Table 2. Trend of the ratio of each land type in the total ecological footprint in Mongolia from 1961–2012. Data source: Global Footprint Network (GFN) 2016 [25].
YearCropland Grazing Land Fishing Ground Forest Land Carbon Uptake Land Built-Up Land
(%)(%)(%)(%)(%)(%)
19618.678.10.107.64.60.9
19719.664.60.0814.510.20.9
198110.353.50.0617.317.90.7
19916.857.80.045.029.90.6
20014.073.50.022.819.30.3
20125.663.50.063.226.61.0
max10.3 (1981)78.1 (1961)0.10 (1961)17.3 (1981)29.9 (1991)1.0 (2012)
Table 3. Coal-fired power plants capacity and efficiency in Mongolia. Data source: Ministry of Energy 2017 [30]. CHP—combined heat and power.
Combined Heat and Power PlantCapacity (MW)Internal Electricity UseOverall Efficiency Year of Commission
Ulaanbaatar CHP22414%20.9%1961
Ulaanbaatar CHP318617%44.0%1968
Ulaanbaatar CHP470312%42.4%1983
Darkhan 4817%27.5%1966
Erdenet2920%41.3%1987
Choibalsan3614%19.5%1969
Dalanzadgad 6--2000
Total1032
Table 4. Electricity generation by source in Mongolia between 2012–2016. Data source: Ministry of Energy 2017 [30].
Source20122013201420152016
Heat power plant4775.55014.05191.35415.85555.9
Diesel power plant28.75.48.26.03.8
Solar energy--0.60.50.3
Hydro power plant52.159.966.359.384.7
Wind power plant-52.9125.4152.5157.5
Total4856.35132.25391.95634.25802.4
Unit: million kWh.

