Article

Consumer Preferences and Welfare Evaluation under Current Food Inspection Measures in China: Evidence from Real Experiment Choice of Rice Labels

1
College of Humanities and Social Development, Nanjing Agricultural University, Nanjing 210095, China
2
Institute of Regional Agriculture, Nanjing Agricultural University, Nanjing 210095, China
3
Department of Agricultural Economics, Sociology, and Education, Penn State University, University Park, State College, PA 16802, USA
4
College of Economics and Management, Nanjing Agricultural University, Nanjing 210095, China
*
Author to whom correspondence should be addressed.
Sustainability 2018, 10(11), 4003; https://doi.org/10.3390/su10114003
Submission received: 13 October 2018 / Revised: 29 October 2018 / Accepted: 30 October 2018 / Published: 1 November 2018

Abstract

:
Frequent food quality and safety issues result in various food inspection measures in China, while some are not widely acknowledged by the public and are less efficient. Consumer demand is significant for priority setting in food policy. This study investigates Chinese consumers’ heterogeneous preferences for selected food inspection measures and estimates welfare effects based on willingness-to-pay (WTP) calculation. Rice consumption data from a 2018 nationwide consumer survey designed using the real choice experiment is analyzed by the random parameters logit and the latent class model. The findings reveal that consumers place a high value on government certification, and brand is valuable especially when public management is perceived as weak. However, the insufficient market demand for third-party certification may increase transaction costs due to overlapping functions and consumers’ distrust. Moreover, there should be a need to broaden consumers’ understanding of traceability and grading systems. This study emphasizes the necessity of direct governmental involvement and the existence of unnecessary policy cost.

1. Introduction

Asymmetric information impairs the market for food products. When consumers with a greater willingness to pay (WTP) for high quality food do not correctly identify high quality food products, producers may not have an incentive to improve food quality or update their production technology [1,2]. This is an example of Gresham’s law, which states that bad money drives out good [3]. A large number of food quality and safety incidents occurred in China since the early 2000s. In response, the Chinese government instituted a series of food inspection measures including traceability system, quality grading and quality certification. China’s Ministry of Commerce started a comprehensive traceability system from production to distribution in 2010, and a full-scale tracking network has taken shape as of June 2014. The food grading system was first introduced into the rice retail market in 2012 and such move formed an important step for boosting agricultural product standard. The No.1 Central Document 2017 published by the Chinese government points out that new agricultural producer groups are granted the right to label officially certificated products as pollution-free, green, organic, and with geographical indications. However, some inspection measures are not widely acknowledged by the public and are less efficient for reducing information asymmetries. Since consumers are the main beneficiaries of enhanced food management systems, what consumers prefer in a demand-oriented market may drive the focus of public policy-making and the food suppliers’ operating decisions.
Much attention regarding consumer preferences and WTP focused on livestock and aquaculture, ranging from certification, traceability, and quality grading systems [4,5,6] to country-of-origin, local and ecological labels [7,8,9]. However, few studies were dedicated to analyzing plant products. Compared to animal products, plant products in China are consumed with larger quantity and higher frequency, among of which rice is likely to be the most typical plant product that faces serious food quality and safety issues. A rough estimate based on the China Statistical Yearbook 2017 [10] and the Chinese Nutrition and Health Status 2004 indicates that rice is the most frequently-consumed staple for at least two-thirds of the Chinese urban population. Rice consumption areas in China are mainly: the 15 provinces of Jiangsu, Zhejiang, Fujian, Jiangxi, Hubei, Hunan, Guangdong, Guangxi, Hainan, Sichuan, Guizhou, Yunnan, Heilongjiang, Jilin and Liaoning; the three cities of Qinhuangdao in Hebei province, Xinyang in Henan province and Hanzhong in Shanxi province; the two municipalities of Shanghai and Chongqing; and the southern region of Huai River in Anhui province. However, the 2013 rice scandal involving excessive cadmium residues that occurred in Hunan, Southern China came as a great shock to Chinese consumers. Since then, rice safety issues associated with heavy metal soil pollution from industrial sewage discharge and agrochemical usage have aroused great concern and even caused scares across the entire society [11].Given its importance in the Chinese diet and serious safety issues, rice can be viewed as an ideal research subject among plant products.
Consumer preferences can be dealt with traditional evaluation methods, such as the contingent valuation method [12], experimental auction [13] and conjoint analysis [14]. However, the use of stated preference data in these methods may lead to hypothetical bias and social desirability bias [15,16], because respondents frequently evade or overstate their actual preferences under simulated experimental conditions. In comparison, by allowing consumers access to a realistic purchasing environment, the real choice experiment (RCE)method collects revealed preference data to make estimated preferences close to reality. The incentive-compatible RCE also satisfies the microeconomic foundations of random utility theory [17,18]. However, although the nonhypothetical elicitation method has drawn widespread attention in recent years [19,20], such approach was seldom used to analyze Chinese consumers’ valuation for different food inspection measures.
The objective of this study is to evaluate the performances of various food inspection measures for communicating food information and thus investigate the priority of policy options in China’s efforts to food safety and quality enhancement. In this study, the real choice experiment is carefully designed with a focus on Chinese rice consumers’ preferences and WTP for government certification, third-party certification, traceability system, quality grading, and brand reputation. The heterogeneity in consumer preferences and WTP is examined using the random parameters logit and the latent class model. Considering that consumer preferences may not be optimal from a public health perspective, this study provides a welfare analysis of the effectiveness of selected food inspection measure for a better understanding of economically viable food policy.

2. Real Choice Experiment

2.1. Lancaster’s Consumer Theory

Breaking away from the conventional theory that utility centers on products, the novel view proposed by Lancaster [21] was that consumer utility is not directly derived from a product but from bundles of multiple attributes or properties the product possesses. Although consumers hardly identify the utility magnitude of each attribute, they can compare a series of product profiles comprised of collections of attributes to generate a ranking of the utilities of different products. In Lancaster’s approach, each consumer chooses product profiles in a free market to maximize their utility under budget constraints.

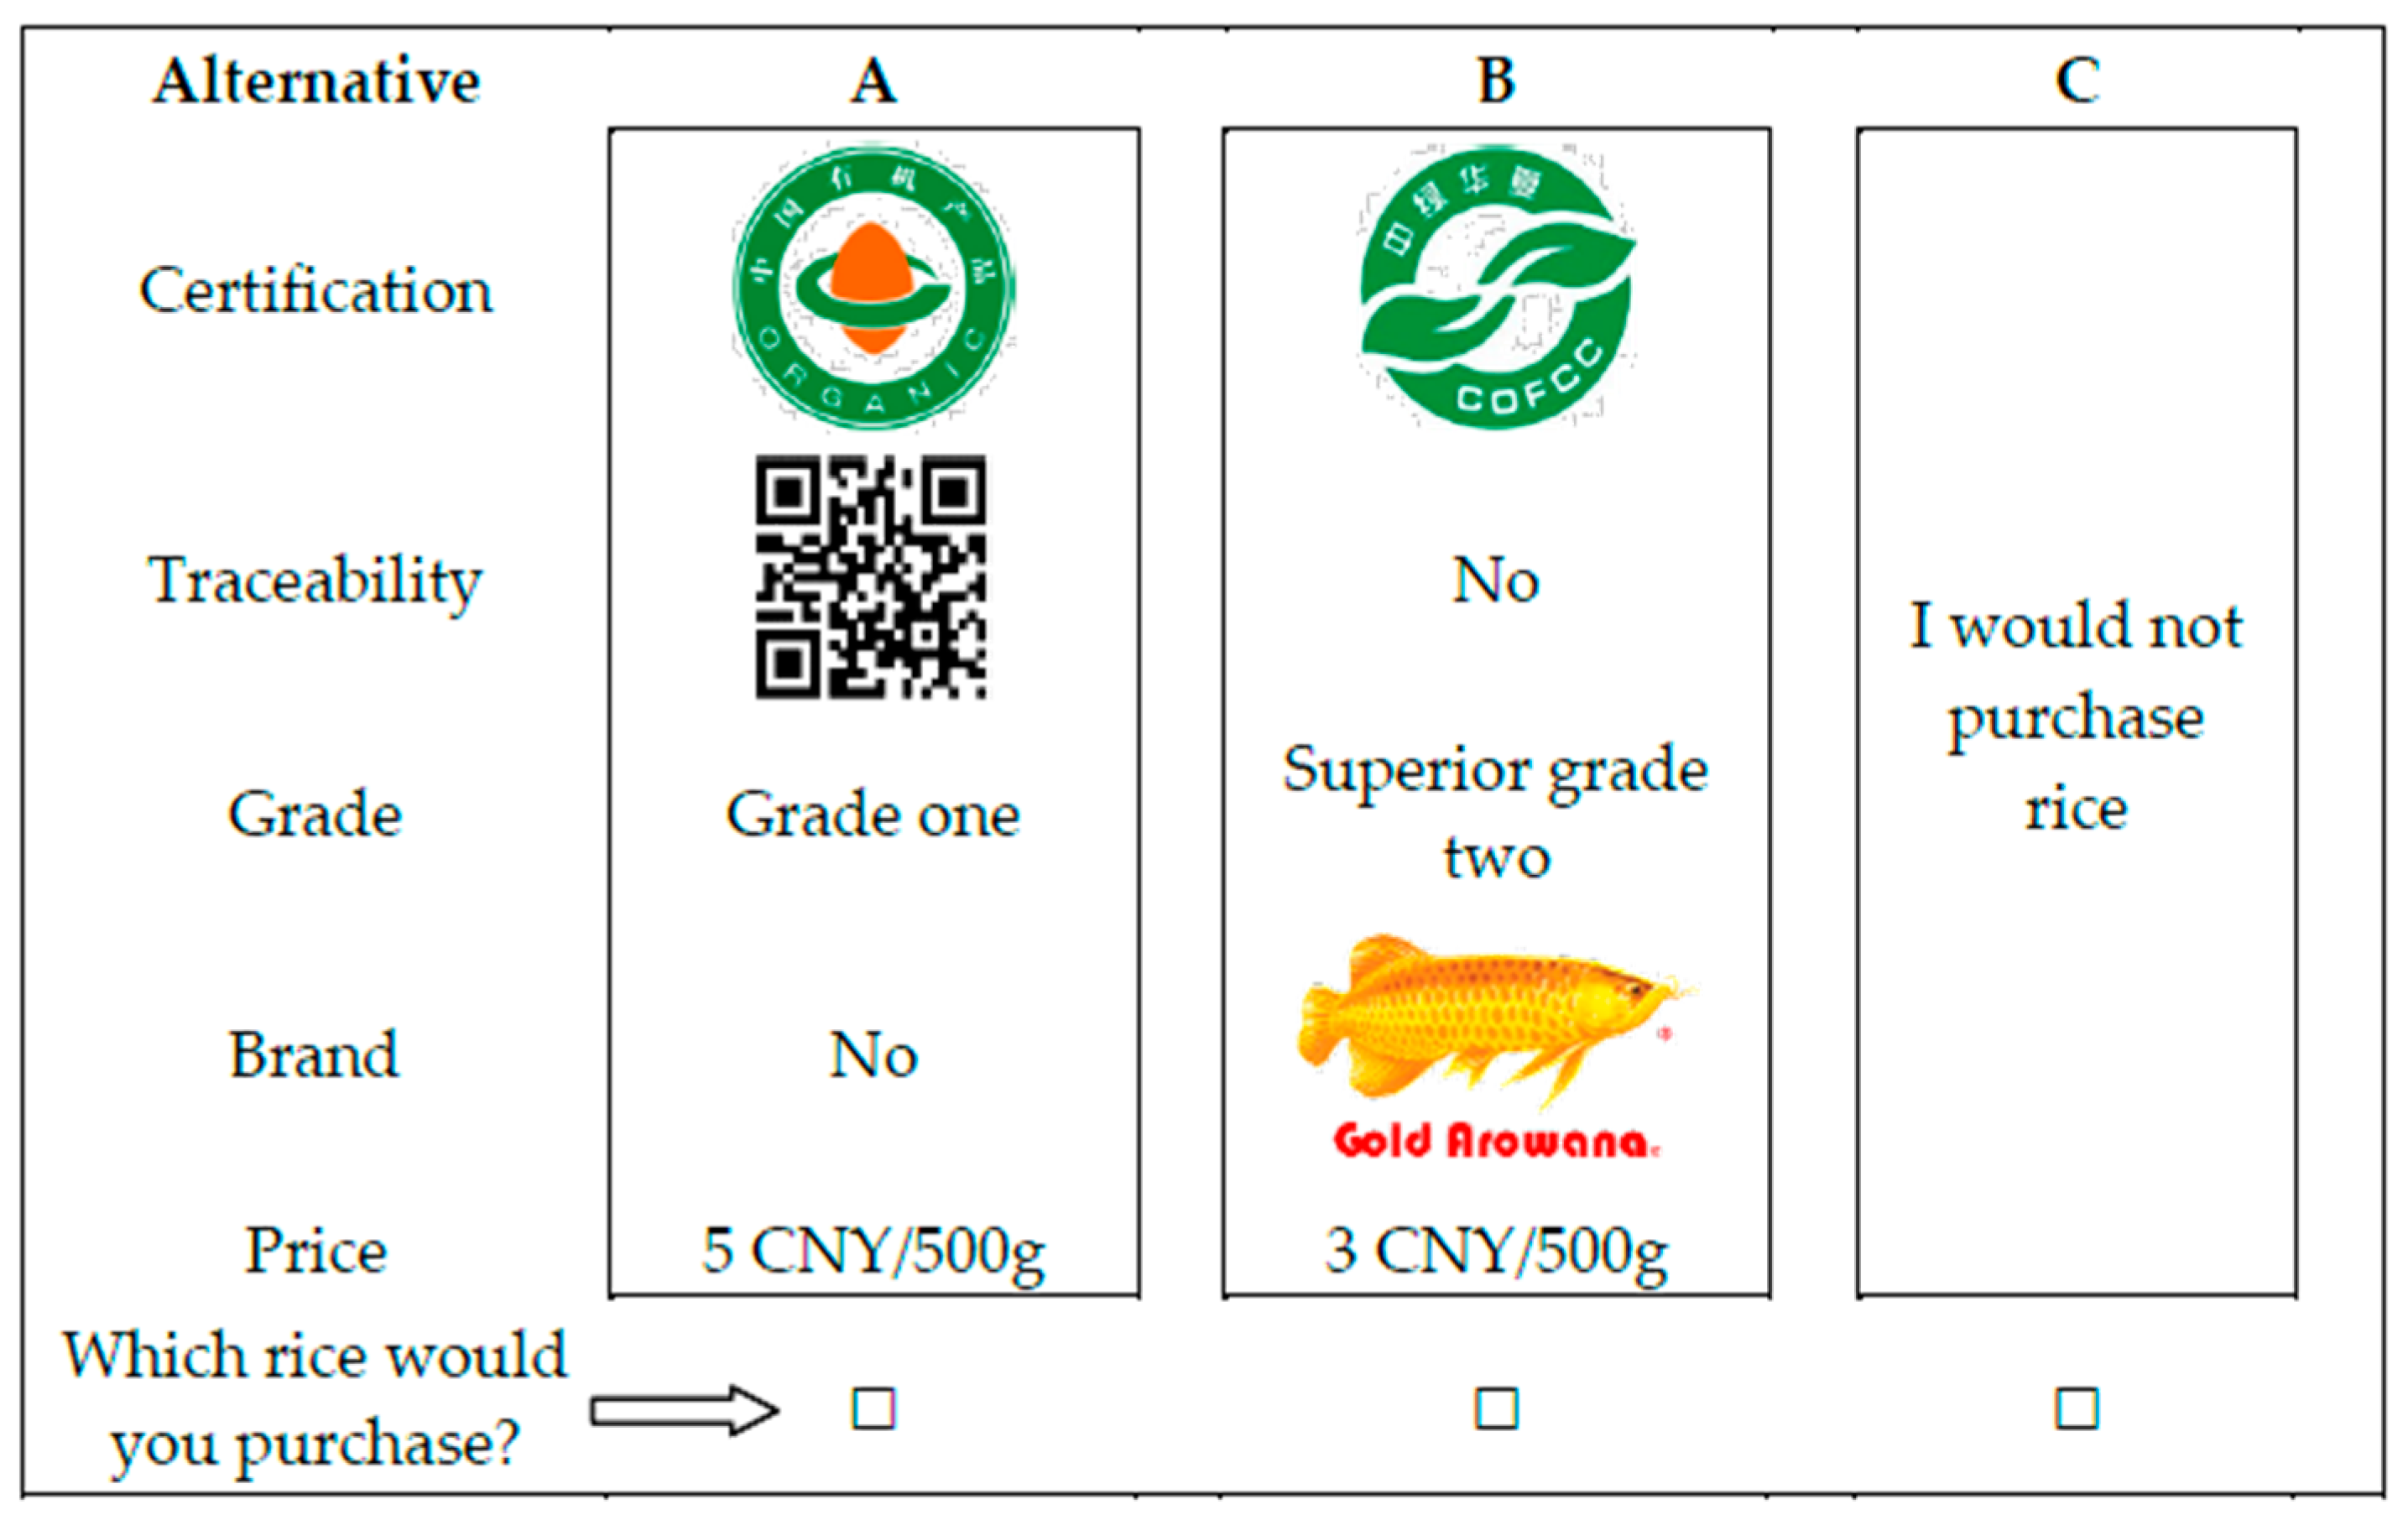
2.2. Attribute Selection and Choice Set

Consistent with Lancaster’s consumer theory, RCE is an appropriate approach to decompose consumer preferences for different product-specific attributes. We examine a total of 72 (23 × 32) rice profiles consisting of collections of two three-level attributes (quality certification and price) and three two-level attributes (traceability system, quality grading, and brand). These attributes represent different patterns of transmitting food information via labels, as described in Table 1. Effect coding is used; the primary benefit of effect coding compared with dummy coding is that the coefficients correspond to the classical definitions of main effects and interaction effects, especially when the product terms are modeled in an analysis [22]. Consumers are allowed to make a choice in a choice set involving two alternatives of different rice profiles and an opt-out option. The design of a no-option choice is close to a real purchasing situation when neither rice profile appeals to the consumers. A sample choice set is listed in Figure 1.
Considering that respondents would be fatigued after working with 15 to 20 product profiles [23], the use of 72 × 71 choice sets under a full factorial design is not practically feasible. Alternatively, a fractional factorial design orthogonally generates eight simulated choice scenarios incorporated into five different versions of questionnaires, using the OPTEX and PLAN procedures in the 9.4 SAS software (SAS Institute Inc., Cary, NC, USA) with an optimal D-efficiency of 83.69 and A-efficiency of 66.65.

2.3. Experimental Design

In the preparation for the RCE, eight plastic boxes filled with two packages of rice (500 g) were placed on the experiment table and represented eight choice sets. The information label with the specific attributes was attached to the front of rice package, as illustrated in columns A and B of Figure 1. The rice packages only differed in quality and safety attributes but had the same freshness, place of origin and other common characteristics. Prior to the experiment, the recruited participants involved in the RCE were rewarded with 20 Chinese yuan (CNY) per person. They were informed of the experimental procedure in detail. This procedure was as follows: (a) Consumers were required to independently make a choice in each choice box in which they could choose alternative A, alternative B or the opt-out option according to preferences and budget constraints. The investigators recorded the consumers’ choice and purchase information; (b) Consumers randomly selected one ball in an invisible box containing eight numbered balls and the number of the ball corresponded to the number of the package of rice they had the option of purchasing with the 20 CNY. They received the remaining balance as compensation for participating in the experiment; (c) To avoid a situation where consumers always chose the opt-out option in each choice set to receive the full 20 CNY as cash, participants were asked to continuously draw balls until the choice result was an alternative A or B that they would actually pay for.

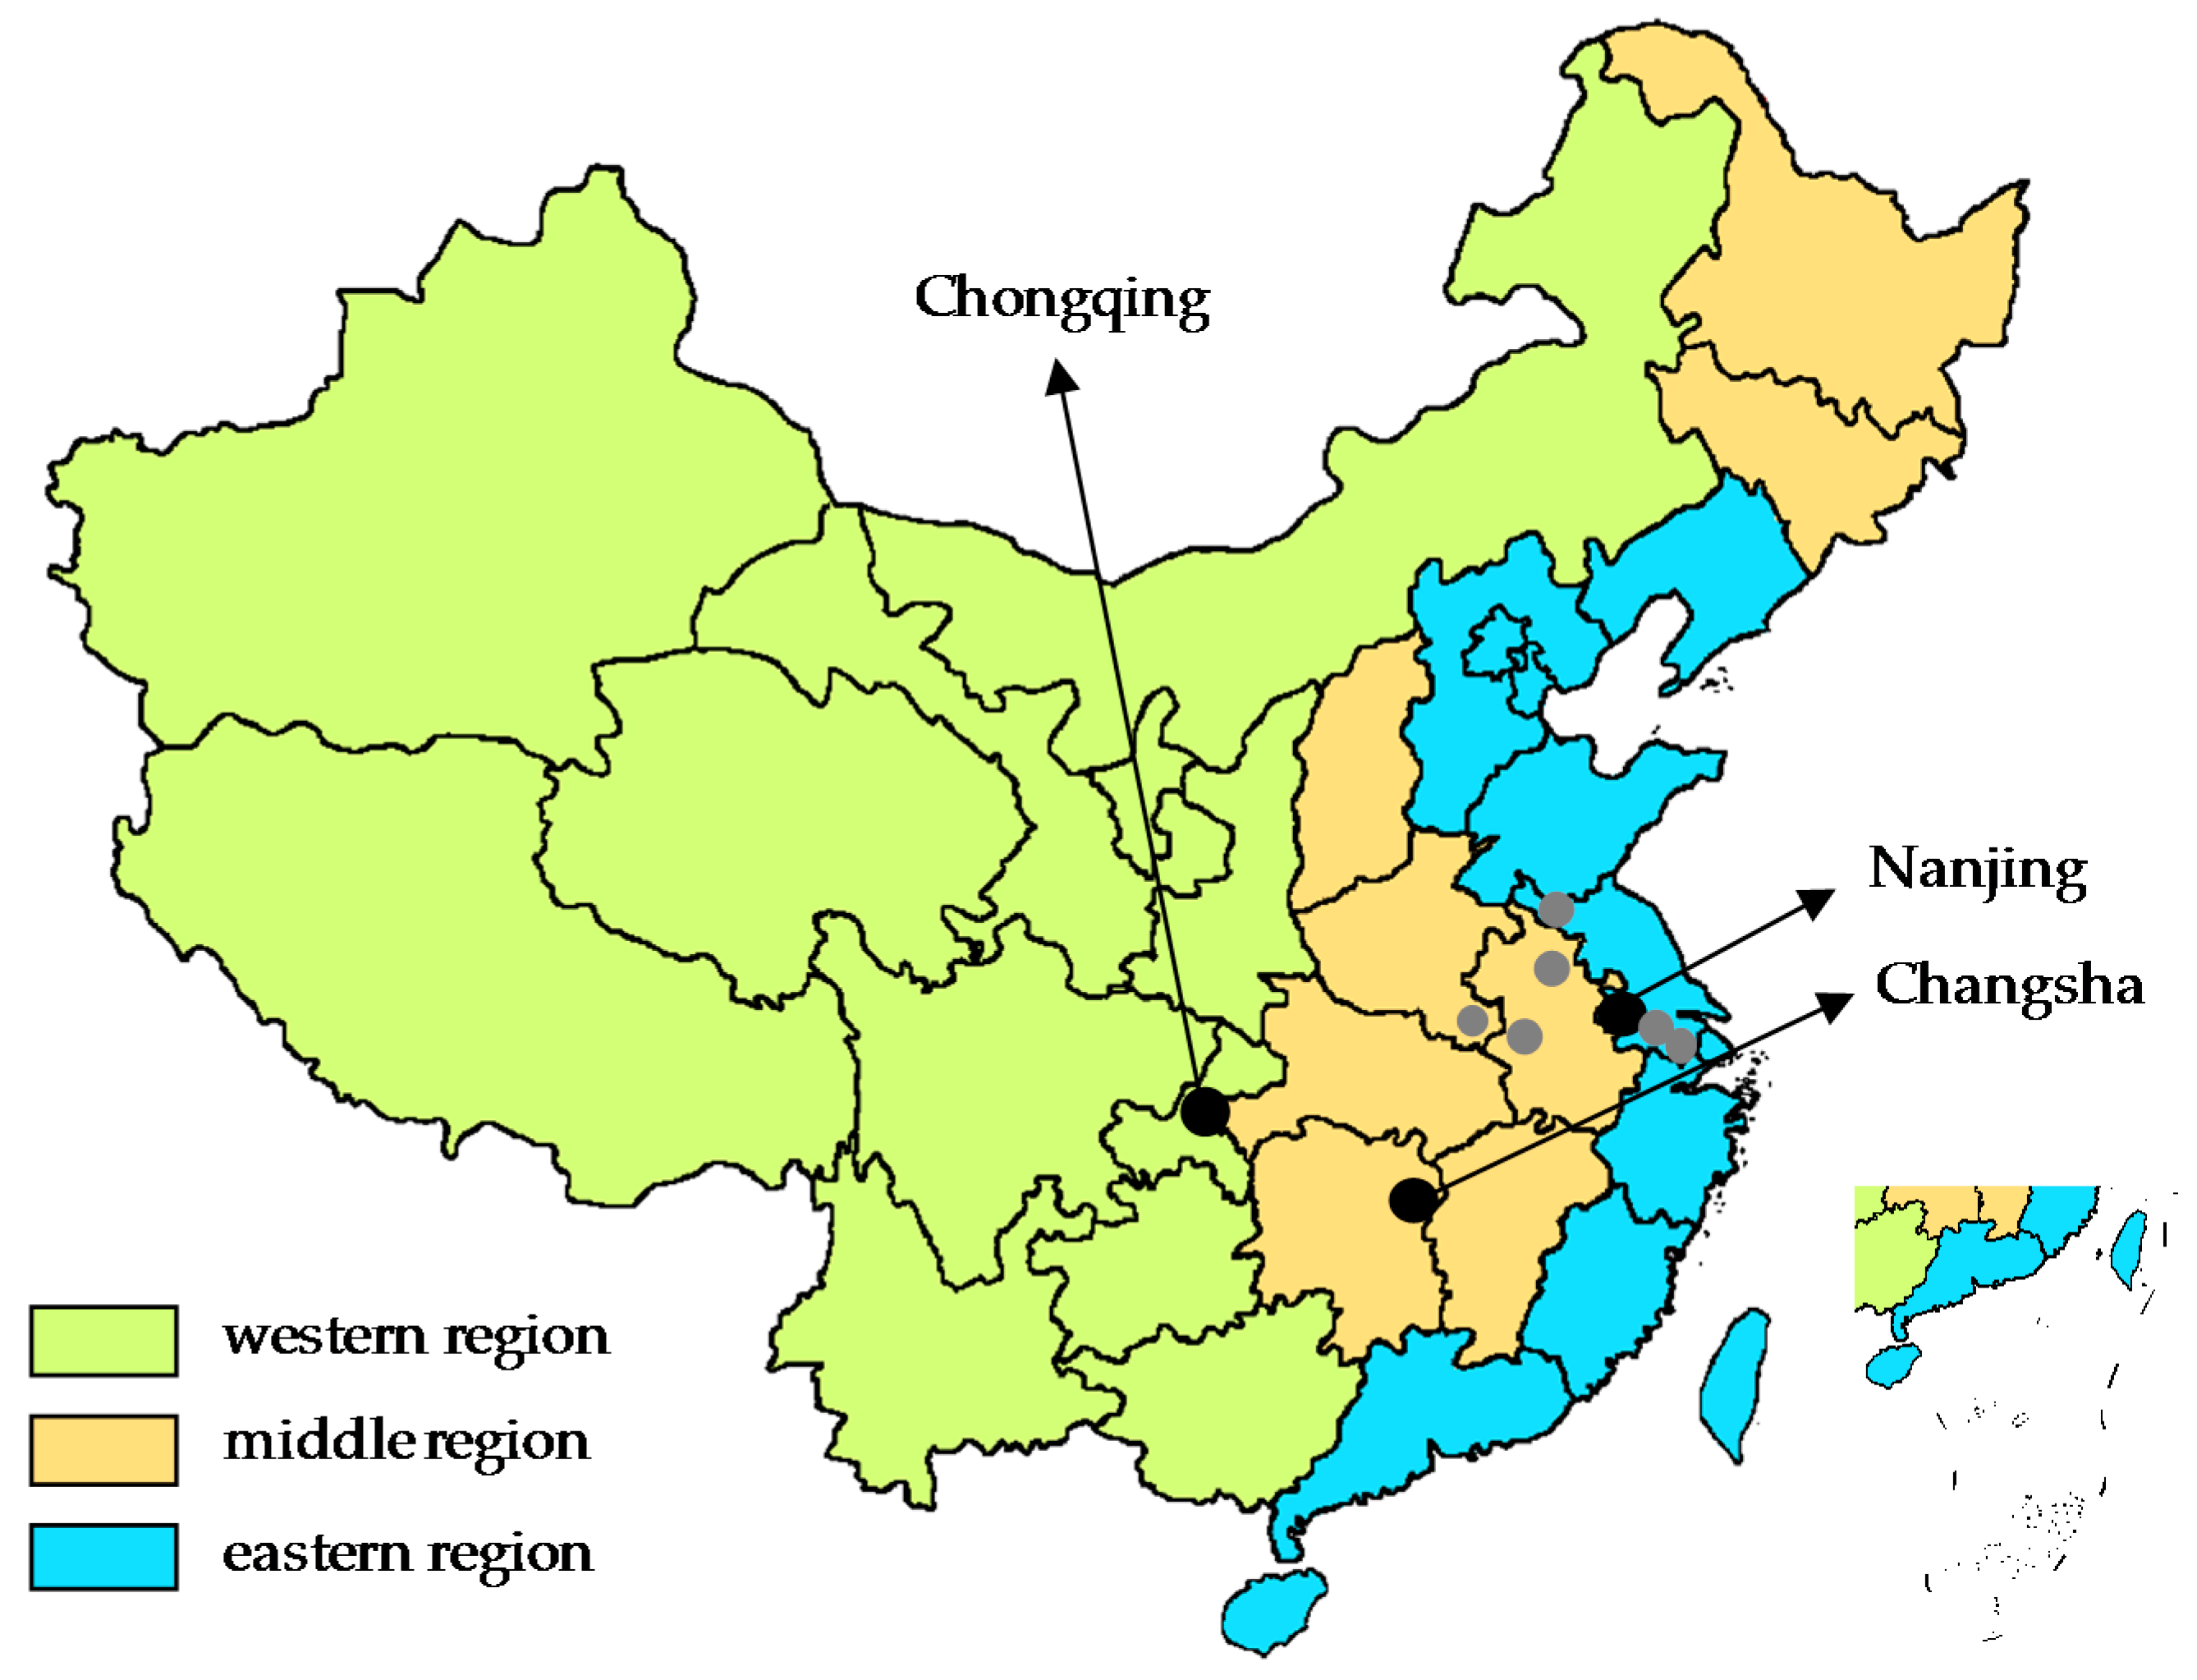
2.4. Experimental Sites

The RCE was carried out across China’s western, middle, and eastern regions from May to July 2018. The selection of survey cities took into account the diversity of Chinese dietary patterns, because most southerners but only a minority of northerners treat rice as a staple food. The locations of Chinese survey cities are illustrated in Figure 2. Two groups of well-trained graduate students at Nanjing Agricultural University administered the consumer survey during the same time period. One group was responsible for three major capital cities located in different geographical sites denoted by the black circles: Chongqing (municipality), Changsha (capital of Hunan province) and Nanjing (capital of Jiangsu province). Another group took advantage of the summer break to complete the investigation in the other six cities. The corresponding six gray circles from left to right in Figure 2 denote Xinyang in Henan province; Luan and Bengbu in Anhui province; and Xuzhou, Changzhou and Suzhou in Jiangsu province. The experimental data was collected from fresh markets, domestic supermarkets and international supermarkets where real purchasing behavior occurred to better capture consumers’ revealed preferences in simulated rice purchasing conditions. To guarantee the randomness of the sample and relax the consumers’ time constraints, the RCE followed the rule that the recruited respondent was the third person coming into the enumerator’s view and that he had finished purchasing or was leaving the market [24]. In all, 65 respondents in each of the three relatively developed cities (13 persons × 5 versions × 3 cities × 3 days)and 10 respondents in each of the six developing cities (2 persons × 5 versions × 6 cities) were selected at random to create a data set of 607 respondents and 4856 observations with an overall response rate of 94.12%.

2.5. Data Description

The summary statistics of the selected socio demographic variables are described in Table 2. The survey sample compares closely to the China census data in terms of age, household size, income and education, which ensures the representativeness of China’s population. The respondents cover all age groups with a mean age of about 40. In the current transition in population policy from the now-abolished family planning to a two-child policy initiated in 2015, most households still have three family members. More than half of the respondents reported a monthly household income of 6000-15,000 CNY and an educational level of undergraduate. Given that China’s urban-rural and eastern-western regions differ greatly in income and education, the two mean values are roughly estimated from the stratified sample and the China census of the three major survey cities. Nearly sixty percent of respondents self-identify as household primary shoppers, which is the main reason for the difference in gender structure between the sample (62% female) and the census (49% female). This is attributable to the fact that purchasing decision makers are usually females in the household.
Food safety risk perception and risk attitude are captured with five-point Likert scales using the scaling method suggested by [25]. A perception value of 1 indicates no concern, meaning eating rice is not risky and a value of 5 indicates extreme concern, meaning eating rice is risky. The average perception of 2.43 is similar to the value reported by [26]. The majority of respondents perceive rice as a low-risk food. Fewer than 15% give food safety risk ratings of 4 or 5. For the risk attitude question, an attitude value of 1 indicates a consumer is willing to accept the risk of eating rice and a value of 5 indicates he is unwilling but has no other choice. One-half of consumers are highly risk-averse with a rating of 5; this may reflect the fact that rice is a staple in the Chinese diet and therefore consumers are more sensitive to any risk it poses than they might be with other less frequently consumed foods.

3. Econometric Modeling

3.1. Random Parameters Logit andLatent Class Model

The consumer utility function derives from consumer theory of Lancaster [21] and random utility model of McFadden [27]. For finite alternatives J and choice sets T, the utility U n i t of the decision maker n obtained from alternative i ( j i , j = 1, 2, 3) in a choice set t is decomposed into the deterministic components β n x n i t + α n z n i t and a stochastic component ε n i t . It is reasonable to specify the utility function to be linear, as expressed by
U n i t = β n x n i t + α n z n i t + ε n i t , j i
where the consumers’ taste heterogeneity is captured by β , x is a vector of random parameters of different attributes, α is a vector of fixed parameters of the other variables z , and ε is an independent identically-distributed (IID) type I extreme value variable.
The decision maker n knows the value of his own β for all alternatives J and will choose the alternative i that provides the highest level of utility, if and only if U n i t > U n j t , j i . To estimate consumers’ unobserved heterogeneous preferences for informational attributes, the random parameters logit (RPL, also called mixed logit) model is more flexible and versatile than other conditional probability models. Generally speaking, it obviates the three limitations of a traditional logit model by allowing for random taste variations, correlations in unobserved factors (non-IIA property) and unrestricted substitution patterns [28]. Compared with a probit model, an additional appealing feature is the unrestricted normal distributions for the random coefficients to be estimated.
The RPL model can be viewed as the integrals of a standard logit formula evaluated over a density function of parameters. This unconditional choice probability that individual n chooses alternative i in a choice set t under density f ( β ) takes the usual form of
P n i t = exp ( β n x n i t + α n z n i t ) j = 1 J exp ( β n x n i t + α n z n i t ) f ( β n ) d β n
Alternatively, the heterogeneity in preferences over a set of classes across individuals can be further analyzed by the latent class model (LCM), which is evaluated with a noncontinuous distribution f ( β ) . Suppose that the density function f ( β ) is discrete and degenerate at fixed parameters b , f ( β ) = 1 for β , otherwise 0 for β = b , and suppose that random parameters β take M possible values labeled b 1 ,…, b m ,…, b M . All consumers N are sorted into a number of M latent classes labeled 1,…, m,…,M, where members of the same class share similar features such as taste heterogeneity or socio-demographic characteristics. The choice probability that individual n chooses alternative i in a choice set n is a weighted average of a standard logit at different values s m , which denotes the class probability of a random individual n falling into a latent class m. Latent class formulation and class probability s m [29] are respectively modeled by
P n i t = m = 1 M s n m exp ( b n m x n i t + α n z n i t ) j = 1 J exp ( b n m x n i t + α n z n i t )
and
s n m = exp ( θ n m r n ) m = 1 M exp ( θ n m r n )
where θ m denotes a vector of parameters normalized to zero to assure the identification of the model with a set of characteristic variables r affecting the class probability s m for individual n in class m.

3.2. Willingness to Pay

The WTP measure provides rich economic interpretations of the estimated parameters in view of the noncardinal nature of the utility function. To better simulate the WTP, the necessary variables are defined first. The 5 × 1 variables vector x displays food-specific attributes associated with the random parameters β , each of which is assumed to follow a normal distribution. These five elements depict the different alternatives in the RCE using a set of dummy variables.
x n i t = [ G o v e r n , T h i r d , T r a c e , G r a d e , B r a n d ] 5 × 1 T
Price, output and interaction terms in variables vector z are taken as fixed parameters α . One interaction x * x ˜ indicates the correlation between one informational attribute with another, and the other interaction x * D accounts for the impact of sociodemographic characteristics (income and education) with attributes on utility.
z n i t = [ P r i c e , O u t p u t , x * x ˜ , x * D ] 21 × 1 T
The WTP for an attribute is interpreted as the compensation or discount for consumers relative to the utility without the attribute to make them indifferent between the two situations. To calculate mean WTP values for all consumers, a ratio is taken in which the numerator is the parameter of attribute k plus its interaction parameters with consumers’ characteristics, and the denominator is the fixed price coefficient. This ratio is then multiplied by −1. Because effect coding is used for the attributes rather than dummy coding, this ratio must also be multiplied by two in order to arrive at WTP. According to some literatures [9,30], the WTP for attribute k is represented by
W T P k = 2 * β x k + α x k * D * D α p r i c e
For the statistical properties of the WTP for attribute k, the Monte Carlo method developed by Krinsky and Robb [31] is used to measure standard deviation and 95% confidence intervals. This simulation procedure of a parametric bootstrapping technique requires a large number of random draws (5000 draws in our case) for a parameter vector from a multivariate normal distribution utilizing a variance covariance matrix and the means of estimated parameter vectors.

3.3. Consumer Welfare

Consumer welfare gain or loss due to the presence of food quality and safety attributes can assess the market impacts on the effectiveness of food inspection system. A consumer n’s general welfare change for attribute k switching from EMUA (the scenario A where the attribute is not available in a choice set) to EMUB (the scenario B where the attribute becomes available) is given by
W e l f a r e n k = E M U n k B E M U n k A M U I = E M U n k B E M U n k A   α p r i c e
where MUI denotes the marginal utility of income and EMU denotes the expected maximum utility. In view of the implication of the derivative d U t i l i t y / d I n c o m e   ( $ ) , MUI can be substituted by −1times the price coefficient as a proxy value. A consumer n’s average EMU for attribute k from all alternatives he chooses in a number of T choice sets is calculated as follows.
E M U n k = L n i T = 8 exp ( β n x n i t + α n z n i t ) + γ
where γ is the Euler Mascheroni constant. The numerical value of this infinite and non-repeating decimal is 0.55721…

4. Empirical Results

4.1. Heterogeneity in Consumer Preferences

The RPL and LCM models assume food-specific parameters to be random and follow normal distributions. Price, opt-out and interaction terms are specified as fixed. The estimation of random parameters is based on Halton sequences (draws = 1000), which are used to generate points in space for numerical methods such as Monte Carlo simulations and are preferable to random drawings because they produce better results [32]. The inclusion of household income and educational level as two covariates explores the economics meaning of sociodemographic characteristics and improves the performance of models. Estimation results are shown in Table 3.
All standard deviations of the random parameter distributions of food-specific attributes are statistically significant at the 1% level, which indicates a strong presence of unobserved taste heterogeneity among consumers. The RPL model shows that Chinese urban consumers value most the quality certification program supported by government. The interaction effect between government certification and grade is also significant. Consumers consider third-party certification and traceability systems to be substitutable and they both have a strong substitutable relationship with brand. Accordingly, the relative importance value ranking (the importance value of attribute k is I k = max ( β k ) min ( β k ) . The relative importance value of attribute k is calculated by the model as W k = I k / K k I k ) for these food inspection measures is quality certification (61.90%), traceability system (19.70%), brand (12.78%) and quality grading (5.62%), which again indicates that certification information labels are the most salient to consumers’ purchasing decisions. Impacts of demographic characteristics on utility are captured by the interaction terms, and the results indicate that consumers with higher incomes and levels of education are more conscious of quality and safety attributes. The interaction effects involving nonpublic certification are partially counteracted by government certification due to their common features to some extent.
The LCM model elicits the heterogeneous preferences of the three distinctive classes. The number of classes is identified as optimal jointly using the Akaike (AIC), Bayesian (BIC) and Hannan-Quinn (HQC) information criteria. AIC, BIC and HQC in the three-class model are at a minimum compared to their values in models with different numbers of classes. The values (AIC, BIC, HQC) are: 3 classes (5385, 5894, 5394) < 5 classes (5389, 5898, 5399) < 4 classes (5391, 5900, 5401) < 2 classes (5512, 6021, 5522). The five-class model comes closest in performance to the three-class model shown in Table 3. The names we give to the classes in the five-class model are label and rice lovers (same meaning as in the three-class model, 44%), rice avoiders (do not consider rice necessary or valuable, 20%), budget conscious (care about certification, traceability and brand only if their incomes are high, 19%), price sensitive (same meaning as in the three-class model, 11%), and label skeptics (place no value on food labels, 6%). The LCM results for the five-class model are displayed in Table A1 of Appendix A. The individuals in the first latent class can be viewed as label and rice lovers. The class probability of entering into this group for a randomly chosen member is 54.89%. Consumers in the first class place more importance on the food labels with certified, traceability and brand information, as well as quality grading when family income increases. The relatively low absolute value of the price coefficient and the high ratio of opt-out to price reveal that consumers in this class consider rice a necessary staple in their daily diet. The second class (class probability of 20.64%) is referred to as price sensitive, in contrast to the first class. This class is characterized by shoppers who gain little utility from food inspection measures and are strongly responsive to rice prices. Rational consumers constitute the third class (class probability of 24.47%); they try to balance their preferences against income constraints. They prefer food safety information provided by credence attributes such as government certification, third-party certification and traceability system in spite of a relatively high and significant price coefficient. As their income goes up, they care more about food quality information for experience attributes such as grade and brand, which is similar to the results from the RPL model.

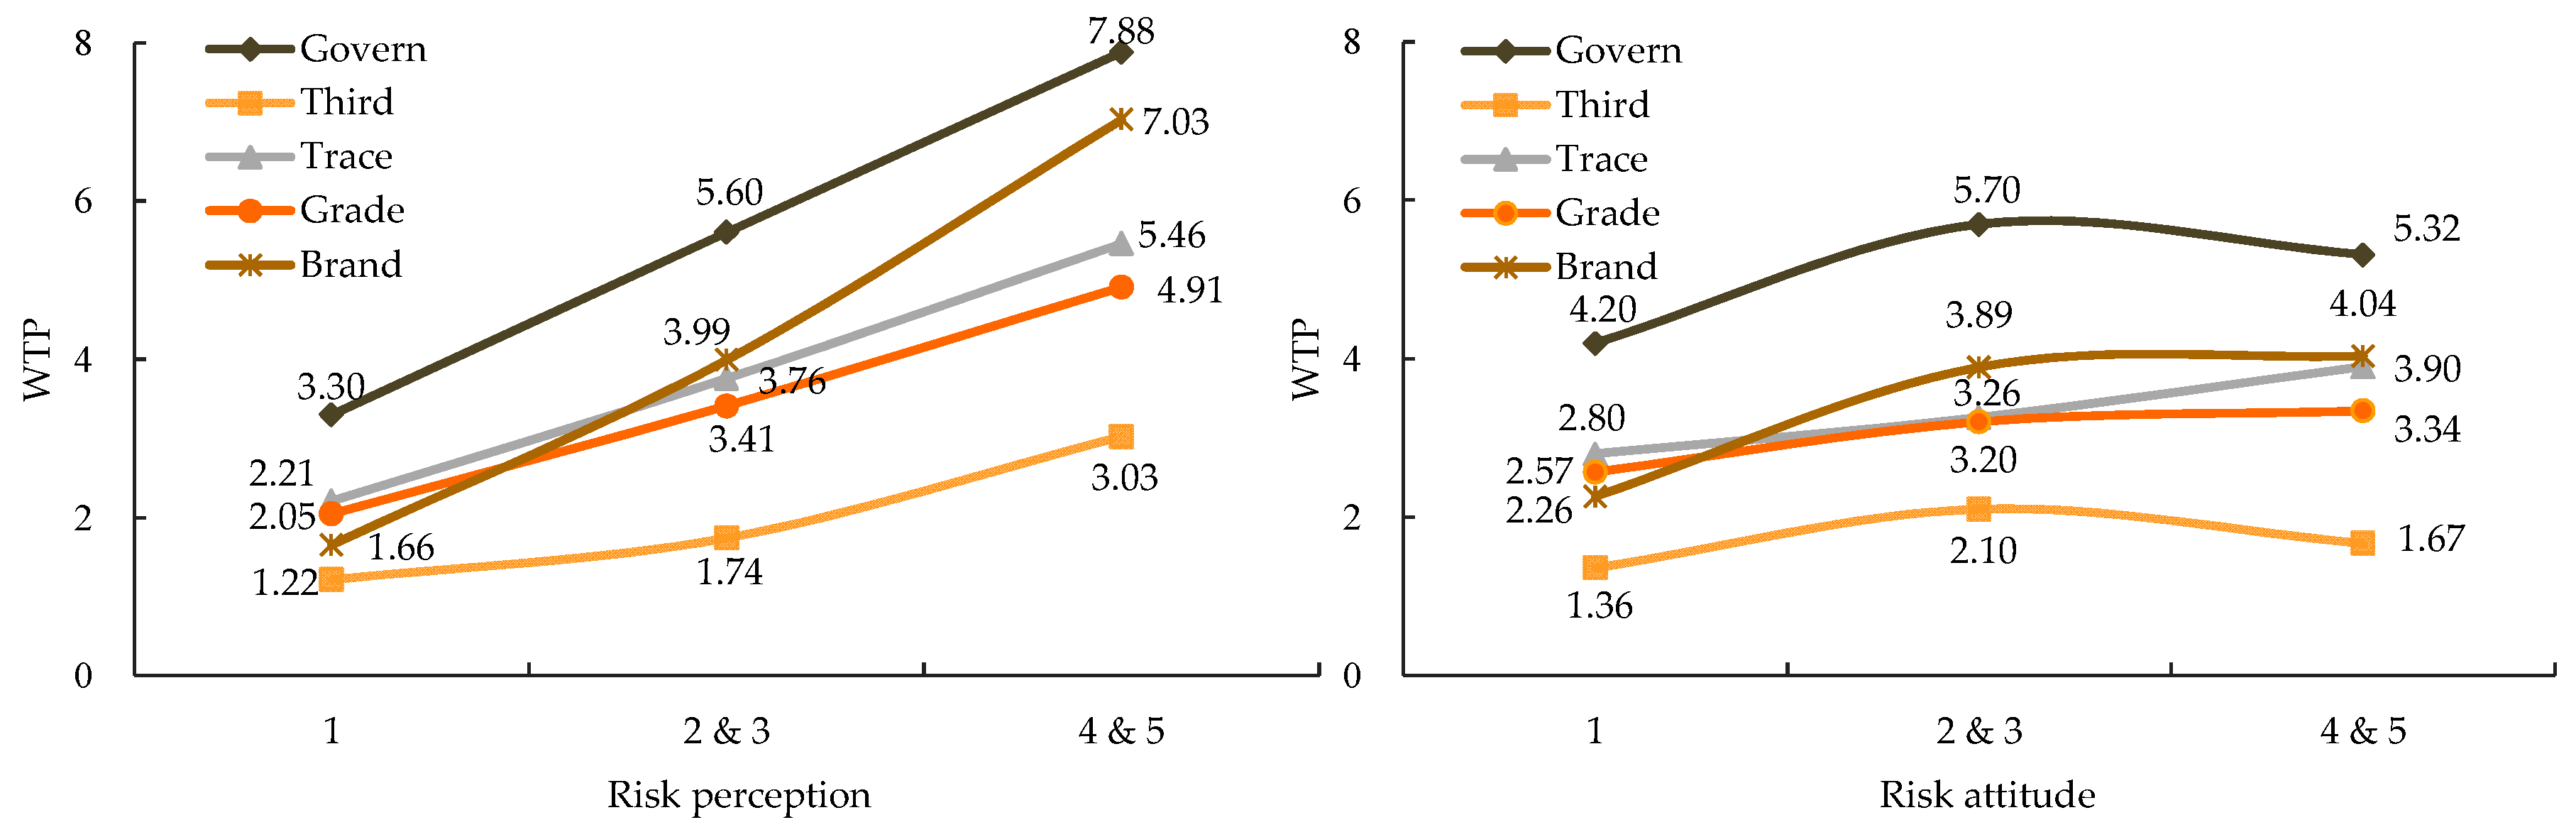
4.2. Willingness to Pay Estimation

Table 4 shows consumers’ WTP values for food inspection measures with different levels of socio-demographic characteristics. The representative consumer features as 40 years old, having 3 members in her family, a food safety risk perception of 2.43 and a risk attitude of 3.84. When heterogeneity is modeled continuously as in the RPL, the left-hand side of Table 4 reflects the reasoning that consumers with a higher income and better education express a higher WTP for food-specific attributes. Holding other factors constant, government certification information leads to consumers’ highest WTP, regardless of income and education levels. This implies that the direct involvement of the government as a certification authority has earned people’s heightened confidence and approval. On the contrary, since the third-party certification is not widely acknowledged and its administrative function somewhat overlaps with that of government certification, consumers’ WTP is not as strong as their preferences. Moreover, WTP for brand ranks the second highest. It is valued for communicating information about food quality and firm reputation to consumers during the purchasing decision, and brand can be especially valuable when the public food safety mechanisms are perceived as weak. In addition, the Chinese government has vigorously pushed a nationwide traceability system and rice grading system beginning in 2010 and 2012, respectively. However, on account of being relatively new implemented and lacking widespread consumer recognition, the simulated WTP values for the two attributes are relatively low.
The right-hand side of Table 4 displays the WTP values of the three classes in the LCM model. Generally, the maximum values of WTP occur in the first class (label and rice lovers), followed by the third class (rational consumers) and then the second class (price sensitive), which is consistent with previous preference estimates. The wide WTP variations among the three classes coherently reflect the distinctive preferences of consumers for food inspection measures. However, these WTP values do not represent stable price premiums over a long period, because final retail prices are impacted by the effectiveness of information labels, the extent of market power in food distribution and retail, demand and supply elasticities, and other potential factors.
Figure 3 shows the relationships between risk perception and WTP, and between risk attitude and WTP. Respondents are divided into three groups according to their sensitivity to risk concerns. The representative consumer depicted is defined as 40 years old, living in a family of three members, earning CNY 3611 per month and having 14 years of education. Figure 3 reveals three findings. First, government certification still receives the highest WTP values regardless of risk perceptions and attitudes. Conversely, third-party certification has the lowest WTP, again likely due to overlapping with government certification and lack of consumer awareness. Second, the simulated WTP values are related to different risk perception levels. Consumers are more conscious of food inspection measures if they have a higher risk perception. Third, risk-averse consumers (risk attitudes 4 and 5) value government and third-party certification less than consumers with a medium level of risk aversion (risk attitudes 2 and 3), but value brand, traceability and quality grading more.

4.3. Consumer Welfare Evaluation

Consumer welfare for the existing food inspection programs is evaluated by assuming a scenario of consumers not having the option to purchase rice with the information on the label about product attributes. Similar to WTP estimation, the statistical properties of welfare are simulated by Krinsky and Robb’s bootstrapping procedure, taking 5000 random drawings for a parameter vector from a multivariate normal distribution with a variance-covariance matrix and mean parameter estimates.
Following Equations (8) and (9), the welfare evaluation per choice occasion is calculated using a series of coefficients from Table 3 and variables from the dataset. In order to estimate individual welfare, we start by identifying the number of choice occasions a person faces in a year and the national population of rice consumers. (a) Number of choices. The official statistics from the Chinese Nutrition and Health Status 2004 indicate that the per capita daily rice consumption in urban China is 217.8 g on average. In China’s retail market, rice is sold in the amount of 5 kg or 10 kg per bag and urban shoppers usually purchase one bag of rice on each shopping occasion on behalf of the household. We chose 10 kg to determine the least number of annual choices and the minimum welfare effects. Given an opt-out rate of 16.71% per our sample, a person would roughly make 9.54 choices per year (0.2178 kg × 365/10 kg/83.29%) if that individual eats rice every day. (b) Population of rice consumers. Chinese rice production and consumption areas are closely related to climate and geographic location, and are largely distributed throughout the southern region along the middle-lower Yangtze River and northeastern China. Combined with data from the China Statistical Yearbook 2017 [10], the national urban population for whom rice is a staple is estimated at around 5.13 billion, approximately two-thirds of the total Chinese urban population.
Consumer welfare losses from being deprived of the option to purchase rice with informational attributes are presented in Table 5, which can be regarded as the equivalent of welfare gains due to the presence of information labels. Welfare effects evaluated by the RPL model are shown on the left-hand side. Consumers benefit most from government-certified rice with a value of CNY 1.40 per choice occasion, whereas they do not gain much welfare from third-party certification. Considering the individual number of choices per year and all urban rice consumers in China, the introduction of a government certification program provides annually CNY 13.36 in welfare gains to each consumer and CNY 68.58 billion to all urban rice consumers. This estimation reveals that, since the national incident of the Sanlu milk powder scandal happened in 2008, the Chinese government has succeeded in restoring consumers’ confidence such that government certification is more valued than third-party certification. After government certification, brand results in the second largest welfare gain and increases consumer welfare by CNY 0.88 per choice occasion. When extrapolated to all individual annual choice occasions and national population of rice consumers, this figure translates to a CNY 8.38 gain in individual welfare and a CNY 43.02 billion gain in national welfare. Because of the substitutability between grade and government certification, and between traceability and brand (significant negative values on the interaction terms in Table 3), the welfare gain from traceability and grading information is suppressed to some degree even though their welfare effects are still significant. Specifically, urban rice consumers would gain CNY 26.92 billion and CNY 17.78 billion respectively from the presence of quality grading and traceability system.
The welfare effects for the three classes with heterogeneous preferences are shown on the right-hand side of Table 5. Label and rice lovers in the first class gain the largest consumer welfare from government certification, traceability system, quality grading, and brand reputation. They are the main beneficiaries of enhanced food inspection systems among the three classes. For price sensitive consumers, the positive impact of price on welfare effects is more significant than all the food-specific attributes. Rational consumers are concerned more about credence attributes and thus this group benefits more from introducing government certification, third-party certification and traceability labels.

5. Conclusions and Implications

This study investigates Chinese urban consumers’ heterogeneous preferences, willingness to pay and welfare effects for selected food inspection measures using the 2018 nationwide consumer survey data collected from the real choice experiment. Major conclusions from this study are drawn as follows: (a) Consumers value government certification more than other inspection measures and are willing to pay a higher premium for government-certified rice; (b) Consumers place a lower value on third-party certification compared to government certification, likely because of the distrust in third-party authorities and its overlap with the function of government certification; (c) Consumers value information about traceability and grade, although such two inspection measures and certification systems to some extent substitute for each other due to consumers’ confusion and limited awareness; (d) Brand is valuable for communicating quality information especially when the public food inspection mechanisms work in low efficiency; (e) Urban rice consumers are heterogeneous with respect to the value they place on food inspection measures. A majority of consumers (the label and rice lover’s class) place relatively high values on government certification and brand reputation. However, about one-fifth of consumers (the price sensitive class) gain little utility from food inspection measures and are strongly responsive to rice prices. About one-fourth of consumers (the rational consumer class) prefer the information provided by credence attributes (government certification, third-party certification and traceability system), and value experience attributes (grade and brand) only as their incomes increase.
China’s food quality and safety issues during the past decade have ranged from the presence of substandard, falsified and deliberately mislabeled products in the market to the difficulty of coordinating different supervising departments over a massive and complex food supply chain. These issues have posed a serious threat to the government’s credibility and people’s health. The evidence from our research reveals that, following the endeavors of public and corporate food inspection programs in recent years, consumer confidence in government certification, traceability system, quality grading and brand reputation have been gradually rebuilt, and the domestic food safety situation is changing for the better.
However, due to lack of trust and overlapping functions, an insufficient market demand for third-party certification is speculated to increase unnecessary transaction costs for the economy and might have deviated from the initial policy orientation. At least in the short run, the direct involvement of the Chinese government in food inspection enhancements still requires widespread attention and sustained improvement. Moreover, in the process of aggressively pushing forward the implementation of traceability and grading system, there should exist a need in the long term to broaden consumers’ understanding of complementary food inspection options until they are fully accepted and trusted.
The analysis of consumer preferences, WTP and welfare effects is a beneficial reference when an emphasis is placed on food policy setting and the priority of inspection measures, which contributes greatly to providing fresh thinking for addressing food safety and quality issues in China’s current system. Under the process of relieving the asymmetric food information by virtue of market mechanism, the government supervision together with other increasingly acknowledged feasible options will help develop a sound food market and promote welfare gain.

Author Contributions

conceptualization, W.N. and L.Z.; methodology, software and formal analysis, W.N. and G.L.; investigation and resources, W.N. and T.L.; writing—original draft preparation, W.N.; writing—review and editing, D.A.; visualization and supervision, G.L.; project administration and funding acquisition, L.Z. and T.L.

Funding

This research was funded by National Science Foundation of China, grant number 71173114, Jiangsu Agricultural Science and Technology Innovation Fund, grant number CX(18)3074, Science Foundation of Ministry of Education of China 15YJCZH246 and Priority Academic Program Development of Jiangsu Higher Education Institutions (PAPD).

Conflicts of Interest

The authors declare no conflict of interest. The funders had no role in the design of the study; in the collection, analyses, or interpretation of data; in the writing of the manuscript, or in the decision to publish the results.

Appendix A

Table A1. Latent class model estimation result.
VariablesLatent Class Model
Class 1
Label & Rice Lovers
Class 2
Rice Avoiders
Class 3
Budget Conscious
Class 4
Price Sensitive
Class 5
Label Skeptics
CoefficientS.E.CoefficientS.E.CoefficientS.E.CoefficientS.E.CoefficientS.E.
Main Effect
Govern1.721 ***0.3360.1740.8430.0850.8660.7601.4325.3273.345
Third1.143 ***0.4011.3260.8791.5211.2061.1621.537−1.9922.093
Trace1.223 ***0.295−0.7350.854−0.1170.6770.4601.0183.0262.156
Grade0.1780.2911.0770.751−0.8280.903−0.6290.9451.2742.102
Brand1.400 ***0.294−0.2720.631−0.0430.634−0.0371.0670.4702.915
Price−0.0520.049−0.552 ***0.117−0.920 ***0.117−1.647 ***0.276−1.272 ***0.391
Chooseno−1.648 ***0.274−1.1540.746−6.621 ***0.777−7.656 ***1.285−6.062 ***1.914
Interaction Effect
Govern*Trace−0.0120.1210.1430.284−0.3390.360−1.287 **0.5400.8961.042
Govern*Grade−0.0700.144−0.3740.493−0.5220.429−0.5200.418−0.2490.587
Govern*Brand0.0410.1210.1980.2570.2740.5510.2730.542−1.4690.980
Third*Trace−0.260 **0.1070.2920.2320.2020.3770.4180.367−0.6590.857
Third*Grade−0.1100.143−0.871 *0.4800.0900.3931.175 **0.5860.2890.758
Third*Brand−0.454 ***0.117−0.810 ***0.232−0.1580.3880.9740.6060.1090.914
Trace*Grade−0.0830.081−0.1140.206−0.2850.3200.1690.4190.4920.573
Trace*Brand−0.0260.102−0.3420.211−0.2750.3790.3440.381−0.3940.561
Grade*Brand−0.244 **0.098−0.431 **0.2000.1040.212−0.3390.35560.5640.807
Income*Govern−0.0940.0650.616 ***0.1740.498 **0.194−0.547 **0.2480−0.19230.544
Income*Third0.0100.071−0.313 **0.152−0.2670.278−0.1990.29640.79930.499
Income*Trace−0.121 **0.0570.2150.1630.2601 *0.1450.0780.2777−0.4552 *0.275
Income*Grade0.0840.054−0.0480.1430.1930.1610.1130.2569−0.08430.592
Income*Brand−0.093 *0.0470.1880.1170.331 **0.134−0.1320.31490.23250.440
Edu*Govern−0.0030.110−0.0810.237−0.486 *0.2590.916 **0.4250−1.53241.092
Edu*Third−0.262 **0.1090.1900.2450.3350.356−0.1460.5530.0260.831
Edu*Trace0.0800.0910.556 **0.2470.0370.2040.1600.337−0.7320.642
Edu*Grade0.1060.0950.3300.2100.2340.2780.3280.385−0.1490.731
Edu*Brand−0.0090.0840.694 ***0.221−0.320*0.1750.2900.332−0.1601.018
Class probability43.93119.59519.06010.9326.481
Log likelihood −2614.500
χ2(P = 0.000) 4391.534
McFadden R2 0.464
Notes: ***, **, * denotes statistical significance at 1%, 5%, 10% levels, respectively. Results were estimated using NLOGIT 5.0 with 1000 Halton draws.

References

  1. Akerlof, G.A. The Market for “Lemons”: Quality uncertainty and the market mechanism. Q. J. Econ. 1970, 84, 488–500. [Google Scholar] [CrossRef]
  2. Antle, J.M. Efficient food safety regulation in the food manufacturing sector. Am. J. Agric. Econ. 1996, 78, 1242–1247. [Google Scholar] [CrossRef]
  3. Velde, F. Gresham’s Law. In The New Palgrave Dictionary of Money and Finance; Palgrave Macmillan: London, UK, 2008. [Google Scholar]
  4. Lusk, J.L.; Tonsor, G.T.; Schroeder, T.C.; Hayes, D.J. Effect of government quality grade labels on consumer demand for pork chops in the short and long run. Food Policy 2018, 77, 91–102. [Google Scholar] [CrossRef]
  5. Quan, S.; Zeng, Y.; Yu, X.; Bao, T. WTP for baby milk formula in China: Using attribute nonattendance as a priori information to select attributes in choice experiment. Agribusiness 2018, 34, 300–320. [Google Scholar] [CrossRef]
  6. Wang, J.; Ge, J.; Ma, Y. Urban Chinese consumers’ willingness to pay for pork with certified labels: A discrete choice experiment. Sustainability 2018, 10, 603. [Google Scholar] [CrossRef]
  7. Asche, F.; Larsen, T.A.; Smith, M.D.; Sogn-Grundvag, G.; Young, J.A. Pricing of eco-labels with retailer heterogeneity. Food Policy 2015, 53, 82–93. [Google Scholar] [CrossRef] [Green Version]
  8. Lewis, K.E.; Grebitus, C.; Colson, G.; Hu, W. German and British consumer willingness to pay for beef labeled with food safety attributes. J. Agric. Econ. 2017, 68, 451–470. [Google Scholar] [CrossRef]
  9. Lim, K.H.; Hu, W. How local is local? A reflection on Canadian local food labeling policy from consumer preference. Can. J. Agric. Econ. 2016, 64, 71–88. [Google Scholar] [CrossRef]
  10. China Statistical Yearbook 2017. Available online: http://www.stats.gov.cn/tjsj/ndsj/2017/indexeh.htm (accessed on 1 November 2018).
  11. Zhao, F.; Ma, Y.; Zhu, Y.; Tang, Z.; McGrath, S.P. Soil contamination in China: Current status and mitigation strategies. Environ. Sci. Technol. 2015, 49, 750–759. [Google Scholar] [CrossRef] [PubMed]
  12. Drichoutis, A.C.; Vassilopoulos, A.; Lusk, J.L.; Nayga, R.M. Consumer preferences for fair labour certification. Eur. Rev. Agric. Econ. 2017, 44, 455–474. [Google Scholar] [CrossRef]
  13. Wolfe, E.; Popp, M.; Bazzani, C.; Nayga, R.M.; Danforth, D.; Popp, J.; Chen, P.Y.; Seo, H.S. Consumers’ willingness to pay for edamame with a genetically modified label. Agribusiness 2018, 34, 283–299. [Google Scholar] [CrossRef]
  14. Meyerding, S.G.H.; Gentz, M.; Altmann, B.; Meier-Dinkel, L. Beef quality labels: A combination of sensory acceptance test, stated willingness to pay, and choice-based conjoint analysis. Appetite 2018, 127, 324–333. [Google Scholar] [CrossRef] [PubMed]
  15. Gracia, A.; Loureiro, M.L.; Nayga, R.M. Are valuations from nonhypothetical choice experiments different from those of experimental auctions? Am. J. Agric. Econ. 2011, 93, 1358–1373. [Google Scholar] [CrossRef]
  16. Penn, J.M.; Hu, W.Y. Understanding hypothetical bias: An enhanced meta-analysis. Am. J. Agric. Econ. 2018, 100, 1186–1206. [Google Scholar] [CrossRef]
  17. Loureiro, M.L.; Umberger, W.J. A choice experiment model for beef: What US consumer responses tell us about relative preferences for food safety, country-of-origin labeling and traceability. Food Policy 2007, 32, 496–514. [Google Scholar] [CrossRef]
  18. Louviere, J.J.; Hensher, D.A.; Swait, J.D. Stated Choice Methods: Analysis and Applications; Cambridge University Press: Cambridge, UK, 2000. [Google Scholar]
  19. Alphonce, R.; Alfnes, F. Eliciting consumer WTP for food characteristics in a developing context: Application of four valuation methods in an African market. J. Agric. Econ. 2017, 68, 123–142. [Google Scholar] [CrossRef]
  20. Bernard, J.C.; Liu, Y. Are beliefs stronger than taste? A field experiment on organic and local apples. Food Qual. Preference 2017, 61, 55–62. [Google Scholar] [CrossRef]
  21. Lancaster, K. A new approach to consumer theory. J. Political Econ. 1966, 74, 132–157. [Google Scholar] [CrossRef]
  22. Hensher, D.A.; Rose, J.M.; Greene, W.H. Applied Choice Analysis, 2nd ed.; Cambridge University Press: Cambridge, UK, 2015. [Google Scholar]
  23. Allenby, G.M.; Rossi, P.E. Marketing models of consumer heterogeneity. J. Econ. 1998, 89, 57–78. [Google Scholar] [CrossRef]
  24. Wu, L.; Xu, L.; Zhu, D.; Wang, X. Factors affecting consumer willingness to pay for certified traceable food in Jiangsu province of China. Can. J. Agric. Econ. 2012, 60, 317–333. [Google Scholar] [CrossRef]
  25. Pennings, J.M.E.; Wansink, B.; Meulenberg, M.T.G. A note on modeling consumer reactions to a crisis: The case of the mad cow disease. Int. J. Res. Mark. 2002, 19, 91–100. [Google Scholar] [CrossRef]
  26. Lim, K.H.; Hu, W.; Maynard, L.J.; Goddard, E. A taste for safer beef? How much does consumers’ perceived risk influence willingness to pay for country-of-origin labeled beef. Agribusiness 2014, 30, 17–30. [Google Scholar] [CrossRef]
  27. McFadden, D. Conditional Logit Analysis of Qualitative Choice Behavior; Academic Press: Cambridge, MA, USA, 1974; pp. 105–142. [Google Scholar]
  28. Train, K.E. Discrete Choice Methods with Simulation, 2nd ed.; Cambridge University Press: Cambridge, UK, 2009. [Google Scholar]
  29. Ouma, E.; Abdulai, A.; Drucker, A. Measuring heterogeneous preferences for cattle traits among cattle-keeping households in East Africa. Am. J. Agric. Econ. 2007, 89, 1005–1019. [Google Scholar] [CrossRef]
  30. Ortega, D.L.; Wang, H.H.; Wu, L.; Olynk, N.J. Modeling heterogeneity in consumer preferences for select food safety attributes in China. Food Policy 2011, 36, 318–324. [Google Scholar] [CrossRef]
  31. Krinsky, I.; Robb, A.L. On approximating the statistical properties of elasticities: A correction. Rev. Econ. Stat. 1986, 68, 715–719. [Google Scholar] [CrossRef]
  32. Halton, J.; Smith, G.B. Algorithm 247: Radical-inverse quasi-random point sequence. Commun. ACM 1964, 7, 701–702. [Google Scholar] [CrossRef]
Figure 1. A sample choice set. Interviewers explained the specifications of attributes to respondents prior to the experiment. It should be pointed out here that: (a) The two certification labels of organic rice are respectively a governmental certification and a third-party certification; (b) The quick response code is one of traceability labels that can be scanned to obtain food information; (c) The normal rice and superior rice are respectively classified into four and three grades based on the National Standard Rice (No. GB 1354-2009); (d) Gold Arowana is one of well-known rice brands in China.
Sustainability 10 04003 g001
Figure 2. Locations of nine survey cities in China.
Sustainability 10 04003 g002
Figure 3. Risk perception and risk attitude impacts on willingness-to-pay (CNY/500 g).
Sustainability 10 04003 g003
Table 1. Attributes for real choice experiment: level, effect coding and description.
AttributesLevelCodeDescription
CertificationGovernmentGovern = 1 Third = 0The product carries certification labels issued by the government or domestic third parties, ensuring that it meets the safety requirements.
Third partyGovern = 0 Third = 1
NoGovern = −1 Third = −1
TraceabilityYesYes = 1The product is traceable for the entire information chain including production environment, pesticide usage, shipping, marketing, etc.
NoNo = −1
GradeYesYes = 1Food grading labels represent a comprehensive index of visible sensory characteristics, invisible taste and quality characteristics.
NoNo = −1
BrandYesYes = 1Brand is a unique symbol that distinguishes its products from competitors and transmits quality information to consumers.
NoNo = −1
Price3 The sale price for a unit of rice is CNY/500 g (500 g = 1 jin, a Chinese unit of measurement). A unit of currency CNY ≈ 0.15 USD in June 2018.
5
7
Table 2. Sociodemographic statistics.
VariablesGroupProportion (%)Mean (Std. Dev.)China Census Data
Age17–2413.7539.64 (15.08)37.35
25–3432.73
35–4417.84
45–5417.47
55–6410.78
>647.43
GenderMale37.92 51.01
Female62.08 48.99
Household size(person)1–229.553.13 (1.30)2.90
3–456.33
>414.12
Monthly household income<3k4.83
(CNY)3k–6k18.77
6k–10k33.84
10k–15k23.98
15k–20k10.22
>20k8.36
Monthly per capita income(CNY) 3611.023413.92
EducationJunior school or below13.0114.1511.68
Senior school23.79
Undergraduate53.91
Graduate9.29
Primary shopperYes60.41
No39.59
Risk perception 2.43 (0.99)
Risk attitude 3.84 (1.42)
Note: Mean values of China census data are collected from 1% National Population Sample Survey 2015, except for per capita income collected from Chongqing, Changsha and Nanjing Statistical Yearbook 2017 [10].
Table 3. Model estimation results.
VariablesRandom Parameters LogitLatent Class Model
Class 1
Label & Rice Lovers
Class2
Price Sensitive
Class 3
Rational Consumers
CoefficientS.E.CoefficientS.E.CoefficientS.E.CoefficientS.E.
Main Effect
Govern0.6925 ***0.18411.0111 ***0.27071.0985 **0.43091.2380 **0.5666
Third0.6207 ***0.16601.0360 ***0.28800.13090.44491.2878 **0.5782
Trace0.3191 **0.15040.6572 ***0.22610.33690.32580.9376 **0.4651
Grade−0.09130.13560.20750.2034−0.14810.3087−0.73250.4544
Brand0.20720.15230.8410 ***0.2227−0.14610.30040.09370.3253
Price−0.4476 ***0.0216−0.0752 ***0.0180−0.9642 ***0.0791−0.9108 ***0.0994
Opt-out−2.8376 ***0.1210−1.1722 ***0.2042−4.2578 ***0.3702−6.1841 ***0.5887
Interaction Effect
Govern*Trace−0.02220.05390.13320.0860−0.04820.1407−0.5524 **0.2629
Govern*Grade−0.1397 ***0.0504−0.02190.0835−0.21070.15040.08470.2189
Govern*Brand0.07360.05480.12880.0905−0.09020.14340.5422 **0.2506
Third*Trace−0.1418 ***0.0510−0.2241 ***0.07990.11560.1476−0.03950.2307
Third*Grade−0.02960.0512−0.11980.08460.3522 **0.1498−0.29720.2108
Third*Brand−0.2566 ***0.0543−0.3196 ***0.08830.07230.1514−0.29920.2389
Trace*Grade−0.06280.0410−0.04940.06660.00300.10490.24180.1724
Trace*Brand−0.1096 **0.04330.02370.0673−0.07750.10610.17210.1926
Grade*Brand−0.06100.0405−0.08130.0697−0.00890.09690.08160.1339
Income*Govern0.1460 ***0.04100.1273 **0.05860.01030.10960.02230.1100
Income*Third−0.01040.0362−0.09170.05720.09140.09950.01720.1310
Income*Trace0.0588 *0.0332−0.01230.04700.02450.08200.07930.1017
Income*Grade0.1020 ***0.03020.0873 **0.04190.02080.07280.2113 **0.1062
Income*Brand0.0840 **0.0337−0.01390.04400.1260*0.07420.1151 *0.0688
Edu*Govern0.03480.0610−0.05110.0864−0.23660.1538−0.00930.1688
Edu*Third−0.08830.0547−0.12910.0919−0.08420.1500−0.05600.1931
Edu*Trace0.1442 ***0.04990.11390.0732−0.03680.10760.05450.1458
Edu*Grade0.1982 ***0.04490.08840.06540.2879 ***0.10360.10650.1506
Edu*Brand0.1711 ***0.05060.11070.07020.11920.1015−0.10640.1029
Standard Deviations of Parameter Distributions
sdGovern0.6094 ***0.0664
sdThird0.2783 ***0.0867
sdTrace0.4552 ***0.0530
sdGrade0.2970 ***0.0592
sdBrand0.5618 ***0.0719
Class probability 54.88820.64324.470
Log likelihood−2798.1085−2612.3888
χ2(P = 0.000)3860.63764232.0770
McFadden R20.40820.4475
Notes: ***, **, * denotes statistical significance at 1%, 5% and 10% levels, respectively. Results were estimated using NLOGIT 5.0 with 1000 Halton draws.
Table 4. Income and education impacts on willingness-to-pay (CNY/500 g).
Random Parameters LogitLatent Class Model
Class 1
Label & Rice Lovers
Class 2
Price Sensitive
Class 3
Rational Consumers
CNYCICNYCICNYCICNYCI
Lower income < 3k, Lower education = Junior school or below
Govern3.9037[3.8876,3.9198]29.7667 [29.5658,29.9675]1.8246[1.8074,1.8418]2.7367 [2.7118,2.7617]
Third2.3509[2.3360,2.3658]22.5162 [22.2930,22.7394]0.2781[0.2611,0.2952]2.7611 [2.7330,2.7892]
Trace2.3350[2.3219,2.3480]20.9226 [20.7443,21.1009]0.6836[0.6714,0.6959]2.3565 [2.3360,2.3769]
Grade0.9354[0.9240,0.9467]10.4722 [10.3614,10.5831]0.3291[0.3175,0.3406]−0.9124 [−0.9325,−0.8923]
Brand2.0686[2.0556,2.0815]25.7534 [25.5668,25.9400]0.2064[0.1954,0.2174]0.2341 [0.2199,0.2484]
Sample average income = 12k, average education = Senior school or Undergraduate
Govern5.7309[5.7221,5.7398]35.9483 [35.7654,36.1312]1.0776[1.0694,1.0859]2.8423 [2.8273,2.8573]
Third1.5947[1.5872,1.6021]10.9001 [10.7878,11.0124]0.4750[0.4663,0.4837]2.6651 [2.6476,2.6826]
Trace3.9927[3.9856,3.9998]24.9435 [24.8074,25.0796]0.6777[0.6710,0.6845]2.9673 [2.9541,2.9806]
Grade3.4510[3.4453,3.4566]19.9191 [19.8479,19.9903]1.3925[1.3865,1.3985]0.5917 [0.5825,0.6010]
Brand4.1943[4.1872,4.2014]29.6432 [29.4957,29.7907]1.2377[1.2312,1.2441]0.4759 [0.4678,0.4840]
Higher income > 20k, Higher education = Graduate
Govern7.6399[7.6211,7.6586]42.8423 [42.6005,43.0842]0.4487[0.4262,0.4712]2.9533 [2.9294,2.9773]
Third0.9219[0.9068,0.9370]−0.7881 [−0.9269,−0.6493]0.7324[0.7082,0.7567]2.5708 [2.5422,2.5995]
Trace5.6006[5.5857,5.6156]28.3982 [28.2275,28.5688]0.6899[0.6712,0.7086]3.6042 [3.5812,3.6271]
Grade5.8786[5.8654,5.8918]29.3053 [29.1746,29.4360]2.3454[2.3289,2.3618]2.1259 [2.1066,2.1453]
Brand6.2503[6.2352,6.2654]32.7333 [32.5600,32.9065]2.2655[2.2476,2.2834]0.7945 [0.7786,0.8104]
Note: WTP and 95% confidence intervals were simulated using Krinsky & Robb’s parametric bootstrapping method with 5000 draws.
Table 5. Consumer welfare effects (CNY/500 g).
Random Parameters LogitLatent Class Model
Class 1
Label & Rice Lovers
Class 2
Price Sensitive
Class 3
Rational Consumers
CNYCICNYCICNYCICNYCI
Choice Welfare (CNY/choice/person)
Govern1.3996[1.3988,1.4004]6.2211[5.6304,6.8118]0.1683[0.1680,0.1686]0.5144[0.5138,0.5150]
Third0.0050[0.0048,0.0051]0.0586[0.0011,0.1162]0.2424[0.2420,0.2428]0.4049[0.4045,0.4054]
Trace0.3628[0.3620,0.3636]2.1394[1.7886,2.4902]0.1359[0.1356,0.1362]0.5949[0.5940,0.5958]
Grade0.5494[0.5487,0.5501]1.7702[1.4982,2.0422]0.4014[0.4009,0.4019]0.1975[0.1970,0.1980]
Brand0.8781[0.8772,0.8791]4.6736[4.1444,5.2029]0.3163[0.3159,0.3167]0.1996[0.1990,0.2002]
Individual Welfare (CNY/year/person)
Govern13.3579[13.3503,13.3655]59.3746[53.7370,65.0123]1.6063[1.6034,1.6091]4.9095[4.9037,4.9152]
Third0.0477[0.0458,0.0487]0.5593[0.0105,1.1090]2.3135[2.3097,2.3173]3.8644[3.8606,3.8692]
Trace3.4626[3.4550,3.4702]20.4186[17.0705,23.7667]1.2970[1.2942,1.2999]5.6778[5.6692,5.6864]
Grade5.2435[5.2368,5.2502]16.8949[14.2989,19.4909]3.8310[3.8262,3.8358]1.8850[1.8802,1.8897]
Brand8.3807[8.3721,8.3902]44.6052[39.5545,49.6569]3.0188[3.0150,3.0226]1.9050[1.8993,1.9107]
National Welfare (billion CNY/year)
Govern68.5753[68.5364,68.6144]304.8114[275.8695,333.7534]8.2461[8.2314,8.2606]25.2037[25.1741,25.2332]
Third0.2450[0.2351,0.2500]2.8712[0.0539,5.6933]11.8767[11.8573,11.8963]19.8386[19.8192,19.8633]
Trace17.7759[17.7369,17.8150]104.8229[87.6348,122.0110]6.6586[6.6440,6.6733]29.1480[29.1040,29.1923]
Grade26.9186[26.8841,26.9529]86.7334[73.4062,100.0604]19.6672[19.6426,19.6918]9.6768[9.6524,9.7011]
Brand43.0237[42.9798,43.0727]228.9895[203.0608,254.9235]15.4976[15.4781,15.5171]9.7797[9.7504,9.8090]
Notes: Welfare and 95% confidence intervals were simulated using Krinsky & Robb’s parametric bootstrapping method with 5000 draws. The welfare effects of losing the option to choose attribute labels were calculated to be negative. For illustration purposes, absolute values are presented here.

