1. Introduction
The development of new trends on the Internet caused, on the one hand, an increase in the social engagement of Internet users, and on the other, the development of various types of web application solutions that are based on the ideological and technological foundations of Web 2.0 [
1]. What makes these solutions—referred to as social media—stand out from other media is the fact that the message transmitted through them goes from the sender to the recipient, after which feedback may occur and the recipient has the opportunity to answer the sender in real time [
2,
3]. What is more, it is the users themselves that are very often the active creators of social media. Therefore, these media, in the 21st century, play an increasingly important role, not only in manufacturing companies, but they are also successfully used by entities in the cultural sector. Thanks to them, managers of cultural institutions can [
4,
5]:
- (i)
strengthen the awareness of cultural institution brands,
- (ii)
strengthen the perception of the brand’s quality and build its positive image,
- (iii)
build loyalty towards cultural institutions,
- (iv)
follow the trends visible on the market, and
- (v)
gain knowledge about their surroundings (consumers, competitors, donors, etc.).
The research conducted by the authors of the study, which were carried out in cultural institutions in the Euroregion Śląsk Cieszyński in 2015 and 2016 [
6,
7] shows that, in recent years, the range of social media used has increased in the marketing activities of cultural institutions. This is evidenced by the high percentage of Polish and Czech cultural institutions, which for at least one year, but not more than five years, have a profile not only on Facebook (66.5%), but also Twitter (48.5%), Instagram (32%), and YouTube (15.5%). This should therefore be seen as a response of the cultural institutions to new trends in consumer behaviours that are associated with the virtualization of the consumer’s method of gaining information or a decision-making process relating to purchases in the cultural sector. It can be assumed that this will also translate into the growing activity of Polish consumers of culture services in social media (consumption, contribution, and creation of content), and thus these media will become a key instrument for building the brand equity of cultural institutions.
In cultural institutions, social media open new communication channels that give them direct access to consumers and opinion-forming centres [
8]. However, it should be emphasised that social media are more than just communication tools. They allow for a new mode of action, which requires new information flows. These, in turn, have an impact, not only on the communication or distribution of services [
9], but, what is very important, they also have a significant impact on building the brand equity of cultural institutions. Therefore, the recognition and classification of consumer behaviour on the Internet has become justified.
The first attempt to systematise consumer behaviour regarding brands in social media was made by G. Shao. In his approach, consumption, co-participation, and brand content creation were among those behaviours [
10]. This approach was extended and refined in the research and findings of D.G. Muntingi et al. [
11]. For the purpose of this study, it is the Muntingi approach (the so-called COBRA model—consumer’s online brand-related activities) that has been adapted to the needs of assessing the activity of consumers of cultural services in social media. Similarly, as in the COBRA model, a solution was proposed—the so-called 3C sustainable system—based on three components of activity of culture services consumers. The customers are not the passive side in the act of exchange. In the model the sustainable assumption has been made, that the consumer is also creating values and contributes to the culture. Such assumption is connected with the paradigm of relationship marketing as well with sustainable paradigms. It is quite likely that the struggle for a sustainable future will transform many facets of “our” society, from politics and economics to cultural values, and, possibly, human rights. The presented model is sustainable because is defined by an equilibrium point from different aspects, not just by the number of its elements. In the case of our research, we have focused on three aspects, which are connected with relationship paradigm in marketing actions of cultural organisations. In the opinion of the authors, the activity of consumers of culture in social media should be sustainable, i.e., take place at the level of three “Cs”:
- (i)
Consumption—requiring only the passive reception of content related to a specific cultural institution’s brand, placed online by other Internet users or employees of cultural institutions (e.g., viewing photos, videos, viewing ratings, and comments about cultural institutions, reading discussions about events organised by the institution on social networks [
12]);
- (ii)
Contribution—contributing to the creation of content related to the cultural institution’s brand, by participating in discussions about events organised by the institution on fan pages, writing comments about cultural institutions or adding content related to them (e.g., photos, graphics, videos) on blogs and fan pages etc;
- (iii)
Creation—consisting in creating and publishing content about cultural institutions that will be later consumed or contributed by others (e.g., running blogs dedicated to specific cultural institutions, publishing reviews of events organised by the institution, creating and posting videos, photos, graphics, or sound files that are related to a specific cultural institution.
The sustainable activity of consumers of services of cultural institutions takes place at three different levels (3C sustainable system), and, in the opinion of the authors, positively influences the brand equity of cultural institutions. That is why it has become the subject of scientific research in 2018 that was conducted by authors this article.
Before discussing the concept of the brand equity of cultural institutions, we should determine whether a cultural institution can be a brand. Products, not cultural entities, are most often referred to in the context of brand equity. In the opinion of the authors, however, there is no doubt in this matter. If, for example, we were to ask a representative group of Poles which cultural institutions operating in the world have the strongest brands, then probably the names of such institutions as the Louvre Museum, the Royal Opera House or the New York Philharmonic would be mentioned. A strong and well-known brand of a cultural institution, which has a positive association, means that millions of people trust it and its offer enjoys a great and unflagging interest, which, in turn, translates into brand equity and further positive financial results of the organisation. W. Olins writes about activities strengthening the power of a cultural institution’s brand, citing the “Polishing the Diamond” report that was issued by a team of English experts. Olins claims that the brand is of key importance to the activities of a cultural institution [
13], which is why it is fully justified to use the term “cultural institution’s brand”. The consumer-based brand equity (CBBE) of a cultural institution, in line with the findings of B. Yoo and N. Donthu, will therefore be the difference in consumer behaviour towards cultural institutions with an established position (recognisable brand) and a little-known institution that occurs in a situation where both institutions have the same marketing support and they have the same characteristics [
14] (p. 1). In the opinion of K.L. Keller, CBBE means knowledge about the brand, consisting of brand awareness and image [
15] (pp. 1–22). In turn, according to D.A. Aaker, it is a set of assets and liabilities that are related to the brand, its name, and mark, which can be attached or subtracted from the total value of the service for a cultural institutions and its clients [
16] (p. 1). Among these assets, Aaker includes:
- (i)
Brand awareness—the strength with which the brand of a cultural institution is present in the mind of the consumer, and therefore which refers to the ability of the consumer to recognise or recall a specific brand in a given category of institutions or products [
17],
- (ii)
Brand associations—everything that, according to the consumer, concerns the cultural institution’s brand [
17]. They are related to creating the image of a cultural institution’s brand in the mind of the consumer, the type of institution, product category, conditions in which the consumer operates, awareness of the existence of cultural institutions and brand features, marks, and symbols [
18],
- (iii)
Perceived brand quality—consumer perception of the general quality of the cultural institution’s service or belief in its superiority in comparison with the alternative services of other organisations. It is a very hard to explain a feeling about a brand, based on the traits of services that are related to the cultural institution’s brand, such as reliability and efficiency [
14],
- (iv)
Brand loyalty—consumer attachment to the cultural institution’s brand. Loyalty reflects the likelihood of the consumer switching to another cultural institution, for example, when the price of its services or brand features changes [
14],
- (v)
Other assets—in particular, patents, trademarks, and relations occurring in distribution channels.
When considering the fact that the last component of brand equity (other assets) is not related to the consumer’s perspective (referring to the organisation—cultural institution), only the first four components will be taken into account in the presented research, as is commonly done in research on the CBBE. Studies carried out so far also prove that brand awareness and brand associations can be combined into one dimension [
14], which is why they will be considered jointly in the article. It is also acceptable to treat the components of the CBBE as a single variable referred to as the overall brand equity.
The first reference to the concept of the CBBE related to brand equity in online commerce and services can be found in 2006. At that time, the first attempt was made to measure the CBBE taking into account the specificity of the Internet [
19] (pp. 799–825). So far, however, there are no references of this concept regarding the sphere of culture, and therefore there are no studies indicating the possibilities of its application in cultural institutions. Research on the impact of online consumer activity on the brand equity of cultural institutions is still at a very early stage of development. Therefore, this article is an attempt to fill the research gap in this area.
2. Materials and Methods
Three research hypotheses were put forward for the purposes of the study:
Hypothesis 1 (H1). 3C sustainable system positively affects brand awareness/association with the brand of a cultural institution.
Hypothesis 2 (H2). 3C sustainable system has a positive impact on the perception of the brand quality of a cultural institution.
Hypothesis 3 (H3). 3C sustainable system has a positive impact on loyalty to the cultural institution’s brand.
To verify the hypotheses, confront the theoretical construction with the empirical model developed on the basis of data—in 2018, a survey was conducted on a group of 1021 Polish consumers of cultural services, who at the same time regularly use social media. In this article, the 3C sustainable system has been treated as a single latent variable, consisting of consumption, contribution, and creation, and we expect it to correlate and exert a positive influence on the consumer-based brand equity (CBBE) of a cultural institution.
In order to examine the impact of the 3C sustainable system (activity of Polish consumers of cultural services in social media) on the CBBE (consumer-based brand equity), data collected using a standardised online survey were used. 1837 respondents took part in the survey. The sample largely reflects the profile of the group of Polish internet users who use social media in Poland—according to the Gemius study. Apart from research agencies, during our research we were also taking under consideration research conducted by M. Grzesiak and described in his book [
8] (pp. 51–56). He is presenting in his work deep characteristics of young generations in Poland and in US. We can also find the detailed portrait of polish e-commerce users in work of M. Jaciow and R. Wolny [
20] (pp. 57–96, pp. 100–112).
As a result of the verification, incomplete questionnaires, and those with errors, as well as questionnaires filled in by respondents who replied that they have never used social media, were rejected. This ultimately gave 1021 correctly filled-out questionnaires. Women accounted for 68.3% of the sample, men for 31.7%. The majority of respondents (34.6%) were young people aged 29–38 and 19–28 (34.1%). The largest group were respondents with higher education (69.7%), 27.1% of respondents were people with secondary education (
Table 1).
In order to capture the online activity of respondents in social media (dimensions of the 3C sustainable system), they were asked to respond to 15 statements on the seven-level Likert scale, ranging from the “very rarely” to “very often”. The components and individual elements of the 3C sustainable system used to measure the activity of Polish consumers of cultural services in social media are presented in
Table 2.
Statements used to measure brand awareness of cultural institutions, perception of brand quality of cultural institutions and loyalty to the brand of cultural institutions—the CBBE system (nine statements) were taken from the source literature and also adapted to the seven-point Likert scale, ranging from the answer “strongly disagree” (1) to “strongly agree (7). The awareness of the existence of the brand of a cultural institution and the perceived brand quality of a cultural institution was measured with the help of six statements that were proposed by B. Yoo et al. [
14,
21], A.F. Villarejo-Ramos, and M.J. Sánchez-Franco [
22]. To measure brand loyalty, we used three statements by G. Walsh et al. [
23] (
Table 3).
The analyses employ a combination of exploration and confirmatory statistics. First of all, the analysis of the reliability of the components of the 3C sustainable system was used to measure the activity of Polish consumers of culture services in social media [
24]. It was carried out using SPSS software and the
Reliability Analysis module. As the analytical model, Cronbach’s alpha internal consistency model, based on the average correlation between the scale positions, was chosen [
25]. Cronbach’s alpha coefficient is used to assess the reliability of the measuring tool. The value of the coefficient exceeding a level of 0.7 is assumed to be acceptable values—in the analysed case, it was 0.945. The results of evaluating the reliability of the measurement tool for the 15 components (statements) of the 3C system therefore indicate that it is highly reliable for the “Consumption” component (Cronbach’s alpha coefficient 0.881), the “Contribution” component (0.925), and the “Creation” component (0.906), which is why the authors predicted that this system can be considered as sustainable. All of the items describing components of the 3C sustainable system used to measure the activity of Polish consumers of cultural services in social media are strongly correlated with the total scale.
3. Results
Most respondents declared that they most often use the services of cultural institutions, such as the cinema (53.1%), library (20.2%), and theatre (8.5%). The respondents usually use these cultural institutions once a month (35.6%)—
Table 4.
All of the respondents use social media (Facebook, Twitter, Instagram). As definitely the most popular device for viewing content on the Internet, the respondents have indicated mobile phones (smartphone—96%). A desktop computer (27.2%), a portable computer (laptop—17%), and a tablet (notebook—18.3%) are also popular—
Table 5.
In total, the brands of 387 different cultural institutions were analysed, belonging to such categories as: cinema (53.1%), library (20.2%), theatre (8.5%), community centre (6.6%), museum (4.2%), philharmonic (2.3%), art gallery (1.4%), and opera and operetta (0.9%).
Exploratory factor analysis was carried out using the Principal Component Analysis (PCA, Variable Selection) and orthogonal Promax rotation using SPSS software [
22]. The adequacy coefficient of the Kaiser-Meyer-Olkin sample (KMO) was 0.931, while the Barrett sphericity test proved to be significant (χ
2 = 13057,836,
p < 0.001). The KMO measure indicates whether the variables were correctly presented in the sample. Its high level (0.931), exceeding the value of 0.5, indicates the validity of using the factor analysis. The possibility of applying this analysis was also confirmed by the p-value value, which is below 0.001—the hypothesis about the correlation matrix being an identity matrix was rejected, therefore there are correlations between the analysed variables indicating the existence of unobservable factors. The obtained results indicated their suitable matching with the data—however, two of the scales used were eliminated from the analysis. For variable (1.1), no value was displayed, because it is lower than 0.5 (this level of presentation of the result was indicated in the assumptions of the analysis). This variable is poorly correlated with both factors. In addition, an indirect analysis indicated that the variable (2.1) should also be removed.
When considering the degree of the explanation of the variability of the input set of variables, we managed to detect two factors explaining over 67% of the information for the set of 13 observable variables (
Table 6).
The results from
Table 6 show that 13 variables (statements) from all input variables have been assigned to the relevant factors. The composition of the factors is as follows:
- (i)
Factor 1: (2.3), (2.2), (2.4), (1.3), (1.2), (1.4), (1.5), and
- (ii)
Factor 2: (3.4), (3.3), (3.5), (2.5), (3.2), (3.1).
Using Promax’s oblique rotation to ensure the occurrence of a relationship between the factors, this relationship is shown at the level of 0.687, which means a strong positive relationship. An increase in the level of one factor increases the level of the other one.
In the next part, an analysis of the reliability of components that are used to measure the components of the CBBE system was carried out (awareness of a cultural institution’s brand, perception of the quality of a cultural institution’s brand, and loyalty to a cultural institution’s brand). This analysis was carried out (similarly to the 3C sustainable system) using SPSS software and the Reliability Analysis module. All of the assumptions are analogous to the 3C sustainable system discussed above. Testing the reliability of the measurement tool indicates its acceptable level (0.751), exceeding the value of 0.7. The variables used in the analysis are moderately strongly correlated with the total scale. Analysing the questions as a whole, it was noticed that questions (6.1), (6.2), and (6.3) are poorly correlated with the total scale and their removal increases the Cronbach’s alpha value. However, taking into account that all three questions define loyalty to the cultural institution’s brand, it was decided not to eliminate them from further analysis. All nine variables were left.
As in the case of the 3C sustainable system, exploratory factor analysis was carried out with respect to the components of the CBBE system while using the Principal Component Analysis (Variable Selection) and orthogonal Promax rotation in SPSS software. In this case, the adequacy coefficient of the Kaiser-Meyer-Olkin sample (KMO) was 0.782, while the Barrett sphericity test proved to be significant (χ2 = 4472.921, p < 0.001).
The obtained results indicated their matching with the data—none of the used scales were eliminated in the analysis. Considering the degree of explanation of the variability of the input set of variables, it was possible to detect three factors explaining over 65% of the information for the full set of 9 observable variables (
Table 7).
Analysing the results from
Table 7, it was observed that all input variables have been assigned to the relevant factors. The composition of the factors is as follows:
- (i)
Factor 1: (4.2), (4.3), (4.1),
- (ii)
Factor 2: (5.2), (5.1), (5.3), and
- (iii)
Factor 3: (6.3), (6.2), (6.1).
The results of the analysis show that it was possible to generate three factors that clearly correspond to the components of the CBBE system used to measure brand awareness/associations with the brand of a cultural institution, the perceived quality of cultural institution’s brand and loyalty to the cultural institution’s brand. Factor loadings are high, showing a very strong correlation between observable input variables and hidden factors. A moderately strong correlation was observed between factor 1 (brand awareness/associations with the brand) and factor 2 (brand quality perception), while dependencies are very weak between the remaining pairs of factors, which rather suggests their independence.
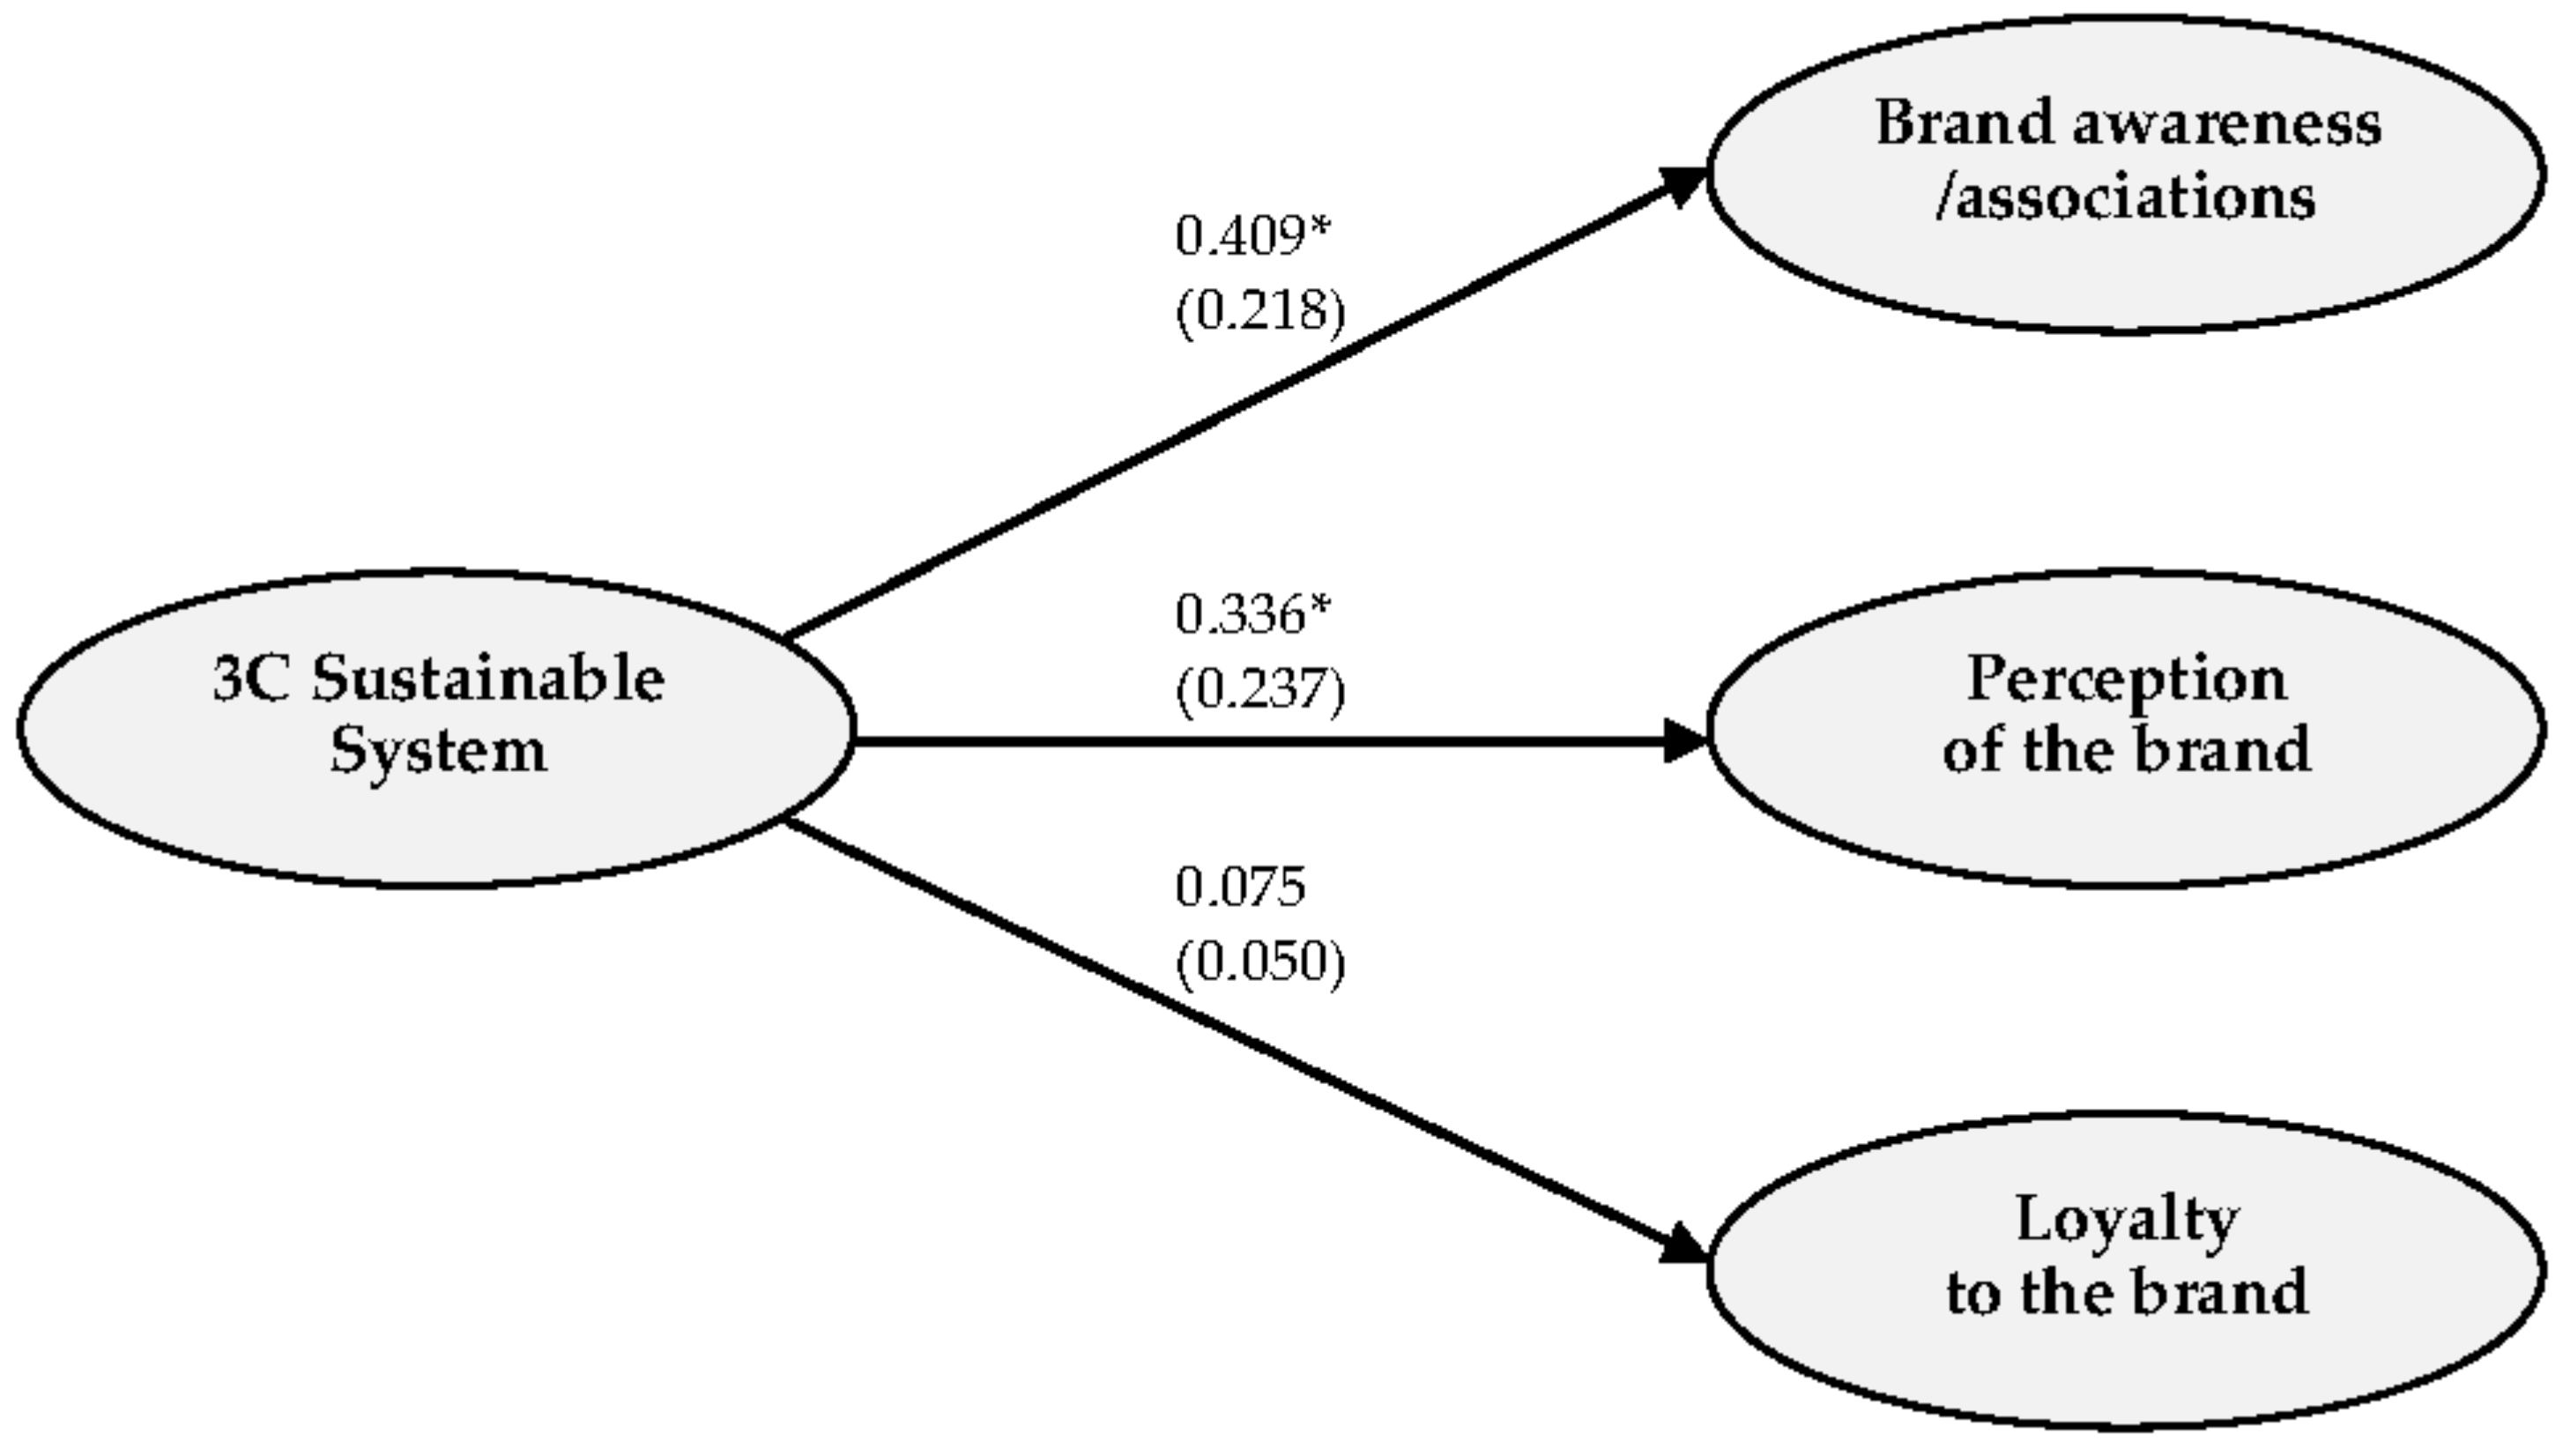
In order to test the research hypotheses established and the conceptual model, latent variables were placed in the structural equation model (SEM). The SEM analysis was based on a factor model estimated using the PCA (Variable Selection) in correspondence to the obtained results, which did assume the elimination of two variables (1.1, 2.1). The 3C sustainable system that was used to measure the activity of Polish consumers of cultural services in social media was analysed as a second-order factor consisting of first-order latent variables (consumption, contribution, and creation). On the other hand, the CBBE system that was used to measure the brand equity based on the consumer consisted of three latent variables (brand awareness/associations with the cultural institution’s brand, perceived quality of the institution’s brand, and loyalty to the cultural institution’s brand). The results obtained have shown that the conceptual model has achieved the appropriate matching levels—
Figure 1. Statistically significant relations were marked with the symbol (*) and standard regression coefficients were given in brackets.
The results presented in
Figure 1, obtained for the reduced model based on the PCA method, indicate that the positive impact of the 3C sustainable system used to measure the activity of Polish consumers of culture services in social media was found on the components of the CBBE system used to measure brand equity, however statistical significance (*) was confirmed only for the relation of the 3C sustainable system and the CBBE component “brand awareness/associations with the brand”, and for the relation between the 3C sustainable system and the CBBE component “brand quality perception”. The relations are positive, which means that the 3C sustainable system acts as a stimulant for the CBBE system components. Thus, along with the increase in the activity of consumers of cultural services in social media, the level of brand equity that is based on the consumer increases. The strength of impact is measured using the standardised regression coefficient—this impact is weak but comparable. However, for the relationship with loyalty to the brand, this impact is negligible, which is related to the lack of relevance for this relationship.
Table 8 presents selected indicators for matching the theoretical construct to empirical data.
The index values that are presented in
Table 8 confirm that the theoretical model is well matched to the empirical data.
Commenting on the final results of the SEM analysis carried out using the PCA method and referring them to the stated research hypotheses, it was found that:
- (i)
Hypothesis 1: the 3C sustainable system positively affects brand awareness/associations with the cultural institution’s brand—the null hypothesis proclaiming no influence was rejected, therefore Hypothesis 1 was confirmed
- (ii)
Hypothesis 2: the 3C sustainable system positively affects the perception of the cultural institution’s brand—the null hypothesis proclaiming no influence was rejected, therefore Hypothesis 2 was confirmed
- (iii)
Hypothesis 3: the 3C sustainable system positively affects brand loyalty—there are no grounds to reject the null hypothesis stating that there is no relationship, therefore Hypothesis 3 has not been confirmed.
Summing up the results of the research that is based on the reliability analysis, factor analysis and SEM analysis, it should be stated that the 3C sustainable system stimulates the CBBE system components. Statistically significant relationships have been observed for components that are related to brand awareness/associations with the cultural institution’s brand and for the relationship related to the perception of quality of the cultural institution’s brand. However, no statistically significant relationship has been demonstrated for the impact of the 3C sustainable system on loyalty to the cultural institution’s brand.
4. Discussion
In the second decade of the 21st century, significant qualitative changes have been occurring, resulting in new opportunities to strengthen the brand equity of cultural institutions. Websites, Facebook profiles, or YouTube channels are becoming the foundation of building long-term relationships, creating the image of a cultural institution and the primary source of information about the organisation, its activities and offer. This is also confirmed by the results of the research, which are presented in the article. As the authors of the study show, the activity of consumers of cultural institutions on the Internet, in particular, in social media, stimulates the brand’s awareness/associations with the brand of a cultural institution and the perception of its quality. Research that was conducted by M. Sobocińska [
26] (p. 214), however, shows that not all managers of cultural institutions are fully aware of these facts. Although almost all Polish cultural institutions subjected to the study (the study covered 451 institutions) have their own website (99.1%), only 77.4% of them have a Facebook profile. Managers of the cultural institutions in Poland, mentioned creating the image of the cultural institution, developing relationships with consumers of culture, and advertisement of the cultural institution as the main goals of using social media. This was indicated by 71.2%, 51.3%, and 44.9% of the respondents, respectively. All three responses are therefore related to the consumer-based brand equity (CBBE), because they have a significant impact on brand awareness, the perception of its quality or loyalty to the cultural institution’s brand.
Table 9 presents the most important goals—indicated by the surveyed managers of 451 entities in the cultural sector in Poland—in the use of social media in the cultural sector.
Sobocińska’s research also shows that social media are gaining importance in Poland and are becoming a more important tool in the cultural institutions’ communication with the market [
26]. Studies conducted by Pew Research Center on 1244 non-governmental organisations operating in the US prove that American cultural institutions mainly use social media in their activities, such as: Facebook (99%), Twitter (74%), YouTube (67%), Flickr (38%), LinkedIn (31%), Wikipedia (27%), Vimeo (23%), Foursquare (20%), Yelp (19%), and Google+ (17%) [
27]. Out of the surveyed organisations, 12.2% have four profiles in social media, 11.9% have three profiles, 11.3%—five profiles, 11.1%—two profiles, and 10.6% as many as six [
27] (p. 27). It is worth noting that every fourth organisation publishes content on social media several times a day (25%), and every fifth one—once a day (20%). In addition, 28% publish content several times a week, and 16%—once a week. Similarly to Sobocińska’s research, it follows that the role of social media in the coming years will be even more significant [
26].
The research that was conducted by the authors shows that statistically significant relations have been observed in particular for components related to the awareness of a cultural institution’s brand and for the relationship related to the perception of its quality. However, no statistically significant relationship has been demonstrated for the impact of the 3C sustainable system on loyalty to the cultural institution’s brand. Therefore, we should think about what has a significant impact on this state of affairs. The mere consumption of content, tracking (“liking”) the profile of a cultural institution on a website such as Facebook can be very beneficial to users, and at the same time does not bind the Internet user to any obligation towards the cultural institution. The research conducted for MuseumNext in April 2011 on 500 residents of the United Kingdom shows that people who follow the profile of a cultural institution in social media do it mainly because they want to [
27]:
- (i)
provide support in the promotion of this institution (47%),
- (ii)
impress their friends by visiting this institution (38%),
- (iii)
obtain promotional online discounts or see announcements about upcoming exhibitions (35%),
- (iv)
identify with the opinions or style represented by a given cultural institution in social media (31%),
- (v)
visit a given cultural institution (20%), and
- (vi)
inform their friends that they value cultural institutions (11%).
Profiles of cultural institutions in social media can be attractive in themselves for the users of these media, which makes them willingly consume content about the cultural institution, and often even share their opinions about it (contribution). The first two components of the 3C sustainable system (consumption and contribution) do not usually involve a large intellectual effort for the user of social media, which is why this activity can be observed most often. The third component of the 3C sustainable system—the creation of content that is related to a cultural institution in social media requires the Internet users to be much more involved than just consumption of content or contribution. It also often requires specialist knowledge and appropriate skills (e.g., preparation of appropriate graphics or a short film), which is why this type of involvement occurs in the Internet space less frequently than the aforementioned consumption or contribution. The mere consumption of content or contribution probably have a big impact on the brand’s awareness and even the perception of its quality, but it seems that in the process of building loyalty to the cultural institution’s brand, the creation of content online, which as mentioned above, occurs much less frequently than the other two components of the 3C sustainable system, is the most important.
The reasons for the activity of consumers of culture services on social media can be found in the economic, psychological, and social regularities of consumer behaviour on the market of culture services. Among them, we should indicate, for example, the effect of demonstration (the tendency to be similar to others) or the “halo” effect (positive assessment of a given product or service if it has at least one advantage with a significant intensity) [
28]. However, the most important thing is to pay attention to the fact that social media users are happy to inform their friends about any of their activities related to a given cultural institution, because they want to feel that they participate in something important, want to impress others with their lifestyle and raise their social status [
2,
26]. On the other hand, if they see that their friends are involved in a cultural event, they also want to participate, for example, in order not to stand out from others. In addition, there is a snowball effect in social media [
29]. This is the process of a “viral” increase in the number of people that are involved in a given event, thanks to the fact that they were persuaded by others who had been persuaded to it earlier [
30,
31]. So, if, for example, users intend to take part in a symphonic concert, they encourage their friends to do it, and those in turn their friends, etc. Thanks to this kind of effect, based on the activity of consumers of cultural services in social media, it is possible to actively and steadily develop the brand equity of cultural institutions, in particular, brand awareness and its perceived quality.
However, when reaching for social media in the process of building the brand equity of a cultural institution, it should be remembered that they are governed by slightly different laws than typical marketing communication tools. The particularly important ones are: openness, transparency, informality, and equality of users. An important implication of these characteristics is a willingness for sincere dialogue with users. Institutions need to be aware that interactions with the community (often anonymous) can be both positive and negative, which can affect the brand equity in both positive and negative ways. The latter interactions, criticising the cultural institution, the initiatives and subjects presented, are especially difficult. Examples include harassing comments to certain posts made by artists appearing on social networks, or often non-related comments on film materials that are posted on YouTube. In addition, there still remains the rational and substantive criticism of the published content and of the activities to which it relates, which often cannot be simply ignored. Its existence requires the cultural institution to determine appropriate guidelines in such cases. Of course there is also the option to disable commenting, but this takes away invaluable feedback, thanks to which the institution can not only build the brand equity but also improve its operations and adapt them to the needs of its customers [
32].
5. Conclusions
In summary, the development of social media contributes significantly to changes in the forms of satisfying the needs and the participation of individuals in social life, including in culture. This is reflected by the development of the information society and a society based on knowledge. This state of affairs creates new opportunities for the creation of the brand equity of cultural institutions. These opportunities are accompanied by a change in the roles that are played by the consumer of culture. Thanks to the use of modern technologies, through the use of new media, he is no longer only a consumer of content related to cultural institutions included in social media, but through its contribution and creation, he is also an active participant in the processes of creation and dissemination. Managers of cultural institutions should be fully aware of this, especially since, as the authors of the article have discussed, the activity of consumers of cultural services in social media significantly influences the brand equity of cultural institutions.
In this place, it must be also indicated that the obtained results of the conducted survey, due to the sampling method applied (in the survey, non-random sampling methods were used—targeted selection), provides knowledge about only the Polish respondents’ opinions. Additionally, it is worth to underline, that the costumer behaviour may be different when they interact with different “types of culture”, because their backgrounds could be different and this fact could “re-direct” them to some cultural product rather than others. In the future, in-depth qualitative and quantitative research is planned on a much larger sample of online consumer of cultural services in countries of Central Europe.


