1. Introduction
The spatial distribution of opportunities across the urban territory is a meaningful explanatory factor in the reproduction of access disparities between transport users at different locations. Transport systems, particularly public transport systems, are crucial in reaching necessary social and economic opportunities offered by urban areas in a sustainable and efficient manner. Such (economic) opportunities made reachable by transport systems become the focus of accessibility indicators, which encompass information on transport services, travel patterns and spatial distribution of people and jobs. This study builds on the notion that efficient public transport provision can become a socially-oriented policy that reduces some socio-spatial urban inequalities via improving access to more and diverse opportunities [
1,
2]. A balanced combination of transport infrastructure, fare policies and operational models that help redistributing connectivity can diminish transport disadvantages of deprived social groups in society [
3]. This social objective is compatible with rising concerns around transitioning to sustainable forms of mobility in a context of reduction of carbon emissions and promotion of public and non-motorized transport.
Many studies and publications about accessibility measures reflect a wealth of approaches and diversity of methods that adapt to different contexts and availability of information [
4,
5,
6,
7,
8,
9,
10]. From an economic perspective, accessibility is considered an important competiveness factor that may explain greater economic growth [
11]. Similarly, introducing accessibility metrics to road public transport planning enables the development of new evidence and arguments for the redistribution of means for road travel that can reduce the environmental and spatial pressure of urban road transport on cities. Social literature about the implications of accessibility on equity also highlights that distribution of accessibility and connectivity reduces individual development and economic stability [
12,
13,
14,
15,
16,
17,
18]. It is also considered an important factor of social inclusion [
12,
19,
20,
21,
22]. Despite clear progress in the application of accessibility metrics, as El-Geneidy and Boisjoly [
23] point out, there is an important gap between conceptual knowledge of accessibility and use of accessibility metrics by practitioners. Various challenges for future research in relation to indicators and evaluation remain [
24]. Despite its relevance as a key concept in transport policy, accessibility has not been ubiquitous in practice in cities of Global South. This can both be a challenge and an opportunity to incorporate more complete metrics into transport planning and practice that can support objectives of sustainable development with targets of social inclusion and integration.
Accessibility can play a role as a mechanism for social policy development and evaluation, which can contribute to discussions around transport systems performance, beyond costs, level of service, headways, timetables and other mainstream metrics used in practice. This vision takes into consideration territorial imbalances, leading to more progressive transport systems that help closing the gap between rich and poor, a major problem in the Global South cities. Applying accessibility metrics while examining a system such as the Integrated Public Transport System (SITP in Spanish) in Bogotá, common among the toolkit of transport planning in cities seeking to improve public transport connectivity—particularly in the Global South—, may enrich debates around the contribution of urban transport to social inclusion [
2]. Additionally, the identification of deficits in accessibility and comparably highly accessible areas may inform a redistribution of the operational schemes of formal public transport, which may increase its uptake and usage in areas with lower use of public transport.
What is the relevance of this? Centralization of economic activities in Global South cities, land regulations and housing market dynamics have caused self-reinforcing cycles of social and spatial inequality in terms of access to economic, cultural and social development opportunities, particularly in low-income areas [
14,
25,
26]. We implement contour measure accessibility [
6,
27] to confirm if the changes of public transport system carried out in recent years in Bogotá, improve the accessibility levels across the urban territory, and/or create disparities between users of the same transport mode at different socioeconomic strata (SES,
estratos in Spanish. Socioeconomic strata is divided in 6 categories. See
Section 2.1.) and zones. Therefore, our analysis seeks to describe how well the Bogotá public transport system performs its role of enabling access to job-opportunities to connect and interact within the urban territory and its inhabitants. This is measured through travel time intervals and the cumulative distribution of supply of workplaces accessible by public transport from a specific point of the city. Through the use of an easy tool to measure and understand, we aim to contribute to debates around the use of accessibility analysis in the performance evaluation of public transport as a social indicator.
Current available research on accessibility in Bogotá is wide [
2,
14,
28,
29,
30] and it has been carried out with different approaches and scales. This paper builds on household travel surveys conducted in the city to examine the influence of jobs and housing accessibility on travel times by public transport. Differently from previous works, we apply contour-measure accessibility indicators to the sample of georeferenced households from the mobility surveys of 2011 and 2015, a period when the greatest changes in the public transport system occurred. We use the relationship between declared travel times to work by public transport from the mobility surveys and the changes in the transport system in an aggregate way among the studied period.
2. Bogotá Background and Context
The city of Bogotá has an urban area of around 400 km
2, with a population of 8.08 million people in 2017. The distribution of the population in the region has major differences throughout the territory. Low-income households have little availability of affordable housing close to major employment centers. This has historically led this segment of the population to settle in informal (originally) settlements at the outskirts of Bogotá [
14]. The densest areas in the city, which can reach average values up to 56,000 inhabitants/km
2, are located in the poorest neighborhoods (lowest SES), mainly in the southern and western edges of the city [
31].
Household size in 2011 had a mean of 3.44 people per household, while for 2015 the value was 3.01. In terms of private vehicle fleet composition, in 2011 63% were cars and 19% motorcycles, whereas in 2015 cars went down to 60% and motorcycles went up to 27%. There are also large differences in vehicle ownership at the SES level: in 2011 households classified in SES 1, 2 and 3 owned the 90% of the motorcycles and approximately the same distribution is held for 2015. The SES and several main indicators are described in detail in the following section.
2.1. The Socioeconomic Strata System in Bogotá
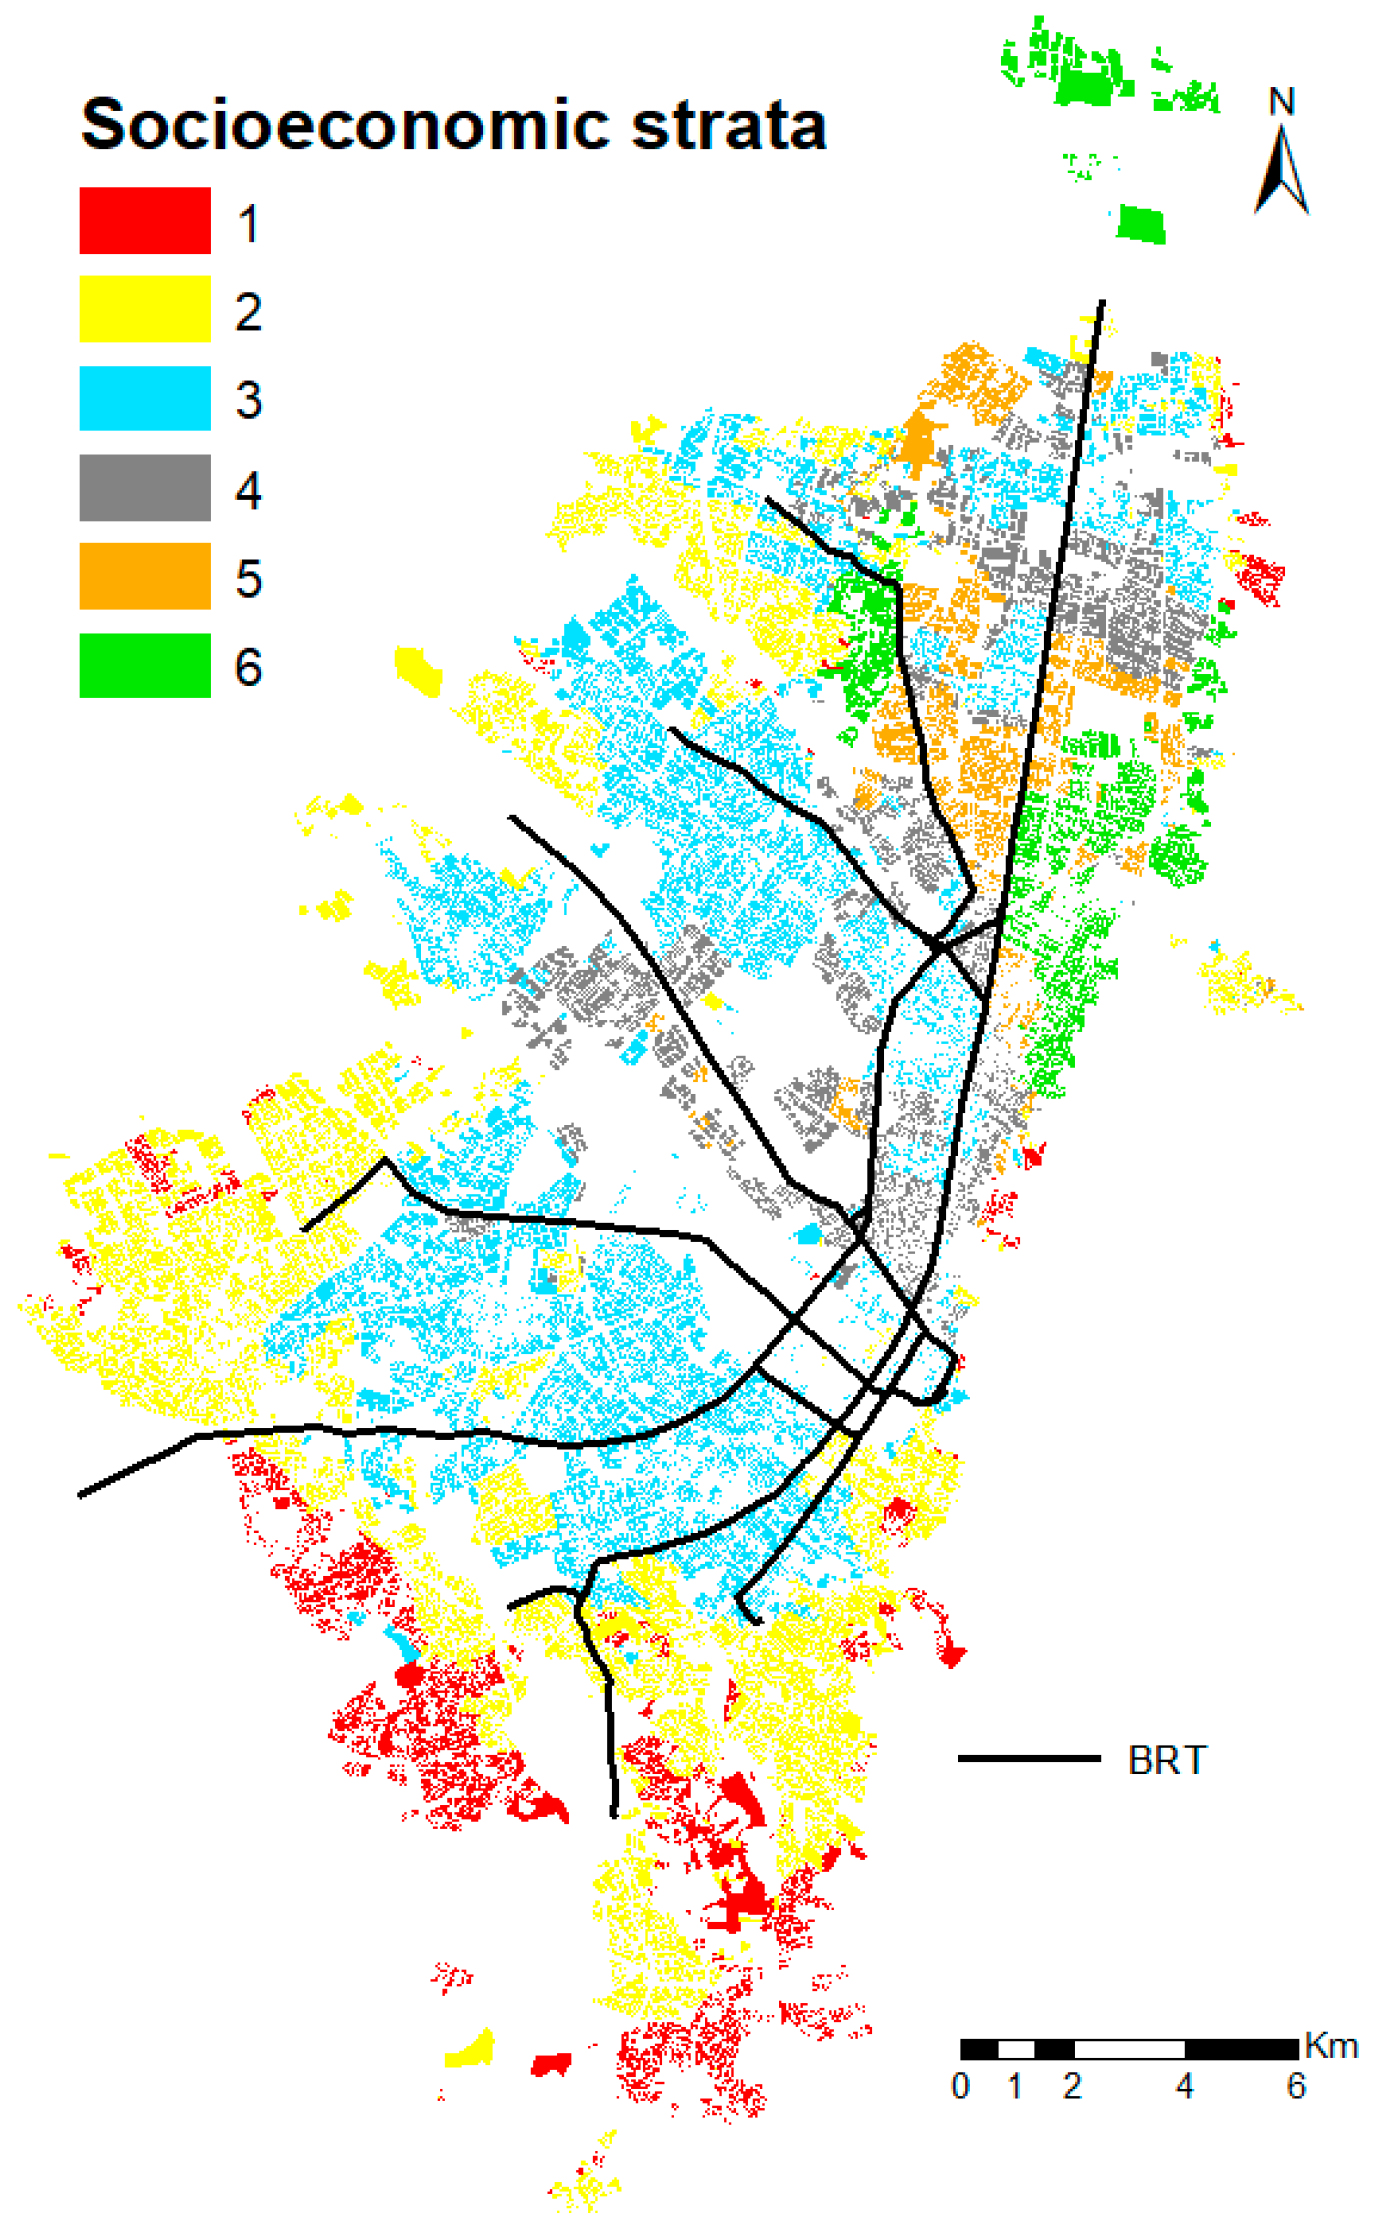
The residential sector of the city is divided into socioeconomic strata (SES). From poorest (strata one) to wealthiest (six), as shown in
Figure 1. In the low segment, one to three, people receive subsidies in essential utilities (water, gas, electricity). In the highest, the five and six, residents pay a cross subsidy via higher utilities costs in comparison to their real consumption. The process to classify housing by strata is done based on the dwelling characteristics and the urban environment. This classification by SES has encouraged spatial segregation in the city.
This classification has made visible the invisible barriers that exist in Bogotá. The SES one and two in the south are identified with poverty. In the center, the middle class predominates. In the north, strata five and six are considered rich. The information shown in the
Table 1 reveals the differences by SES in some indicators.
The city’ spatial structure has pushed lower-income households of lower SES to disadvantageous locations and as a consequence, to lower degrees of spatial mobility. An important share of the low-income people population has low levels of accessibility, as a result of their disproportionately low proximity to workplaces and poor quality of public transport [
14].
Aside from car-ownership increase, particularly in the lower SES, the data in
Table 1 show a generalized deterioration in average travel times, whether in public or private transport. We want to investigate about the effect of these travel times increases on the number of jobs accessible at the SES and zone level.
2.2. Bogotá’s Public Transport System
Bogotá is embarking on public transport reforms aimed at improving and formalizing its bus services. Its residents’ dependence on the public transport system has remained high throughout the years despite increases in motorization and shifts in demand towards walking and cycling. Although the modal share in this mode has lost participation (from 57% in 2005 to 39% in 2015), still serving a big proportion of travel demand of the city. Currently, there are around 14.9 million of trips in Bogotá daily. Of those trips, 5.8 million are made by public transport. If we focus on motorized trips, the modal share of public transport reach 61% of daily travel demand.
The evolution of public transport in Bogotá has been marked by recurrent challenges and shortcomings. The traditional scheme of public transport supply was characterized by oversupply of buses with low quality service, increasing congestion and reducing road safety [
28]. From the 60s to the 90s, private companies operated public transport system in an anarchic, uncomfortable, and expensive way. Since the mid-1980s, and particularly in the late 1990s, supply structures for public transport in the city became untenable. From this point on various attempts were made from the public and private sectors aiming at improving public transport in a way that would help remedy the mobility problems in the city. As a result of such efforts Transmilenio (TM), Bogotá’s BRT system was born in the late 1990s [
32,
33,
34]. Despite a rather successful start of operation and an overall positive record during its first years of operation, currently Transmilenio faces challenges such as excessive overcrowding, an old and decaying fleet, and a bad perception from users and non-users alike. The former was compounded by generalized oversupply throughout the city as a consequence of having most routes and buses from the traditional system continuing operation as usual. To improve the system’s organization and efficiency, the local government decided to implement the Integrated Public Transport System (SITP) which incorporated a centralized control of routes and vehicles, and an integrated fare for the operation of all its public transport sub-systems, like TM and traditional buses. The SITP aims to eliminate the inefficiencies of the traditional bus system by introducing concession contracts that restructure bus routes, regulate oversupply and change contractual arrangements and incentives with operators to eliminate the infamous
penny war that characterized the traditional bus system (the term of penny war refers to uncontrolled competition by public bus operators for passengers in a context of high deregulation of public transport, perverse incentives and inadequate revenue systems before implementation of the SITP, which led to inefficiencies, traffic accidents, and rapid decrease in service quality) [
35]. This system is a large-scale initiative by which the city’s nearly 450 bus routes and more than 15,000 traditional urban buses are being transformed into a regulated, publicly tendered system with high level of service.
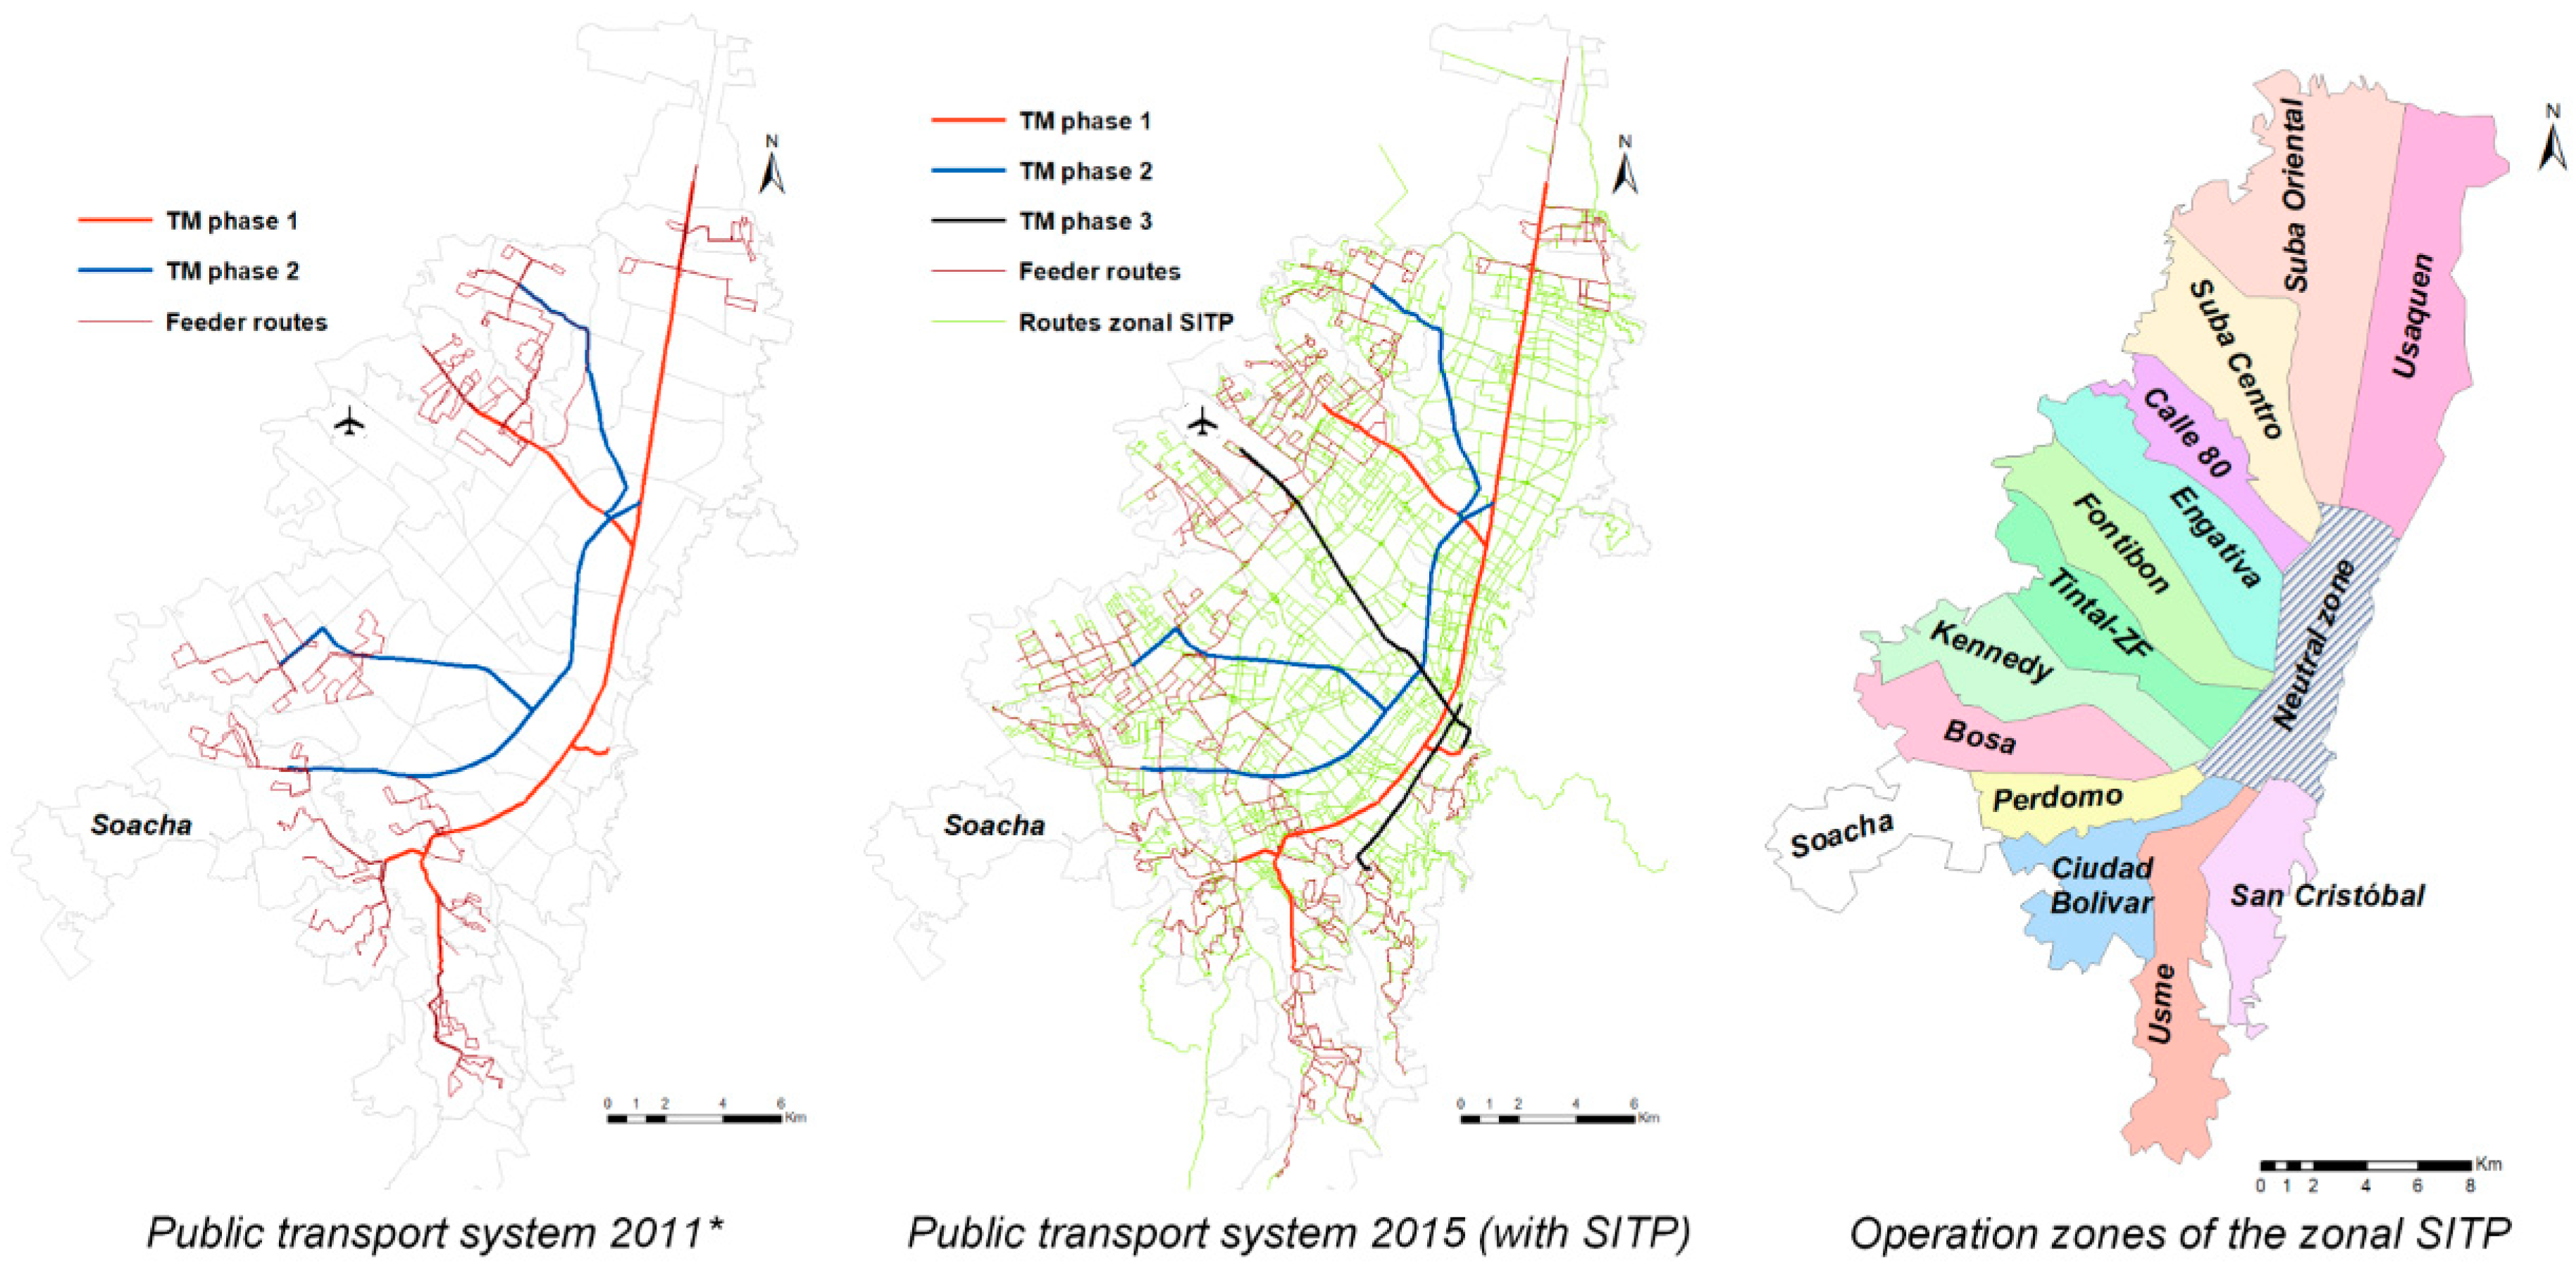
The SITP has three components. The first is the zonal service which is provided by regular public buses in mixed traffic that replaced the traditional bus services. The urban area of Bogotá was divided into 13 zones and a neutral zone, which are operated by private operators and are integrated with TM trunks lines. These zones are: Usaquén, Suba Oriental, Suba Centro, Calle 80, Engativá, Fontibón, Tintal-Zona Franca (ZF), Kennedy, Bosa, Perdomo, Soacha (Soacha is a neighboring municipality to Bogotá which is not included in this analysis), Ciudad Bolívar, Usme, San Cristóbal and a neutral zone (see
Figure 2). The neutral zone corresponds to the expanded city center of Bogotá and is not assigned to any operator, as it is a zone where a large part of the daily trips are directed. The cost for zonal services was 1550 COP in 2015 (approx. 0.56 USD).
The second component are feeder buses that connect peripheral zones with the trunk lines of the TM system (the third component). Feeders have no additional fare for their use. TM’s fare was 1800 COP in 2015 (0.66 USD).
Public transport services are fully integrated though a fare collection system based on smart cards currently are under use and operated by a private operator called
Recaudo Bogotá. Bogotá opted for a gradual implementation of the SITP. The implementation of this new system started in 2012. This gradual implementation should have been completed by mid-2014. In 2015, the implementation of the fleet and routes was around 74%. This process was met by numerous challenges and barriers by the new bus operators, fare collection operator and the city. Users complain about low frequencies, the complexity of the route nomenclature, long routes and lack of smartcard selling points and recharge network [
28].
The operation of the SITP has brought about several problems that are evident in the service quality. Continuous accidents, robberies, aggressions and even broken buses have been the common denominators of the system. In addition, two operating companies responsible for 164 routes (and three operation zones: Perdomo, Fontibón and Suba Centro) went bankrupt, and the city had to take over operation in these zones, leaving the old system in operation. In addition, since the process of implementing the SITP could not be completed within the established deadlines, in June 2015 a special and transitory operating permission was granted to the buses of the old system. This is known as “provisional” SITP and consists of 4920 buses which work with cash and do not have system colors. According to
Bogotá Como Vamos (
www.bogotacomovamos.org), in 2017 the modal share of “provisionals” was 11%, a high value if we consider that the zonal SITP only has 16%, which further aggravates its financial situation.
The hasty implementation of the system summed to management inefficiencies and budgetary restrictions made the structure of the SITP incomplete in comparison to its conceptual design and unsuitable the needs of the demand in practice. We build on this reality to suggest that, despite significant efforts in the integration of public transport supply, the new structure of public transport in the city does not necessary imply better accessibility for all. We examine the distributional consequences of new travel conditions, reflecting on the various consequences for different social groups.
3. Methodology
This research builds upon on traditional contour measures, also known as the isochronic measure, which counts the number of opportunities which can be reached within a given average travel time, required to access a fixed number of workplaces [
6,
27]. This is the most common family of disaggregate measures of the combined transport and land-use system. This definition of accessibility has been used in U.S. to explore the influence of jobs and housing accessibility on travel time [
22]. In this case, access to jobs is determined by geographical features, such as travel times and service performance (which is implicit in travel times declared by surveys), as well as housing location. Job accessibility of a household via Bogotá’s public transport system is estimated as the total number of workplaces one can reach from their residence location within an own-declared travel time. This model uses a binary threshold to determine accessible opportunities, as follows:
where,
i = household location (trip origin)
j = workplace location (trip destination)
Wj = 1 if Cij < Cij*; 0 otherwise
Cij = travel time from i to j
Cij* = travel time threshold (40, 60, 80, 100 and >100 min).
The first phase of the construction of the model requires a detailed analysis of the information from the Mobility Surveys from 2011 and 2015. For both years, households were georeferenced by identifying the properties and cross-referencing their code with the location of dwelling units in Bogotá. Once all surveyed households were located, information was filtered to separate trips by work purpose. This approach incorporates land-use patterns (workplaces) as well as public transport system changes and constraints. Data was then further filtered to select only home-based trips by public transport. In total, we identified 5381 points located in Bogotá that correspond to households with work-related trips on public transportation and 8660 for the year 2015.
The second phase consisted in the construction of isochronous curves of the travel time to work for both years. For this case, since only the travel time was available, deterministic methods of spatial interpolation were used [
36]. The deterministic methods of interpolation create surfaces from measured points, based on the grade of similarity. The inverse distance weighted (IDW) tool in ArcMap was used by which it can represent travel time to work in the study area. This method assumes that travel time in each location of the map changes in influence with distance from its sampled location.
Finally, and with the isochronous curves, cross-referenced with information on the number of jobs per block. Accessibility is estimated with the average travel time to access available jobs and separated by SES [
1]. With this, a comparative analysis is made between 2011 and 2015, combining travel times and location data for job opportunities to estimate an accessibility value for the households sample in the city. The measure has also been reversed: We estimated the percentage of reachable jobs within a given travel time threshold.
Contour accessibility measures confront transport and land-use components of accessibility by considering travel time restrictions posed by transport and the distribution of opportunities for work in space. If any of these components were to change, results are sensitive to them. Contour measures offer comparative advantages in relation to ease of implementation and communication. Additionally, it is relatively undemanding of data, a very important issue in Global South cities) and is easy to interpret for researchers and policy makers [
6].
3.1. The Data
Travel survey databases are structured in four different modules. The first encompasses household characteristics such as income, dwelling type, and available vehicles. The second module describes individual information like age, occupation, and driver license, among others. The third module details the characteristics of the vehicles reported previously. Finally, the fourth module reports information related to trips made per person, and includes origin and destination locations, travel times and transport modes.
The 2011 survey include 16,157 households surveyed in Bogotá. The 2015 survey reported 28,213 valid household answers. The surveys were designed to have statistical representation of the whole study area. These sample sizes taken into account ensure a reliability greater than 90% and a percentage of error in the estimate lower than 5%. The results in terms of total daily trips for the study area were 15.4 million for 2011 and 14.9 million for 2015 (expanded data). For purposes of this study, socioeconomic information and public transport trips were analyzed and at the SES level in both years. Limitations in data availability and representativeness are some of the main constraints of the research. This is also associated with the level of aggregation at which the data is presented as there is a trade-off between precision of geo-coding of resources and sample size, which may affect the results.
Regarding travel time, the surveys ask for the time of departure and the time of arrival (HH:mm) of each trip, with was possible to calculate the duration of all trips. It also eliminates the biases related time perception that may be generated the people surveyed. For purposes of this study, trips to work done by public transport were analyzed by SES level in both years.
At SES level it is noticeable, for both years, that public transport is one of the most frequent modes of transport in SES 1, 2 and 3, with a participation of over 80%. In contrast, the car is the most common mode of transport in SES 5 and 6, with around 22%. There were another significant differences at the SES level, like daily trips by person or travel time, where the differences are bigger. See
Table 1.
3.2. Job Location
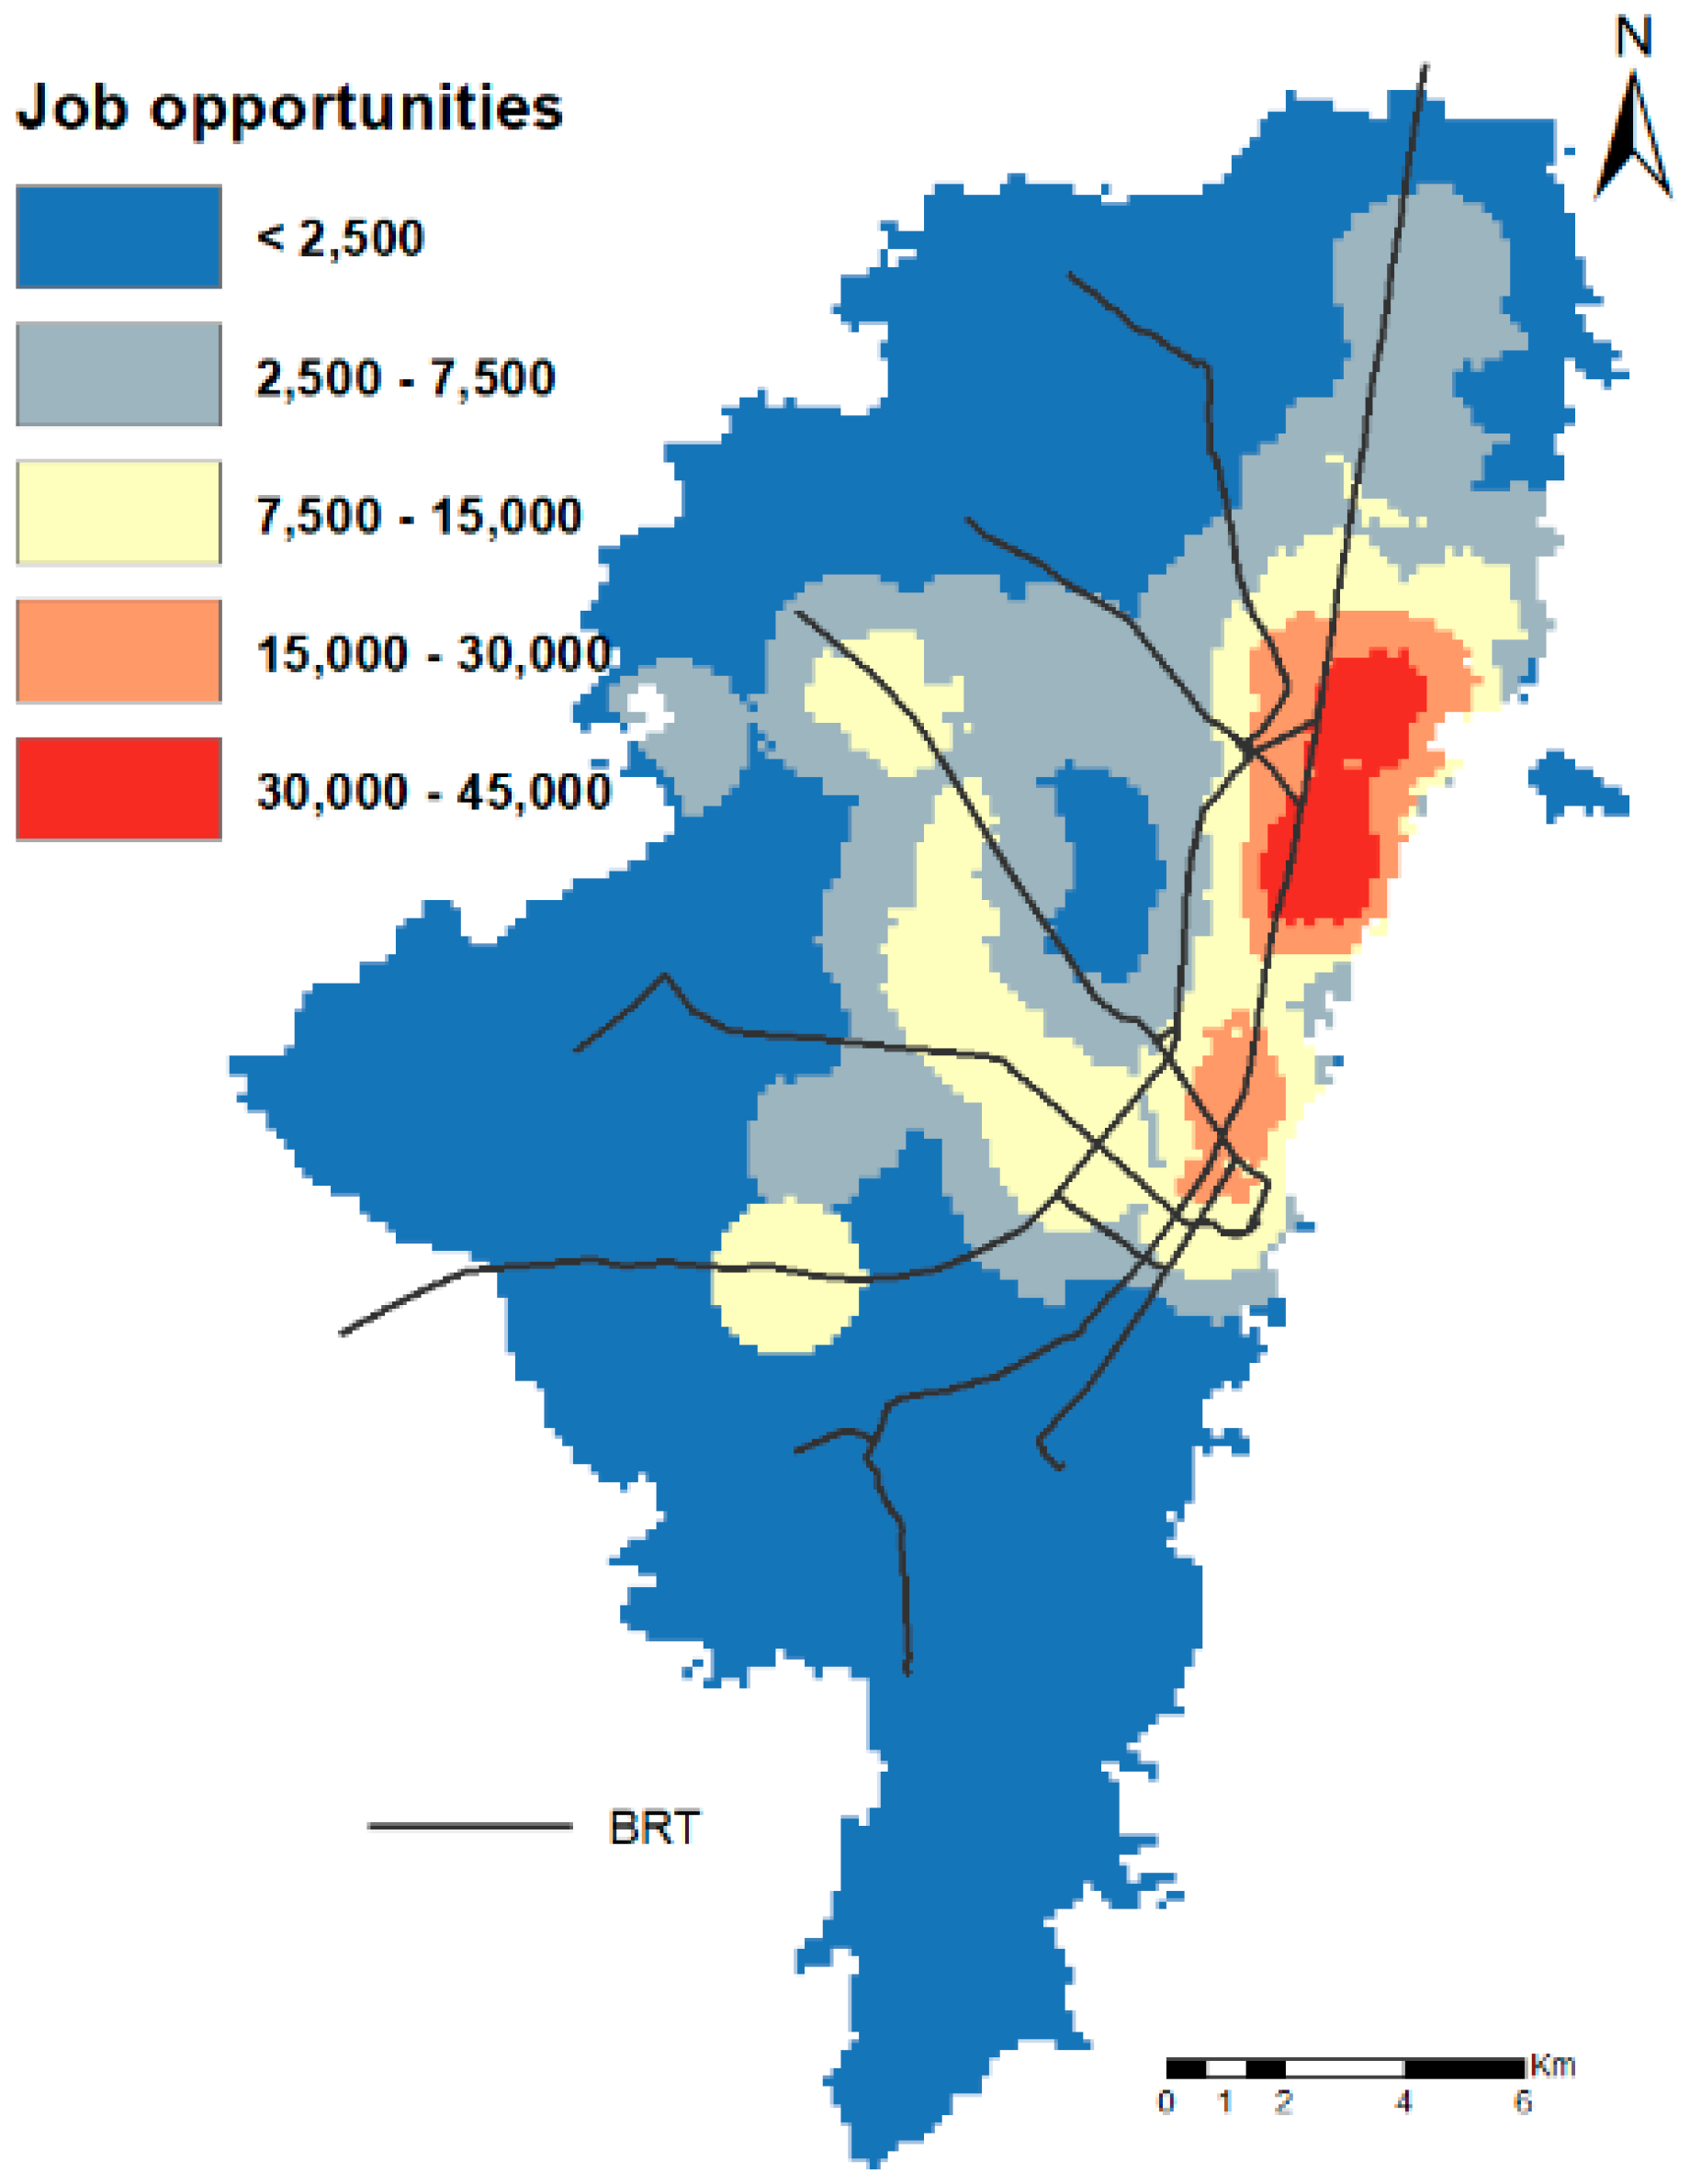
Concentration of work-related activities in specific areas of Bogotá has caused major problems of inequality in access to income-generating opportunities, affecting particularly low-income groups [
14]. A large share of economic opportunities concentrates along main transport corridors, especially in the north-central side of the city, where higher-income households are located. The work-related activities in Bogotá are highly concentrated in a specific area. The city center and its financial expansion to the north alone contain almost 44% of the functions related to employment (12% of the urban area), as shown in
Figure 3.
The process of urbanization of Bogotá involves the rich (SES five and six) moving progressively to the north, while the poor population moves to the south, or to neighboring municipalities. This spatial distribution of activities translates into a high concentration of employment areas [
37]. This coincides with what was mentioned by Butterworth and Chance [
38], where Latin American cities traditionally value compact urban centers where the rich have tended to dominate central locations, a pattern that has endured in Bogotá until now.
4. Results
Economic activities in Bogotá are highly concentrated on the eastern part of the city, which exhibits a complex setting of heightened connectivity via infrastructure and public transport services and proximity to higher-income population. This area also hosts a high percentage of activities, mainly education and commerce. The neutral zone of operation of the SITP responds to these dynamics, enabling connectivity between main trip generators zones and the most common destinations for work in the city (
Figure 2). Other opportunities and education are spread throughout the territory outside of the consolidated city center, rarely agglomerating in other zones with high concentration of activities. We used disaggregated data for opportunities before and after the implementation of the SITP (2011 and 2015) and proposed several travel time thresholds, which captures the job commutes.
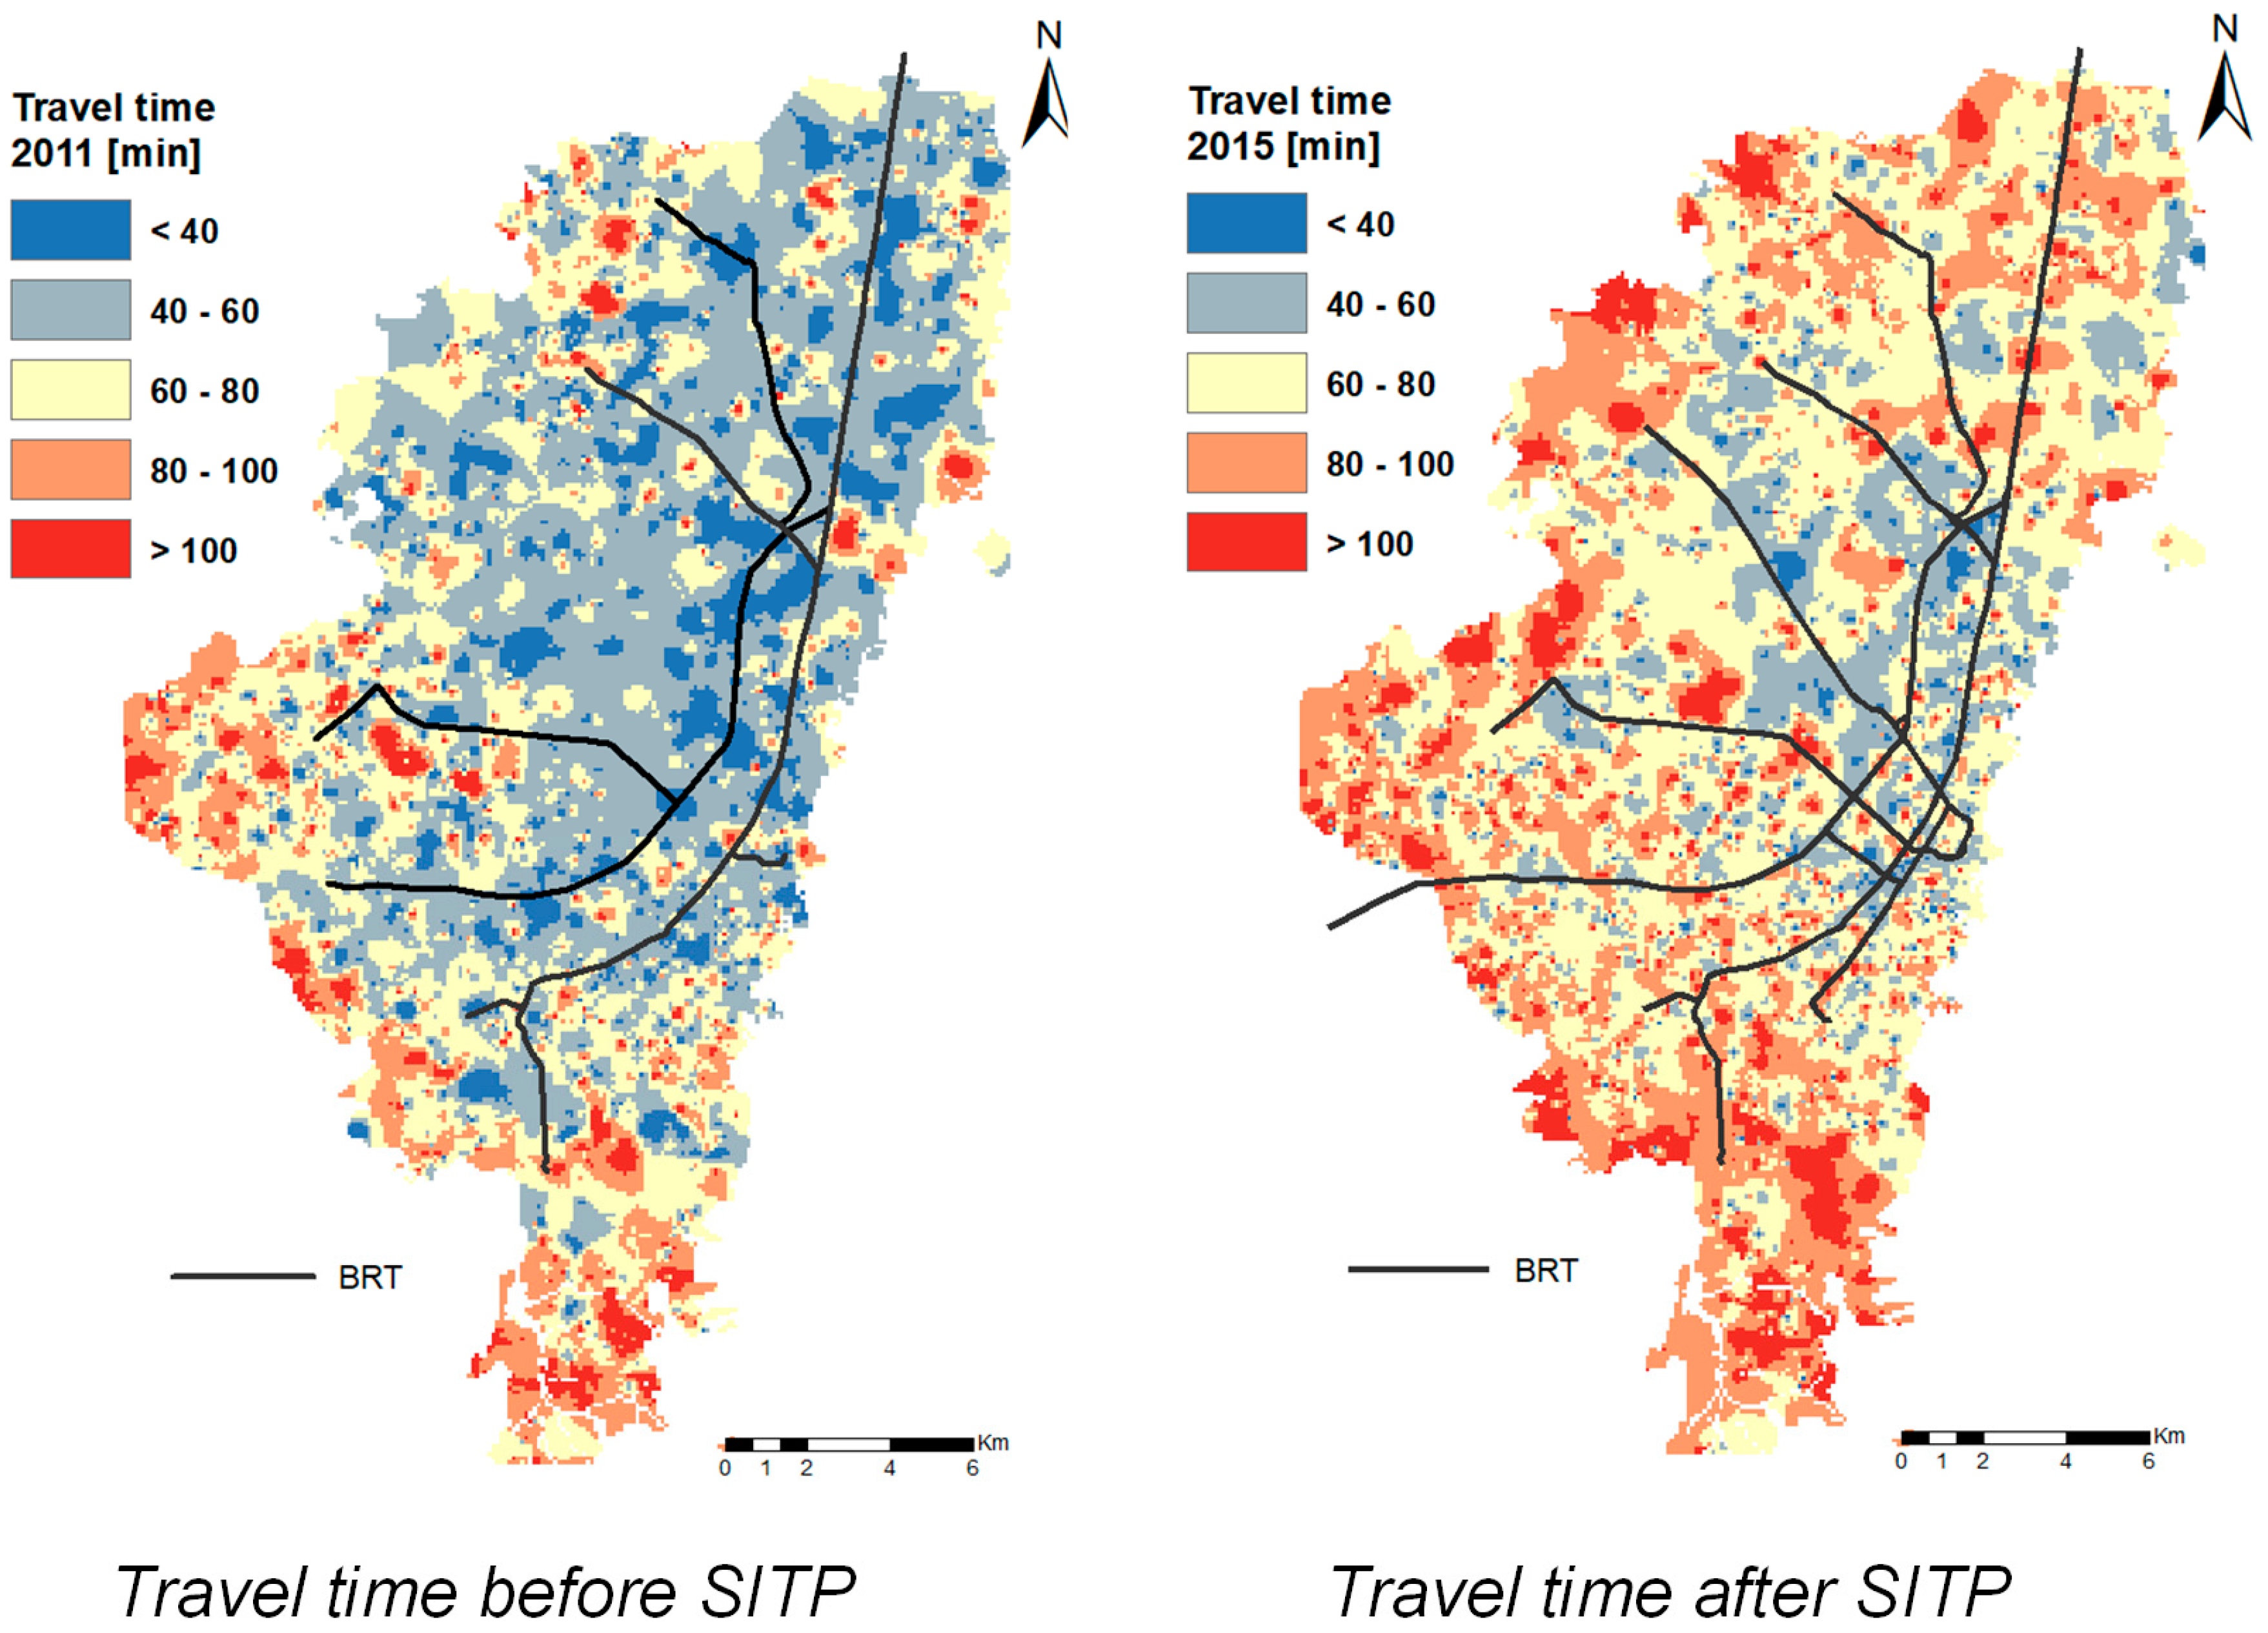
Average travel times per trip in Bogotá remain high. The city’s spatial and socioeconomic structures lead to longer motorized trips and average distances in the two digits. According to available data, in 2011 average travel time in all modes was 59 min and in 2015, 56 min. However, for the lower SES, travel times by public transport are almost double than those for the highest SES: while travel time is between 80 and 110 min for lower-income SES, while for those in the highest it is between 50 and 70 min in 2011. In 2015, the average travel times are between 70 and 80 min for all SES.
Frequencies of operation, restricted capacities, long walking and waiting times due to excessive queuing in some of the station of BRT system, and overall quality of service of public transport, are among factors influencing large travel times. As shown on
Figure 4, there is an increase in travel times between 2011 and 2015. As reflected by these isochronous curves, travel time of people in the lower SES to work (67 min) are on average 22% longer than the middle-SES (55 min) and 40% more than high-SES zones (48 min).
Average travel time curves by public transport obtained for the both scenarios shows that the whole city is covered between isochronous curves of 40 to 120 min approximately, showing high travel times per trip particularly in the urban periphery. This implies that the people who live in these areas could spend more than 4 h to traveling to work (including the return-to-home trip). This gives us an indication that in those areas, accessibility has worsened.
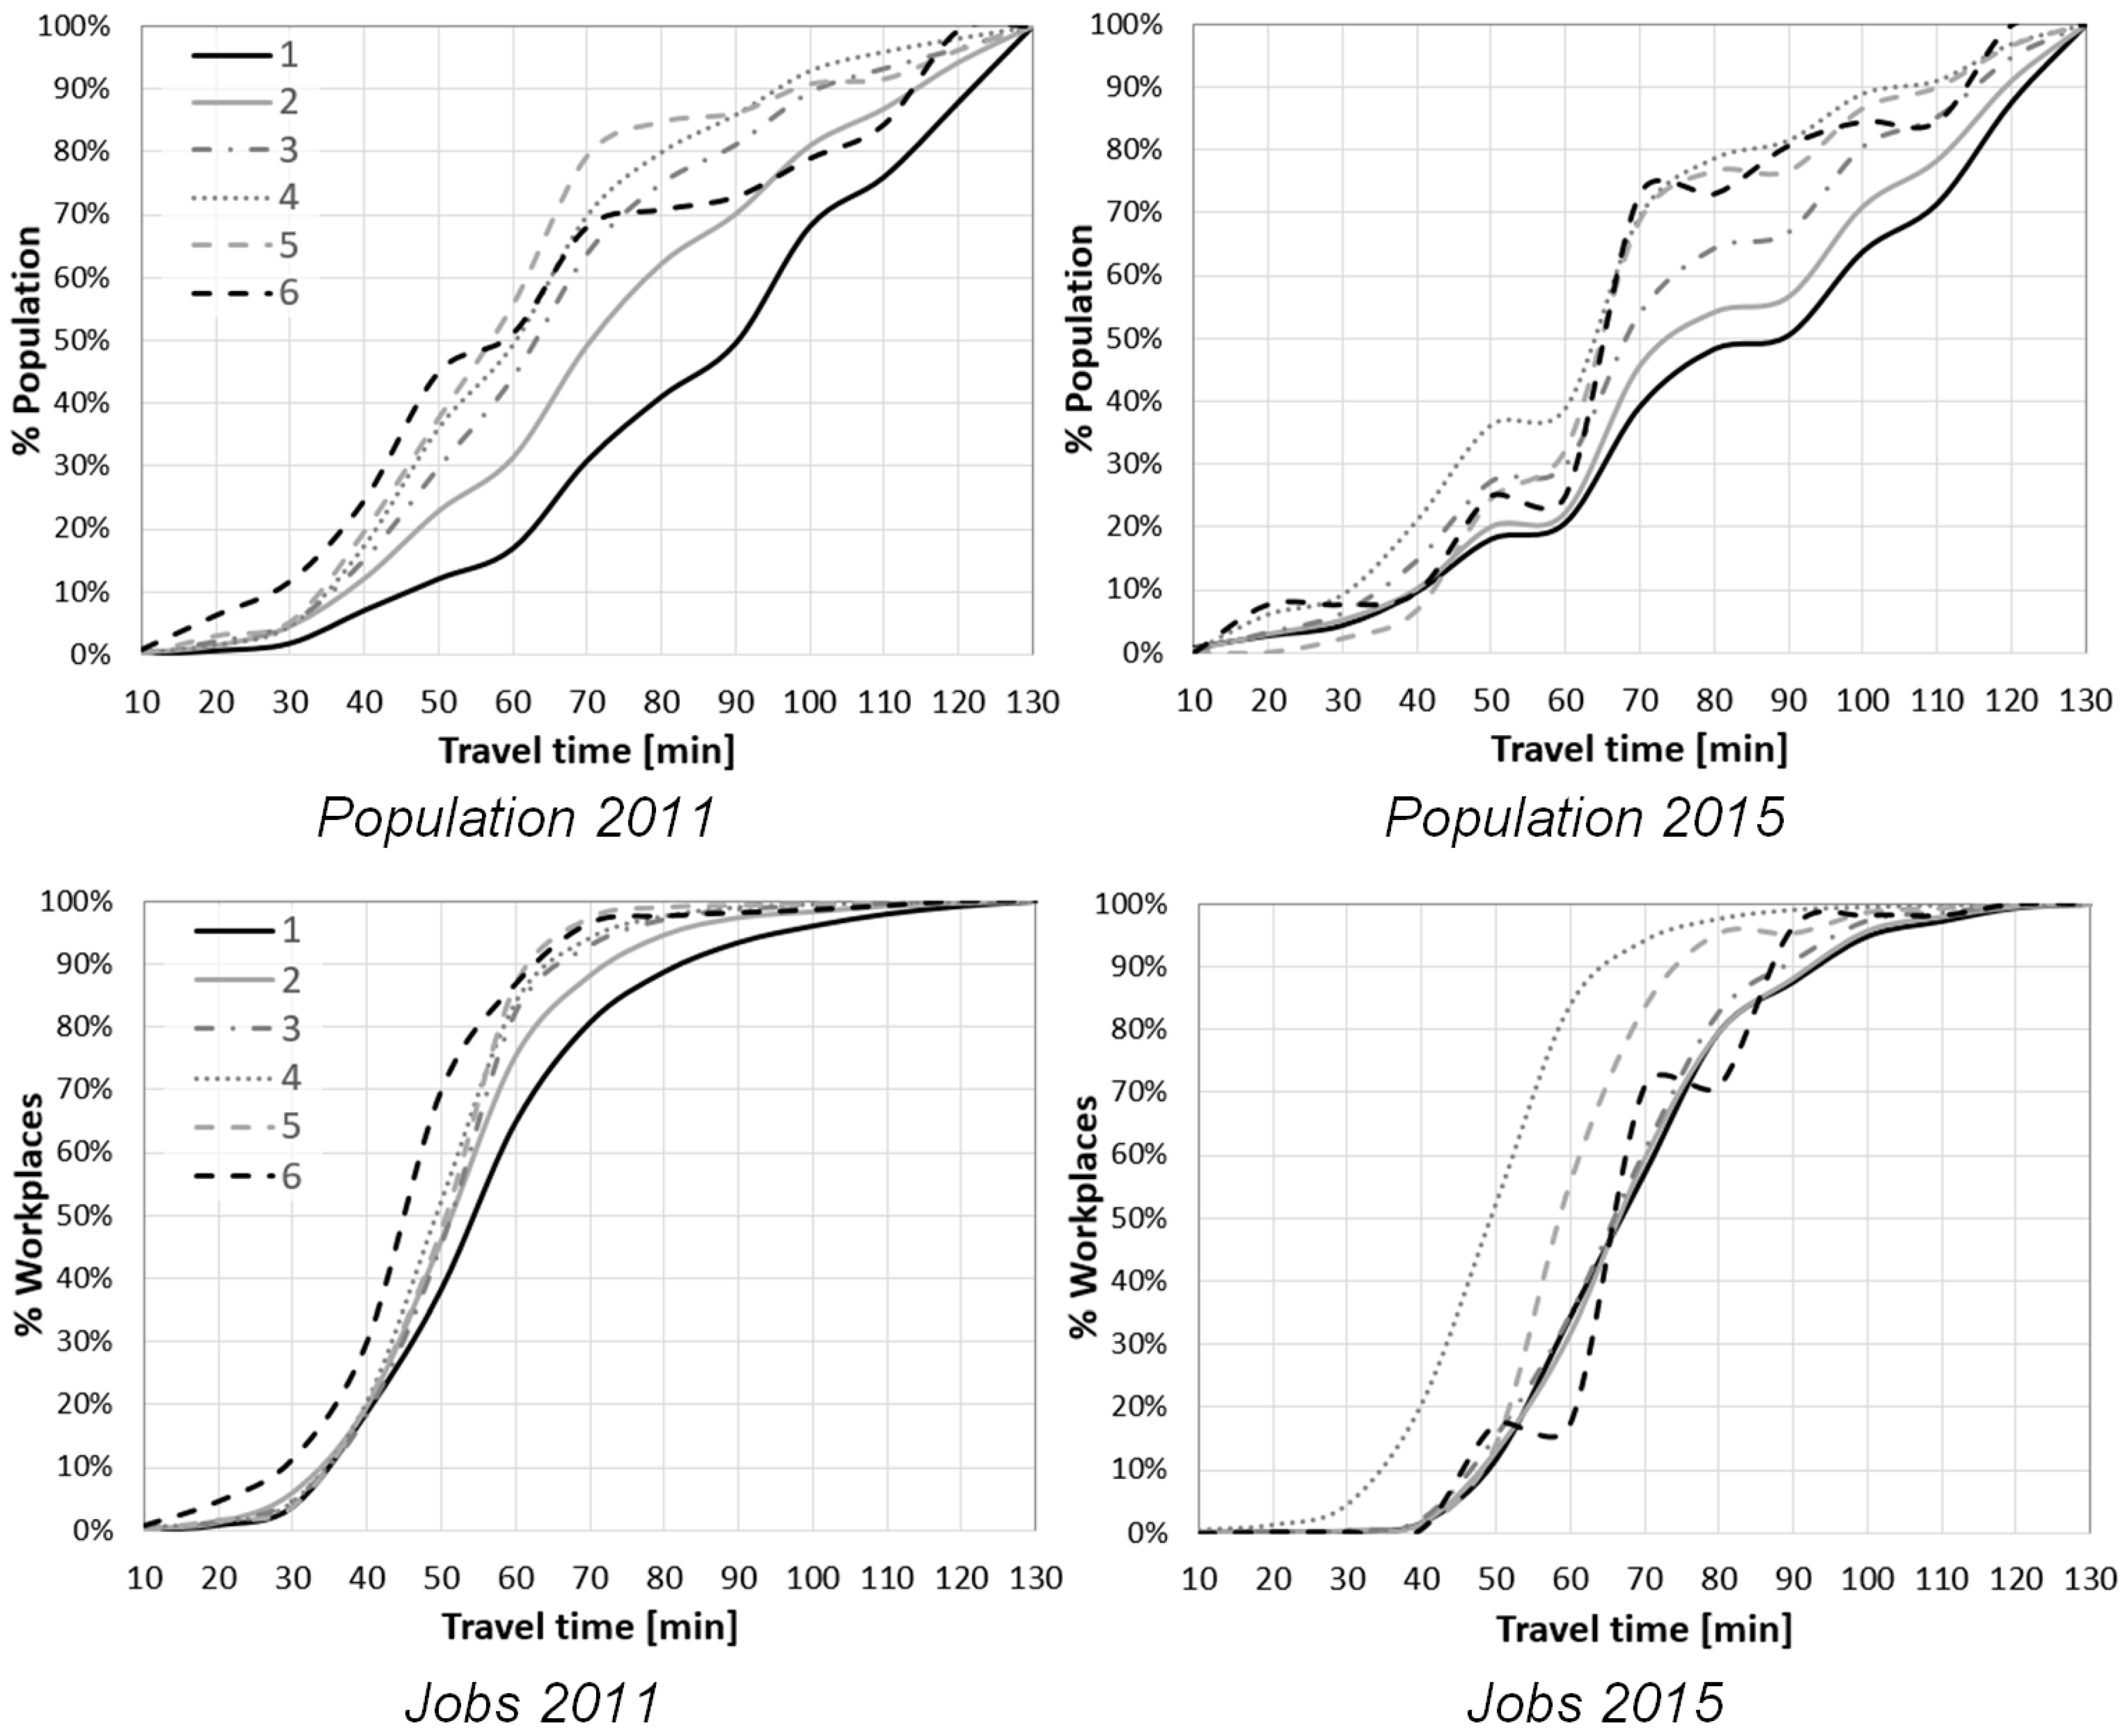
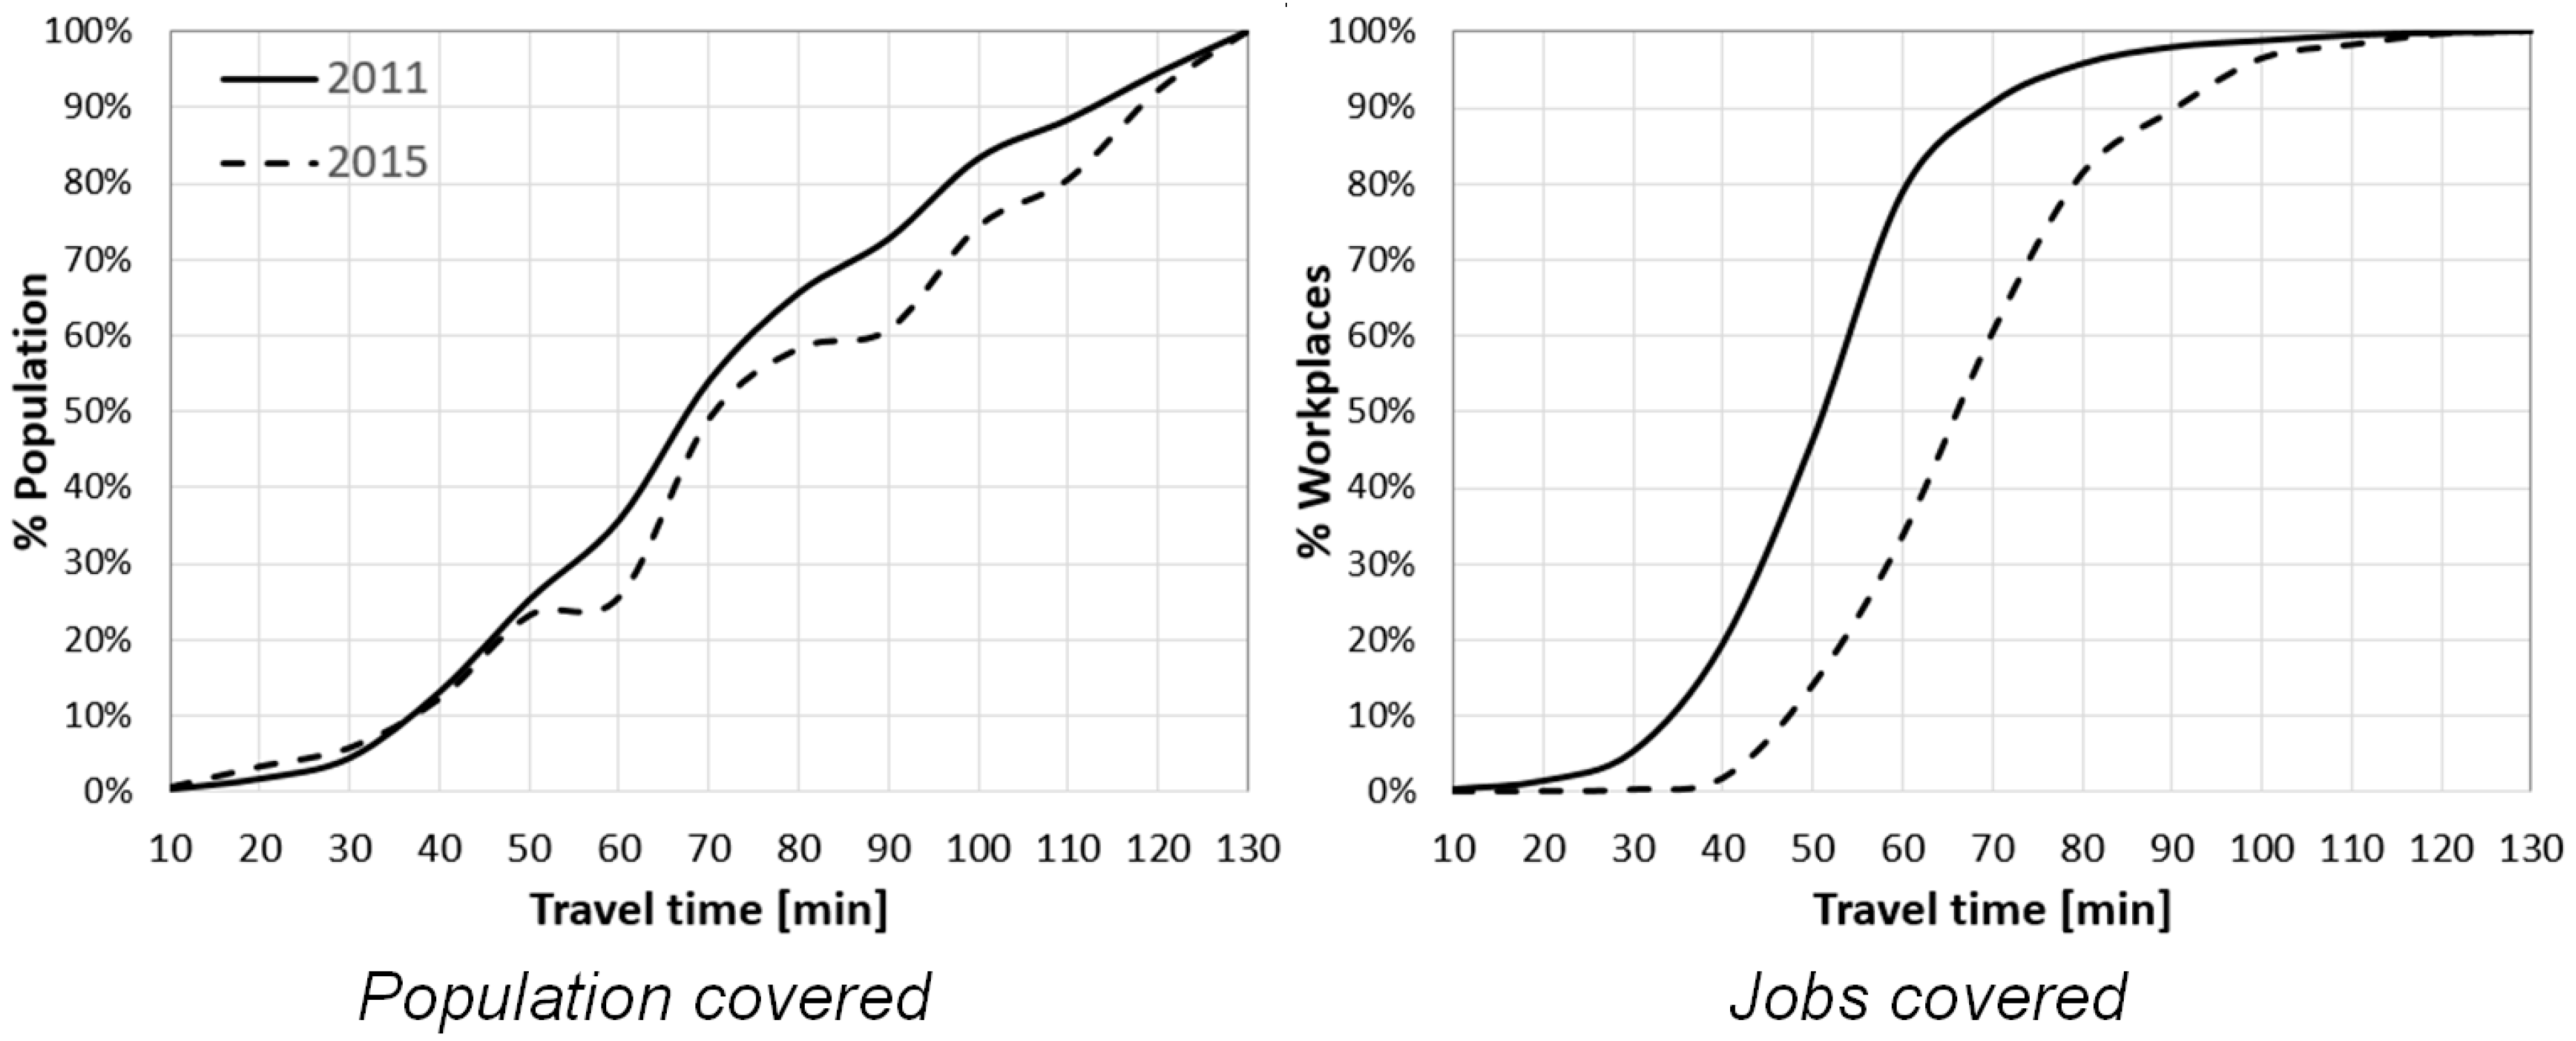
Linking the isochronous curves (
Figure 4) with household and job location, it is possible to estimate the cumulative distribution curves of population and employment by SES level and also, by SITP zone. Greater slope curves implies lower travel times on average.
Figure 5 displays the accessibility results before (2011) and after (2015) the implementation of the SITP. This result summarizes the time of accessing the job activities (left). At the city level and regarding the job-access time from any point of the city, in 2011 the connectivity to sources of employment provided by the public transport system displays average times of 50, 68 and 92 min to reach the 25, 50 and 75% of the total job supply. In 2015, the average times were 58, 71 and 101 min, respectively. This shows an increase between 4 and 16% of the travel time required to work in the city.
Additionally,
Figure 5 (right) shows the percentage of jobs that can be achieved within a certain range of travel time. Cumulative distributions shown in
Figure 5 reflect a lower number of jobs accessed in 2015. If we used a 60-min travel time as the travel threshold, which has been used in multiple settings as the standard for job accessibility [
39], results suggest that in 2011 79% of the jobs could be accessed, while in 2015, only 34%. Although this seems like a dramatic decrease in accessibility, it is a consistent result both with the level of concentration of opportunities in the eastern part of the city and the distribution of the population by income level around the city center. The structure of the new system enforces new transfers and longer travel times with a stricter frequency scheme and longer waiting times in non-peak times. Except for accessibility gains in the central western area (because the construction of phase 3 of TM), no major accessibility gains resulted from the SITP implementation. Even in the periphery of the city (southern, northern and western), where most of the low SES population lives, there is a remarkable loss of accessibility that seems to coincide with route restructuring and the reduction of services towards the peripheries.
The former can be confirmed when comparing the distributional curves by SES. Although it is found that there is greater coverage of population in spatial terms, there are large differences by SES.
Figure 6 shows the cumulative population and jobs covered in the urban area based on the average travel time. The curves of the SES six show a rapid increase in the accessed jobs due to geographical proximity to the job concentration area. In this case, the increase of access is rapid and the zones belonging SES six reaches more than 50% of the jobs in less than 50 min.
An opposite trend to that observed in higher-income groups can be observed in the lowest SES. Lower-income zones show a milder slope in their access to jobs and would need up to 2h to reach all of the job supply. The lowest SES in the city tends to reflect high levels of poverty and social vulnerability, which are intrinsically correlated with peripheral locations in relation to the main job centers in the city. The intersection between housing location, lower operational frequencies and low local availability of economic activities lead to marked access inequalities and economic exclusion of lower-income areas. As a result, inequalities shown in
Figure 6 have intensified as a byproduct of forcing commuters to spend ever-increasing amounts of time on travel, above those in developed cities. Most of public transport users either experienced very minor improvements in their job accessibility or saw their accessibility worsened because of changes in the public transport system. In 2015 the average travel time increases by about 30% to access the same number of jobs as in 2011.
Proximity to mass public transport infrastructure seems to be related to better access in terms of travel time. While areas located closer to the TM trunk lines and the city center tend to display travel times values similar or lower to the city’ average (less than 1 h), low SES areas show travel times up to 1.5 times greater than the averages (see
Table 2). Changes for different levels of the socioeconomic pyramid of Bogotá show that not only there are significant differences in purchasing power and therefore access to alternative means for urban mobility, but also indicate comparative disadvantages for those in an already challenging social position.
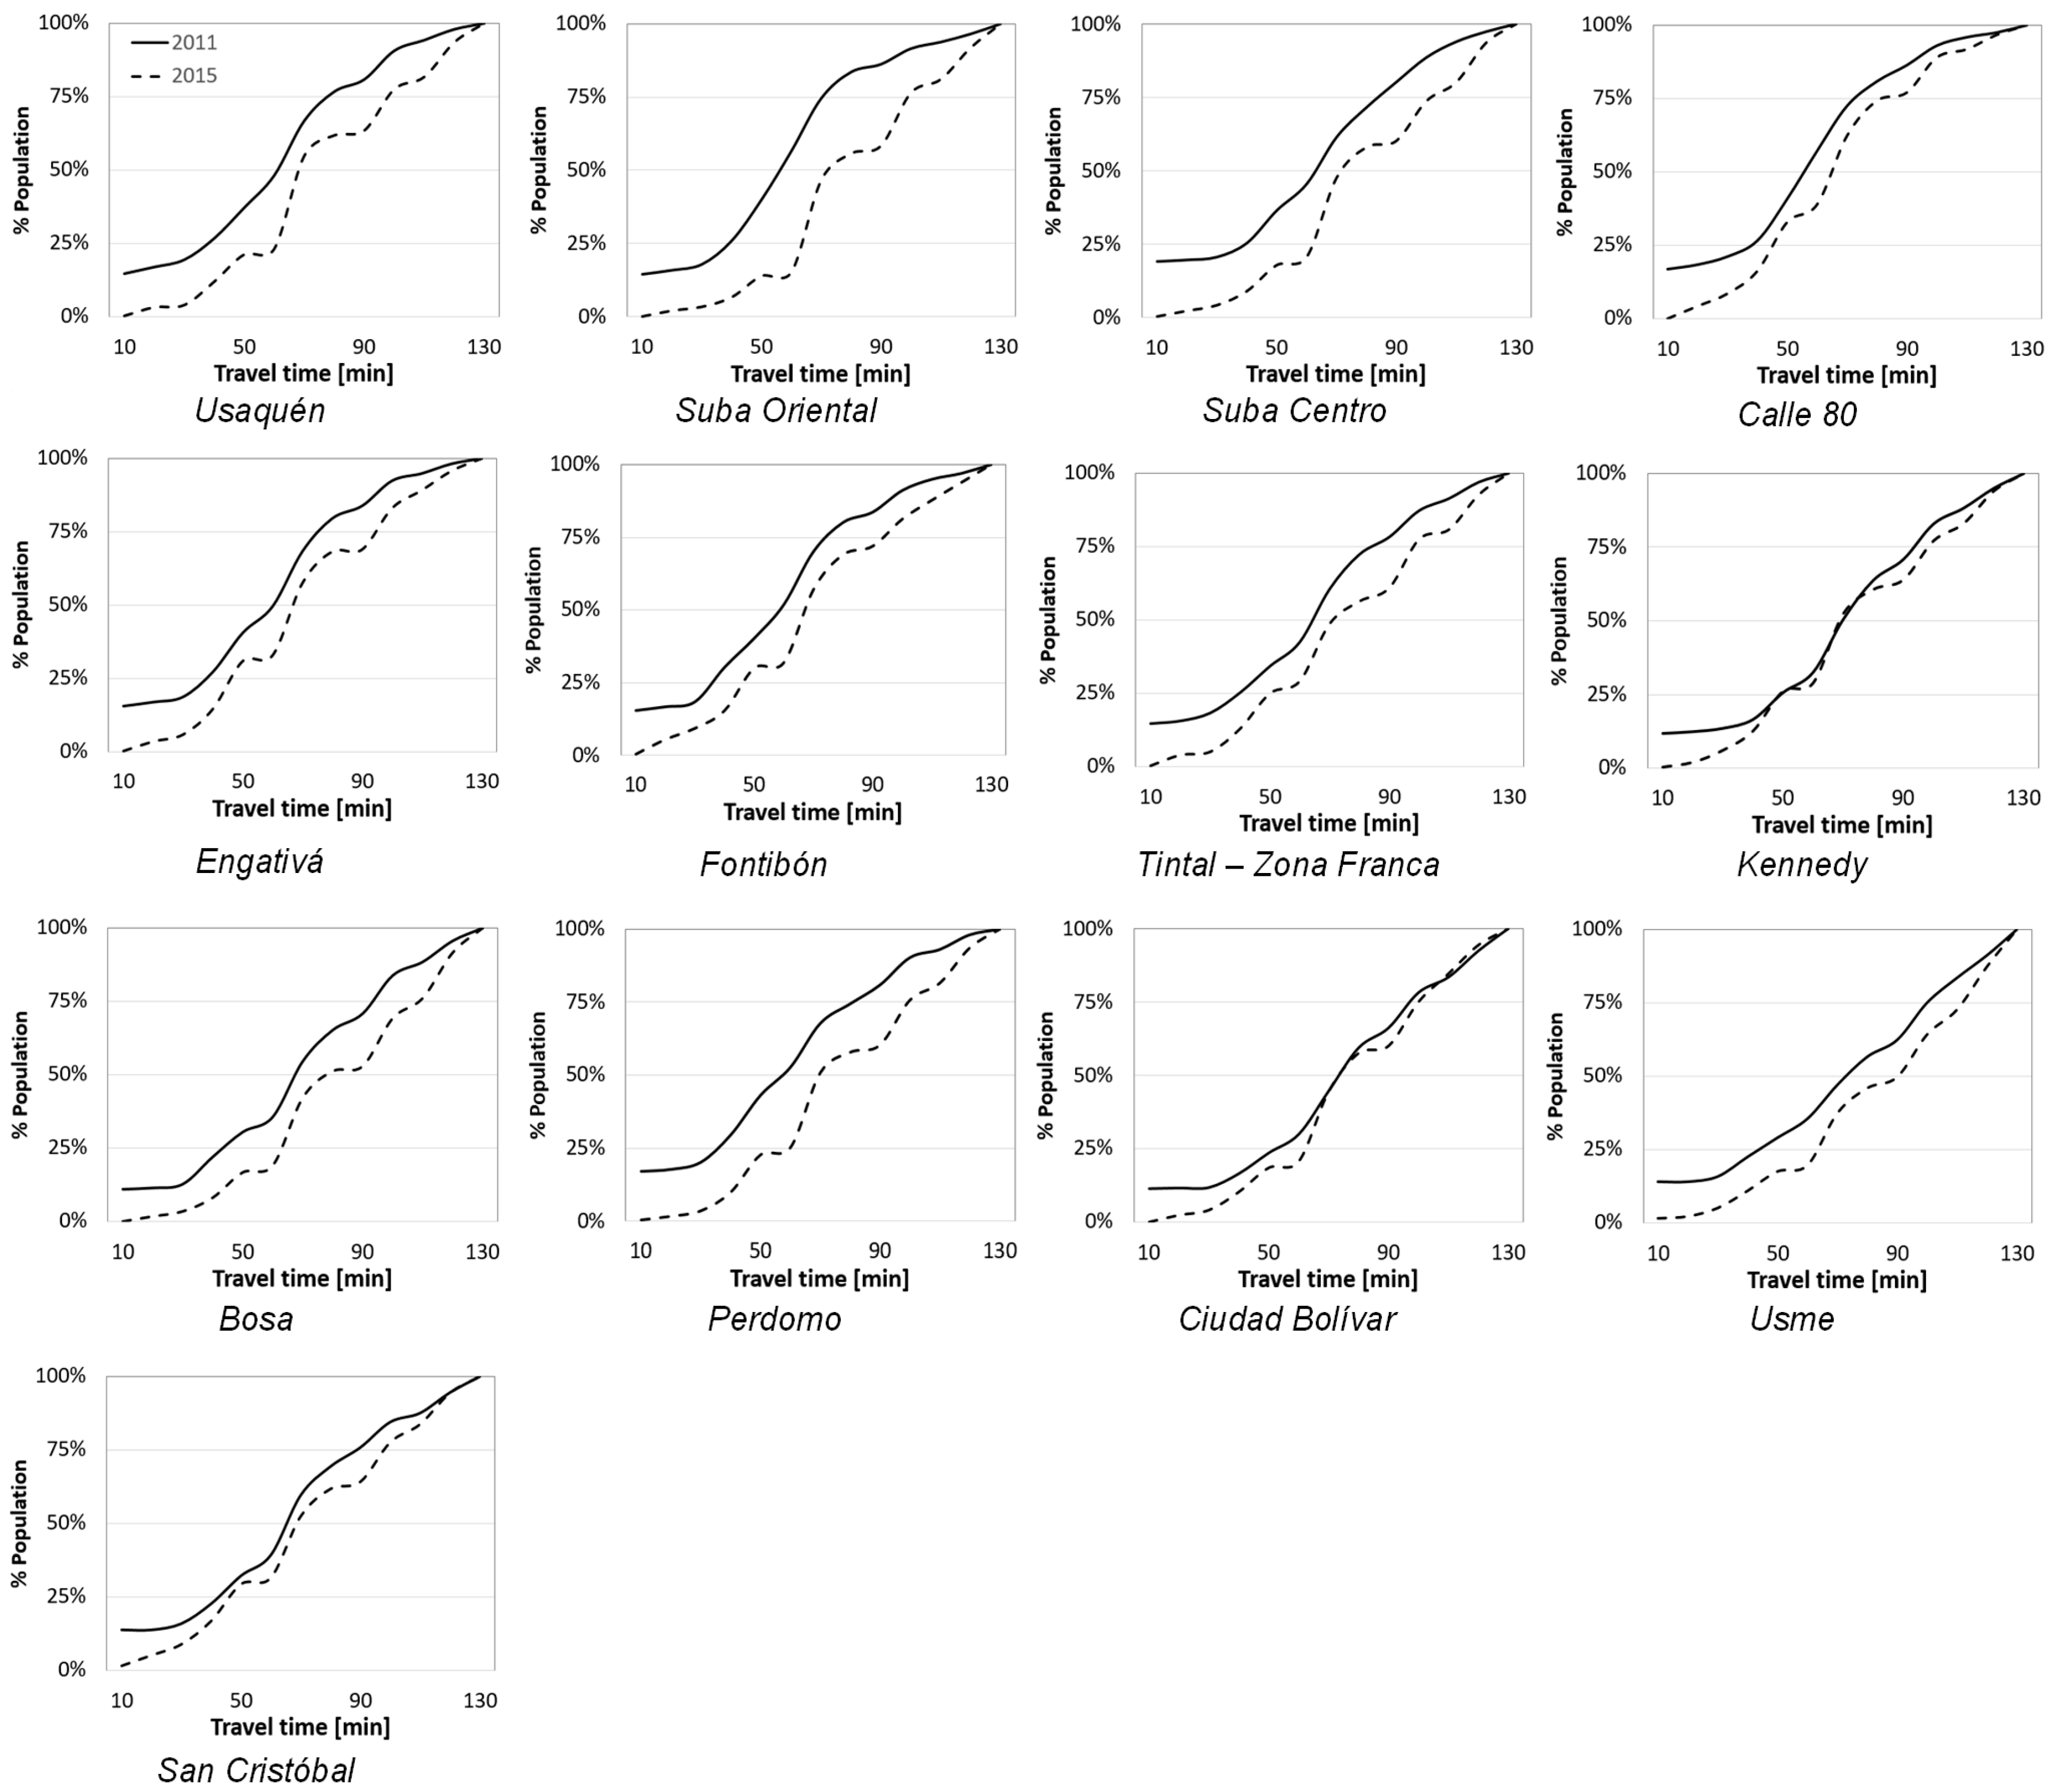
Considering the operational design of the new public transport system, it is worth comparing the areas in which the SITP operation was divided. Results suggest that times required to access to job activities in 2015 are higher with differences between +2% and +30% of the travel times reported in 2011.
Figure 7 shows the percentage of accessible jobs for each travel time threshold in 2011 and 2015. As shown below, there is a deterioration in the accessibility indicator in all zones as reflected by shifts in accessibility curves in all cases to the right. This is a counterintuitive result insofar as the new operational scheme is aimed at making public transport more efficient. Yet at the same travel time threshold, fewer jobs could be accessed after SITP implementation. This has important repercussions in relation to the criteria used for assessing the impact of implementation on various travel features of the target population. Even under a travel time criterion there is an observable loss of accessibility after the SITP. This challenges the current configuration of transport supply in the new system.
The zone whose accessibility indicator worsened the most was
Suba Oriental, an area of the city with the largest concentration of job demand of middle SES in the city, with a reduction of 73%. In other words, if we used a 60-min travel time as the travel threshold, before the SITP the inhabitants of that area could reach 56% of the total job supply in 1 h of travel. After the SITP, within the same threshold, it would only reach 15%. Considering that the structure of the BRT and its schedule of implementation responded first to the connectivity needs of zones such as this one, it is surprising that latter transport reforms would decrease their accessibility. Other less surprising results are that the zones whose operators went bankrupt (see
Section 2.2) are those with the greatest deterioration in their accessibility indicator, after
Suba Oriental.
Although the new public transport system has increased its spatial coverage to almost the entire city, time-space accessibility continues to be constrained for people using Bogotá’s public transport system. This can be interpreted to be one of the reasons why the public transport system is losing modal share in the city. The experience of Bogotá shows that the design of policies aimed at addressing specific needs such as the reorganization of the public transport system, may have unintended distributional issues by producing inequalities in accessibility, given lack of a clear and intelligible operational scheme and a rushed and partial implementation of an ambitious reform plan.
5. Conclusions
Our paper presented the application of a frequently used accessibility indicator to evidence mismatches between public transport policy and the distribution of transport disadvantage in the city of Bogotá. This is a relevant finding from a road transport sustainability point of view as it can inform operational decision making that decreases spatio-environmental inequalities as well as accelerate uptake of public transport in under-served areas. Our paper contributes to debates around transport disadvantage caused by well-intended transport reforms. We argue that by applying an easily understandable accessibility indicator, it is possible to make visible otherwise overlooked distributional consequences of technical decisions. We contend that accessibility, even in a simplified form, can be an important and powerful instrument to assess the performance of a public transport system, and that such systems should recognize accessibility as their main project and policy objectives. Results shown in this paper suggest that, despite methodological and geographical limitations highlighted by previous works advocating for more complex accessibility analysis, simple and readable accessibility metrics can support evidence-based critiques of traditional transport decision making. Results also point in a very clear direction: Public transport systems can reshape the spatial and social structures of a city.
The observed success of Bogotá’s BRT system became the foundation, both operationally and conceptually of the zonal SITP. On the one hand, TM was able to prove that the process of reorganization of public transport can lead to positive equity impacts and social benefits, mainly from travel time savings [
16]. On the other hand, the development of a new system enabled local governments to propose meaningful structural changes in the institutional and governance models of public transport. However, many errors were made in the implementation of the SITP that have led to the visible consequences in terms of access inequalities in Bogotá after 2015. Not only has the new system been affected by serious legal and financial problems, bankrupt operators, low ridership, and the competition of “provisional” SITP—among other operational problems—. The system has failed in general to integrate into the city’s urban and mobility structures. Longer waiting times at bus stops and longer routes in addition to high job concentration in a part of the city have led to unequal access to employment that affects primarily the low-income population [
14]. This becomes a relevant learning for future public transport policies in similar contexts in the Global South as organizational and operational priorities might take precedence over social objectives. From the accessibility perspective, although the system was reorganized, the SITP failed in preventing negative and widespread effects on accessibility, disproportionately affecting some of the most vulnerable areas in the city and defeating the social purposes of public transport policies and interventions.
Further research is needed in relation to mainstreaming the application of accessibility metrics and the examination of accessibility effects of transport interventions in rapidly developing cities. This results can be used as a diagnostic tool. Bogotá’s efforts in relation to this transformation and re-organization of its bus system have many positive elements that need to be explored more in detail and discussed in national and international circles, however, through the new services the isochrones were decreased. Identifying key elements that might still be missing, can contribute to achieving the system’s operational, technical and social objectives. From an equity perspective, further evidence that supports social arguments around public transport systems should also be explored in future research.


