Article

Upland Livelihoods between Local Land and Global Labour Market Dependencies: Evidence from Northern Chin State, Myanmar

1
Division of Physical Resource Theory, Department of Space, Earth and Environment, Chalmers University of Technology, Maskingränd 2, SE-41293 Gothenburg, Sweden
2
Section for Geography, Department of Geosciences and Natural Resource Management, University of Copenhagen, Øster Voldgade 10, 1350 Copenhagen, Denmark
*
Author to whom correspondence should be addressed.
Sustainability 2018, 10(10), 3707; https://doi.org/10.3390/su10103707
Submission received: 11 September 2018 / Revised: 11 October 2018 / Accepted: 12 October 2018 / Published: 16 October 2018

Abstract

:
Livelihoods and agrarian change processes across upland South-East Asia have been explored for decades. Yet, knowledge gaps remain about contemporary livelihood strategies and land dependence in areas previously inaccessible to academic research, such as in upland Myanmar. Moreover, new strands of inquiry arise with continued globalisation, e.g., into the effects of remittances and labour migration on household incomes and livelihoods in distant upland areas. This study applied clustering techniques to income accounts of 94 households from northern Chin State, Myanmar to: (i) Identify households’ livelihood strategies; (ii) assess their dependence on access to land and natural resources; and (iii) compare absolute and relative incomes across strategies. We show that households engaged in six relatively distinct livelihood strategies: Relying primarily on own farming activities; making a living off the land with mixed income from agriculture and forest resources; engaging in wage employment; living from remittances; practicing non-forest tree husbandry; or engaging in self-employed business activities. We found significant income inequalities across clusters, with households engaging in remittance and wage-oriented livelihood strategies realizing higher incomes than those primarily involved in land-based activities. Our findings point to differentiated vulnerabilities associated with the identified livelihood strategies—to climate risks, shifting land-governance regimes and labour market forces.

1. Introduction

Livelihoods and land, worldwide, are inseparably linked through human appropriation of natural resources, and associated environmental feedbacks [1]. In the Asian uplands, rural communities have long relied on subsistence swidden farming and the trade of farm and forest products to make a living off the land [2]. Such livelihood-land relations in rural Asian communities have fundamentally changed over the past few decades, catalysed by the rapid industrialisation of Asian economies and associated social, economic and environmental changes unfolding across the Asian uplands [2,3]. These agrarian change processes have been thoroughly studied to understand development dynamics and contemporary states of rural livelihoods, societies and their environmental interdependence [4,5]. Knowledge about human-environmental system dynamics and states in the Asian uplands has thus been advanced through empirical and theoretical contributions along multiple strands of inquiry [2,3,6,7], towards complementary, but often also contested ends of understanding [8]. Despite these efforts, knowledge gaps remain about geographical areas hitherto nearly inaccessible to academic research, and where new fields of enquiry arise from global and regional change processes; e.g., addressed in the literature that explores how remittances and increasingly complex rural-urban links affect livelihood-land relations in rural Asia [9,10,11].
The uplands of Myanmar are a case in point regarding both of these conditions. The country has remained off the empirical research map of most scholars, due to decades of military rule and ongoing civil conflict, while Myanmar’s ethnic upland communities have persistently relied on swidden farming [6,12,13,14,15,16]. The country’s large diaspora of refugees and migrants maintains cultural and personal relationships, and often remits substantial amounts, to its communities of origin—thus spanning socio-economic networks, far across the country’s borders [17,18,19,20]. Research on these livelihood-land and cross-border connections, however, has only picked up recently, as governance in Myanmar shifts towards more democratic forms and the country opens up internationally. The knowledge base on less accessible regions, such as the Chin hills that are home to some of the poorest people in Myanmar [20], thus remains extremely scarce.
Current knowledge about contemporary livelihoods and land-use patterns in northern Chin State is largely based on Myanmar’s 2014 population census [20], the work of international organisations that have sought to establish baselines for the conception and evaluation of aid interventions [21], and a number of reports that have been compiled by consultants and civil society organisations [19,22]. Academic contributions have explored livelihood-land relations in Chin State through political economy and land-governance lenses [12,16,23], assessed the contribution of forest income to rural livelihoods [24], and land-use transitions in southern Chin State [25]. Recently, Vicol, Pritchard and Htay [9] (p. 459) discussed contemporary livelihood change dynamics and the ‘productive bricolage in southern Chin’, arguing for the merits of conceptualising socio-economic transformations in this area broader than through a narrow ‘agricultural lens’—acknowledging instead households’ diverse local and international entanglements. The same research team also authored one of two recent publications reporting on Chin livelihood strategies [26,27]. The underlying analyses for these reports are based on qualitative methods [26], and data about households’ land holdings and self-reported principal occupations [26], respectively. Although these studies make important contributions to the literature on livelihoods in the Chin hills, quantitative assessments of income, poverty and vulnerability—with explicit focus on households’ disparate livelihood strategies—remain sparse.
This research gap means that stakeholders, with an interest in rural development processes in the Chin hills, find themselves confronted with a void of practical knowledge about households’ livelihoods and land reliance—a situation that may inhibit decisive action at a critical time of transformative changes across Myanmar. The past years of Myanmar’s gradual emergence from decades of military rule have been marked by bustling activity of development agents and private investors, who have sought to stake their territory and affect meaningful change for rural people across the country. Legislative activities, including the enactment of two land related laws in 2012 and the country’s land policy process, have further initiated shifts in land-governance that will—in the long run—likely lead to a state administered registration and legitimisation of private and corporate claims to land access and ownership, thus reshaping livelihood-land relations across the country’s uplands. Governmental decisions about how to formalise land tenure arrangements, in areas that have to date often been governed according to customary rules, are bound to define the space for land-use decision making in upland Myanmar for decades to come—and could thus curtail potential ambitions to leverage livelihood and land-use trajectories onto alternative pathways. Timely insights about the current state of rural livelihood strategies and their dependence on land in northern Chin State are therefore required to ground decision-making in local realities and capitalise on relevant lessons from successful livelihood interventions across the region. Policy and development actors may thus stay clear of decisions that lead towards development pitfalls, such as economic dispossession, increased socio-economic inequalities, overexploited environmental resources, and eroded cultural heritage and social capital, which are often associated with an unbounded strive for economic growth, ‘the global land rush’ [28] (p. 153), and agricultural intensification [29].
For these reasons, we used a quantitative livelihood analysis to deepen current understandings of livelihood-land interlinkages in Myanmar’s uplands. Specifically, we asked: (i) Which livelihood strategies sustain households in our study area; (ii) how reliant are these strategies on access to land and natural resources vis-à-vis other income sources; and (iii) how do these strategies compare, in terms of income-poverty outcomes?
Building on insights from this inquiry, we demonstrate that knowledge of differentiated livelihood strategies facilitates reflections about the specific vulnerabilities of disparate household groups—which in turn point to a need for targeted development interventions in the Chin hills, and across relevant south-east Asian scaling domains. Our insights add to the multifaceted literature on the dual entanglement of rural livelihoods in traditional land-based activities and globally interconnected economies. Moreover, they can inform efforts to monitor and understand long-term livelihood and land-use change processes in Myanmar’s uplands.

2. Materials and Methods

2.1. Approach

Livelihood research approaches build on more than two decades of sustainable rural livelihoods thinking [30]. Departing from the concept of ‘sustainable livelihoods’ as a ‘means of gaining a living’ [31] (p. 5), livelihood approaches have over time branched out into different strands of livelihood development research and practice [30]. Yet, central to most approaches remains a focus on core elements of the livelihood framework, of the United Kingdom’s Department for International Development [32]: Livelihood strategies (i.e., portfolios of livelihood activities) that households engage in to realise livelihood outcomes, such as income from different livelihood activities, through the mobilisation of assets and claims, in contexts that either support or constrain households’ ability to sustainably meet their livelihood objectives.
For this study, we took a quantitative livelihoods approach, assessing rural livelihood strategies in terms of net income that households derived from various sources. First, a multi-topic household survey, largely designed upon prototype questionnaires, which were developed for quantitative studies of rural livelihoods and their reliance on forest and environmental income [33,34], was employed to capture data about households’ income from various sources. Then, similar to Khatiwada, et al. [35], Parker, et al. [36], and Walelign [37], we used cluster analysis techniques to identify groups of households with similar income portfolios, making the simplified assumption that these portfolios equate to portfolios of households’ livelihood activities, i.e., livelihood strategies. Finally, we used statistical methods to test for significant differences in income-poverty outcomes across clusters.

2.2. Study Area

Our data was collected in four rural villages (Figure 1) in Tedim township, northern Chin State, Myanmar. With a population of 478,801 inhabitants and a population density of 13.3 inhabitants per km2, Chin accounts for just 0.93% of Myanmar’s total population, and is the second smallest State in the country [20]. Geographically, Chin State belongs to the Hindu-Kush Himalayan region and is characterised by several mountain ranges, the Chin Hills, which are north-south oriented and traversed by the Manipur river. Typical mountain ridges in the area range in height between 1500 and 2000 m, with steep slopes, and narrow valley bottoms at elevations of less than 500 m above sea level. The soils in northern Chin State are Cambisols [13] and the forest ecosystems in the area are characteristic of the Chin Hills—Arakan Yoma Montane Rain Forests [38], and the Northeast India—Myanmar Pine Forests ecoregions [39]. The mountain slopes of northern Chin State are mostly covered by characteristic swidden farming patchworks of fields and forest-regrowth’s in different successional stages.
Tedim township shares an international border with India to the west, township boundaries with Tongzang and Falam Township to the North and South, and a boundary with Sagaing Region to the East. The township’s population is mostly rural—only 15.4% of its inhabitants live in urban areas. The township’s urban centre, also called Tedim, hosts a hospital, offices of governmental agencies and the primary markets for agricultural and consumer products in the area. From the study villages, Tedim was accessible via dirt roads that can be navigated with four-wheel drive cars throughout the year. Landslides, triggered by heavy monsoon rainfalls, however, make these roads frequently impassable for weeks to months, effectively cutting-off villages from other settlements and secondary markets in Kalay, Tonzang and India. A government funded scheme to upgrade and tar parts of Tedim Road, which connects Tedim to Kalay in the South-East, and to Tonzang, Cikha and Manipur, in the North-West, was underway during the field campaign for this study.
Characteristics of the four study villages are summarised in Table 1. Maize and rice were staple foods in all villages; the latter being the preferred, but also more costly food item, as it had to be purchased by most households. Households’ ability to consume rice was, thus, a function of relative wealth, with poorer households consuming only maize as a meal staple, while better-off households consumed a mix of maize and rice. Ninety-four percent of the studied households reported to have had sufficient food to meet their food needs during the 12-month time span covered by the household survey. Better off households in all villages had limited access to either mains electricity, micro-hydropower stations or photovoltaic systems. However, lack of money prevented electricity access for poorer residents across villages, and fuelwood remained the primary energy source for cooking and heating in almost all households. Mobile devices were still rare, but increasingly used by younger residents and village elites, despite patchy network coverage outside Tedim. Water was scarce in all villages, limiting dry-season irrigation to home gardens and a few terraced farms in proximity to natural springs. Most households in Lailo and Tuilangh could, however, easily obtain water from village water sources, whereas residents of Tualzang needed to invest substantial labour resources to obtain water for domestic use.

2.3. Data Collection

2.3.1. Overview

Fieldwork for this study was conducted with the help of two locally recruited research assistants. Data collection proceeded in three successive phases—scoping, sampling, and implementation of the main household survey—during January and February 2017. Insights from observations, local knowledge of the research assistants, and qualitative inquiry during the scoping phase allowed for an iterative refinement of the household survey, which was thoroughly field tested prior to implementation. Informal conversations with a non-probabilistic, opportunistic sub-sample of survey respondents, and repeat interviews with village leaders, and staff from the locally operating NGO Ar Yone Oo—Social Development Association—who acted as a gate keeper—provided additional opportunities for inquiry and data triangulation, prior to departure from the study site. Verbal consent to participate in research activities was obtained from all respondents.

2.3.2. Scoping

Four study villages were purposefully selected, aiming to capture inter-village variations in proximity to the urban township centre, land-use practices and tenure arrangements. Scoping activities in villages commenced with semi-structured key informant interviews with village authorities (n = 4), to gain contextual insights about the study villages (Table 1). Subsequent focus group discussions (FGD) addressed (i) the utility, seasonality, prices and units of tree products (n = 4 FGD); (ii) common annual and perennial agricultural crops and their prices, units and related seasonal management practices (n = 1 FGD); (iii) perceived trends in livestock husbandry, wild animal population changes, and prices and units of domestic and wild animal products (n = 1 FGD); as well as (iv) the utility, prices and units of uncultivated plants and other natural resources (e.g., clay, stones) that villagers obtained for medicinal purposes, domestic use, or sale (n = 1 FGD). All discussions were facilitated by the research assistants in the local language, with guidance from the first author, using participatory, visual tools (e.g., seasonal calendars, matrix-based recording of answers and utility scores). Respondents were invited by village leaders, according to the research team’s requests. Recruitment bias is therefore likely, but acceptable, as discussions covered common knowledge about consumption goods, rather than contentious issues. Each group of 6–10 respondents was comprised of an equal number of men and women from a range of age groups.

2.3.3. Sampling

The survey was administered to a stratified random sample of 95 households from the four study villages, whereby the sample size of close to 100 households was motivated by recommendations stipulated in the technical guidelines of the Poverty Environment Network, of the Centre for International Forestry Research [33]. Updated records of resident households in each village were provided by village authorities and used as the sampling frame for the survey. A random sample of households was drawn from each village list, for inclusion in the final sample, with probability of selection proportionate to the total number of households in the respective village. Two drawn households could not be interviewed, due to illness and lack of willingness to participate, leading to replacement with alternative households. One questionnaire form was found to be incomplete at the data cleaning stage, resulting in a final sample of 94 households.

2.3.4. Household Survey

The survey instrument captured information about households’ socio-demographic characteristics, labour allocation to different livelihood activities, income sources and associated expenditure streams, households’ asset endowments and own perceived welfare and welfare trends. Data about income streams from crops, farm-trees and other natural resources that households obtained, from areas under private management according to customary rules, was captured at the level of individual products and plots of land. Costs for production inputs (e.g., fertiliser) were captured at plot level; harvest and distribution costs (e.g., hired labour, motorbike fuel to reach markets) at product and plot level. For products from non-private land, respondents were asked to estimate the percentage share of goods derived from areas under different land-use and tenure regimes, following the methodology employed by Oli, et al. [40]. The rational for this very detailed disaggregation, and diversion from the methodological guidelines that the survey instrument built upon [33,34] was to aid respondents’ recall ability, and thus increase the reliability and validity of the obtained data, despite a long recall period. Further, it allowed us to delay the aggregation of income data to broad income categories to the analysis stage, to explore the origin of income streams by land-use practices. Information about the value of provisioning services, e.g., freshwater or regulating services, such as soil fertility restoration, was not captured, due to challenges associated with the valuation of these services in absence of relevant markets. The outstanding importance of these services for the studied households should, however, be self-evident. As some households derived their entire domestic water from local springs, and almost exclusively relied on managed fallows to maintain their farmlands’ productivity.
Survey implementation was realised with hand-held tablets and digital questionnaire forms that were partially translated into the local language. This eased standardised data entry, and the consistent use of extensive probes, for commonly used crops, trees, forest products, other natural resources and animal products, which were based on results from FGD. Respondents were asked to recall gross income and associated expenditure items, in cash or in kind, for the twelve months period of December 2015 to November 2016; reporting first by season (i.e., hot = December–May; cold = June–November), then by the number of weeks per season, the harvest quantity per week, applicable harvest units and own-reported prices for each income or cost item. The value of household assets was captured as the currently expected sales price of items. All survey interviews were conducted by the field assistants in the local language; in the first instance with the head of the household, or otherwise the household member with greatest knowledge about the household’s economy, among those present. The first author participated in more than half of all interviews and presented the research team individually to each sample household, to build trust and willingness to respond.

2.4. Data Preparation and Income Aggregation

The survey data was pre-processed prior to statistical analysis, including translation of local language to English terms, consolidation of obvious data entry errors (differences of several orders of magnitude compared to similar items), additions to digital records from handwritten fieldnotes and imputation of missing prices for income or expenditure items, with median values from comparable items reported by other households.
Principal categories of net household income (Table A1) were calculated by taking the gross sector-specific income and subtracting respective expenditures. We distinguished cash and subsistence income, and attributed production expenditures according to the share of gross income obtained from each of these sub-categories. Plot level expenditures were allocated to specific products, proportional to the income share generated by the product. Absolute net income figures were equivalence scale adjusted, following the procedures outlined by Cavendish [41]. Income portfolios of different households could thus be meaningfully compared, despite inter-household differences in demographic composition and household size.

2.5. Data Analysis

The cluster analysis was based on 13 input variables (Table A1), representing relative shares of households’ total net income, except income from value addition through livestock husbandry and the processing of natural products. The latter categories were excluded from the analysis, as these income estimates were perceived as highly uncertain. These uncertainties were due to assumptions made to split and attribute fodder expenditure shares in the calculation of net income from livestock products and heard-growth (i.e., asset build-up), respectively; and from perceived inconsistencies in figures reported for income from alcohol production–not uncommon for this type of data [41].
Clustering was done in two steps. First, an agglomerative hierarchical cluster analysis using Ward’s method was run, to identify the ideal number of clusters to interpret the underlying variation in the data. The distance criterium for clusters to be merged in each agglomerative step was a minimised increase in the sum of squared differences; and a six-cluster solution was selected, based on inspection of scree-plots. Secondly, a k-means algorithm was initiated from the cluster centres that had been identified with the hierarchical clustering technique, to define the final cluster membership of each household case. The k-means cluster analysis yielded a lower sum of squared differences than the hierarchical cluster analysis, thus improving the cluster solution. The clustering result was further validated through silhouette analysis and visual inspection of overlaid distributions of data points for the different clusters.
We described household demographics, income streams, self-reported welfare and asset variables as means, medians, percentiles, standard deviations and frequencies. Kruskal-Wallis tests were used to test for significant differences across household clusters, to account for outliers and the skewed nature of the data. Post-hoc analysis included pair-wise comparisons according to Dunn’s procedure, with a Bonferroni correction to account for multiple comparisons. All analyses were conducted with SPSS Statistics Version 23.0.0.3.

3. Results

3.1. Village and Population Characteristics

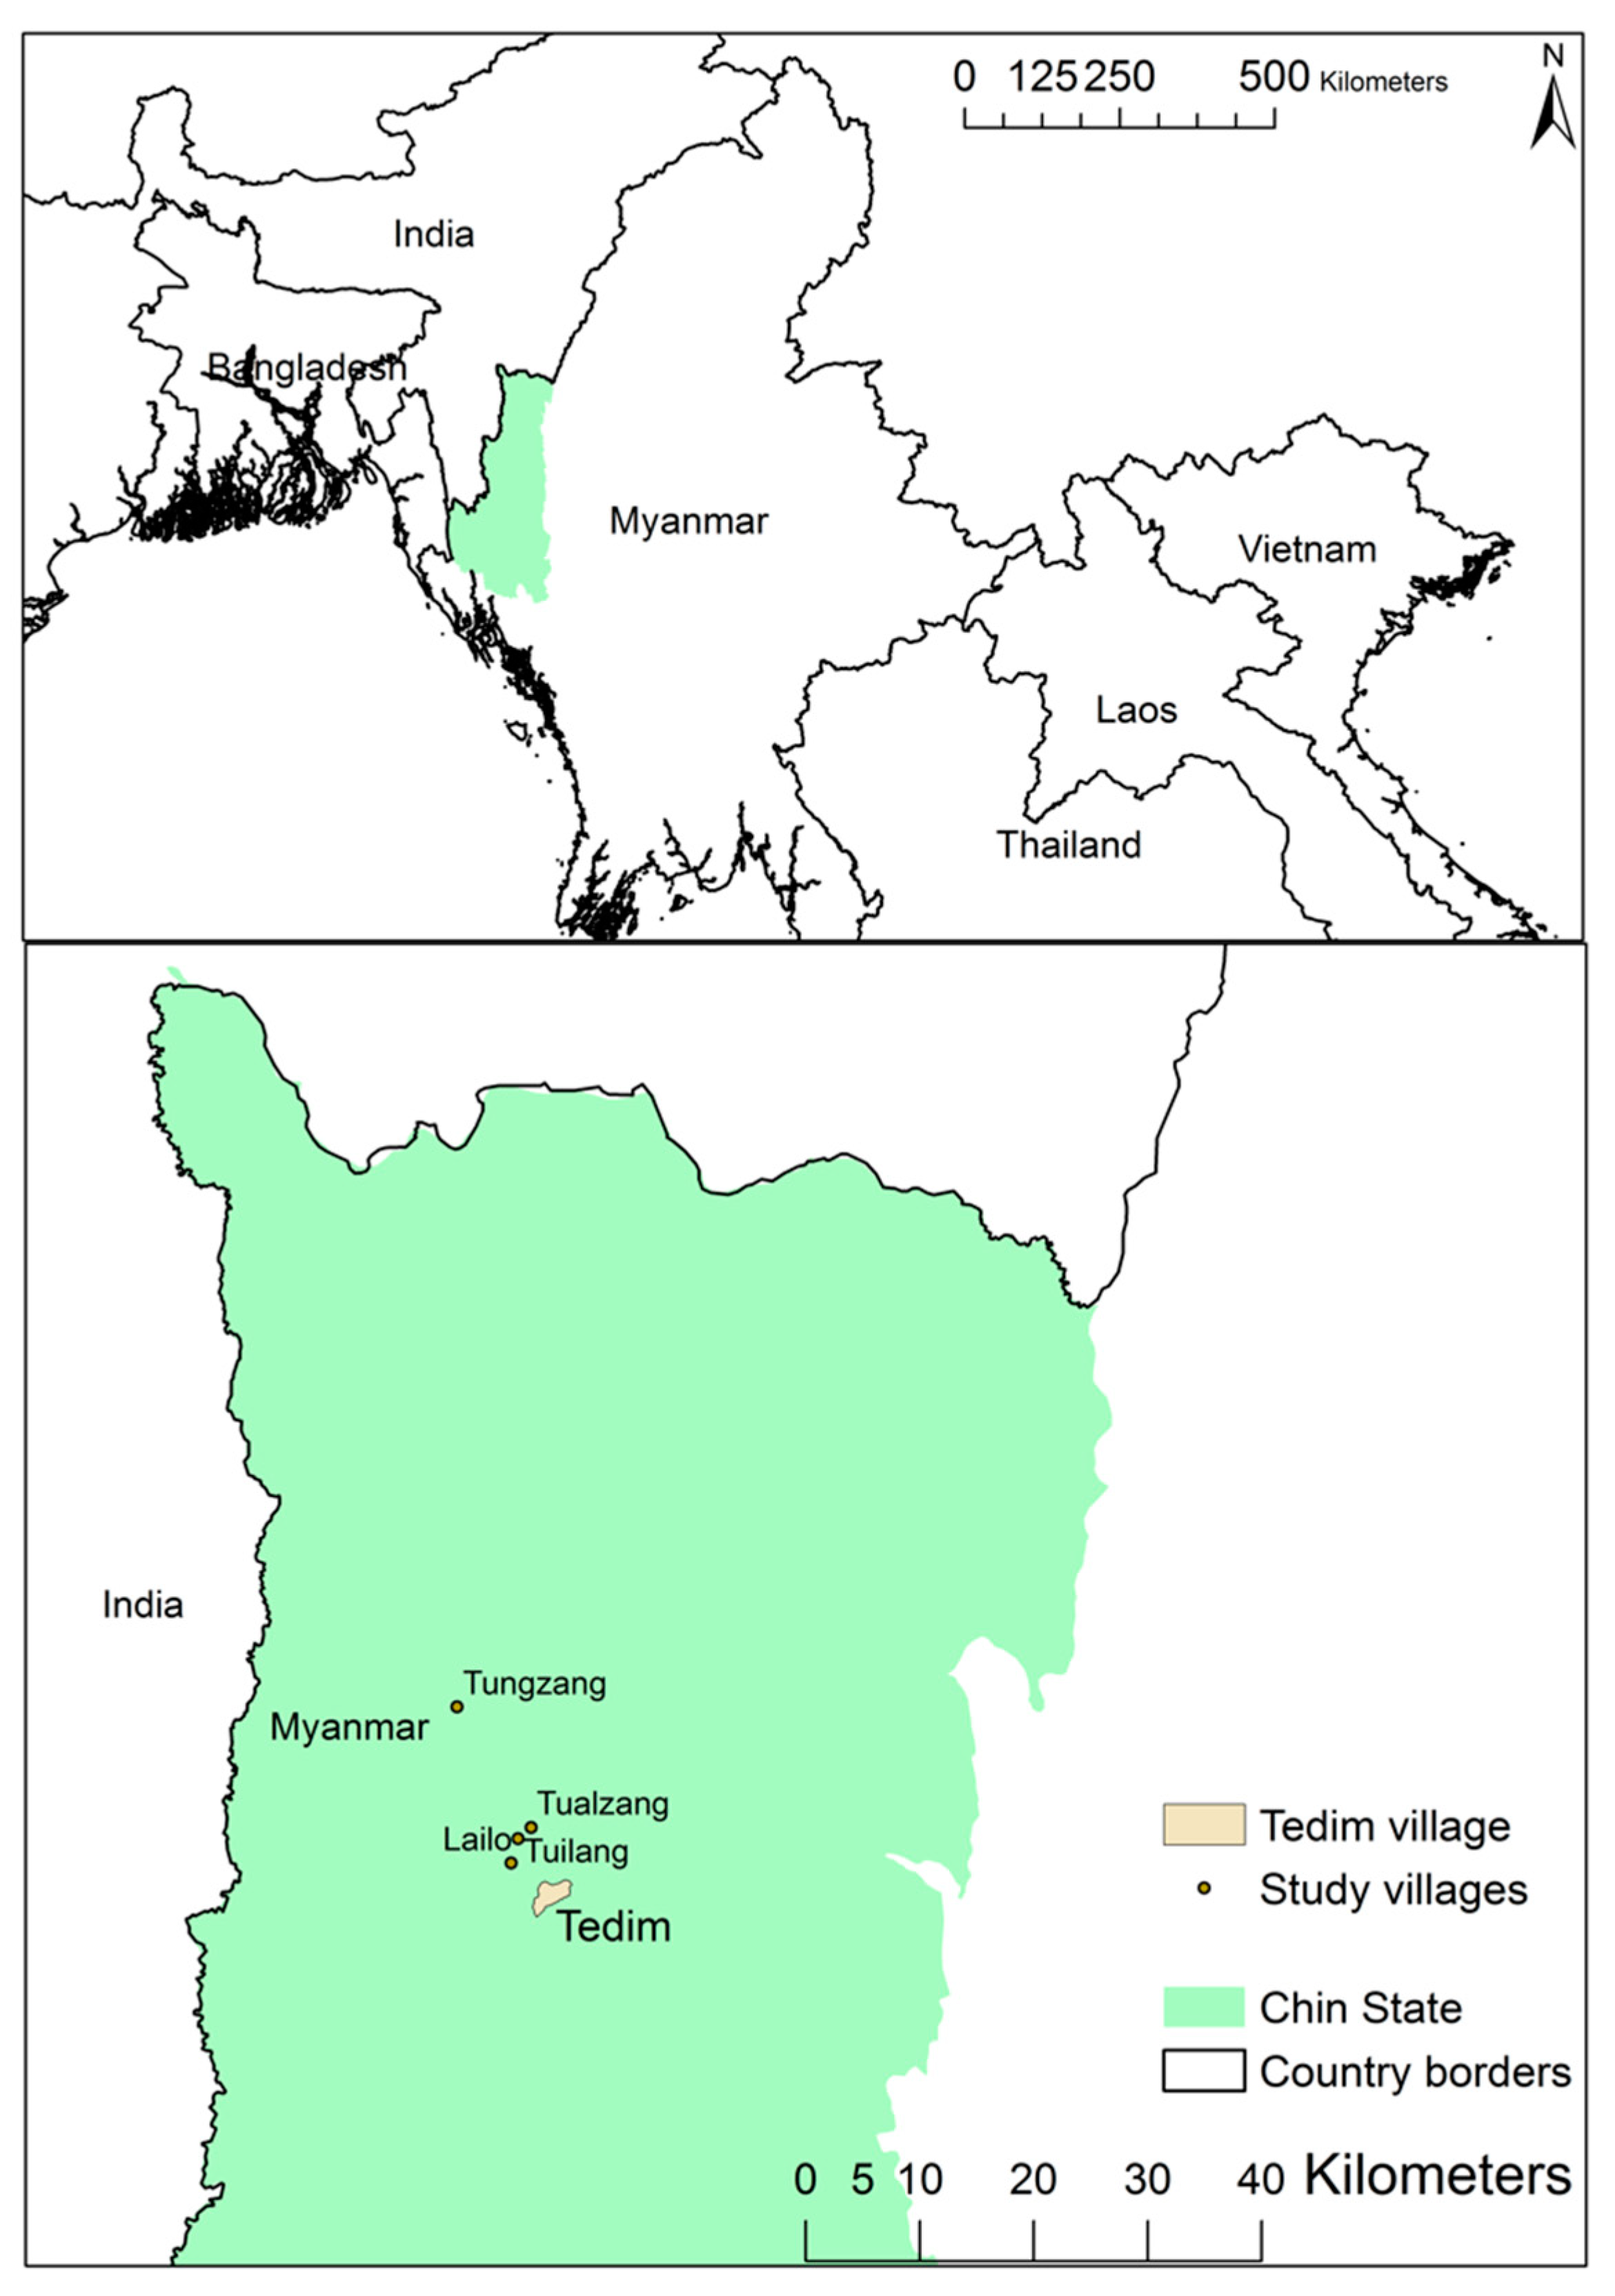
Populations of the study villages differed substantially in size, ranging from approximately 103 to 350 resident households, and 683 to 2400 inhabitants, respectively (
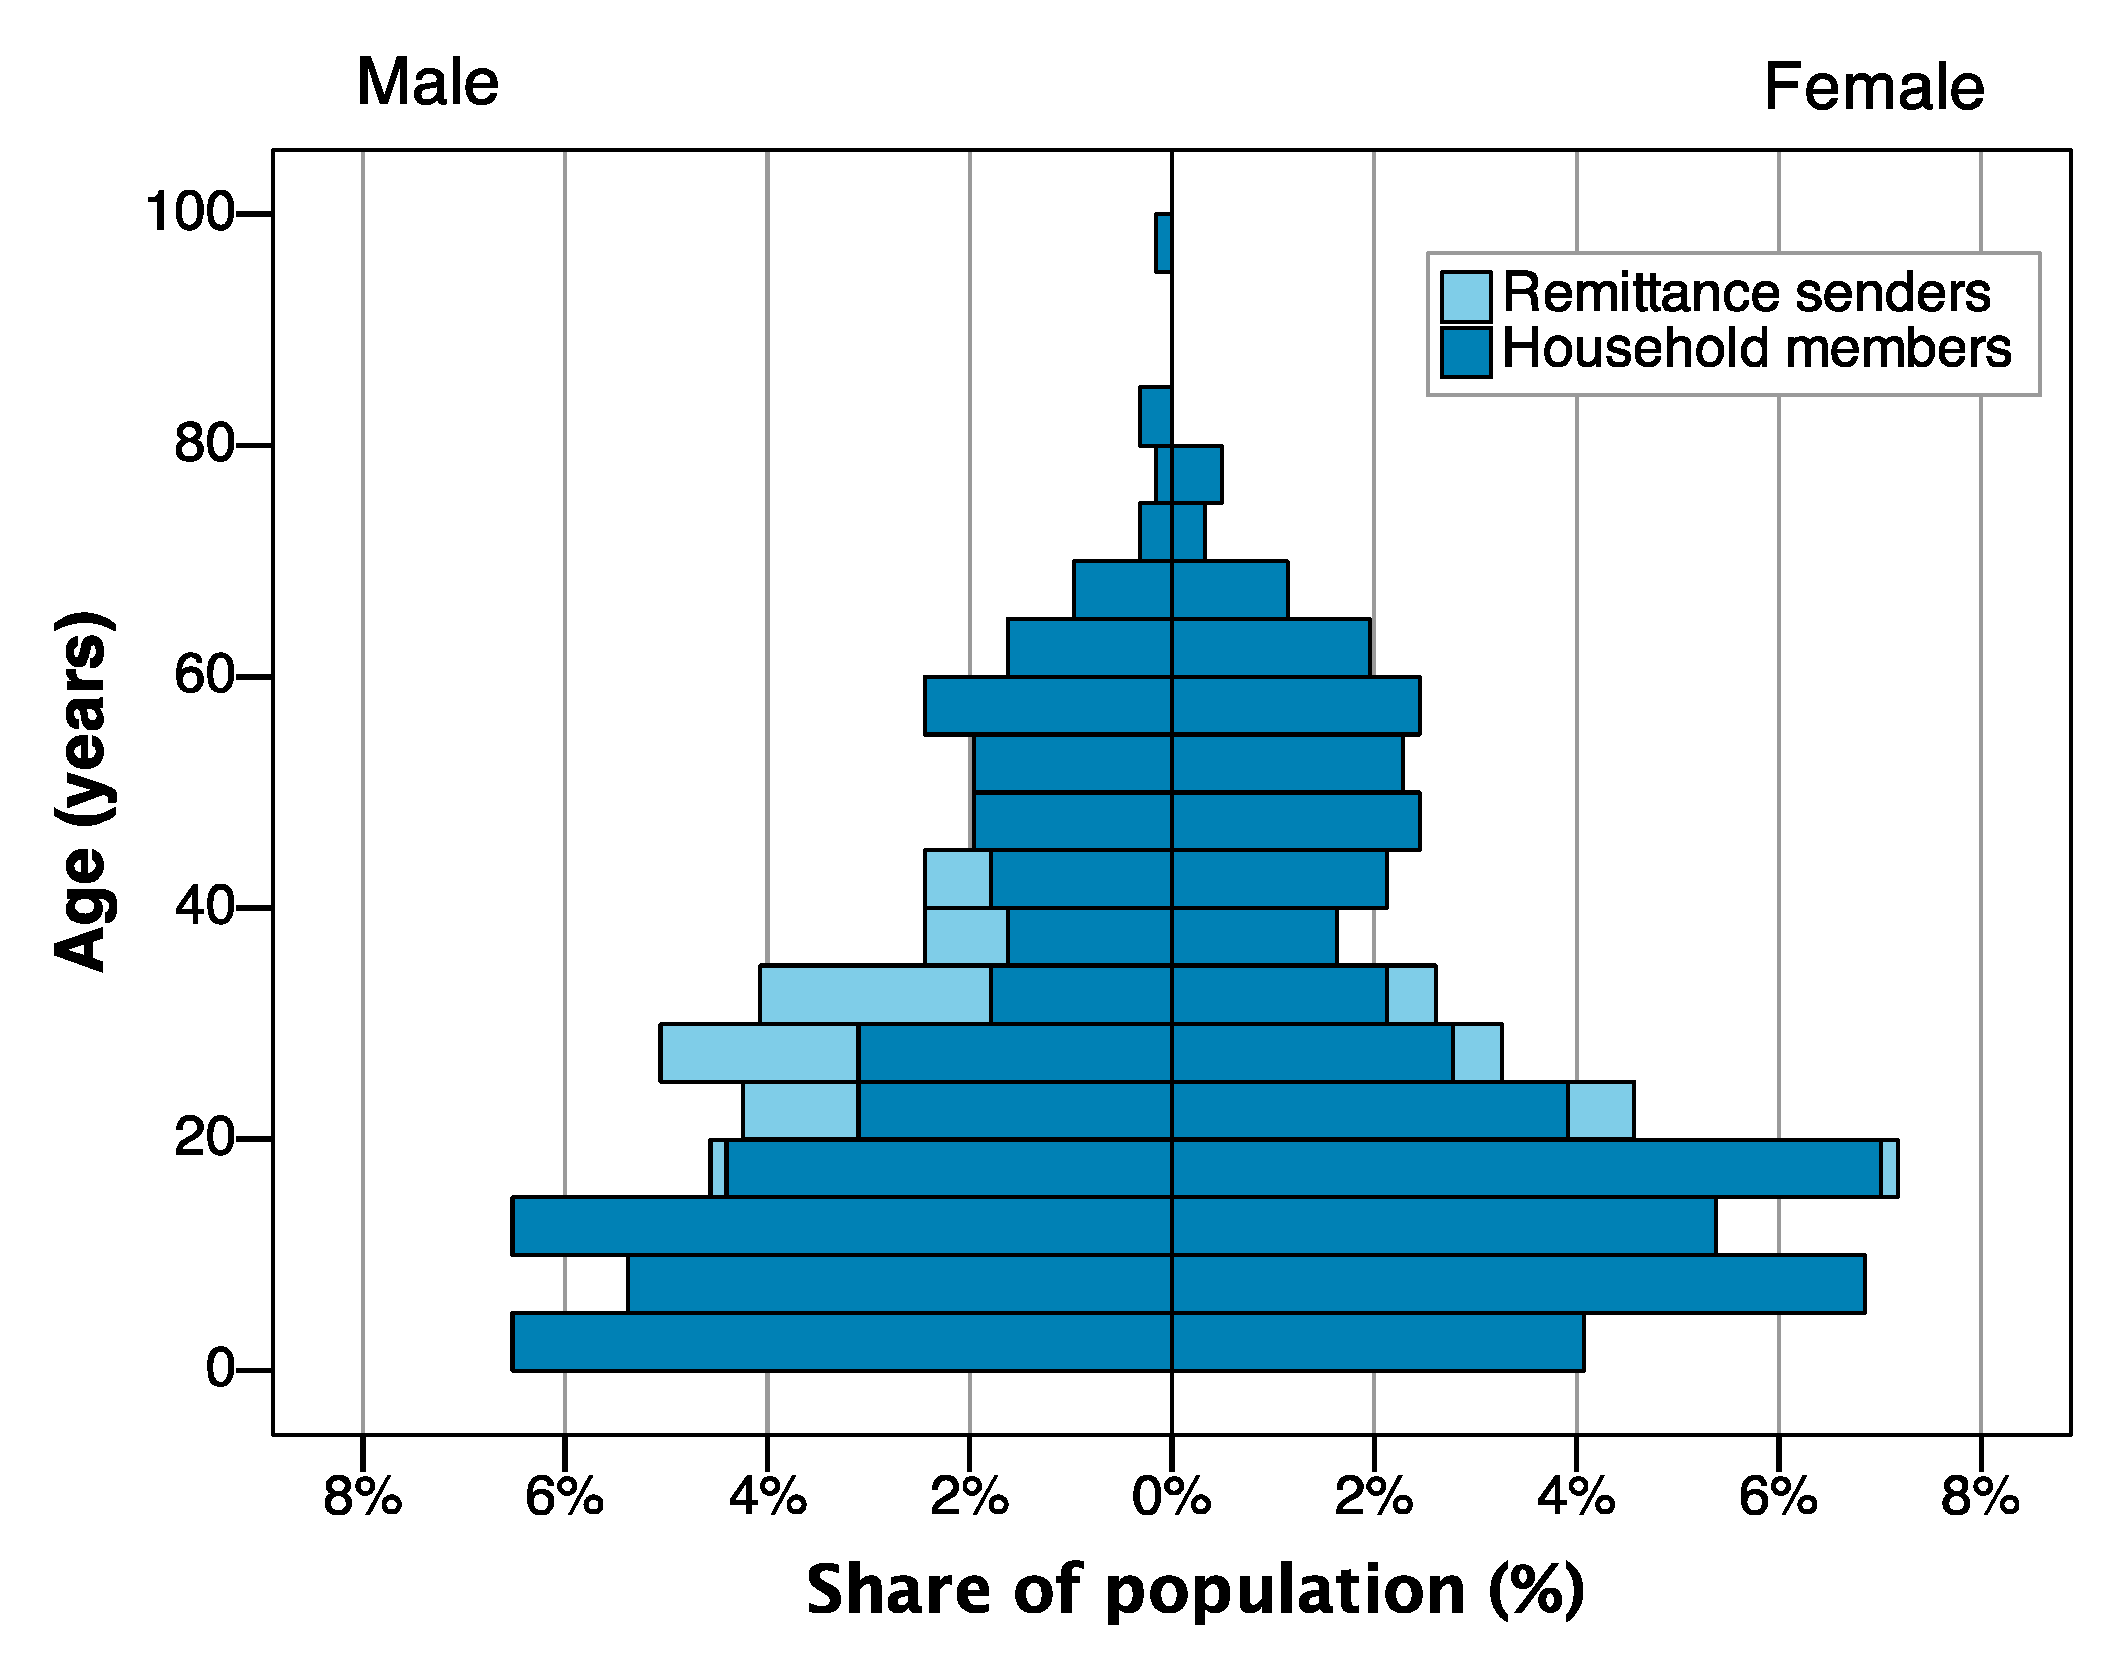
Table 1). The land area under tenure was, however, relatively similar, implying large differences in the ratio of land assets to residents across villages. Village level population records and de facto resident numbers were discrepant across all villages, as official population figures did not account for temporary absent outmigrants, despite migrants’ tendency to remain abroad for several years at a time, or even obtain foreign citizenship. Permanent outmigration of households to Tedim, Kalay or India was common across villages and most pronounced in Tungzang, whereas in-migration had been rare during the past ten years. Populations in all villages had grown in absolute terms over a ten-year period, with local records implying an increase in households and individuals in the range of ≈20–40% and 27–55%, respectively. The average household size in adult equivalent units (AEU) was 3.9 (SD = 1.4). The population structure exhibited high birth rates and dependency ratios across the sample, as well as a pronounced outmigration trend in the 20–40-year age group (Figure 2). The median dependency ratio was 50% (interquartile range (IQR): 19–150%), and approximately 30% of households had a dependency ratio of more than 100%.
The main decision makers of 79% of the households were married and living together with their spouse; whereas 21% of households were single headed. The average age of household heads was 50.9 years (SD = 13.8), and 13% of households were female headed. The extent of household heads’ schooling was mostly limited. Five percent, fifteen percent, and thirty-two percent of household heads had graduated from high-, secondary-, and primary school, respectively; whereas 31% had not completed primary school, and 17% had not received any formal schooling.

3.2. Livelihood Activities and Associated Income Streams, Aggregated across Sample Households

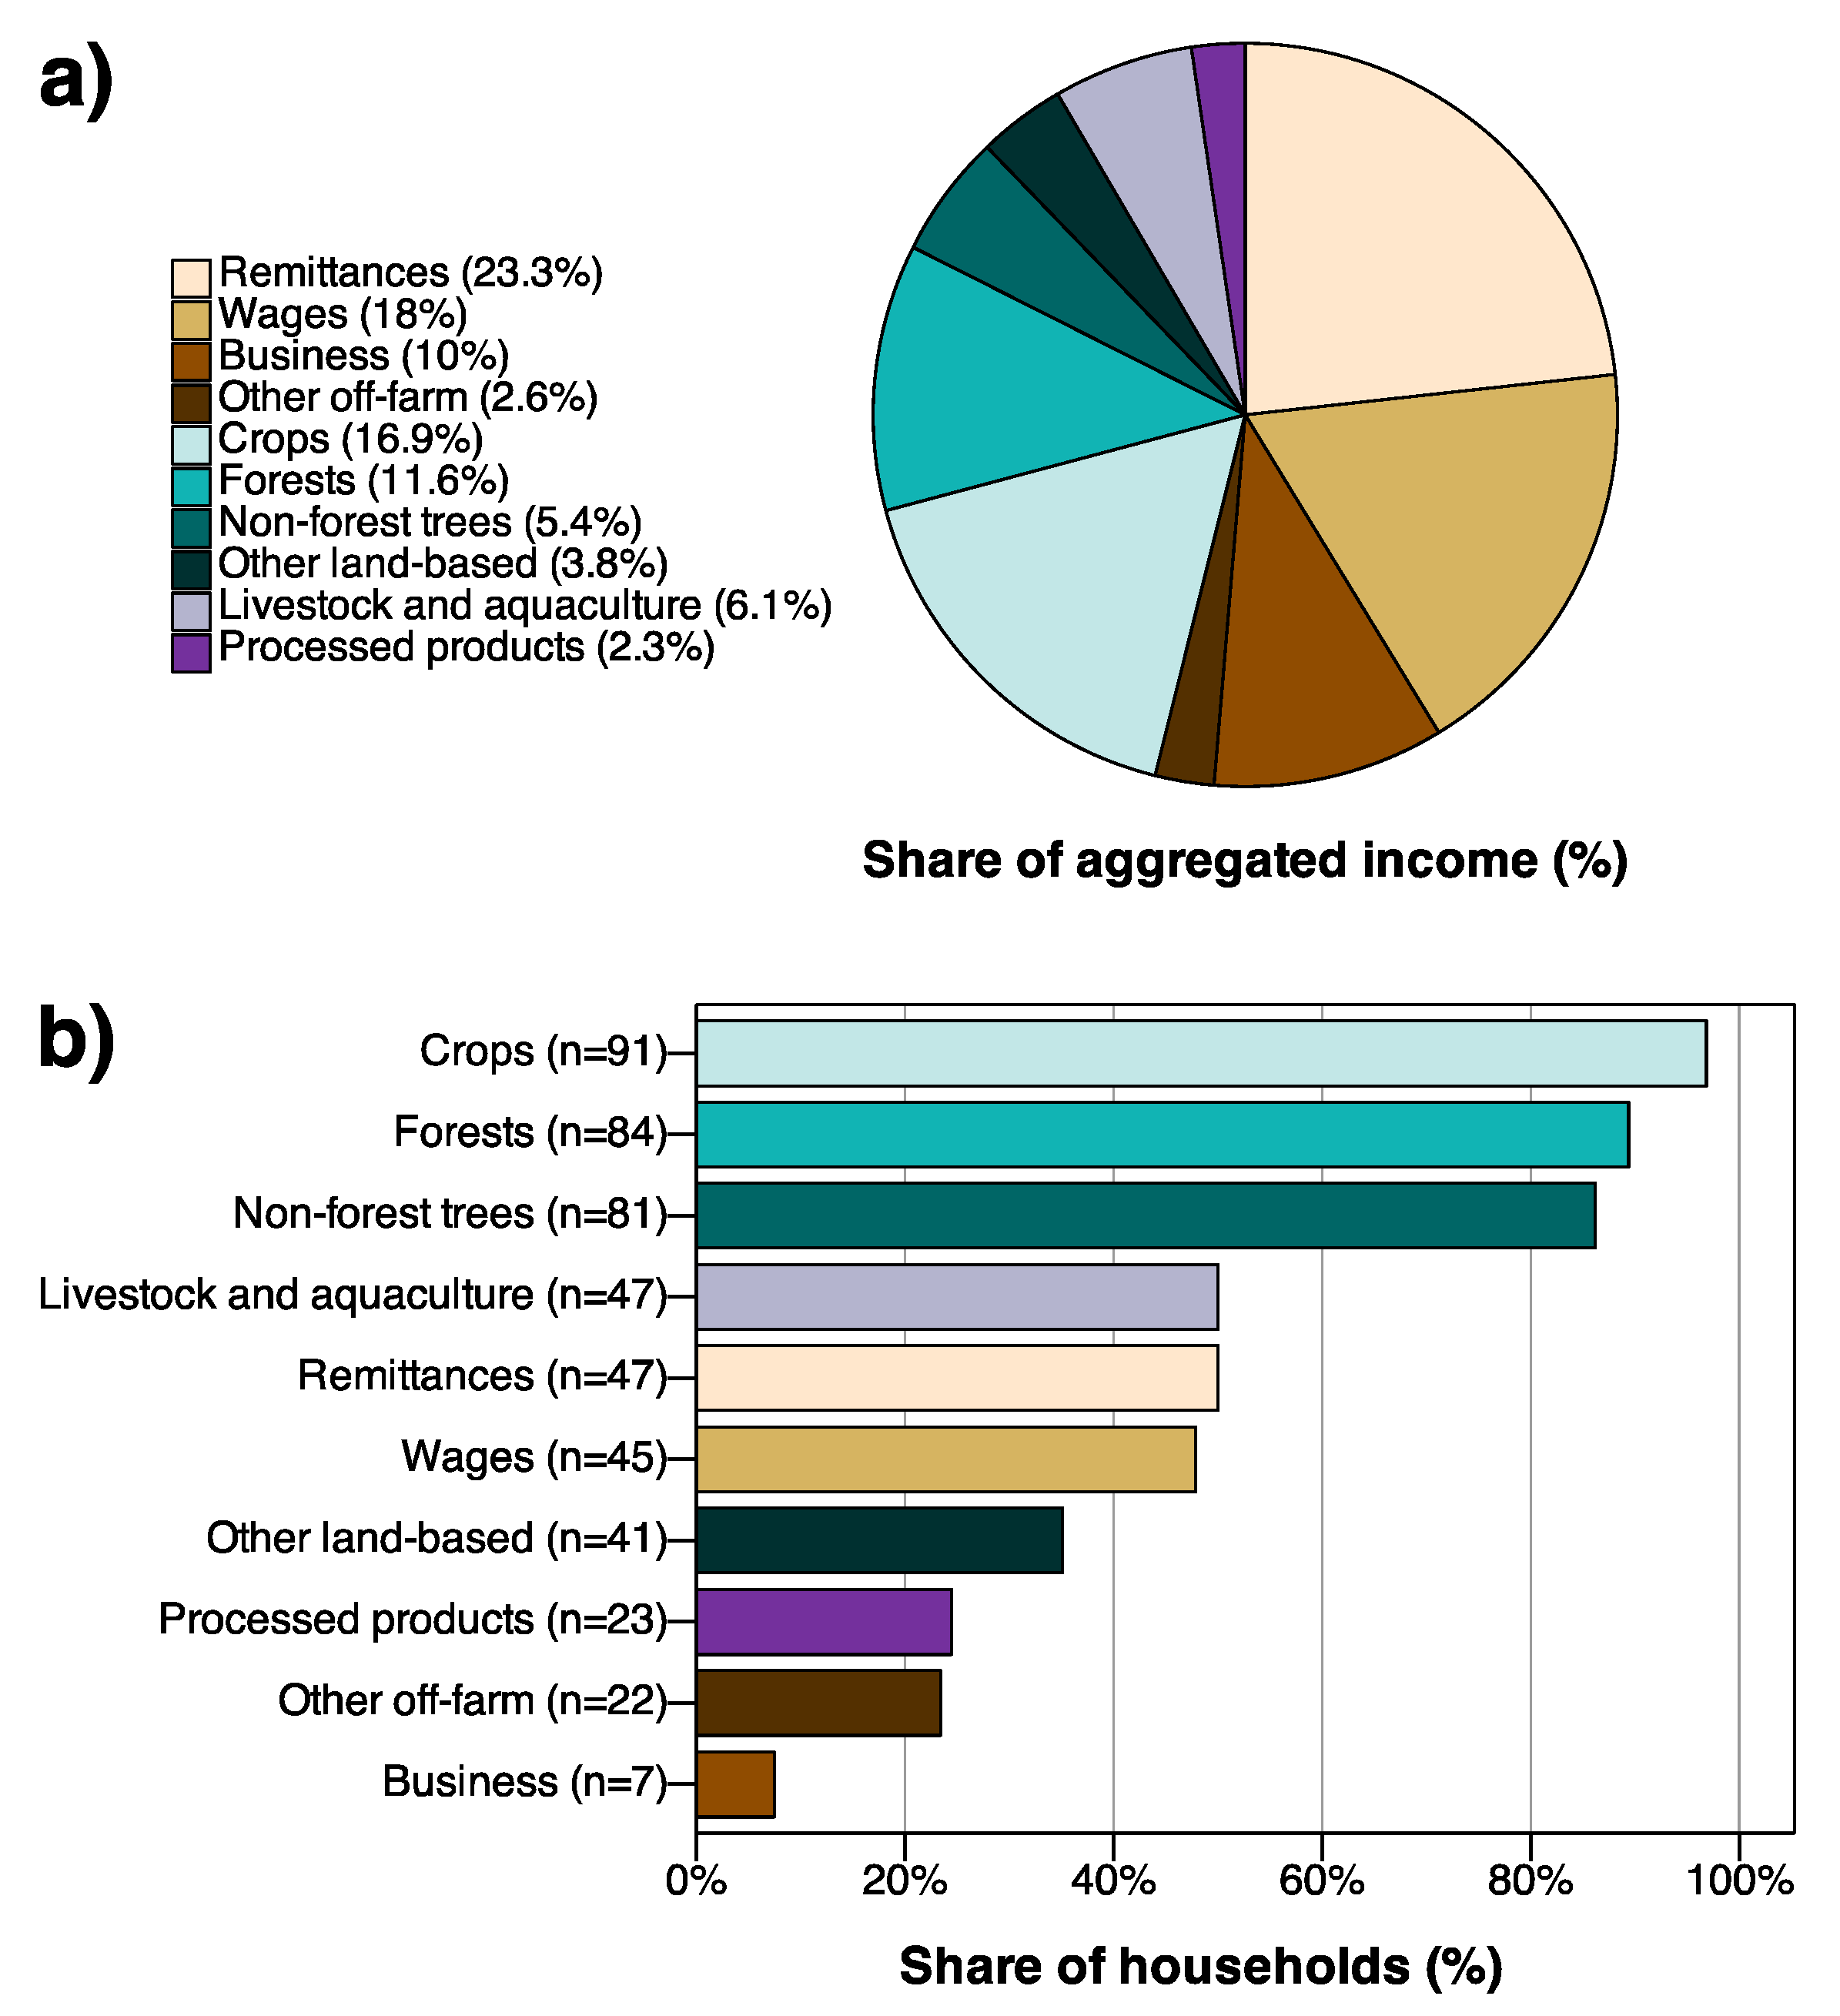
Households’ livelihood activities fell into three broad sectors: (i) Land-based, (ii) off-farm, and (iii) natural resource reliant value adding activities. Activities in the off-farm sector accounted for 54% of households’ realised aggregate income over the studied earning period, whereas income from land-based livelihood activities accounted for a mere 38% (Figure 3). However, land-based activities were the most common mode of income generation among studied households, with activity rates greater than 80% (Figure 3).
Remittance payments were the sample’s greatest single source of aggregate income, constituting almost a quarter of households’ aggregate earnings. Fifty percent of sampled households received remittance payments during the studied period, and informal interviews with survey respondents revealed that many households desired to engage in labour migration to realise remittance payments. Remittees, however, also experienced fear to be left behind by younger relatives, without support for physically demanding tasks at old age; and about the possibility of expected payments failing to occur, or being held off, once unmarried female relatives were wed. The mean age of remitters was 29 years (n = 54; SD = 6.3). There was a 4:1 ratio of male to female remitters, and more than 80% of relatives supporting their household financially were either sons or daughters of survey respondents. The mean length of remittance senders’ current stay away from their households of origin was six years (n = 56; SD = 4.8). International destinations of the remitters were Malaysia (n = 24), the United States (n = 17), India (n = 3), Singapore (n = 2) and Australia (n = 1); national destinations included Yangon (n = 4), Mandalay (n = 3) and Tamu (n = 2).
Wage employment was the second most important income sector in absolute terms, constituting 18% of households’ aggregate earnings. Almost half of all sampled households engaged in this livelihood activity, with manual labour, crushing stones for house or road construction and carpentry work as the most common occupations. Construction labour, employment to assist trade to India or locally, as well as manual labour on farms and in forests, or the service industry, offered opportunities for unskilled employment. Skilled employment was rarer, commonly in government roles, as staff in the hospital or health centres, as a school teacher or teaching assistant; or in villages, as a church employee or village electrician.
Self-employed business activities generated 10% of households’ aggregate income, although just seven households engaged in this livelihood activity. Common business activities were the sale of food or clothes. Yet, a carpentry business, the sale of rights to query stones for construction work, and a local transport business, were most remunerative.
Other non-land-based livelihood activities or income sources included the lease of farmland and property, as well as the reception of gifts and support payments from government or civil society actors, and pensions. Twenty-three percent of households received some income of this type, but the magnitude of aggregated income from these sources was rather small.
Cultivation of crops, forest income generation, non-forest tree husbandry and other land-based livelihood activities generated 38% of households’ aggregate income. Only few households did not engage in livelihood activities in this sector, with 97%, 90% and 86% of households realising at least some income from crops, forest and non-forest tree husbandry, respectively. The dominant land-use practice in the study area was annual, rainfed swidden farming on village or private land under customary tenure, with very limited use of external inputs. The spatial and temporal dynamics of this farming practice resulted in characteristic mosaic landscapes, constituted by patches of forests, fallows, and fields in addition to semi-permanent mixed gardens of annual and/or perennial (tree)crops away from homesteads; home gardens; and paddy fields. Households typically maintained a home garden and one or more swidden fields and/or permanent gardens. Commonly cultivated crops included staples, such as maize, paddy rice, millet and a wide variety of legumes, vegetables and fruit-tree crops. Commonly obtained livestock fodder included banana plant material, grasses and tree-leaves. Forest products were commonly obtained from one or more designated fuelwood plots that households maintained individually, and from communal village forests under open access regimes in Tualzang and Tungzang. The majority of households’ plots were not formally titled or registered with state authorities.
Animal husbandry and aquaculture was a common livelihood activity among studied households, but the consumption and sale of animals, animal products and fish from aquaculture made only a minor contribution of 6% to households’ aggregate income. Ninety percent of households owned at least one type of animal, but only 50% of households realised an income from aquaculture or animal husbandry during the studied period. Around 60% of households owned chickens, dogs or pigs, while mithans, cows, goats, horses, buffaloes and ducks were far less common. Smaller animals and pigs were kept within household compounds or home gardens. Larger livestock was free ranging throughout the year, except for animals in Tungzang, which were enclosed on a forest pasture during the monsoon season. Small scale aquaculture was practices by three households.
Processed products contributed 2% to the sample’s aggregate annual income, with 5% of households engaging in respective activities. Distillation of alcohol from rice was the most common cash-oriented value adding activity in this sector. Others included the production of charcoal, local fruit wine, yeast, bamboo chairs and baskets. Households, who processed natural products for subsistence use, mostly produced local fruit wine or stronger rice liquor.

3.3. Income Portfolios and Identified Livelihood Strategies

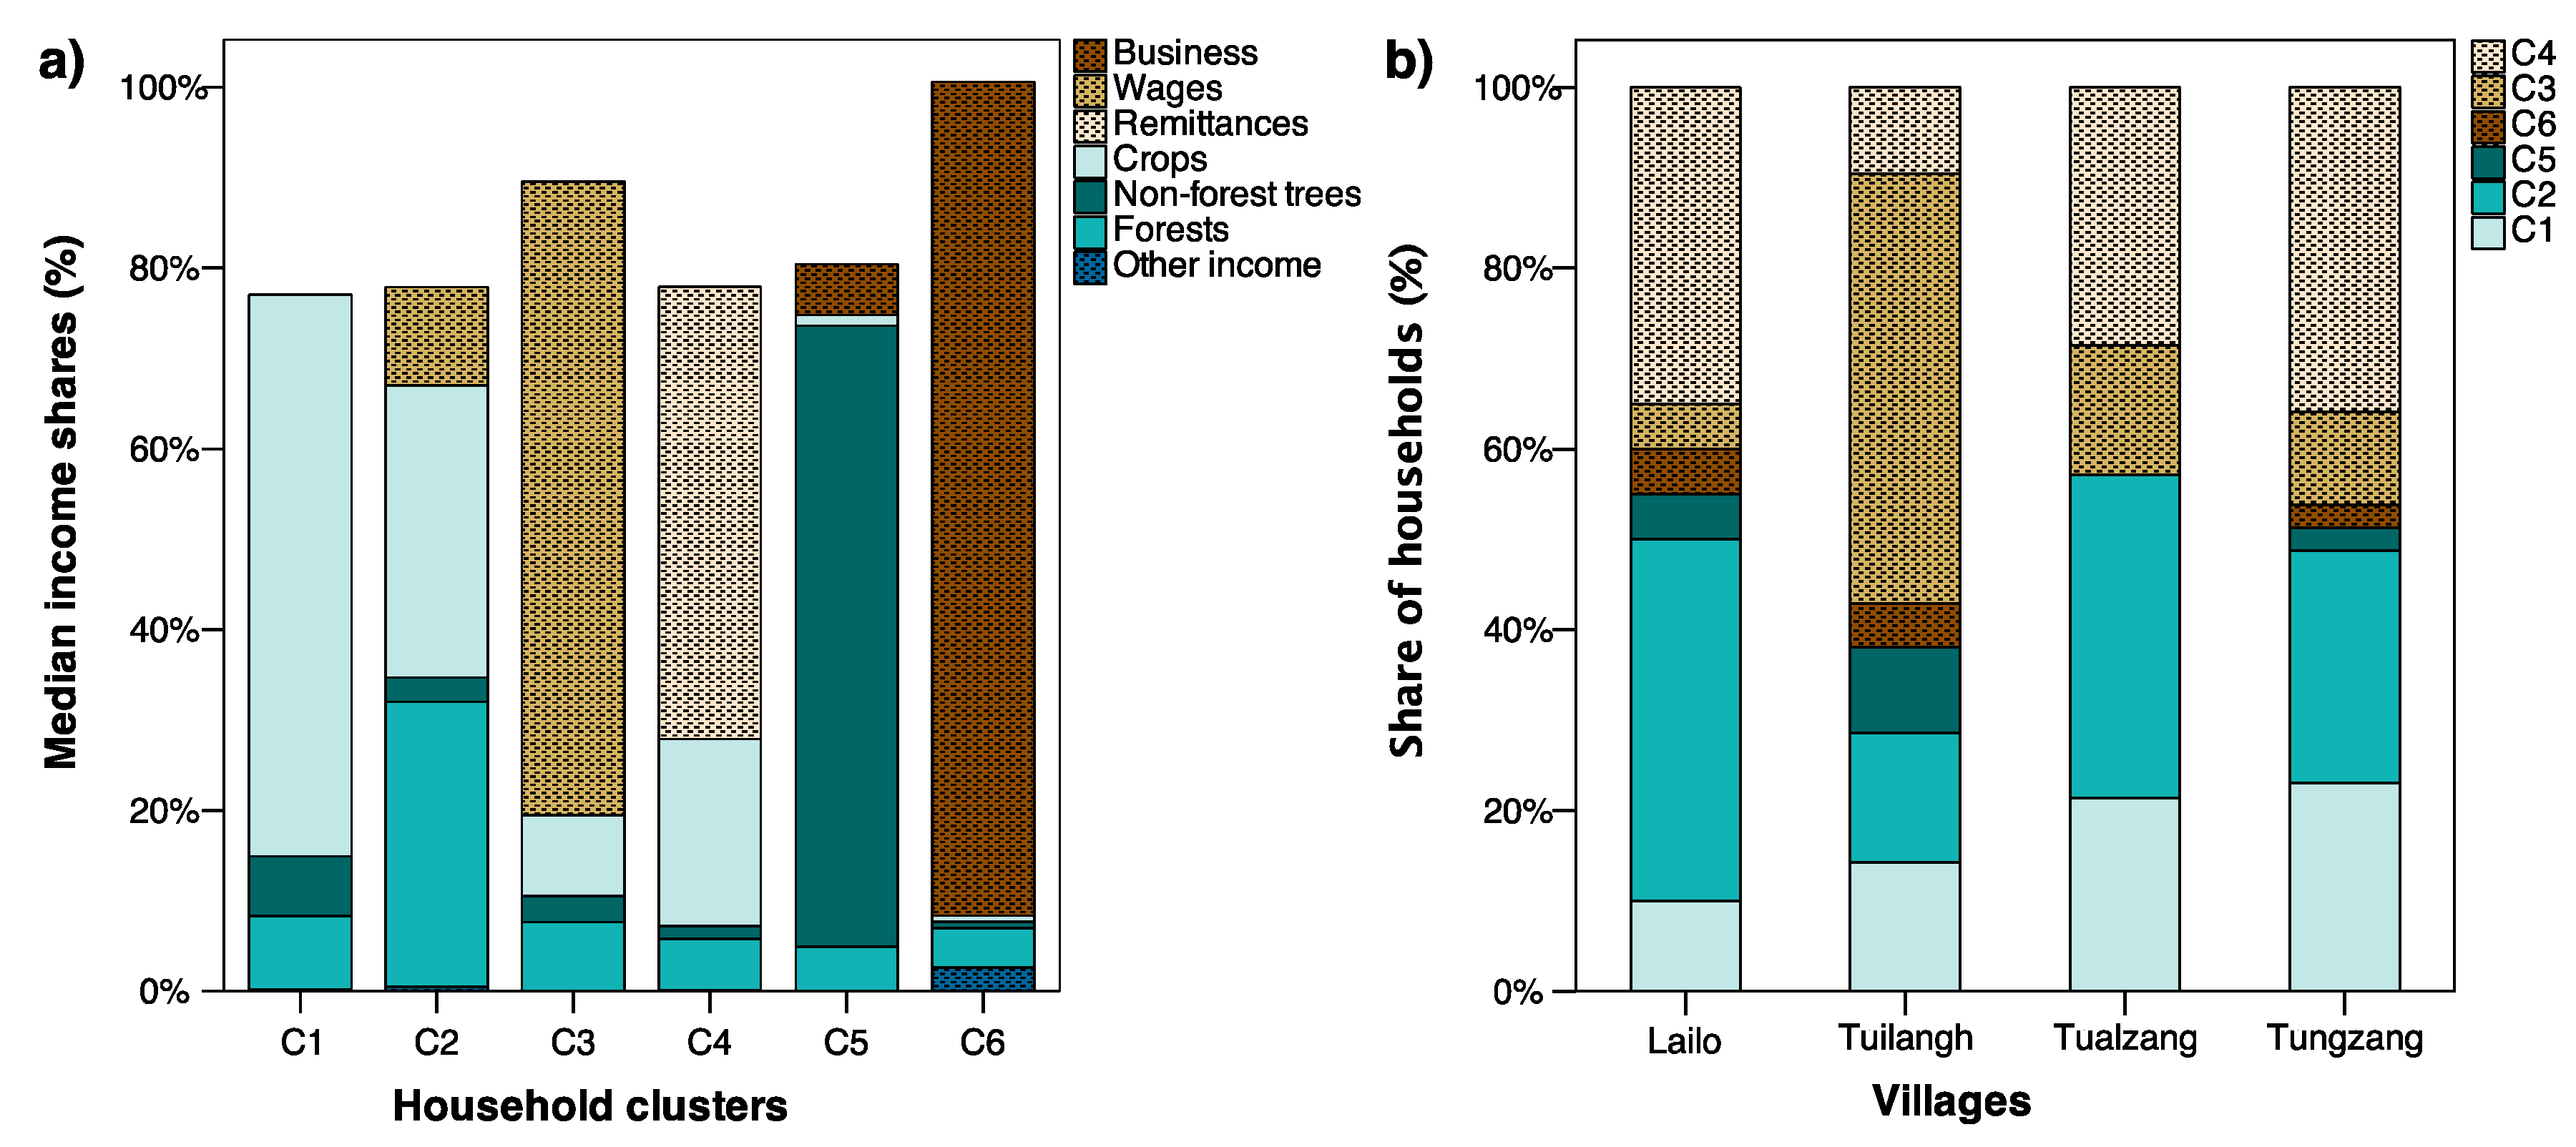
The hierarchical clustering analysis identified six clusters, which we interpret to represent households with relatively distinct income portfolios, i.e., livelihood strategies (Figure 4): Relying primarily on own farming activities (C1, n = 17); making a living off the land with mixed income from agriculture and forest resources (C2, n = 26); engaging in wage employment (C3, n = 17); living from remittances (C4, n = 27); practicing non-forest tree husbandry (C5, n = 4); or engaging in self-employed business activities (C6, n = 3). Judging from field experience, the latter two clusters constituted meaningful groups of cases, rather than outliers. Yet, these households were excluded from tests to detect statistical differences across clusters, due to the small number of cases representing the respective livelihood strategies and are therefore not represented in Figure 6, Table 2, Table 3 and Table 4 and Appendixes Table A2 and Table A3.
Households in C1, C2 and C5 relied primarily on land-based livelihood activities, whereas households in C3, C4 and C6 relied primarily on income streams from off-farm activities (Figure 4). Table 2 and Table A2 show the distribution and statistically significant differences of relative income shares from various livelihood activities across clusters C1–C4. Cultivated crops were an important income source for household in C1 and C2, who tended to derive the greatest and second greatest proportions of income from crops among all clusters. Households in C2 derived a second main household income component from forests; with a median forest income share exceeding that of other groups by at least a factor of four. Wages constituted the greatest income source of households in C3; whereas households in C4 gained substantial incomes from remittance payments. Households in C5 relied primarily on income from non-forest tree husbandry, in stark contrast to all other clusters. Moreover, only households in C6 derived more than 14% of their income from self-employed business activities, realising a respective median income share of 92%.
A Kruskal-Wallis-H test and post-hoc analysis verified inter-cluster disparities of household income portfolios, revealing statistically significant between-group differences in the distributions of income shares from wages (H(3) = 53.053, p < 0.001), remittances (H(3) = 62.935, p < 0.001), crops (H(3) = 51.807, p < 0.001), and forests (H(3) = 38.545, p < 0.001) across clusters C1–C4 (Table 2, Table A2).
The distribution of clusters across villages was relatively equal, except for Tuilangh, where a disproportionate number of households relied on wage employment, but relatively few houses relied on remittance payments or mixed income from agriculture and forest resources. In Tualzang, none of the households engaged in self-employed business activities or non-forest tree husbandry.

3.4. Absolute Income Distribution and Income-Poverty across Clusters

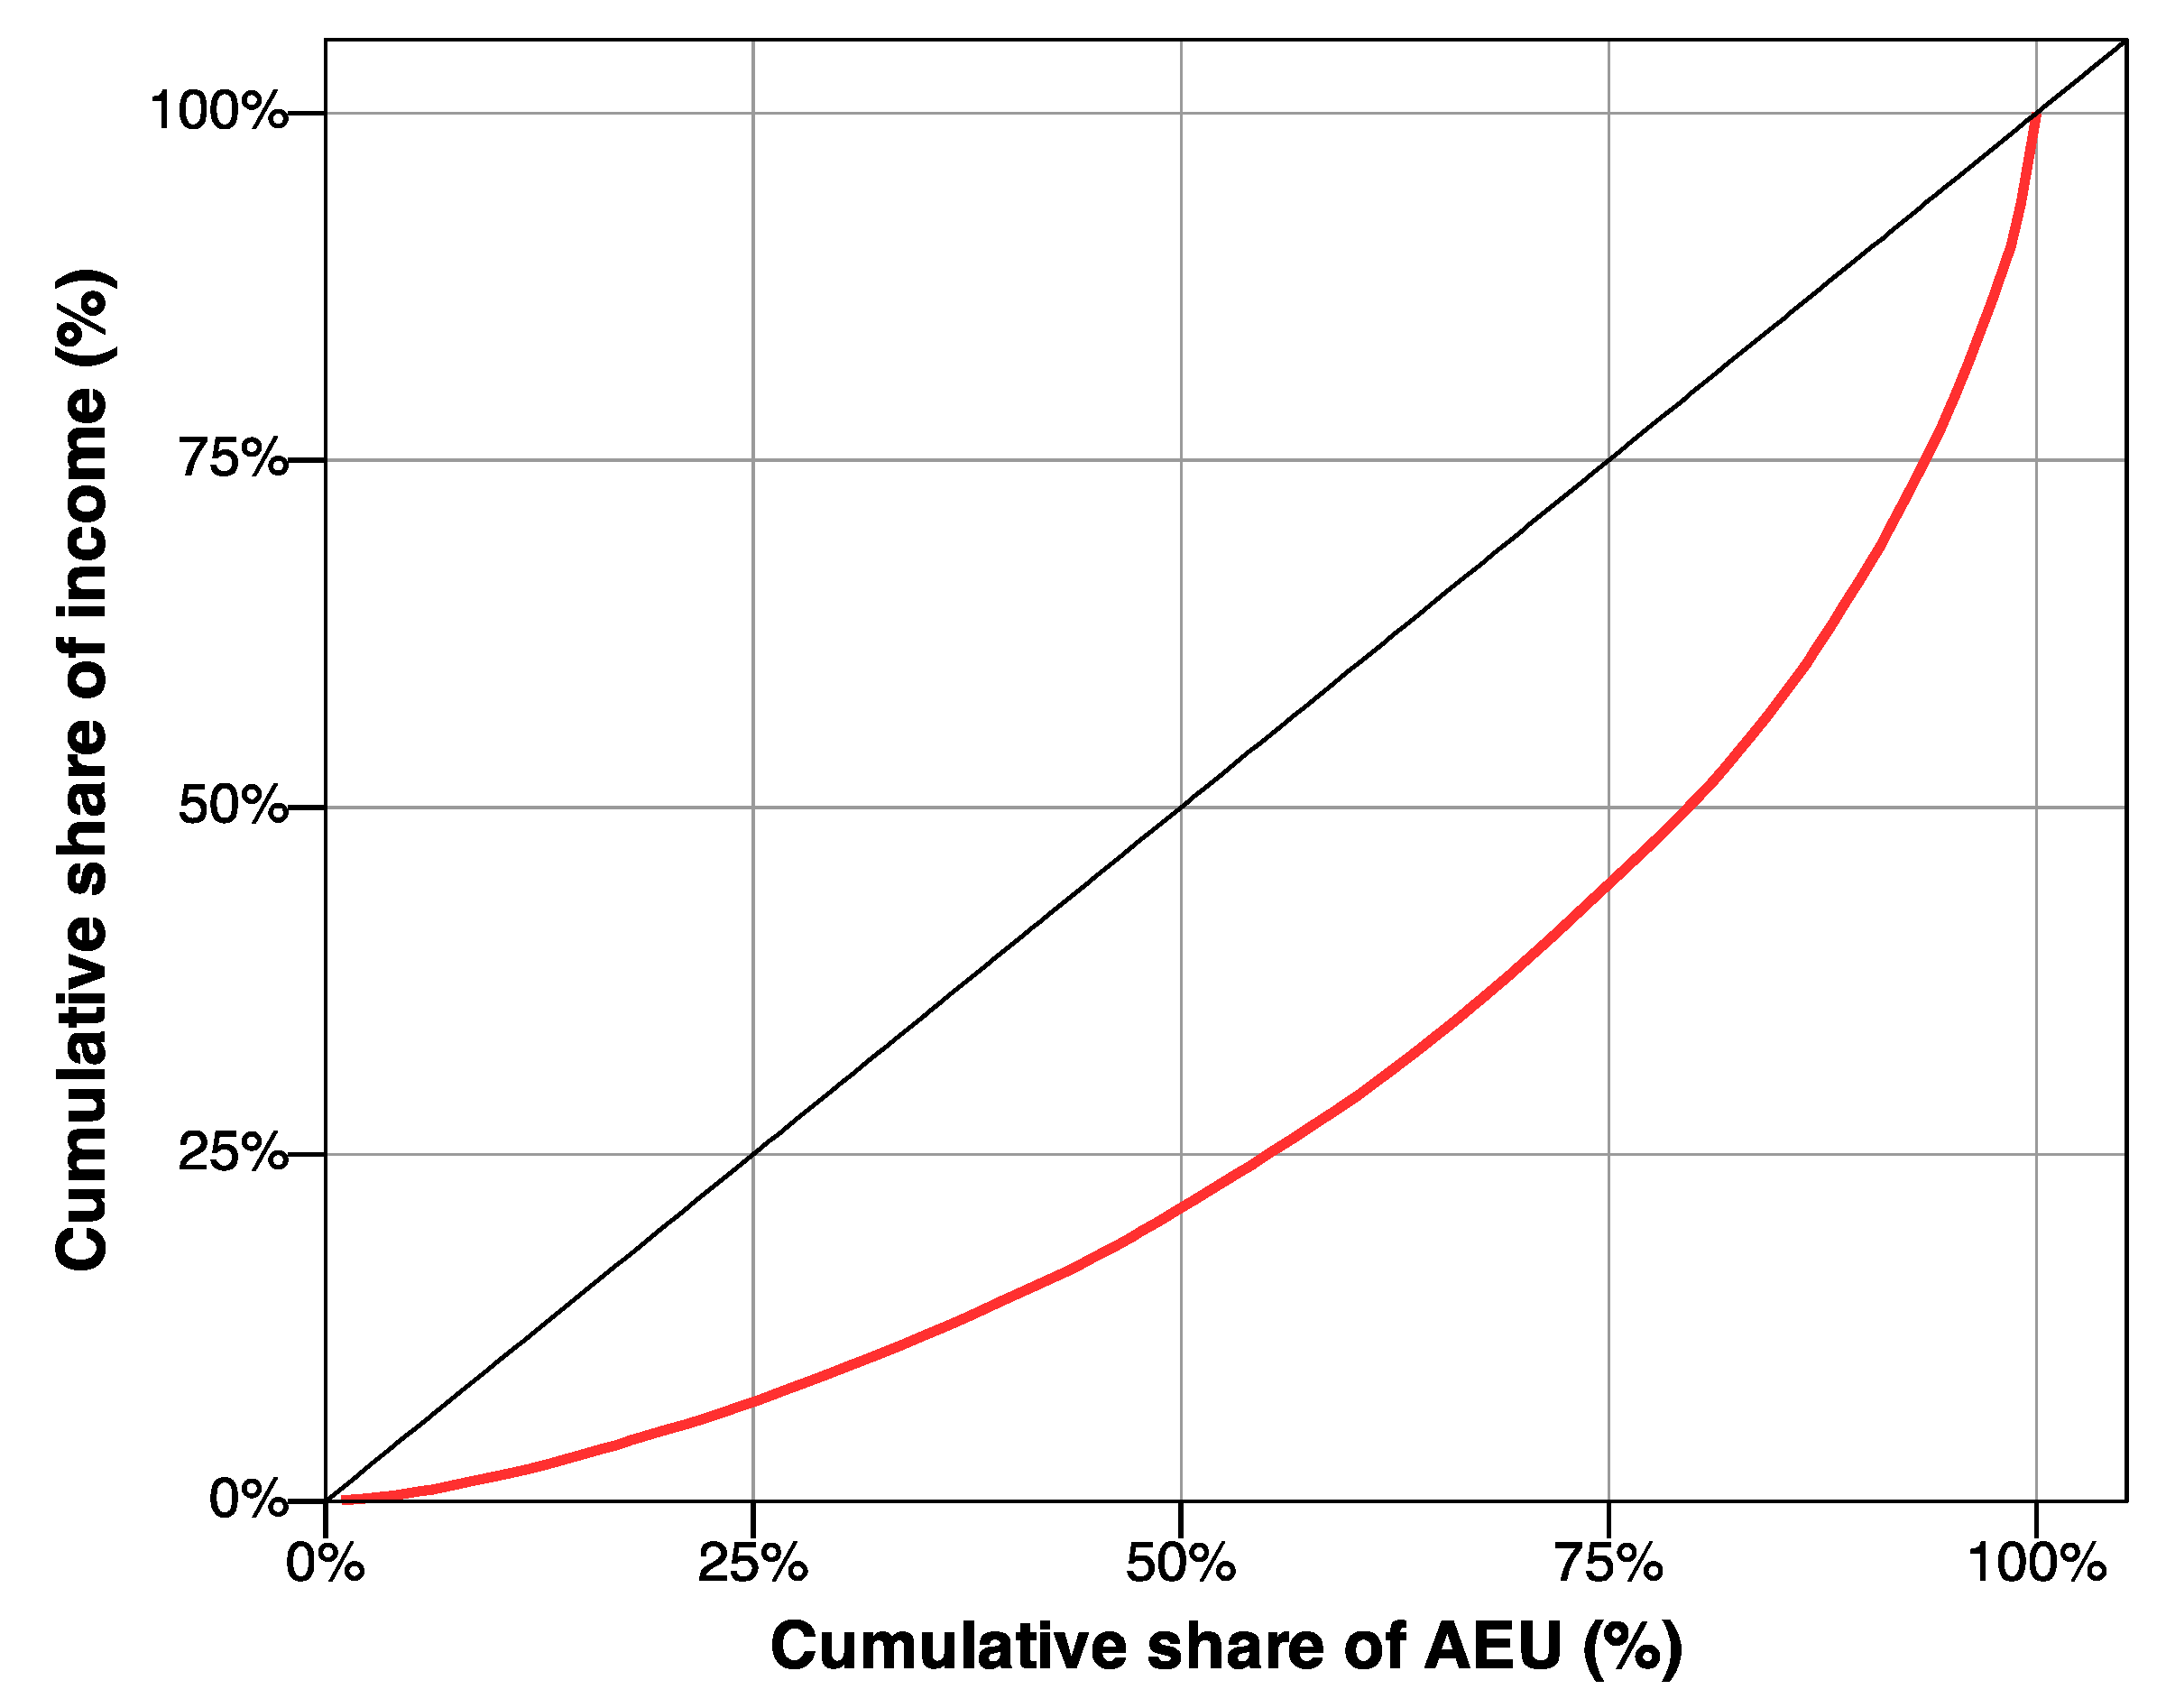
The median aggregate annual income per AEU across all households was 468 thousand Myanmar Kyat (MMK) (IQR: 281–750 thousand MMK) (1000 MMK~0.68 USD in 2018), but income inequalities across different households and livelihood strategies were pronounced (Figure 5 and Figure 6). Households representing 50% of AEU in the sample realised less than 25% of generated household income, whereas the top 25% of adult equivalent units obtained more than 50% of all income realised by the sample population.
A Kruskal-Wallis test with subsequent post-hoc analysis (Table 3, 
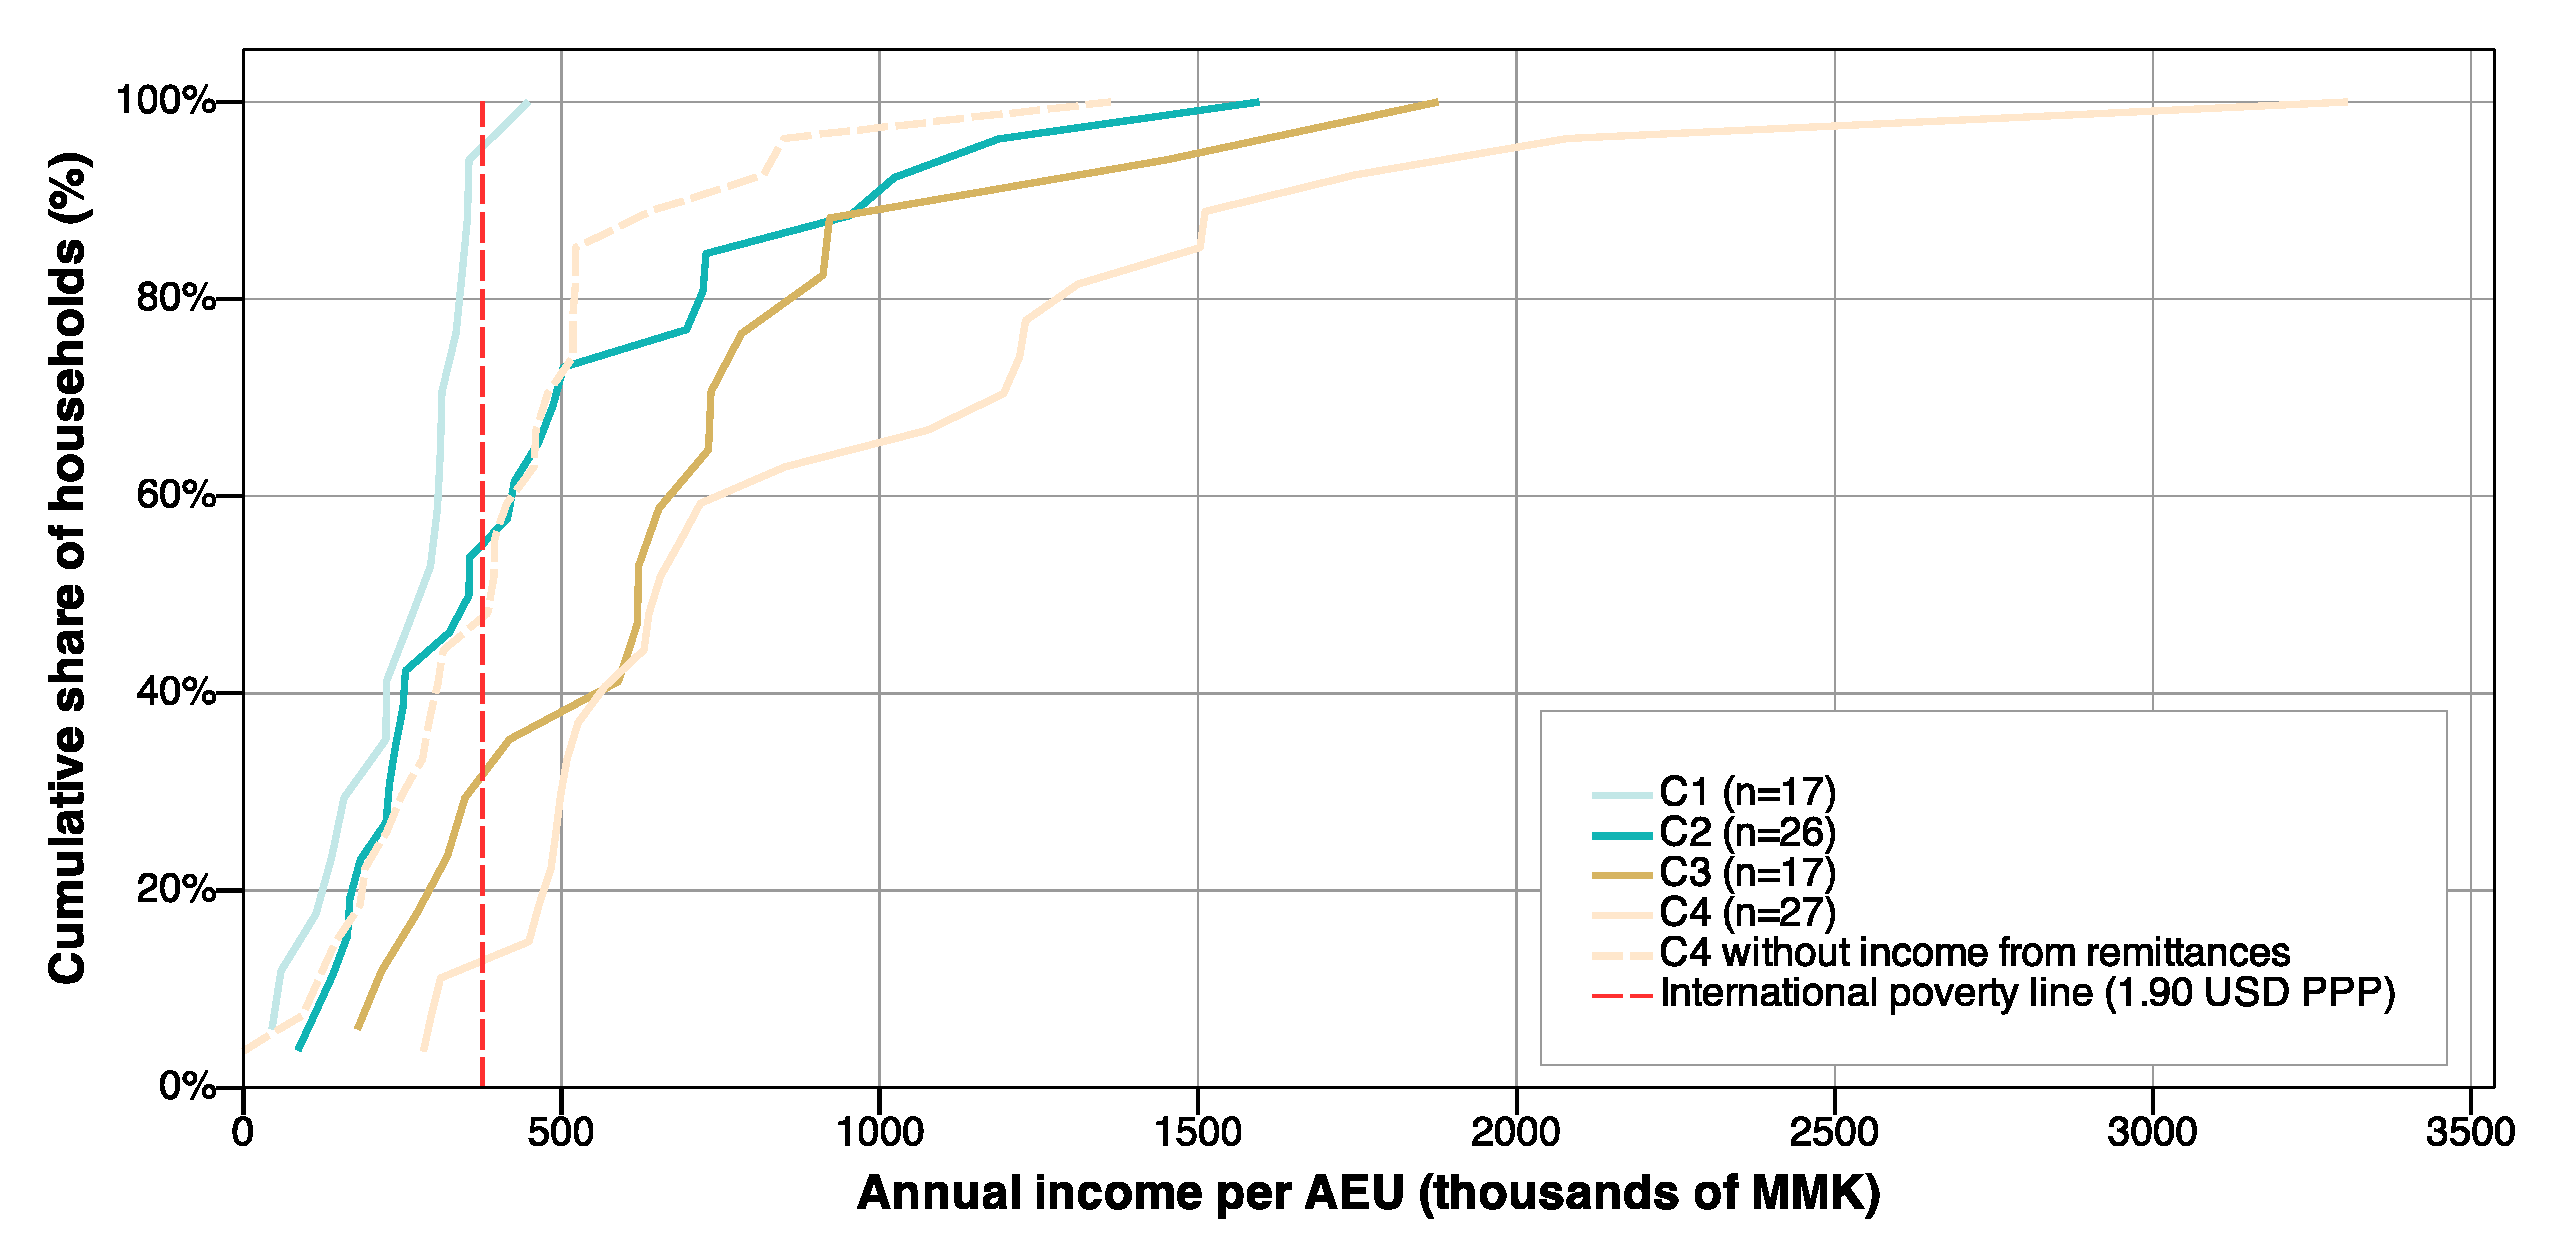
Table A3) and cumulative frequency distributions (Figure 6) revealed that off-farm oriented livelihood strategies tended to be more remunerative than land-based strategies. Households in C4 had the greatest median aggregate annual income per AEU, followed in descending order by households in C3, C2 and C1 (Table 3). However, if households in C4 would not have received remittances, they would have realised very similar incomes to those in C1 and C2—as absolute income portfolios of household in C1 and C4 were composed very similarly, except for remittance income shares that lifted most households in C4 out of poverty.
Distributions of absolute realised incomes from different sources across livelihood strategies (Table 3), overall, followed similar patterns to those observed for relative income shares (Table 2). Households in C3 and C4 realised the greatest median absolute incomes, from wage employment and remittance payments of 496.2 and 329.2 thousand MMK per AEU, respectively. Households in C2 realised a median absolute forest income of 97.2 thousand MMK per AEU, which was significantly greater than forest incomes realised by C1, C3 and C4. Households across clusters C1–C4 realised moderate incomes from non-forest tree husbandry, but no significant differences in the magnitude of these income streams were observed among households in these groups. Realised incomes from livestock and processed products were typically small compared to households’ aggregate absolute incomes, but a few households in C1–C4 realised comparably substantial incomes from cash crops. The differences in absolute incomes from livestock, processed products and cash crops among households were, however, not well explained by cluster membership.
Household incomes were most equally distributed in C1 (Figure 6), whereas distributive income inequalities were more pronounced in C2–C4. Non-forest tree husbandry was a livelihood strategy that both very income poor and comparatively income rich households relied on, with realised annual incomes per AEU in the range of 71 to 1017 thousand MMK. However, the income range between the income poorest and richest household was greatest in C6, spanning from 472 to 4457 thousand MMK per AEU and year. More than 90% of the AEU in C1 lived below the international poverty line of less than 1.90 USD purchasing power parity (PPP); whereas households in clusters C2–C4 fell far less frequently below this poverty line, with well under 60%, 40% and 20% of AEU realising daily incomes of less than 1.90 USD PPP.

3.5. Households’ Self-Reported Welfare

The majority of respondents felt very satisfied (7%), satisfied (40%) or at least neutral (40%) about their household’s overall welfare, but 58% and 37% of all study households did not have sufficient, or barely sufficient cash to meet their needs, respectively. The self-perceived trend of household welfare over a five-year period was positive for a majority of respondents. Forty-four percent, thirty percent and twenty-six percent of respondents reported improved, stable or declined welfare status of their household, respectively. Twelve of the 42 respondents who reported welfare gains for their household attributed these changed circumstances to remittance payments. Only two of 24 respondents, who reported that their household’s welfare had decreased, in contrast, identified the non-arrival of expected remittance payments as the primary cause of the experienced decline. Overall increased household income, engagement in wage employment, and increased household labour availability as children grew up, were other important reasons for perceived welfare improvements; whereas engagement in cash crop cultivation, livestock husbandry and the expansion of land under cultivation were named by just four households. Decreased household welfare was most often attributed to decreased labour availability, due to old age, bad health, births or the marriage of mature children. Other reasons included increased household expenses to meet the needs of young children or household members in ill health. Or the death of, or divorce from the male head of a household.

3.6. Physical Asset Endowments, Savings and Debt

The median aggregate value of households’ physical assets and savings was 912 thousand MMK per AEU, just less than twice as much as the sample’s median absolute annual household income per AEU. The median outstanding household debt per AEU was 30.3 thousand MMK. Landholdings constituted by far the greatest share of households’ asset portfolios, and all but two households owned land. Savings in cash, precious metals or jewellery, in contrast, made just a minor contribution to households’ aggregate assets and savings. Values of households’ physical asset endowments, savings and debt were dispersed (Table 4), but the spread in the data could not be attributed to inter-cluster differences for these variables. A Kruskal-Wallis H test revealed no significant differences in the value of households’ physical asset endowments and outstanding debt, across C1-C4. There was, however, a significant difference in households’ savings across these household groups (X2(3) = 7.979, p = 0.046). Yet a post-hoc analysis, using conservative adjusted significance values, revealed no significant differences for any pairwise comparisons.

4. Discussion

4.1. Overview

This study assessed household income portfolios, to identify different livelihood strategies of rural people in northern Chin State, and asses the strategies’ income-poverty and vulnerability implications. We found that households engaged in two different types of livelihood strategies—those that were primarily off-farm oriented (C3, C4, C6), and those primarily reliant on land-based activities (C1, C2, C5). More than 50% of the sample’s aggregate income stemmed from activities in off-farm sectors, but almost all households continued to derive a share of their income from land-based activities. Off-farm oriented livelihood strategies were typically more remunerative than those primarily reliant on farm and forest resources. Below, we situate these findings in relation to previous work on livelihood strategies and income diversification in Asia’s uplands. We further discuss how socio-economic differentiation among clusters translates into disparate vulnerabilities to external stresses, which development stakeholders should consider for the conception of targeted policy and development interventions. Finally, we reflect on the validity of our findings beyond the study’s sampling frame.

4.2. Differentiated Livelihood Strategies and Income-Poverty

More than half of our sample’s aggregate income stemmed from remittance payments, wage employment or self-employed business activities. Just two-fifths stemmed from land-based activities, and even less from local value addition through livestock husbandry or processing of natural resources. A general characterisation of northern Chin villages as farming communities would thus be misleading. This insight resonates with economic trends in comparable communities across the Hindu-Kush-Himalayan region, where many households have diversified their livelihood strategies towards off-farm income generation—through, inter alia, wage employment, tourism enterprises, small-scale businesses or remittance-oriented migration [35,42].
The importance of off-farm income from unskilled wage labour and remittances for the rural economy in northern Chin State has previously been observed [13,22,43]. The clustering results from this study, however, add nuance to these findings, showing that wages and remittances contributed unequally to income portfolios of households in different clusters. Rather than observing highly diversified income portfolios at the household level [44], we found that five livelihood strategies were dominated by just one type of income. Only households in the mixed-land based cluster (C2) typically generated substantial income shares from three sources: Crops, forests and wage employment. The range of existing figures on remittance income of Myanmar households is wide [17], and the magnitude of payments received by households engaging in the remittance-oriented livelihood strategy (C4) in our study, was somewhat smaller than that reported for the southern Chin hills [25].
The absence of livelihood strategy specific data and ambiguities about whether subsistence income streams have been accounted for [13,22,25,43], or if obtained income figures relate to individuals or households [13], hinder comparison of absolute income figures between this and previous studies. Our figures are substantially greater than those reported in recent case studies of forest income and livelihoods in Chin State [24,43]. Yet, the median annual household income of 468 thousand MMK per AEU found in this study is only slightly greater than the average total household income per AEU across 21 Asian study sites, which Angelsen, et al. [45] reported in a synthesis analysis of quantitative rural livelihood studies in 24 developing countries. Aung, et al. [24] found that households at a study site near Natma Taung National Park obtained very high forest income shares of 50–55%, compared to 20% reported for sites across Asia [45]. The difference in results for total household incomes found by our study, and work at the study site in southern Chin State, may thus partly be explained by unusually high forest income figures observed at the latter.
We observed comparatively low forest income figures across clusters [45]—except for households in C2, who engaged in the mixed-land-based livelihood strategy. The latter realised similar forest incomes to those observed in southern Chin State [24]. However, almost all households continued to rely on forest and tree products to some extent, which may be explained by richer households’ reliance on wood fuel for cooking [40,46] in the absence of gridded electricity, and the common cultivation of trees in home gardens.
Most households in our sample engaged in livelihood strategies that were oriented towards other income sources than farming alone—except for those in C1. This is in contrast to findings from southern Chin State, were 75–80% of household livelihoods relied solely on agriculture [26]. Such livelihood strategies, which enabled households to realise greater incomes than through primary reliance on agriculture, fell into three groups: Households in C2 and C4 maintained similar levels of absolute agricultural income to those in C1, but appeared to top-up their earnings, with forest and remittance income, respectively. Households in C3 re-allocated labour from land-based activities to off-farm employment opportunities, creating substantially different livelihood strategies.
One explanation for this pattern may be that wage income allowed some households to substitute income from land-based livelihood activities, when they pulled out of farming activities. However, wage employment was not attainable for those lacking relevant capital to seize opportunities in local labour markets [44]. Households in C2, in contrast to those in C3, may thus have been unable to gain wage employment, but could mobilise household labour to extend their activity portfolio, to realise greater forest incomes than households in C1. Contrasting the mixed-land-based and remittance-oriented strategies, there may be greater entry barriers to the latter, such as high upfront logistical costs to engagement in labour migration. This could explain why households in C2 may have employed available household labour to extract forest resources, rather than engaging in the more remunerative remittance strategy. Household labour availability may also have determined whether remittance recipients relied on remittances alone, or concurrently engaged in land-based livelihood activities. Indeed, a subset of respondents in C4 reported to feel anxious, as the departure of younger family members rendered their older dependants, who stay behind and were no longer able to engage in strenuous physical labour, vulnerable to farm-labour and remittance shortfalls.
Self-employed business activities and non-farm tree husbandry appeared to be specialised strategies that in some instances generated incomes comparable to remittances, but were rare across the sample. This indicates high entry barriers to these strategies, which required previous asset accumulation through other activities, eventually allowing household to step-up from subsistence-oriented farming into farm tree cultivation, or out of land-dependence into self-employment [47]. Informal conversations with respondents suggested that investment in trees was a desired livelihood pathway of many households, who wished to reduce on-farm labour needs and to improve earning opportunities for their offspring in the future. Yet, the need for high upfront investments and food-security trade-offs, associated with the re-allocation of labour from subsistence food production towards tree establishment, constituted insurmountable barriers to engagement for most households.
Incomes below the international poverty line were present across most livelihood strategies, similar to observations in the Nepal Himalayas [46]. There were wealthy households in all but the agricultural livelihood strategy, which implies that households could avoid income poverty, and obtain relative wealth via a range of livelihood strategies. We showed poverty to be particularly less frequent, in households engaged in off-farm oriented strategies—compared to households primarily engaged in own farming activities. This finding resonates with those of a large-scale survey of Myanmar households from 2013 [21]. Previous studies in Nepal show that social and human capital, such as education, links to social and political networks, and available family labour, allowed households to engage in more lucrative off-farm strategies, whereas lack of social and human capital lead towards less beneficial unskilled labour opportunities [42]. In our case, similar dynamics may have determined whether households succeeded to secure desired governmental or skilled employment opportunities for their offspring or could only seize unskilled labour opportunities. Eighty percent of household heads in our study had completed no formal schooling beyond primary level. This finding could be interpreted as evidence for educational barriers to skilled employment, which sampled households may encounter; and it resonates with a recent state-wide census, which established that 69% of the rural Chin population above 24 years had attained no higher level of education than primary school training [20]. The enabling role of social networks may also explain why we found village origin, rather than physical asset holdings or access to local transport infrastructure, to be associated with households’ engagement in wage and remittance-oriented strategies.

4.3. Vulnerability Implications of Differentiated Livelihood Strategies

4.3.1. Livelihood Strategies and Associated Vulnerabilities

Our analysis of income portfolios showed that households engaged in two main types of income generation strategies—those primarily reliant on access to land and natural resources, and those oriented towards off-farm income generation. This differentiation of livelihood strategies implies dissimilar vulnerabilities to contextual factors and processes that could compromise households’ livelihoods. Households in C1, C2 and C5, who engaged in land-based livelihood strategies, shared a strong reliance on access to land and natural resources; rendering them vulnerable to climate change impacts and a land and natural resource governance setting, which exhibits frontier characteristics [16,48]. Households in C3 and C4, who engaged in off-farm oriented livelihood strategies, in contrast, were highly exposed to local and international labour market dynamics.

4.3.2. Vulnerabilities to Climate Change

Systematic evidence of climate change impacts in Chin State remains lacking, but first results from a scoping study of climate change risks in the area suggest that local agroecosystems will lose productive capacity in coming decades, in response to stronger and erratic rainfall patterns, shortened rain seasons, temperature peaks and heavy winds [49]. Severe landslides and flooding of low-lying fields already hamper agricultural production, and frequently cause damage to transportation infrastructure, houses and the loss of lives, today. During interviews, our survey respondents recalled the devastating extreme weather events that affected rural households in Myanmar during the 2015 monsoon season. Locally, these events translated into land-slides, extended blockage of roads to Tedim town, and the complete loss of valuable terraced paddy lands near streams for some studied households. Interviewees had further experienced severe winds that negatively affected crops, particularly during the dry and hot months early in the year. Although land related reasons featured low among the factors behind welfare changes that households reported in our survey, some households mentioned shrinking forest cover and drying land as reasons for declined wellbeing of their household, compared to the past five-year period.

4.3.3. Vulnerabilities to Shifting Land-Governance Regimes

According to national legislation, the state is the ultimate legal owner of all land in Myanmar [50]. However, in absence of strong state presence, land in upland Chin State has traditionally been governed according to customary village level tenure regimes. In 2012, however, two new land laws—the Farmland Law and the Vacant, Fallow, and Virgin Land Management Law—were enacted by the Thein Sein cabinet that governed Myanmar at the time, to reform national land sector regulations and facilitate state-building and investments in land [16,51]. These laws are in line with the often fallacious ‘discourse of marginal land’ [28] (p. 161). They pose a threat to traditional swidden practices of rural Chin households, as they neither accommodate collective land ownership at the community level, nor traditional long-term fallow practices for the restoration of farmland productivity, which are typical for swidden systems of northern Chin State [15,16]. Myanmar’s 2016 National Land Use Policy [52] holds promise for the recognition of ethnic-minority land-use rights, and thereby customary swidden practices [15,16]. Yet, if this policy will de facto be enacted favourably for households in our study area, and across northern Chin State, remains to be seen.
Threats of land dispossession, for households who engaged in land-based strategies, however, do not solely arise from union level legislation. Expanding capitalist market forces, e.g., in response to attempts of Chin State’s regional government, to attract international investors [53], or interests in valuable mineral deposits—as in the case of a contested nickel mine [16,23]—could undermine customary tenure systems in Chin villages. Socio-economic stratification through asset accumulation from remittance payments [9], or land enclosure for the planned enlargement and conservation of the national forest estate and establishment of national parks [54] could likewise lead to shifts in local land-governance regimes. This holds, despite the great cultural importance of swidden practices, strong social contracts, and substantial socio-economic and biophysical barriers to the development of commodity boom crops, which may mitigate the reconfiguration of land governance in Chin’s frontier spaces [9,16,48].

4.3.4. Vulnerabilities to Local and International Labour Market Forces

Off-farm oriented livelihood strategies are highly exposed to local and international labour market dynamics and thus carry vulnerability risks. Yet, such vulnerabilities are not well documented for northern Chin households, and we did not systematically record relevant information through our household survey. Informal conversations with survey respondents revealed that some households, who engaged in wage employment, struggled to secure promised salaries and faced high costs for transportation and temporary accommodation at their workplace. Further, younger family members’ employment in nearby towns was sometimes associated with undesired lifestyles, including the consumption of drugs and alcohol, and high spending on clothes or for entertainment.
Vulnerabilities associated with remittance-oriented migration were reported during household surveys and informal conversations and included high upfront costs. Remaining dependants of remittance senders further experienced fear about, or de-facto harm from labour and payment shortfalls; the erosion of social contracts, e.g., failing marriages; and the inability of younger generations to act as caregivers for their relatives of old age. It also remains to be seen, if long-term migrants may find it difficult to uphold claims to village lands, if future land ownership practices become more formalised; e.g., backed by government issued land titles, rather than village customs.

4.4. Targeted Interventions for Improved Livelihood Outcomes

The high incidence of income poverty observed in this study, especially among households engaged in land-based livelihood strategies, implies a continued need for interventions fostering sustainable development in northern Chin State; e.g., through the creation of enabling conditions, or tangible support to rural households and communities. Such efforts could be developed upon existing proposals for policy and technical interventions [12,13,14,15,18,19,54], to address the specific vulnerabilities that are associated with households’ engagement in different livelihood strategies.
Land was a key physical asset for almost all studied households, and there was continued reliance on wood fuel and agricultural products for subsistence use across clusters. Interventions for secure land and natural resource tenure could thus benefit most respondents and their families, but appear particularly urgent for poor households engaging in land-based livelihood strategies. Tenure rights could be secured within the framework of Myanmar’s national land-use policy, e.g., following suggestions to title community land-rights at village level [12,14], in recognition of the risk that intra-village inequalities in landownership could thereby be exacerbated.
Technical interventions to increase returns from land-based livelihood activities have been proposed by national specialists [13], and are envisaged in state level development plans [54]. Development actors could, e.g., engage in co-learning processes with rural communities and staff of the forest department, drawing on local agroecological knowledge and technical skills to innovate upon existing land-use practices—community forests, private timber stands and agroforestry systems, with local tree crops, such as mango (Mangifera indica), coffee (Coffea spp.), avocado (Persea Americana), or the multi-purpose tree bean (Parkia roxburghii). These suggestions match local biophysical conditions, know-how, and aspirations for land development, and may improve the economic prospects of households’ offspring. Existing barriers to the commercialisation of Chin Hill tree crops, e.g., the competition that imports from China pose in key markets, such as Mandalay and Yangon, should however not be naively disregarded.
Supportive interventions for households engaging in off-farm oriented livelihood strategies could build on two insights arising from our results: First, efforts to improve labour market conditions for the Chin population cannot stop short at the Myanmar border, as a large share of households’ remittance income stems from relatives working abroad. Second, there appears to be ample room for the development of local vocational training programs and employment opportunities, to offer younger Chin residents alternatives to remittance oriented labour migration. Challenges for the aging population that stays behind, e.g., the potential erosion of social contracts, or the risk of remitters failing to secure sufficient earnings to permanently support their relatives financially, may thus be addressed.
Remittance payments—the sample’s largest income share—and the human and social capital that the large Chin diaspora entails [19] could further be mobilised to leverage sustainable development processes in the Chin hills. Remittance receivers may benefit from targeted advice on sustainable longer-term investment options, where payments are sufficient to cover more than household’s expenses for immediate food needs. Further, currently limited value addition, e.g., through processing of natural products, suggests room for a returning Chin diaspora to capitalise on the region’s natural resources and traditional craft-skills of the local population, to develop profitable enterprises [18]. Tourism may likewise develop into a cornerstone of sustainable economic change in northern Chin State, if benefits from this industry can be reaped with minimal social and environmental trade-offs for local people and ecosystems [19].

4.5. Validity of Results

Previous work in our study area has shown that Chin communities are not just linguistically, but also economically diverse, with substantial intra-village differences in livelihood activities [13,22,43]—as also found in this study. Further, while our sampling approach ensured a valid representation of economic conditions across a range of proximities between villages and the urban township centre Tedim, we are aware that livelihoods and their contexts discussed here, may differ from those elsewhere in northern Chin State, e.g., in more remote villages in the same township or bordering Tonzang; in villages towards the Indian border, with greater potential for formal and informal cross border trade; or those situated in the Chin foothills, towards the Kale-Kabaw valley and Sagaing region. Further cross-validation would thus be required to extrapolate our findings beyond the study’s sampling frame.

5. Conclusions

In conclusion, we have combined quantitative household income accounting methods with agglomerative hierarchical and k-means clustering techniques, to (i) uncover the differentiated livelihood strategies of rural households in northern Chin State; (ii) evaluate their dependence on land and natural resources; and (iii) contrast the income-poverty implications of households’ engagement in various income generation activities. In doing so, we have expanded the as yet limited knowledge base about livelihood-land interconnections in Myanmar’s uplands. Such work is required to fill a near blackspot of academic livelihoods research in upland Myanmar, and to create a baseline for reflections about Chin households’ vulnerability in a globalised economic context and local phase of societal change; the conception and realisation of targeted development interventions; and future assessments of rural livelihood and land-change dynamics.
We have shown that land-based activities remain central to the Chin economy, but off-farm livelihood activities already generated the dominant share of our sample’s income—similar to comparable settings across the Hindu-Kush-Himalayan region. There was a high incidence of poverty across the sample, but land-based livelihood strategies were particularly prone to result in very low annual incomes. Further, we have demonstrated that differentiation of land-dependant and off-farm oriented household clusters allows for a nuanced reflection about particular vulnerabilities associated with engagement in disparate livelihood strategies. On the grounds of such reflections, stakeholders can identify potential avenues for the sustainable development of livelihoods and land in Myanmar’s Chin State. Such pathways may likewise be applicable in scaling domains across the South-East Asian uplands, and in relevant global contexts—where rural communities are dually entrenched in local-land dependencies, and global labour markets.

Author Contributions

Conceptualisation, L.K., M.P., U.M.P. and M.R.J.; Data curation, L.K.; Formal analysis, L.K.; Investigation, L.K.; Methodology, L.K., M.P., U.M.P. and M.R.J.; Visualisation, L.K. and M.R.J.; Writing—original draft, L.K.; Writing—review and editing, M.P., U.M.P. and M.R.J.

Funding

Funding was provided by Göteborgs Handelskompanis deposition.

Acknowledgments

We would like to thank Ar Yone Oo—Social Development Association for logistical support during the field campaign and introducing the field research team to the studied communities. We are grateful for the excellent work of our field assistants, Ngaih Sian Hoih and Khup Lal Thang, who shared their knowledge, translated the survey instrument, collected data and provided logistical support during the field campaign. The residents of Lailo, Tuilangh, Tualzang and Tungzang villages agreed to participate in our research activities and shared their knowledge. This study would not have been feasible without their trust and collaboration.

Conflicts of Interest

The authors declare no conflict of interest. The funders had no role in the design of the study; in the collection, analyses, or interpretation of data; in the writing of the manuscript, or in the decision to publish the results.

Appendix A

Table A1. Income variables used in the analysis.
VariablesDescriptions
Income variables used in the cluster analysis, Figure 4, Table 2 and Table A2
BusinessNet income share from self-employed business activities, including the sale of stone mining rights.
WagesNet income share from engagement in wage employment.
Property rentsNet income share from renting out property.
RemittancesNet income share from remittance payments.
Support paymentsNet income share from support payments from e.g., non-governmental organisations.
GiftsNet income share from gifts.
PensionsNet income share from pension payments.
AquacultureNet income share from aquaculture in fish ponds.
Unspecified areasNet income share from natural resources, originating from unspecified areas.
CropsNet income share from agricultural crops, excluding income from trees and woody perennials outside forest areas (e.g., tree-crops from agroforestry trees in home gardens).
Non-forest wildNet income share from natural areas that were neither forests, nor in current use for the production of agricultural crops. This category does not include income from trees and woody perennial outside forest areas, e.g., early regrowth on swidden fields—with a height of less than five meters.
Non-forest treesNet income share from trees and woody perennials outside forest areas, e.g., agroforestry trees in home gardens and early regrowth on swidden fields—with a height of less than five meters.
ForestsNet income share from natural and managed forests. Forests were defined as tree-stands with a minimum canopy cover of 10 percent and a minimum height of five meters. This included intermediate regrowth on swidden fields, managed for fuelwood or timber production.
Income variables used in Figure 3, Table 3 and Table A3
RemittancesNet income from remittance payments.
WagesNet income from engagement in wage employment.
BusinessNet income from self-employed business activities, including the sale of stone mining rights.
Other off-farmSum of net income from support payments, gifts, pensions and property rents.
CropsNet income from agricultural crops, excluding income from trees and woody perennials outside forest areas (e.g., crops from agroforestry trees in home gardens).
ForestsIncome from natural and managed forests. Forests were defined as tree-stands with a minimum canopy cover of 10 percent and a minimum height of five meters. This included intermediate regrowth on swidden fields, managed for fuelwood or timber production.
Non-forest treesNet income from trees and woody perennials outside forest areas, e.g., agroforestry trees in home gardens, and early regrowth on swidden fields—with a height of less than five meters.
Other land-basedSum of net income from natural areas that were neither forests, nor in current use for the production of agricultural crops (non-forest wild); and from natural resources, originating from unspecified areas (unspecified areas).
Livestock and aquacultureSum of net income from aquaculture, livestock and livestock products. The value of fodder that households collected (e.g., crops or tree products, such as leaves) was counted as land-based income in the respective income categories, and thus subtracted as an expenditure in the calculation of net income from livestock and livestock products.
LivestockNet income from livestock and livestock products.
Processed productsNet income from the processing of natural resources.
Table A2. Kruskal-Wallis-H test and pairwise comparison of relative income shares (%) across clusters C1–C4.
Income SourcesKruskal-Wallis (df = 3, n = 87)Pairwise Comparison According to Dunn’s Procedure with Bonferroni Correction
X2Mean Ranks by Cluster
C1 (n = 17)C2 (n = 26)C3 (n = 17)C4 (n = 27)1 vs. 21 vs. 31 vs. 42 vs. 32 vs. 43 vs. 4
Business4.74743.0046.3543.0043.00
Wages53.053 **28.2444.6979.0031.220.151<0.0011.000<0.0010.225<0.001
Property rents0.00044.0044.0044.0044.00
Remittances62.935 **31.2933.8824.6573.931.0001.000<0.0011.000<0.001<0.001
Support payments1.68544.7946.4241.8842.50
Gifts3.81245.7442.2940.5046.76
Pensions2.32041.5043.2146.4444.80
Aquaculture3.26845.0045.8842.5042.50
Unspecified areas3.02647.2443.6242.0043.59
Crops51.807 **78.1848.4620.4733.000.001<0.001<0.0010.0020.1550.655
Non-forest wild5.37542.3552.2137.1241.46
Non-forest trees7.66558.0944.5839.1237.65
Forests38.545 **31.9769.6935.0332.48<0.0011.0001.000<0.001<0.0011.000
Notes: Clusters (C1–C4) represent the following livelihood strategies: C1—relying primarily on own farming activities; C2—making a living off the land, with mixed income from agriculture and forest resources; C3—engaging in wage employment; C4—living from remittances. ** p < 0.01.
Table A3. Kruskal-Wallis-H test and pairwise comparison of absolute income values across clusters C1–C4.
Income SourcesKruskal-Wallis (df = 3, n = 87)Pairwise Comparison According to Dunn’s Procedure with Bonferroni Correction
X2Mean Ranks by Cluster
C1 (n = 17)C2 (n = 26)C3 (n = 17)C4 (n = 27)1 vs. 21 vs. 31 vs. 42 vs. 32 vs. 43 vs. 4
Wages47.953 **27.7644.1977.3533.040.153<0.0011.000<0.0010.510<0.001
Remittances59.833 **29.7635.0025.7173.151.0001.000<0.0011.000<0.001<0.001
Crops13.770 **56.4143.0025.8848.560.5320.0031.0000.1791.0000.022
 Subsistence16.951 **55.5945.3822.5348.891.0000.0011.0000.0221.0000.005
 Cash0.23344.5343.6941.9445.26
Non-forest trees0.82249.2142.5843.4142.46
 Subsistence1.77650.6843.5443.8840.31
 Cash1.07940.6544.5042.4146.63
Forests25.828 **22.5661.9240.1842.65<0.0010.2520.0610.0350.0331.000
 Subsistence24.958 **22.6861.4640.4142.87<0.0010.2430.0590.0450.0441.000
 Cash7.35740.5048.9040.5043.69
Livestock7.04238.8844.5434.5652.65
 Subsistence4.08141.7647.1235.8847.52
 Cash2.23238.9445.0441.0048.07
Processed products5.34045.0643.8735.1249.06
 Subsistence4.87445.5944.6935.1247.93
 Cash1.84043.4443.4840.8846.81
Other3.34042.9450.0236.2643.74
Total net income29.430 **21.0636.6951.8260.560.2830.002<0.0010.3290.0041.000
Notes: Clusters (C1–C4) represent the following livelihood strategies: C1—relying primarily on own farming activities; C2—making a living off the land, with mixed income from agriculture and forest resources; C3—engaging in wage employment; C4—living from remittances. ** p < 0.01.

References

  1. Verburg, P.H.; Erb, K.H.; Mertz, O.; Espindola, G. Land System Science: Between global challenges and local realities. Curr. Opin. Environ. Sustain. 2013, 5, 433–437. [Google Scholar] [CrossRef] [PubMed]
  2. Erni, C. (Ed.) Shifting Cultivation Livelihood and Food Security. New and Old Challenges for Indigenous Peoples in Asia; The Food and Agriculture Organisation of the United Nations: Bangkok, Thailand, 2015. [Google Scholar]
  3. Van Vliet, N.; Mertz, O.; Heinimann, A.; Langanke, T.; Pascual, U.; Schmook, B.; Adams, C.; Schmidt-Vogt, D.; Messerli, P.; Leisz, S.; et al. Trends, drivers and impacts of changes in swidden cultivation in tropical forest-agriculture frontiers: A global assessment. Glob. Environ. Chang. 2012, 22, 418–429. [Google Scholar] [CrossRef]
  4. Cramb, R.A.; Colfer, C.J.P.; Dressler, W.; Laungaramsri, P.; Le, Q.T.; Mulyoutami, E.; Peluso, N.L.; Wadley, R.L. Swidden Transformations and Rural Livelihoods in Southeast Asia. Hum. Ecol. 2009, 37, 323–346. [Google Scholar] [CrossRef]
  5. Fox, J.; Fujita, Y.; Ngidang, D.; Peluso, N.; Potter, L.; Sakuntaladewi, N.; Sturgeon, J.; Thomas, D. Policies, Political-Economy, and Swidden in Southeast Asia. Hum. Ecol. 2009, 37, 305–322. [Google Scholar] [CrossRef] [PubMed] [Green Version]
  6. Heinimann, A.; Mertz, O.; Frolking, S.; Egelund Christensen, A.; Hurni, K.; Sedano, F.; Parsons Chini, L.; Sahajpal, R.; Hansen, M.; Hurtt, G. A global view of shifting cultivation: Recent, current, and future extent. PLoS ONE 2017, 12, e0184479. [Google Scholar] [CrossRef] [PubMed]
  7. Dressler, W.H.; Wilson, D.; Clendenning, J.; Cramb, R.; Keenan, R.; Mahanty, S.; Bruun, T.B.; Mertz, O.; Lasco, R.D. The impact of swidden decline on livelihoods and ecosystem services in Southeast Asia: A review of the evidence from 1990 to 2015. Ambio 2017, 46, 291–310. [Google Scholar] [CrossRef] [PubMed]
  8. Turner, B.L.; Robbins, P. Land-Change Science and Political Ecology: Similarities, Differences, and Implications for Sustainability Science. Annu. Rev. Environ. Resour. 2008, 33, 295–316. [Google Scholar] [CrossRef]
  9. Vicol, M.; Pritchard, B.; Htay, Y.Y. Rethinking the role of agriculture as a driver of social and economic transformation in Southeast Asia’s upland regions: The view from Chin State, Myanmar. Land Use Policy 2018, 72, 451–460. [Google Scholar] [CrossRef]
  10. Rigg, J.; Salamanca, A.; Phongsiri, M.; Sripun, M. More farmers, less farming? Understanding the truncated agrarian transition in Thailand. World Dev. 2018, 107, 327–337. [Google Scholar] [CrossRef]
  11. Kelly, P.F. Migration, Agrarian Transition, and Rural Change in Southeast Asia. Crit. Asian Stud. 2011, 43, 479–506. [Google Scholar] [CrossRef]
  12. Andersen, K.E. Institutional Models for a Future Recognition and Registration of Customary (Communal) Tenure in Myanmar. In Proceedings of the 2016 World Bank Conference on Land and Poverty, Washington DC, USA, 14–18 March 2016; pp. 1–24. [Google Scholar]
  13. Win, S. Investigation on shifting cultivation practices conducted by the hill tribes for the development of suitable agroforestry techniques in Myanmar. In Proceedings of the Annual Research Conference (Forestry Sciences), Yangon, Myanmar, 28–30 June 2005; pp. 28–96. [Google Scholar]
  14. Springate-Baginski, O. Rethinking swidden cultivation in Myanmar. In Shifting Cultivation Policies: Balancing Environmental and Social Sustainability; Cairns, M., Ed.; CAB International: Boston, MA, USA, 2017; pp. 226–241. [Google Scholar]
  15. Springate-Baginski, O. Decriminalise agro-Forestry! Transnational Institute: Amsterdam, The Netherlands, 2018; pp. 1–36. [Google Scholar]
  16. Mark, S. “Fragmented Sovereignty” over Property Institutions: Developmental Impacts on the Chin Hill Communities. Independ. J. Burmese Scholarsh. 2016, 1, 125–160. [Google Scholar]
  17. Akee, R.; Kapur, D. Myanmar Remittances; International Growth Centre: London, UK, 2017. [Google Scholar]
  18. Mang, K.L. Ethnic Chin People Today; Livelihood, Migration, Internal Displacement and Exile. In Proceedings of the International Conference on Burma/Myanmar Studies, Chiang Mai, Thailand, 24–25 July 2015. [Google Scholar]
  19. Mirante, E. Unsheltered Heights: Northern Chin State’s Environmental Issues; Project Maje: Portland, OR, USA, 2017. [Google Scholar]
  20. Department of Population. The 2014 Myanmar Population and Housing Census. Chin State; Census Report; The Republic of the Union of Myanmar. Ministry of Immigration and Population: Nay Pyi Taw, Myanmar, 2015; Volume 3. [Google Scholar]
  21. Livelihoods and Food Security Trust Fund. Household Survey 2013; LIFT Fund Management Office: Yangon, Myanmar, 2013; pp. 1–169. [Google Scholar]
  22. Thein, S. Study on the Evolution of Farming Systems and Livelihood Dynamics in Northern Chin State. Available online: http://www.burmalibrary.org/docs17/Evolution_of_Farming_Systems-Chin_State.pdf (accessed on 15 October 2018).
  23. Einzenberger, R. Contested Frontiers: Indigenous Mobilization and Control over Land and Natural Resources in Myanmar’s Upland Areas. Austrian J. South-East Asian Stud. 2016, 9, 163–172. [Google Scholar] [CrossRef]
  24. Aung, P.S.; Adam, Y.O.; Pretzsch, J.; Peters, R. Distribution of forest income among rural households: A case study from Natma Taung national park, Myanmar. For. Trees Livelihoods 2015, 24, 190–201. [Google Scholar] [CrossRef]
  25. Chan, N.; Takeda, S. The Transition Away from Swidden Agriculture and Trends in Biomass Accumulation in Fallow Forests: Case Studies in the Southern Chin Hills of Myanmar. Mt. Res. Dev. 2016, 36, 320–331. [Google Scholar] [CrossRef]
  26. Pritchard, B.; Dibley, M.; Rammohan, A.; Htin, Z.S.; Nay, S.M.; Thwin, T.; Pan Hmone, M.; Htet, K.; Vicol, M.; Aung, A.M.; et al. Livelihoods and Food Security in Rural Myanmar: Survey Findings; University of Sydney: Sydney, Australia, 2017. [Google Scholar]
  27. Livelihoods and Food Security Trust Fund. Qualitative Social and Economic Monitoring: Round Five Report. Available online: https://www.lift-fund.org/qualitative-social-and-economic-monitoring-livelihoods-myanmar-qsem-round-5-english-version (accessed on 15 October 2018).
  28. Oberlack, C.; Tejada, L.; Messerli, P.; Rist, S.; Giger, M. Sustainable livelihoods in the global land rush? Archetypes of livelihood vulnerability and sustainability potentials. Glob. Environ. Chang. 2016, 41, 153–171. [Google Scholar] [CrossRef]
  29. Rasmussen, L.V.; Coolsaet, B.; Martin, A.; Mertz, O.; Pascual, U.; Corbera, E.; Dawson, N.; Fisher, J.A.; Franks, P.; Ryan, C.M. Social-ecological outcomes of agricultural intensification. Nat. Sustain. 2018, 1, 275–282. [Google Scholar] [CrossRef]
  30. Scoones, I. Livelihoods perspectives and rural development. J. Peasant Stud. 2009, 36, 171–196. [Google Scholar] [CrossRef] [Green Version]
  31. Chambers, R.; Conway, G.R. Sustainable Rural Livelihoods: Practical Concepts for the 21st Century, 296th ed.; Institute of Development Studies: Brighton, UK, 1991. [Google Scholar]
  32. Department for International Development. Sustainable Livelihoods Guidance Sheets; Department for International Development: London, UK, 1999. [Google Scholar]
  33. Center for International Forestry Research. PEN Technical Guidelines, version 4 ed; Center for International Forestry Research: Bogor, Indonesia, 2007. [Google Scholar]
  34. Bakkegaard, R.K.; Agrawal, A.; Animon, I.; Hogarth, N.J.; Daniel, M.; Persha, L.; Rametsteiner, E.; Wunder, S.; Zezza, A. National Socio-Economic Survey in Forestry. Guidance and Survey Modules for Measuring the Multiple Roles of Forests in Household Welfare and Livelihoods, 179th ed.; Food and Agriculture Organisation of the United Nations: Rome, Italy, 2016. [Google Scholar]
  35. Khatiwada, S.; Deng, W.; Paudel, B.; Khatiwada, J.; Zhang, J.; Su, Y. Household Livelihood Strategies and Implication for Poverty Reduction in Rural Areas of Central Nepal. Sustainability 2017, 9. [Google Scholar] [CrossRef]
  36. Parker, P.; Thapa, B.; Jacob, A. Decentralizing conservation and diversifying livelihoods within Kanchenjunga Conservation Area, Nepal. J. Environ. Manag. 2015, 164, 96–103. [Google Scholar] [CrossRef] [PubMed]
  37. Walelign, S.Z. Livelihood strategies, environmental dependency and rural poverty: The case of two villages in rural Mozambique. Environ. Dev. Sustain. 2015, 18, 593–613. [Google Scholar] [CrossRef]
  38. World Wildlife Fund. Southern Asia: Western Myanmar Extending into Eastern India. Available online: https://www.worldwildlife.org/ecoregions/im0109 (accessed on 30 July 2018).
  39. World Wildlife Fund. Southern Asia: Along the Border between India and Myanmar. Available online: https://www.worldwildlife.org/ecoregions/im0303 (accessed on 30 July 2018).
  40. Oli, B.N.; Treue, T.; Smith-Hall, C. The relative importance of community forests, government forests, and private forests for household-level incomes in the Middle Hills of Nepal. For. Policy Econ. 2016, 70, 155–163. [Google Scholar] [CrossRef]
  41. Cavendish, W. Quantitative methods for estimating the economic value of resource use to rural households. In Uncovering the Hidden Harvest: Valuation Methods for Woodlands & Forest Resources; Campbell, B.M., Luckert, M., Eds.; Earthscan: London, UK, 2002; pp. 17–65. [Google Scholar]
  42. Gautam, Y.; Andersen, P. Rural livelihood diversification and household well-being: Insights from Humla, Nepal. J. Rural Stud. 2016, 44, 239–249. [Google Scholar] [CrossRef]
  43. Pau, J. Linking Resources to Livelihoods: A Comparative Study of two Villages in the Chin State of Myanmar; ASEAN-Canada Research Partnership Working Paper Series; Working Paper No. 4; S. Rajaratnam School of International Studies: Singapore, 2016. [Google Scholar]
  44. Ellis, F. The Determinants of Rural Livelihood Diversification in Developing Countries. J. Agric. Econ. 2000, 51, 289–302. [Google Scholar] [CrossRef]
  45. Angelsen, A.; Jagger, P.; Babigumira, R.; Belcher, B.; Hogarth, N.J.; Bauch, S.; Börner, J.; Smith-Hall, C.; Wunder, S. Environmental Income and Rural Livelihoods: A Global-Comparative Analysis. World Dev. 2014, 64, S12–S28. [Google Scholar] [CrossRef] [Green Version]
  46. Rayamajhi, S.; Smith-Hall, C.; Helles, F. Empirical evidence of the economic importance of Central Himalayan forests to rural households. For. Policy Econ. 2012, 20, 25–35. [Google Scholar] [CrossRef]
  47. Dorward, A.; Anderson, S.; Bernal, Y.N.; Vera, E.S.; Rushton, J.; Pattison, J.; Paz, R. Hanging in, stepping up and stepping out: Livelihood aspirations and strategies of the poor. Dev. Pract. 2009, 19, 240–247. [Google Scholar] [CrossRef]
  48. Rasmussen, M.B.; Lund, C. Reconfiguring Frontier Spaces: The territorialisation of resource control. World Dev. 2018, 101, 388–399. [Google Scholar] [CrossRef]
  49. Myanmar Climate Change Alliance. Assessing Climate Change Risks in Chin State Towns. Available online: http://myanmarccalliance.org/en/2017/08/climate-change-risks-in-chin-state/ (accessed on 25 July 2018).
  50. Ministry of Information. Constitution of the Republic of the Union of Myanmar; Ministry of Information: Dhaka, Bangladesh, 2008. [Google Scholar]
  51. McCarthy, S. Rule of Law Expedited: Land Title Reform and Justice in Burma (Myanmar). Asian Stud. Rev. 2018, 42, 229–246. [Google Scholar] [CrossRef]
  52. The Republic of the Union of Myanmar. National Land Use Policy. 2016. Available online: http://extwprlegs1.fao.org/docs/pdf/mya152783.pdf (accessed on 15 October 2018).
  53. Win, S.P.; Dirt-poor Chin State hidden gem for investors. Myanmar Times 2017. Available online: https://www.mmtimes.com/news/dirt-poor-chin-state-hidden-gem-investors.html (accessed on 15 October 2018).
  54. Ministry of Agriculture Livestock Forestry and Mine. Forestry Sector Development. Strategic Plan (2017–2018 to 2020–2021); Government of the Chin State of the Republic of the Union of Myanmar: Myanmar, Naypyidaw, 2016; pp. 1–12.
Figure 1. Map of the study area. The figure shows the location of Chin State in Myanmar (in green), and the location of the four study villages Lailo, Tualzang, Tuilang, and Tungzang in northern Chin State.
Sustainability 10 03707 g001
Figure 2. Population structure across study villages. Illustrated is the population structure across villages, including all members of sampled households (dark blue), and with active remittance senders that were associated with sampled households (light blue).
Sustainability 10 03707 g002
Figure 3. Aggregate income of the sample by income sources, and shares of households that realised an income from the respective income source: (a) Illustrates the shares of aggregate income that the sample realised from off-farm oriented (brown tones), land-based (green tones) and natural resource reliant value adding activities (purple tones); and (b) illustrates rates of households’ engagement in different livelihood activities, in terms of the share of households, which realised an income from the respective income sources.
Sustainability 10 03707 g003
Figure 4. (a) Relative composition of household income portfolios across household clusters; (b) shares of households by engagement in different livelihood strategies (clusters) and villages. Stacked bars in (a) illustrate the median contribution of various income components to income portfolios of the different household clusters. Percentage values are median shares of total household income, except income from livestock and processed products. Clusters C1–C6 in (a) and (b) represent the following livelihood strategies: C1—relying primarily on own farming activities; C2—making a living off the land, with mixed income from agriculture and forest resources; C3—engaging in wage employment; C4—living from remittances; C5—practicing non-forest tree husbandry; or C6—engaging in self-employed business activities.
Sustainability 10 03707 g004
Figure 5. Distribution of cumulative household income across cumulative adult equivalent units (AEU).
Sustainability 10 03707 g005
Figure 6. Cumulative density distribution of annual household income per AEU by clusters and in relation to the international poverty line of 1.90 USD PPP. The distribution of annual household incomes in C4, without income from remittances, is also shown.
Sustainability 10 03707 g006
Table 1. Characteristics of sample villages.
CharacteristicsVillages
LailoTuilanghTualzangTungzang
Location23°23′47.8″ N, 93°38′06.2″ E23°24′56.6″ N, 93°38′29.3″ E23°25′29.5″ N, 93°39′07.4″ E23°31′11.3″ N, 93°35′21.0″ E
Village area (ha)≈809Not recorded≈607≈607
Village hh (no.)204203103350
Inhabitants (no.)154914006832400
Temporary out-migrants (%)≈13%≈4%≈3%≈21%
Mains electricityCentral grid (Tedim)NoneMicro-hydro (village)Micro-hydro (village)
Photovoltaic≈90% of hh≈66% of hh≈20% of hh≈10% of hh
Piped water (drinking and domestic)Village water source to most hh; ≈20% of hh from neighboursVillage water source to all hhLimited from scarce village resource; mostly by buckets from water source of neighbour villageGravity fed system with tanks to some village hh
Health careSmall government health centreTwo resident nursesOne resident nurseTwo resident nurses
Credit institutions (formal and informal)Banks (Tedim); relativesBanks (Tedim); micro-loans (NGO GRET); relativesBanks (Tedim); micro-loans (governmental); women church group; relativesBanks in Tedim; micro-loans (NGO GRET); relatives
Travel time to closest market (Tedim)10 min by motorcycle; 1 h walking20 min by motorcycle; 1.5 h walking20 min by motorcycle; 1.5 h walking1.5 h by motorcycle; more in shared cars
Land-useTerraced paddy fields along the river; swidden fields on mountain slopes; very few semi-permanent gardens away from homesteads; very small remaining areas of thick forestSwidden farming is in decline as people engage in wage labour; some households recently established tree plantations and farm-tree stands near the villageSwidden fields dominate; very few terraced fields and semi-permanent gardens away from homesteads; no remaining areas of thick forestSwidden fields dominate; ≈50 ha of terraced paddy fields were destroyed during extreme weather events in past years; larger remaining areas of thick forest
Land tenureOfficially titled paddy terraces; mostly private tenure of swidden fields according to customary rules; no communal pastures; forest stands in private ownership according to customary rulesMostly private tenure of swidden fields according to customary rules; no communal pastures; forest stands in private ownership according to customary rulesPrivate tenure of swidden fields—almost all of which have been formally registered; no communal pastures; forest stands in communal ownership under customary rules (largely open access, but conversion to farmland is not permitted); protection forest surrounding the village water source; one ongoing process to formalise a community forestPrivate and communal tenure of swidden fields; communal forest pasture for seasonal livestock grazing; forest stands in communal ownership under customary rules (largely open access); protection forest surrounding the village water source
Notes: hh = households, h = hour(s). Data presented in this table was obtained through key informant interviews and focus group discussions (FGD).
Table 2. Relative composition of household income portfolios across clusters C1–C4.
Income SourcesHousehold clustersKruskal-Wallis
C1 (n = 17)C2 (n = 26)C3 (n = 17)C4 (n = 27)
MdnIQRMdnIQRMdnIQRMdnIQR
Wages00–0110–317059–8500–4**
Remittances00–1300–1500–05044–73**
Crops6256–843222–3993–212110–30**
Non-forest trees73–2031–1331–410–8
Forests80–123217–5183–1562–11**
Other sources00–1010–800–100–1
Notes: Values are percentage shares of total household income, except income from livestock and processed products. Bold values are income shares with a value greater than 10%. Clusters (C1–C4) represent the following livelihood strategies: C1—relying primarily on own farming activities; C2—making a living off the land, with mixed income from agriculture and forest resources; C3—engaging in wage employment; C4—living from remittances. IQR = interquartile range. ** p < 0.01.
Table 3. Absolute household income per adult equivalent unit (AEU) by income sources across clusters C1–C4.
Income SourcesHousehold ClustersKruskal-Wallis
C1 (n = 17)C2 (n = 26)C3 (n = 17)C4 (n = 27)
MdnIQRMdnIQRMdnIQRMdnIQR
Wages00–034.60–89496.2178–563.100–17.4**
Remittances00–23.600–79.700–0329.2183.4–706.2**
Crops14591.9–202.594.547.6–134.953.817.2–74.6121.253.6–205.6**
 Subsistence115.462–166.475.547.6–120.839.817.2–54.592.549.2–160.8**
 Cash00–47.500–25.100–20.500–37.7
Non-forest trees19.54.1–63.517.30.6–50.812.52.8–39.310.61.5–41
 Subsistence10.24.1–61.713.30.3–44.112.51.9–38.77.11.5–31.7
 Cash00–000–0.500–0.900–0.1
Forests14.70.3–30.897.252.4–140.237.115.3–61.237.114.2–101.8**
 Subsistence14.70.3–30.997.249.9–140.237.115.3–61.237.114.2–101.8**
 Cash00–000–000–000–0
Livestock00–29.95.40–41.400–3.824.90–91.7
 Subsistence00–6.100–11.100–000–27.1
 Cash00–2.800–29.400–3.800–41.9
Processed products00–8.600–1.400–000–4.2
 Subsistence00–1.200–1.400–000–2.2
 Cash00–000–000–000–0
Other sources0.60–8.53.90–2400–2.70.90–8.6
Total net income293.9148.8–339.4355.2213.8–703.3621.3334.9–846.7655491.8–1228.5**
Notes: Values are adult equivalent adjusted absolute income figures in thousand Myanmar Kyat (MMK). 1000 MMK~0.68 USD in 2018. Values in bold are greater than 10,000 MMK. Clusters (C1–C4) represent the following livelihood strategies: C1—relying primarily on own farming activities; C2—making a living off the land, with mixed income from agriculture and forest resources; C3—engaging in wage employment; C4—living from remittances. ** p < 0.01.
Table 4. Values of households’ physical asset endowments, savings and outstanding debt per adult equivalent unit (AEU) in thousand Myanmar Kyat.
VariablesMdnIQR
Sum of assets and savings912.2423.1–1902.6
 Landholdings491.6144.8–1157.5
 Tools, furniture and home appliances107.434.8–281.6
 Livestock59.120.6–173.6
 Cars and motorcycles74.30–151.1
 Savings4.20–39.2
Outstanding debt30.30–102.1
Notes: Values are adult equivalent adjusted absolute income figures in thousand Myanmar Kyat (MMK). 1000 MMK~0.68 USD in 2018. IQR = interquartile range. A Kruskal-Wallis H test revealed no significant differences in the value of households’ physical asset endowments and outstanding debt, across C1–C4.

