A Robust Regression-Based Stock Exchange Forecasting and Determination of Correlation between Stock Markets

 ,
,  ,
,  and
and 
Abstract
1. Introduction
- We propose and evaluate the robustness of regression-based time series analysis and forecasting;
- We forecast the future values for 4 stock exchanges and 3 international companies;
- We calculate the correlation between 4 stock exchanges for rising and fall of stock indices.
2. Related Work
2.1. Artificial Intelligence Systems
2.2. Artificial Intelligence Systems with Trading Rules
2.3. Artificial Intelligence Systems with Artificial Neural Network
2.4. Artificial Intelligence Systems with Support Vector Machines
3. Proposed Methodology
3.1. Data Collection
3.2. Data Pre-Processing
3.3. Linear Regression
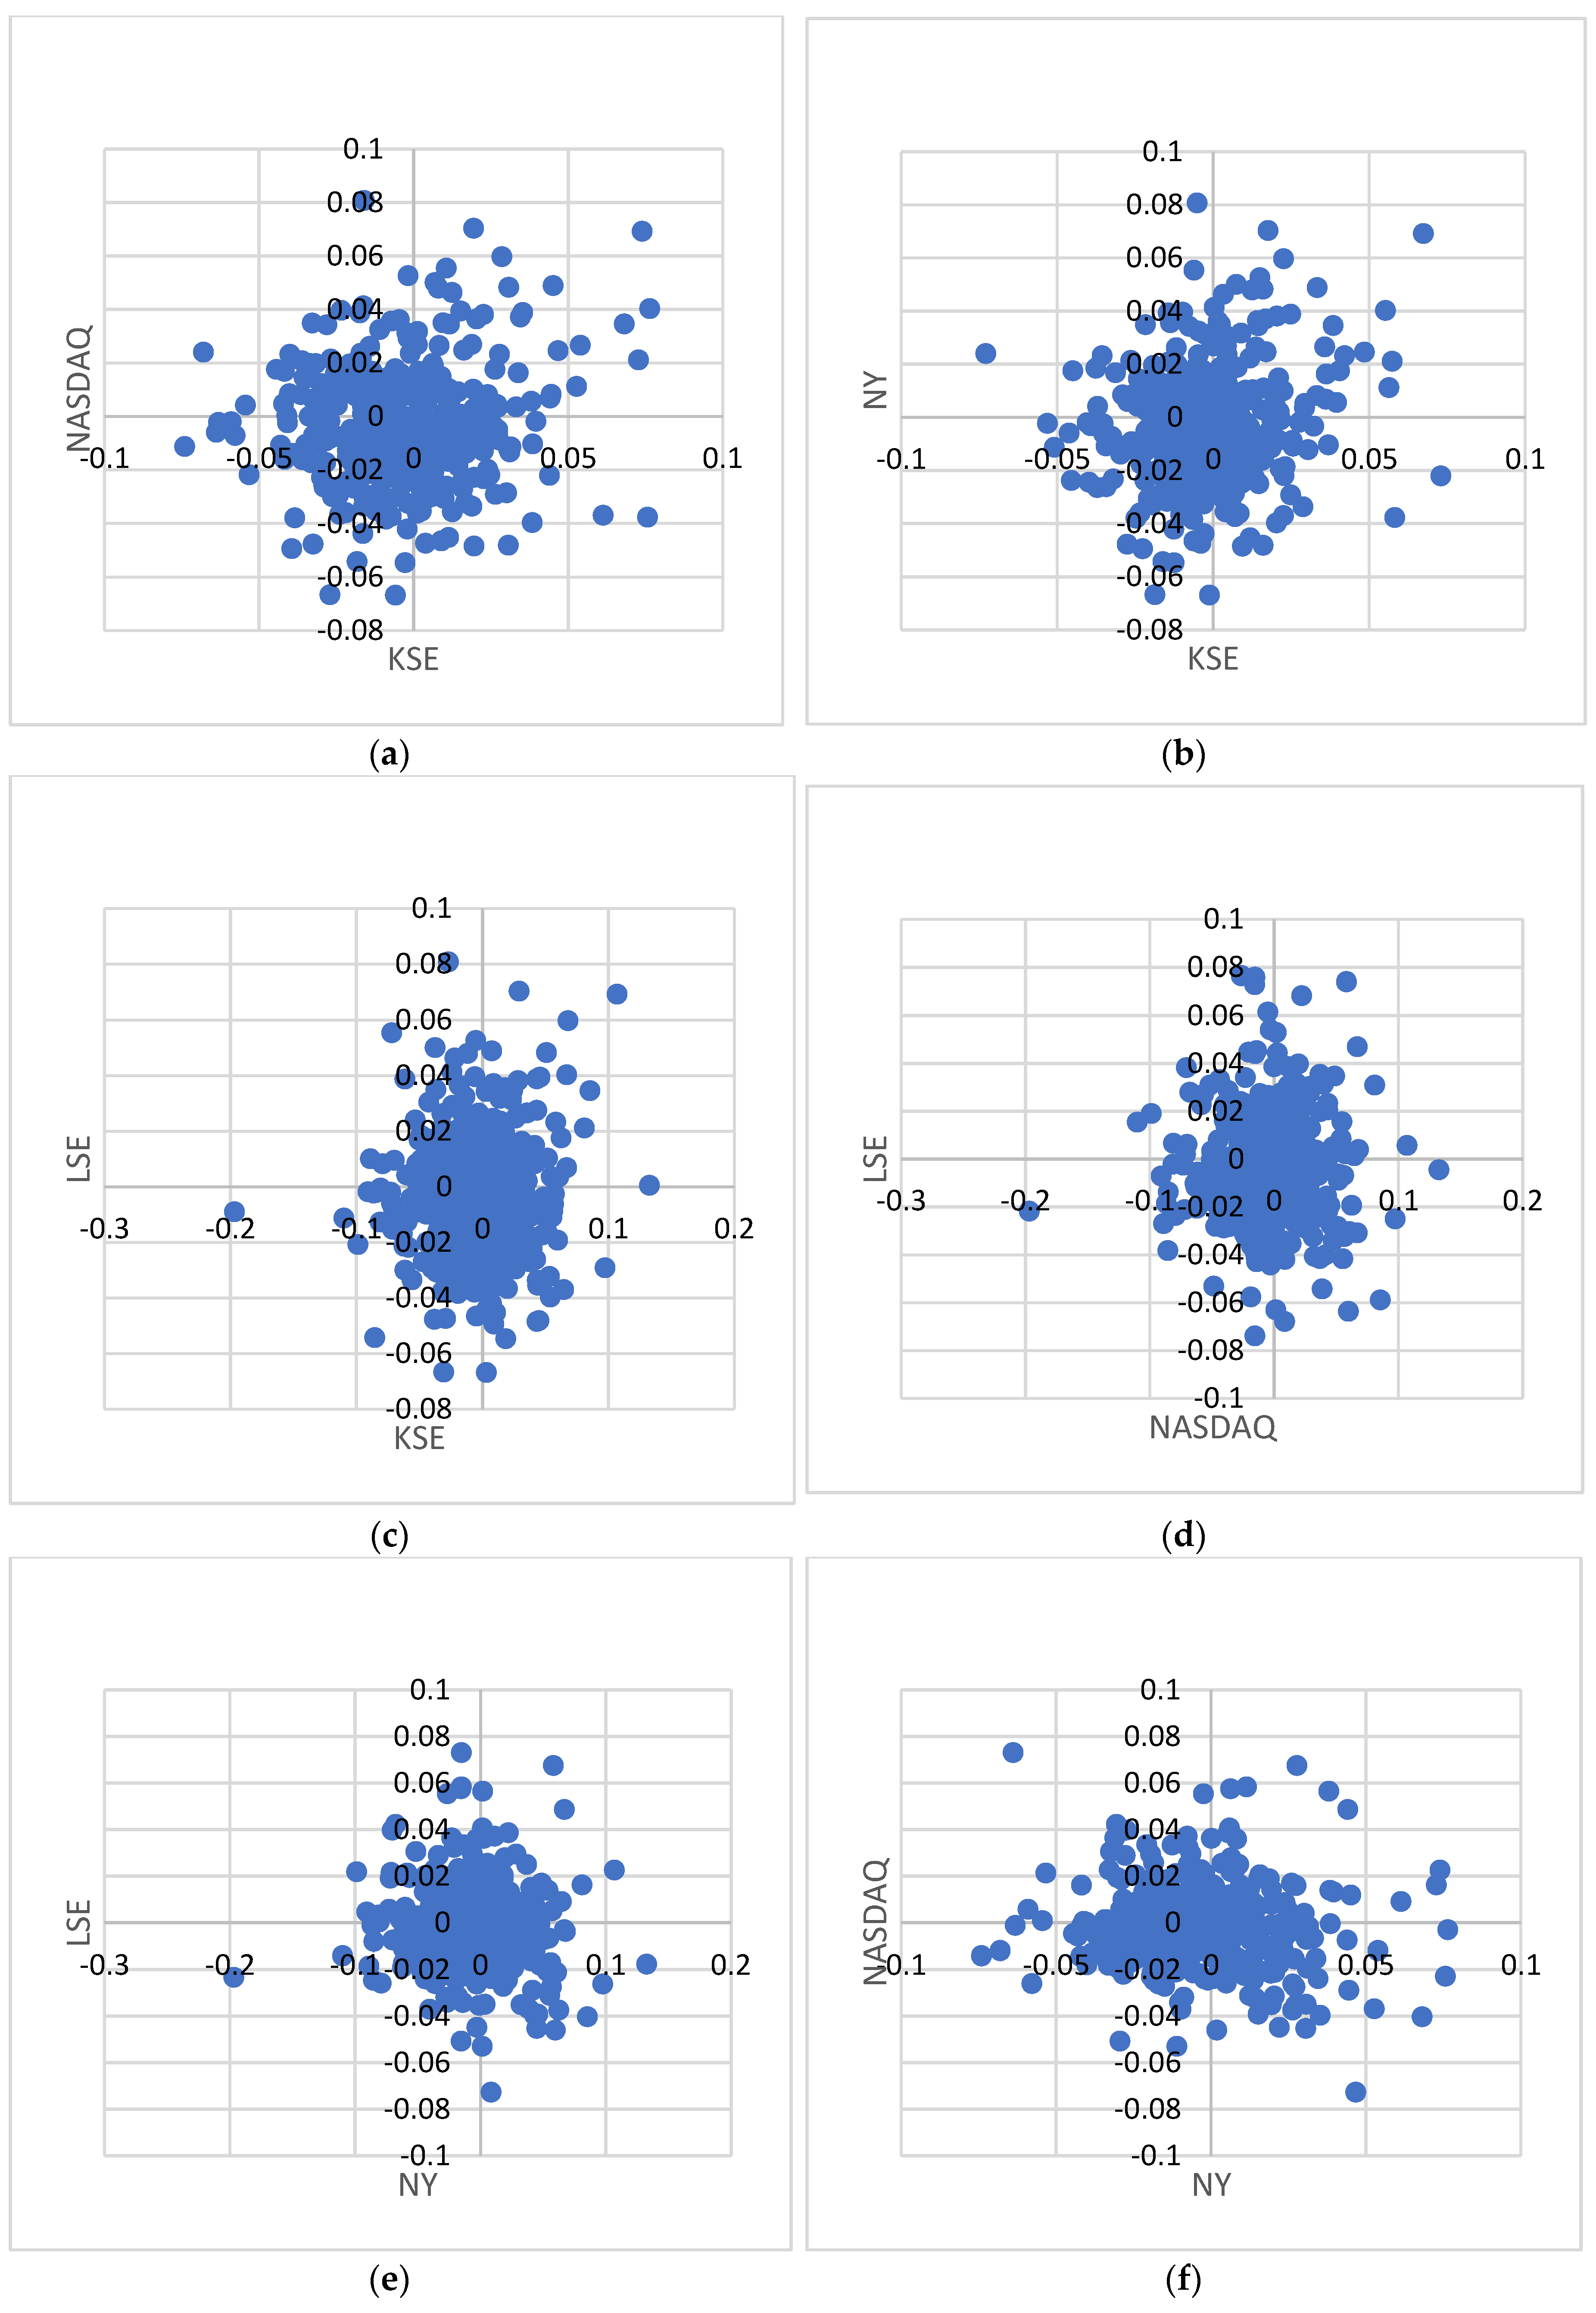
3.4. Stock Exchange Interdependency
4. Experimental Methodology:
4.1. Data Description, Preparation, and Multi-Step Prediction
4.2. Evaluation Metrics
4.2.1. Root Mean Squared Error—RMSE
4.2.2. Mean Absolute Error—MAE
5. Results and Discussion
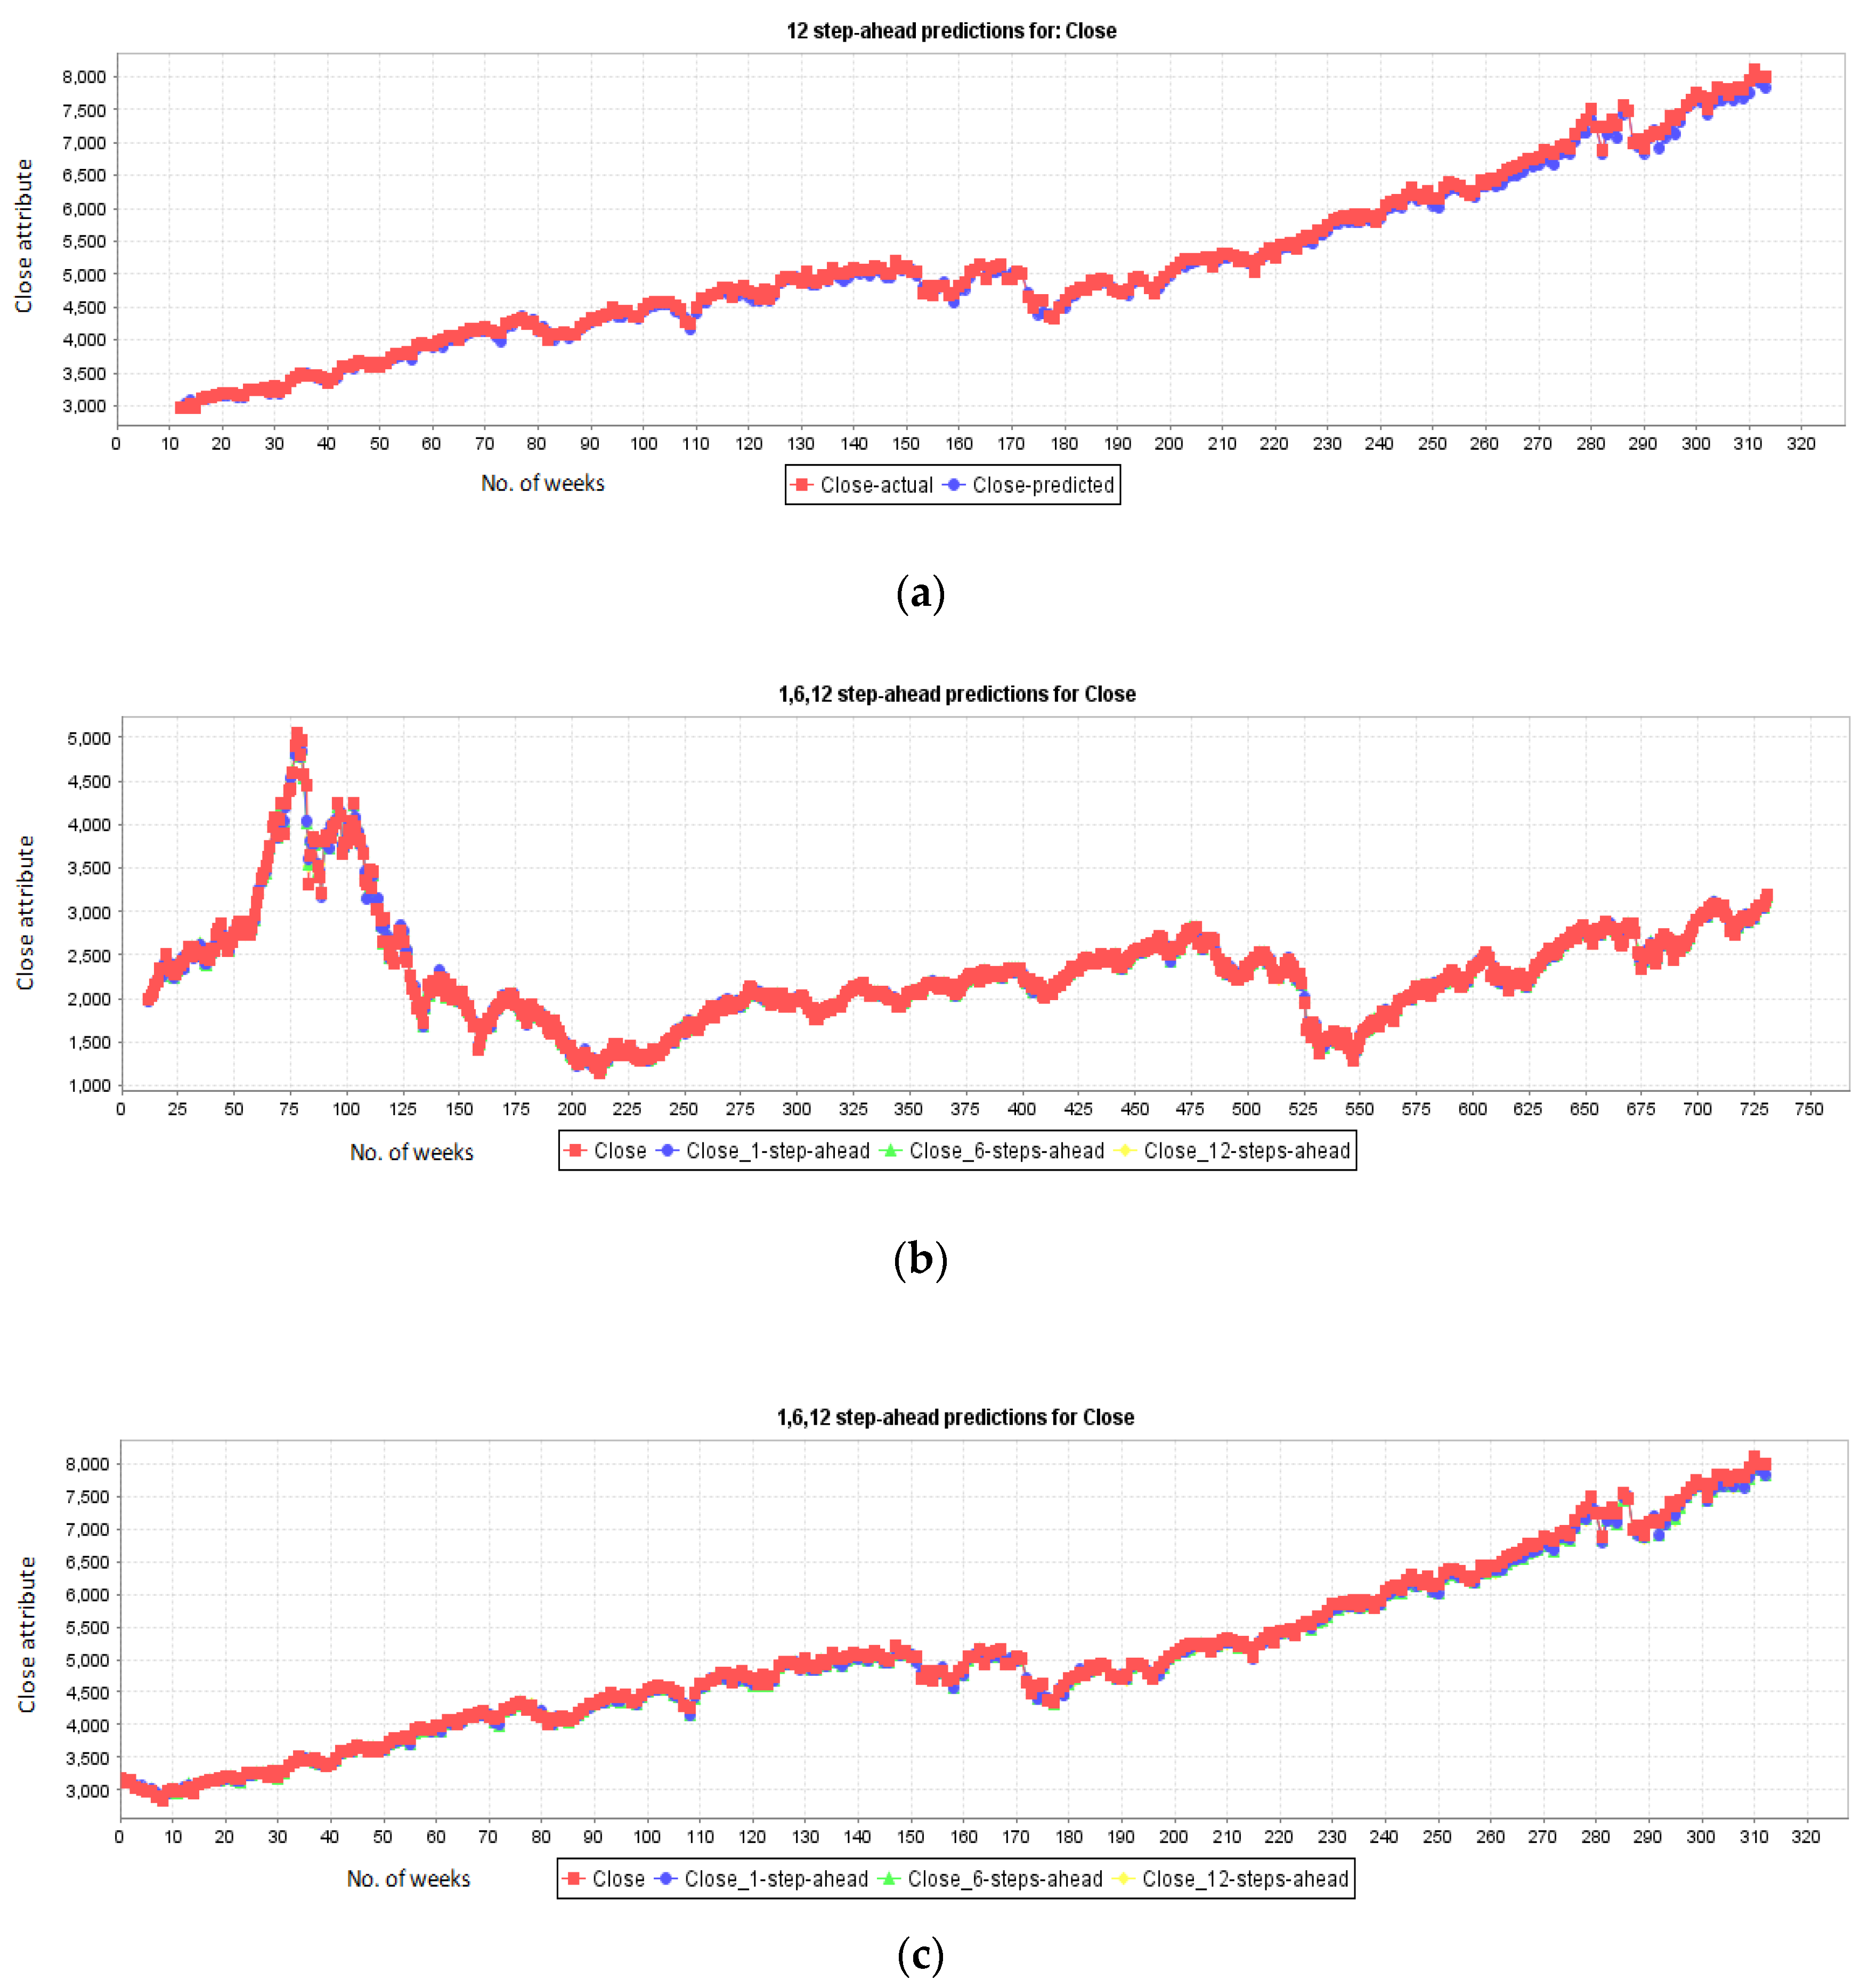
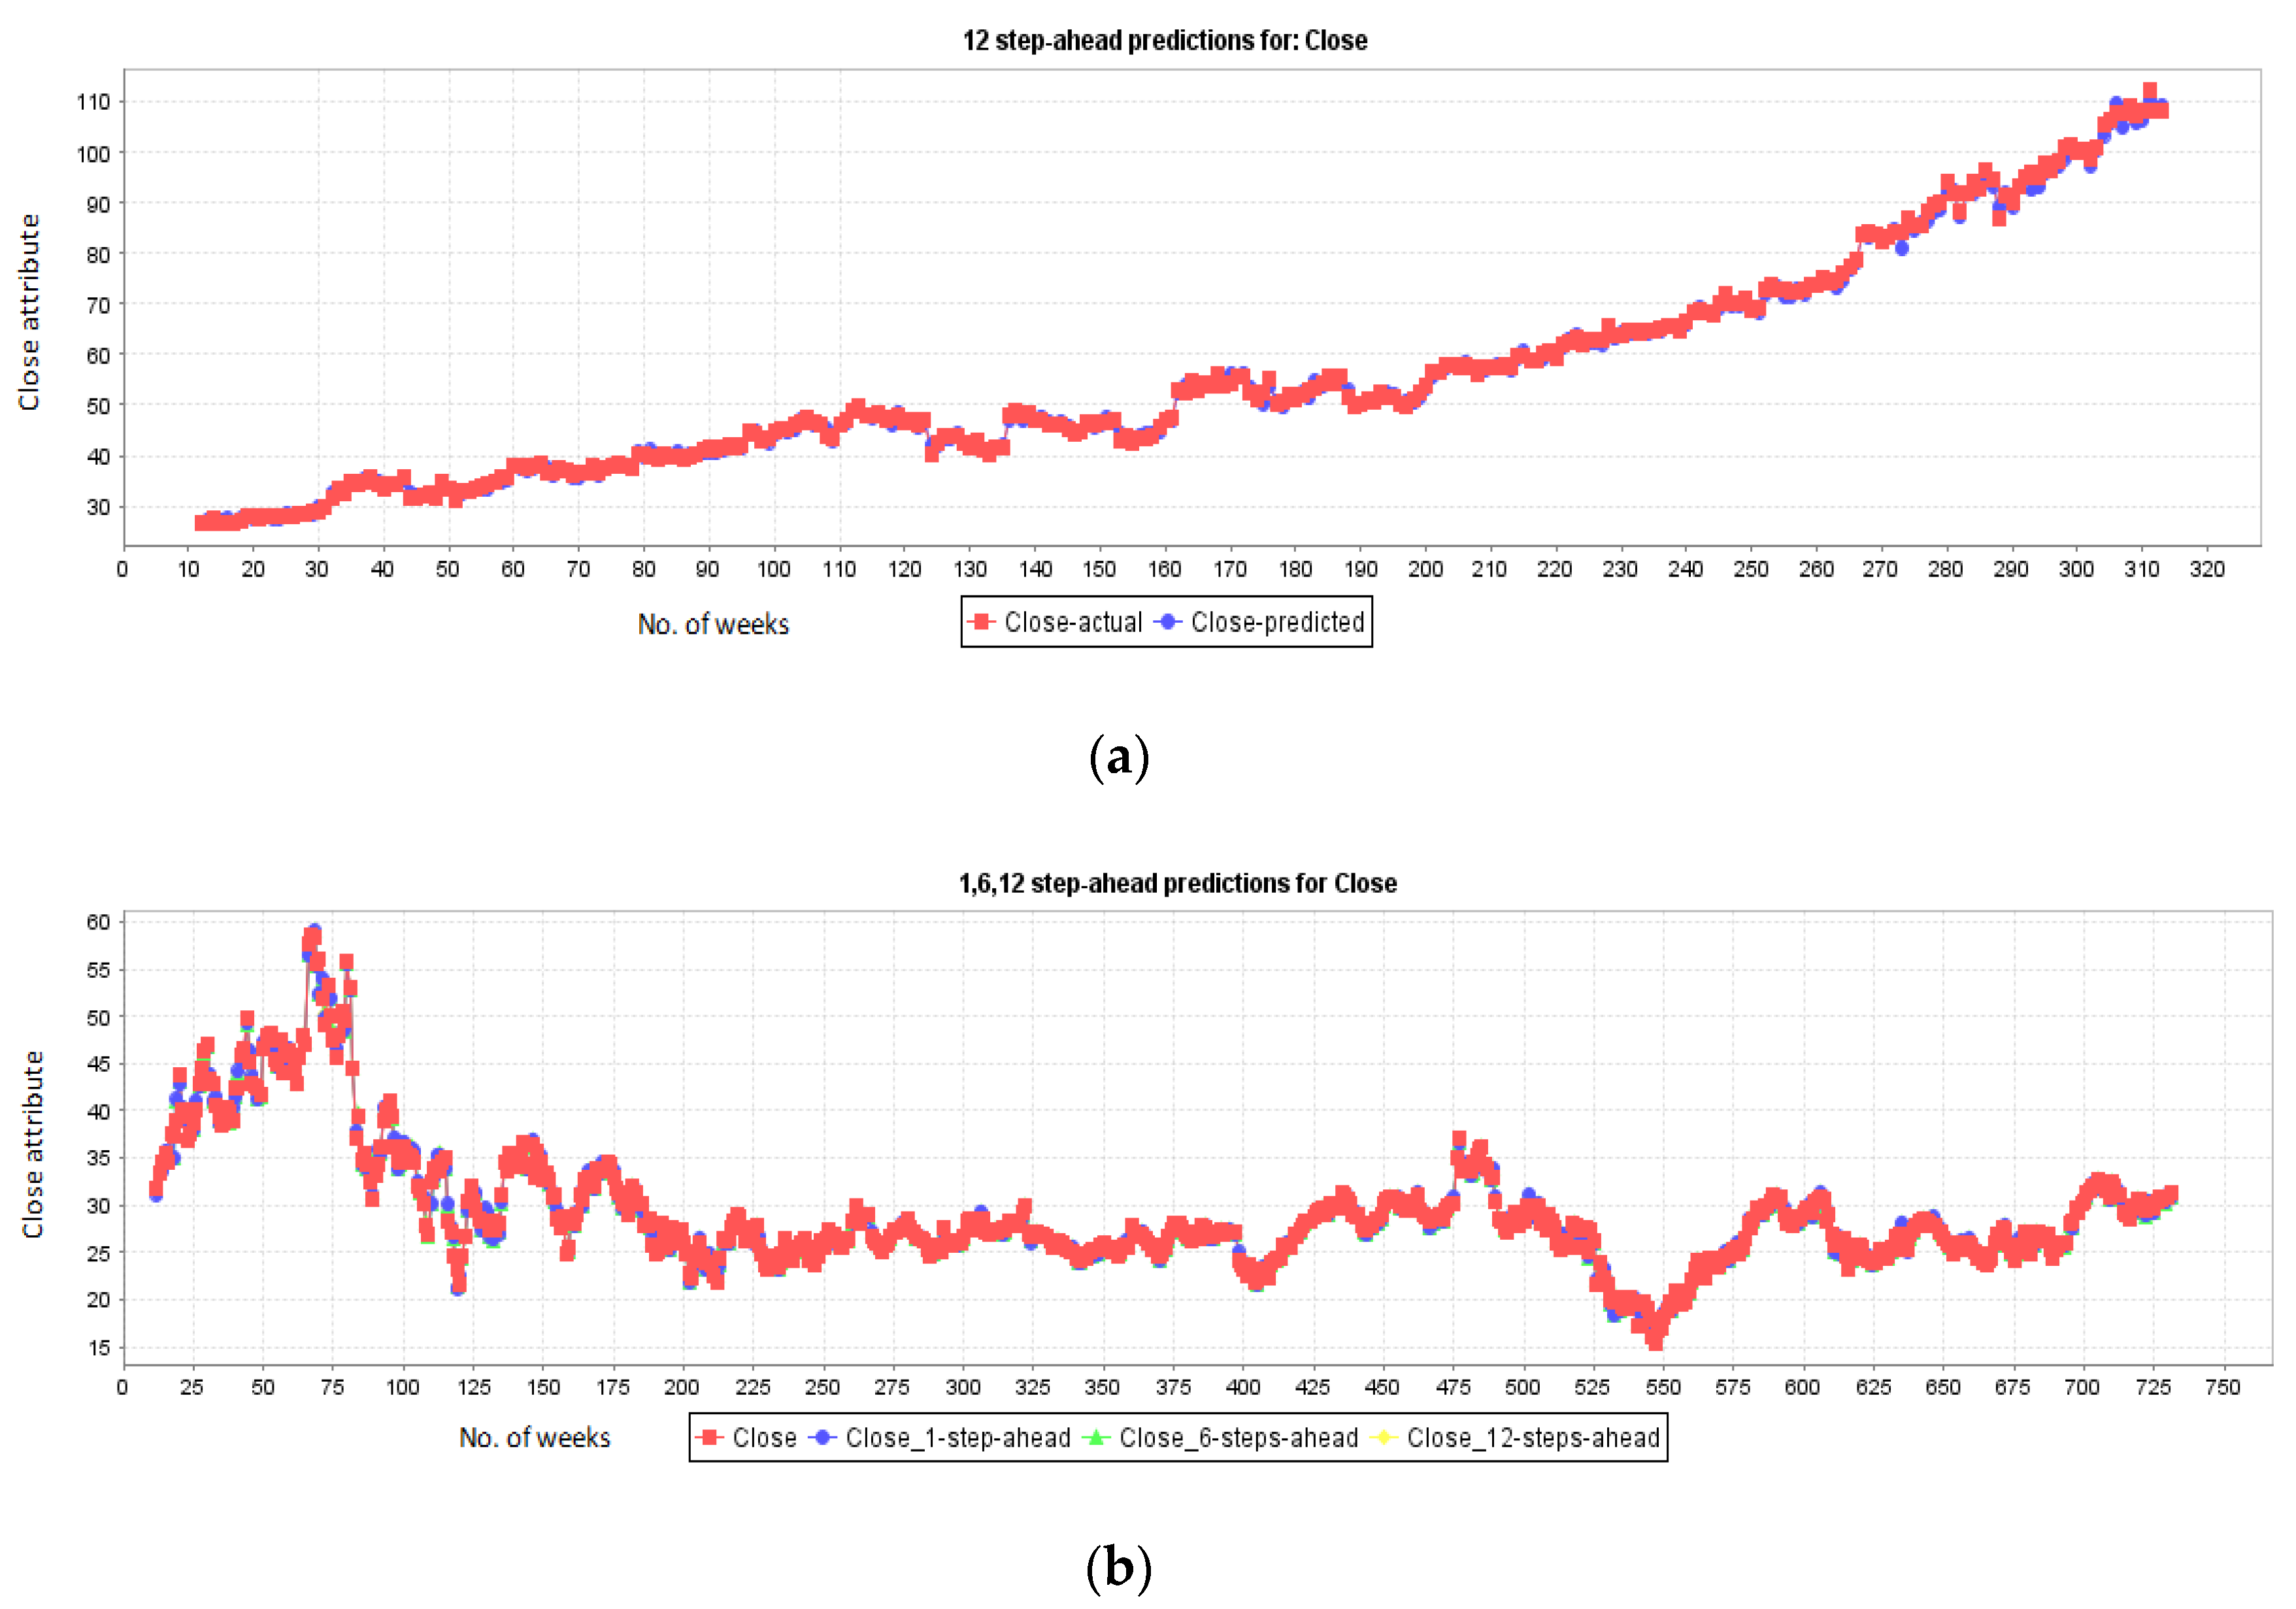
5.1. Results for NASDAQ
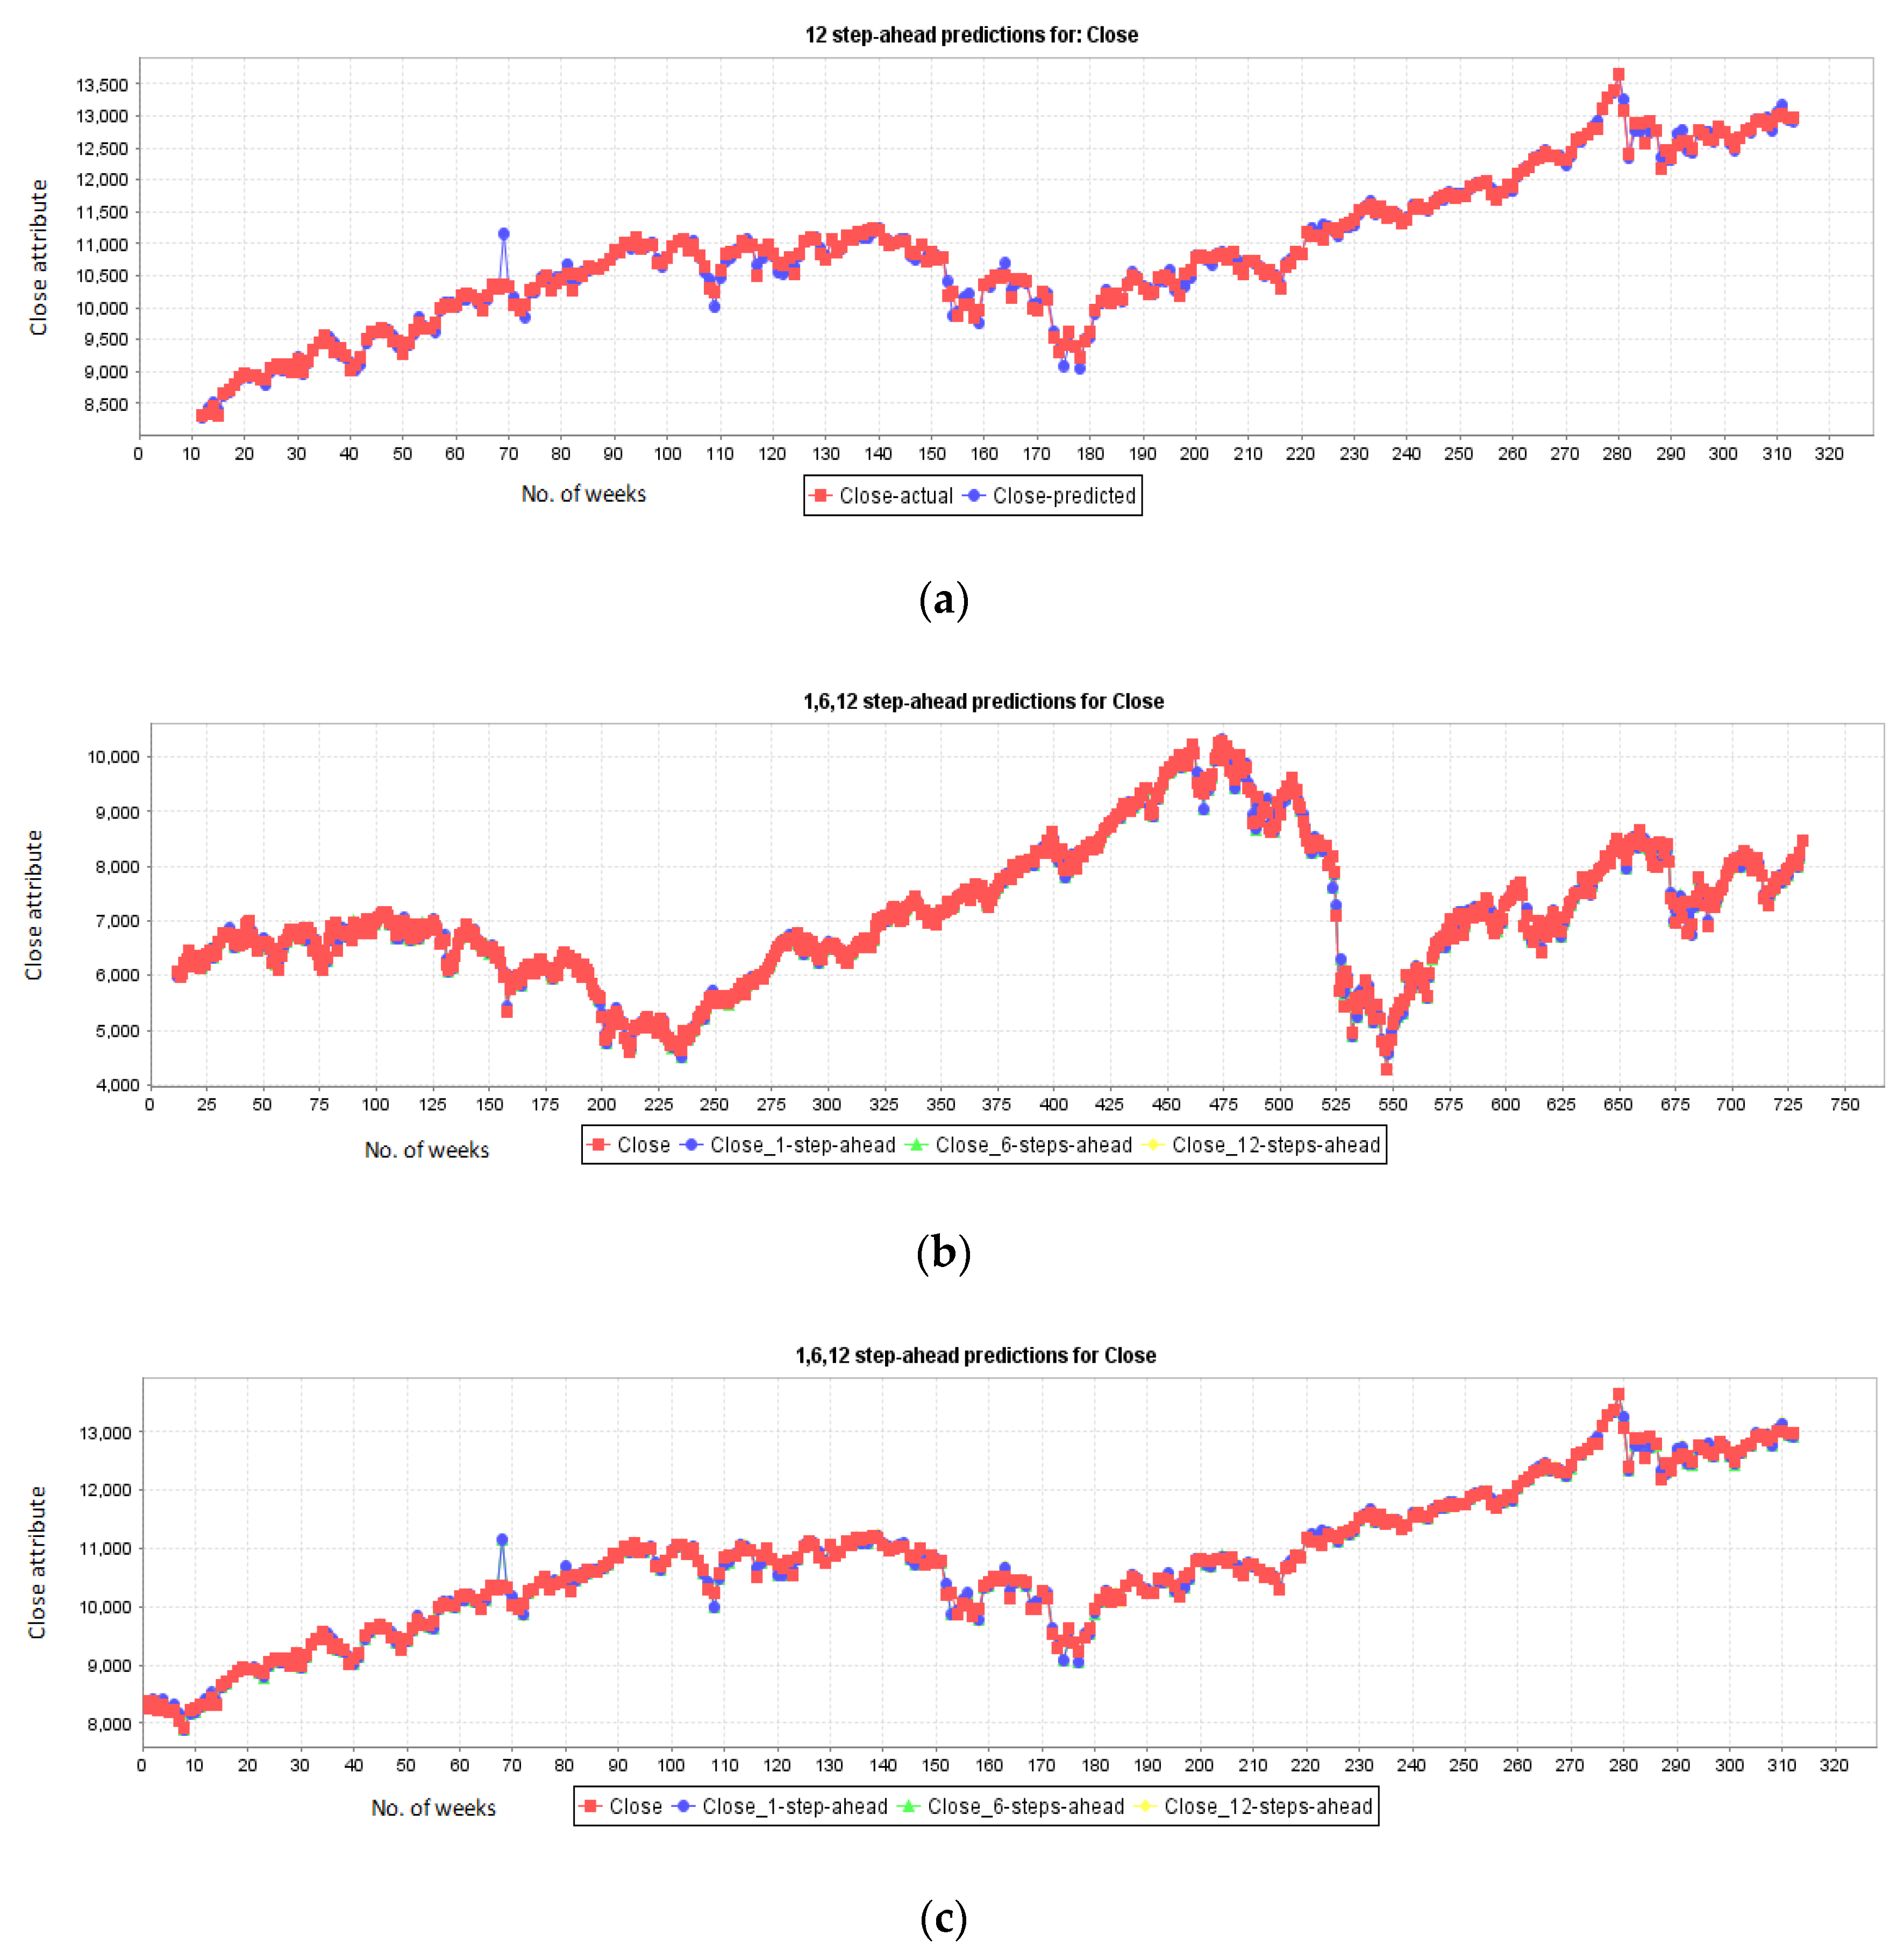
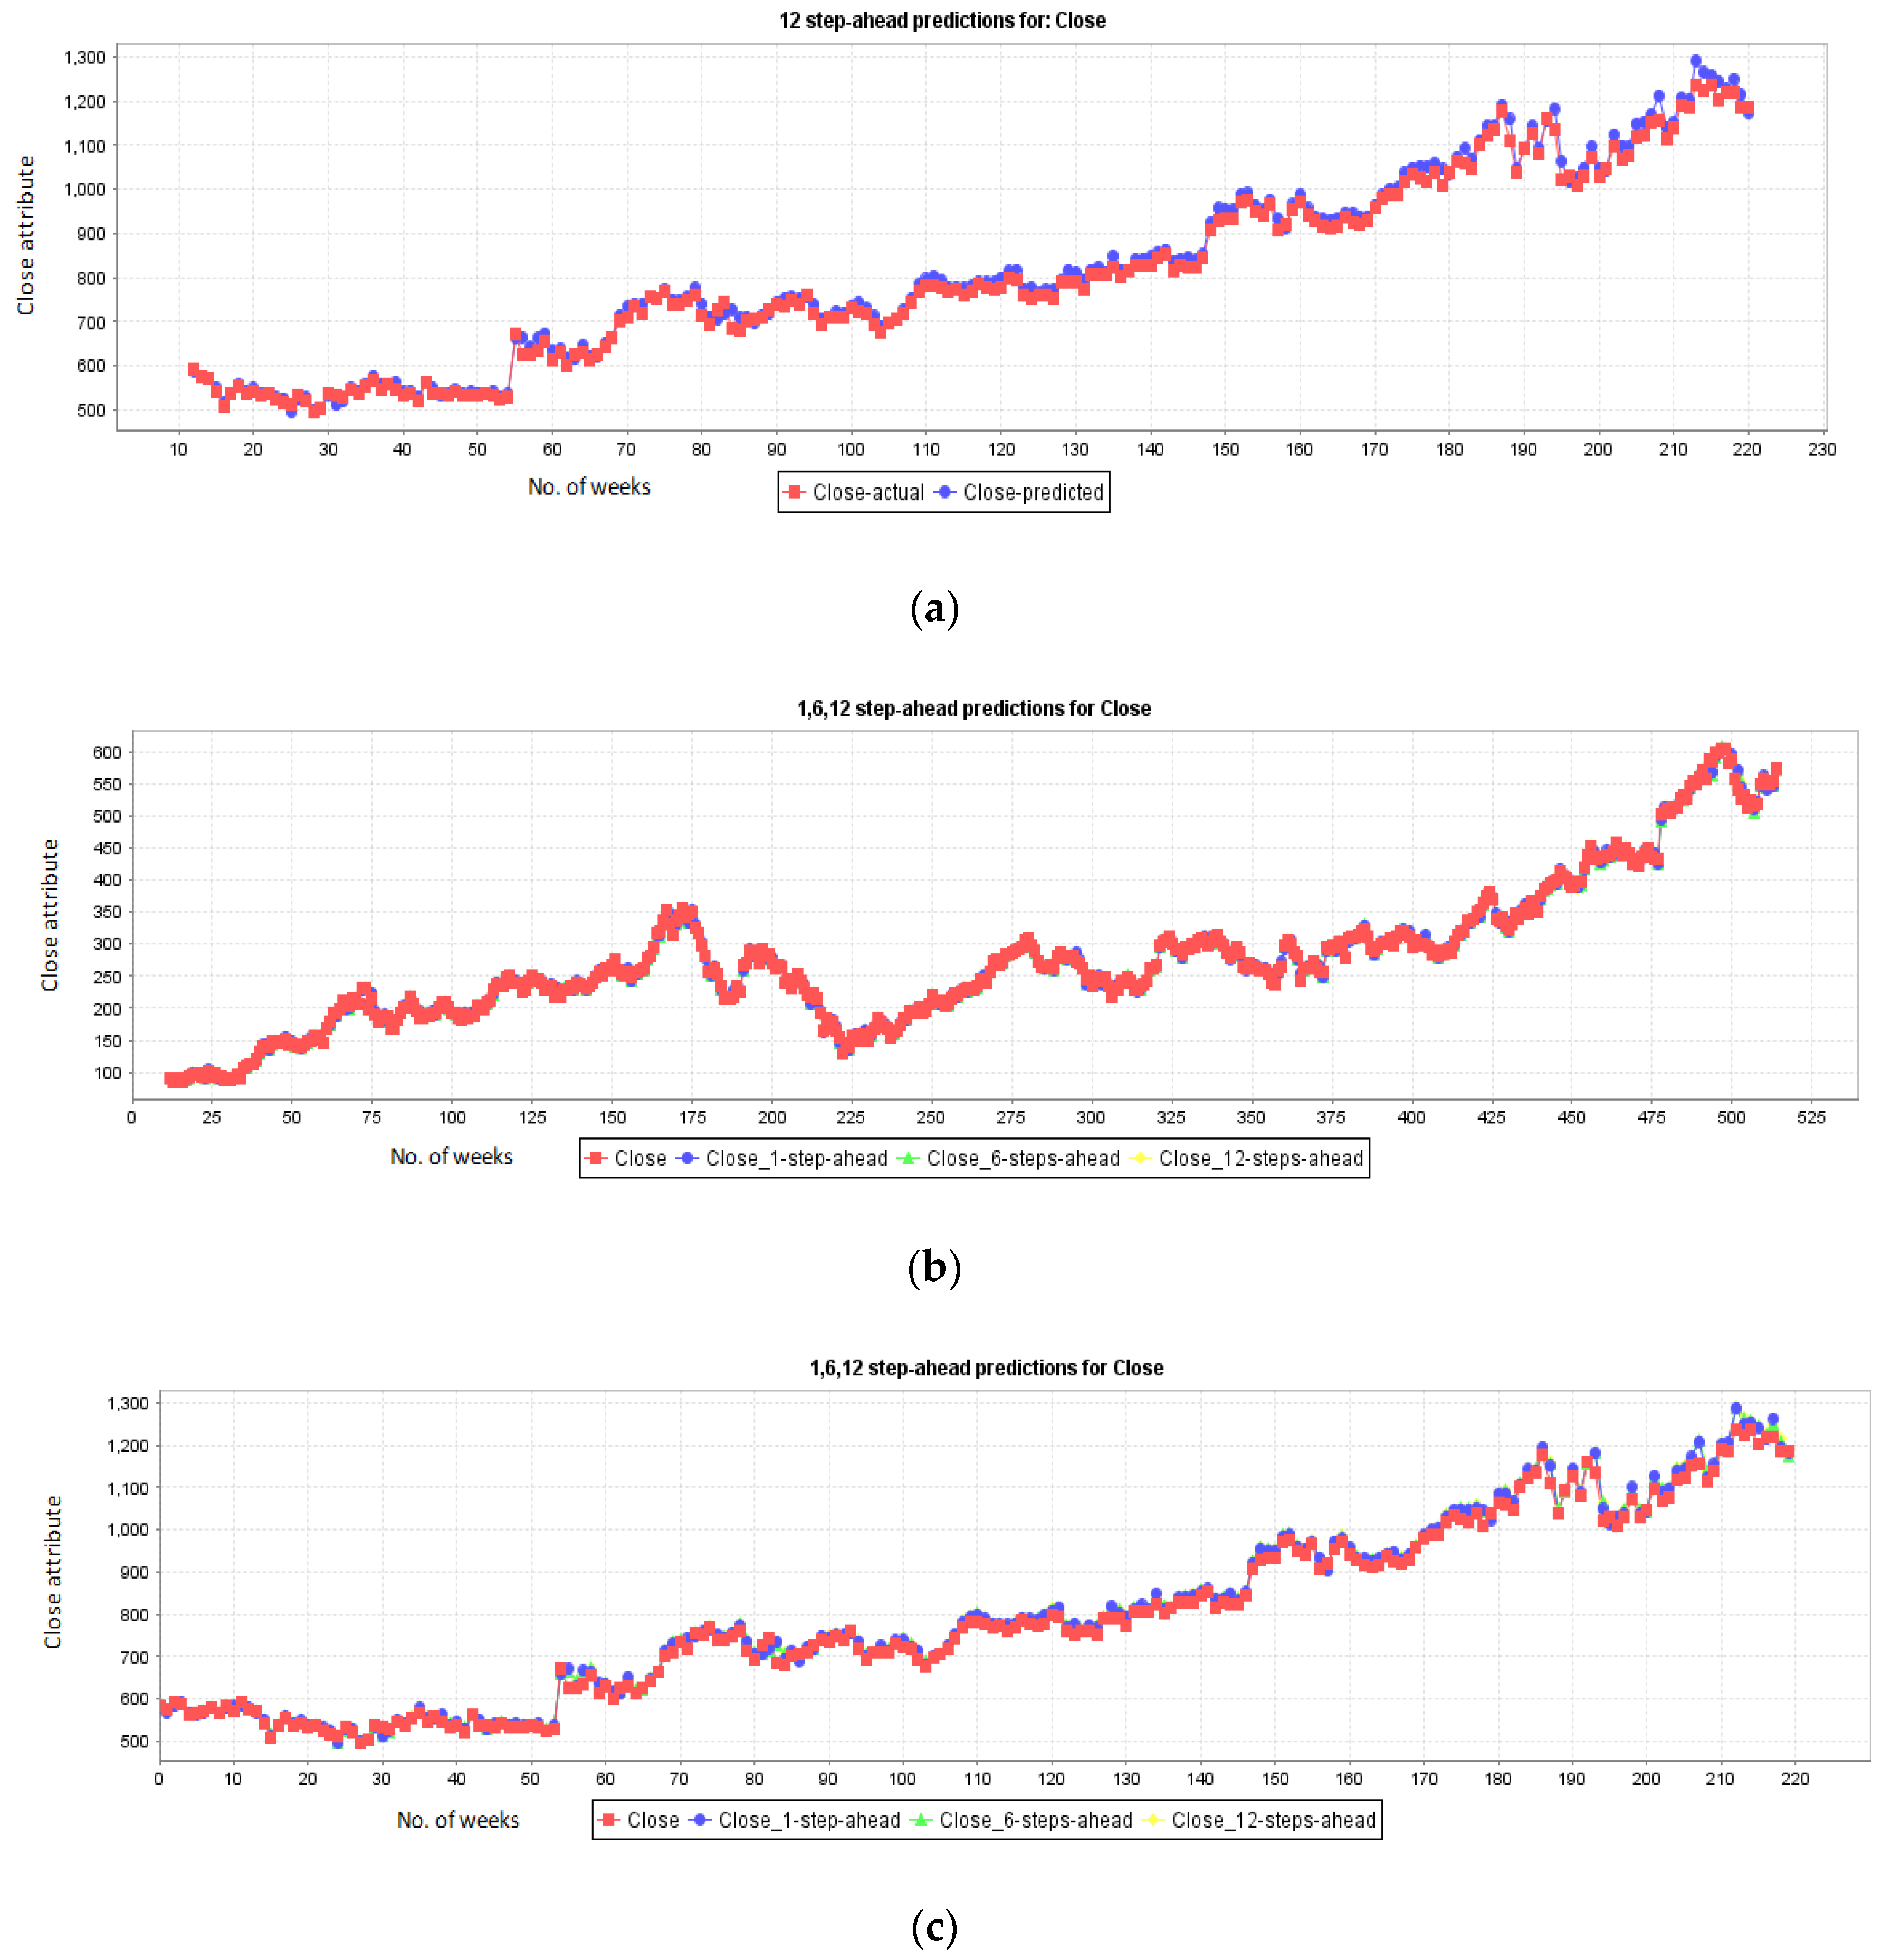
5.2. Results for New York Stock Exchange
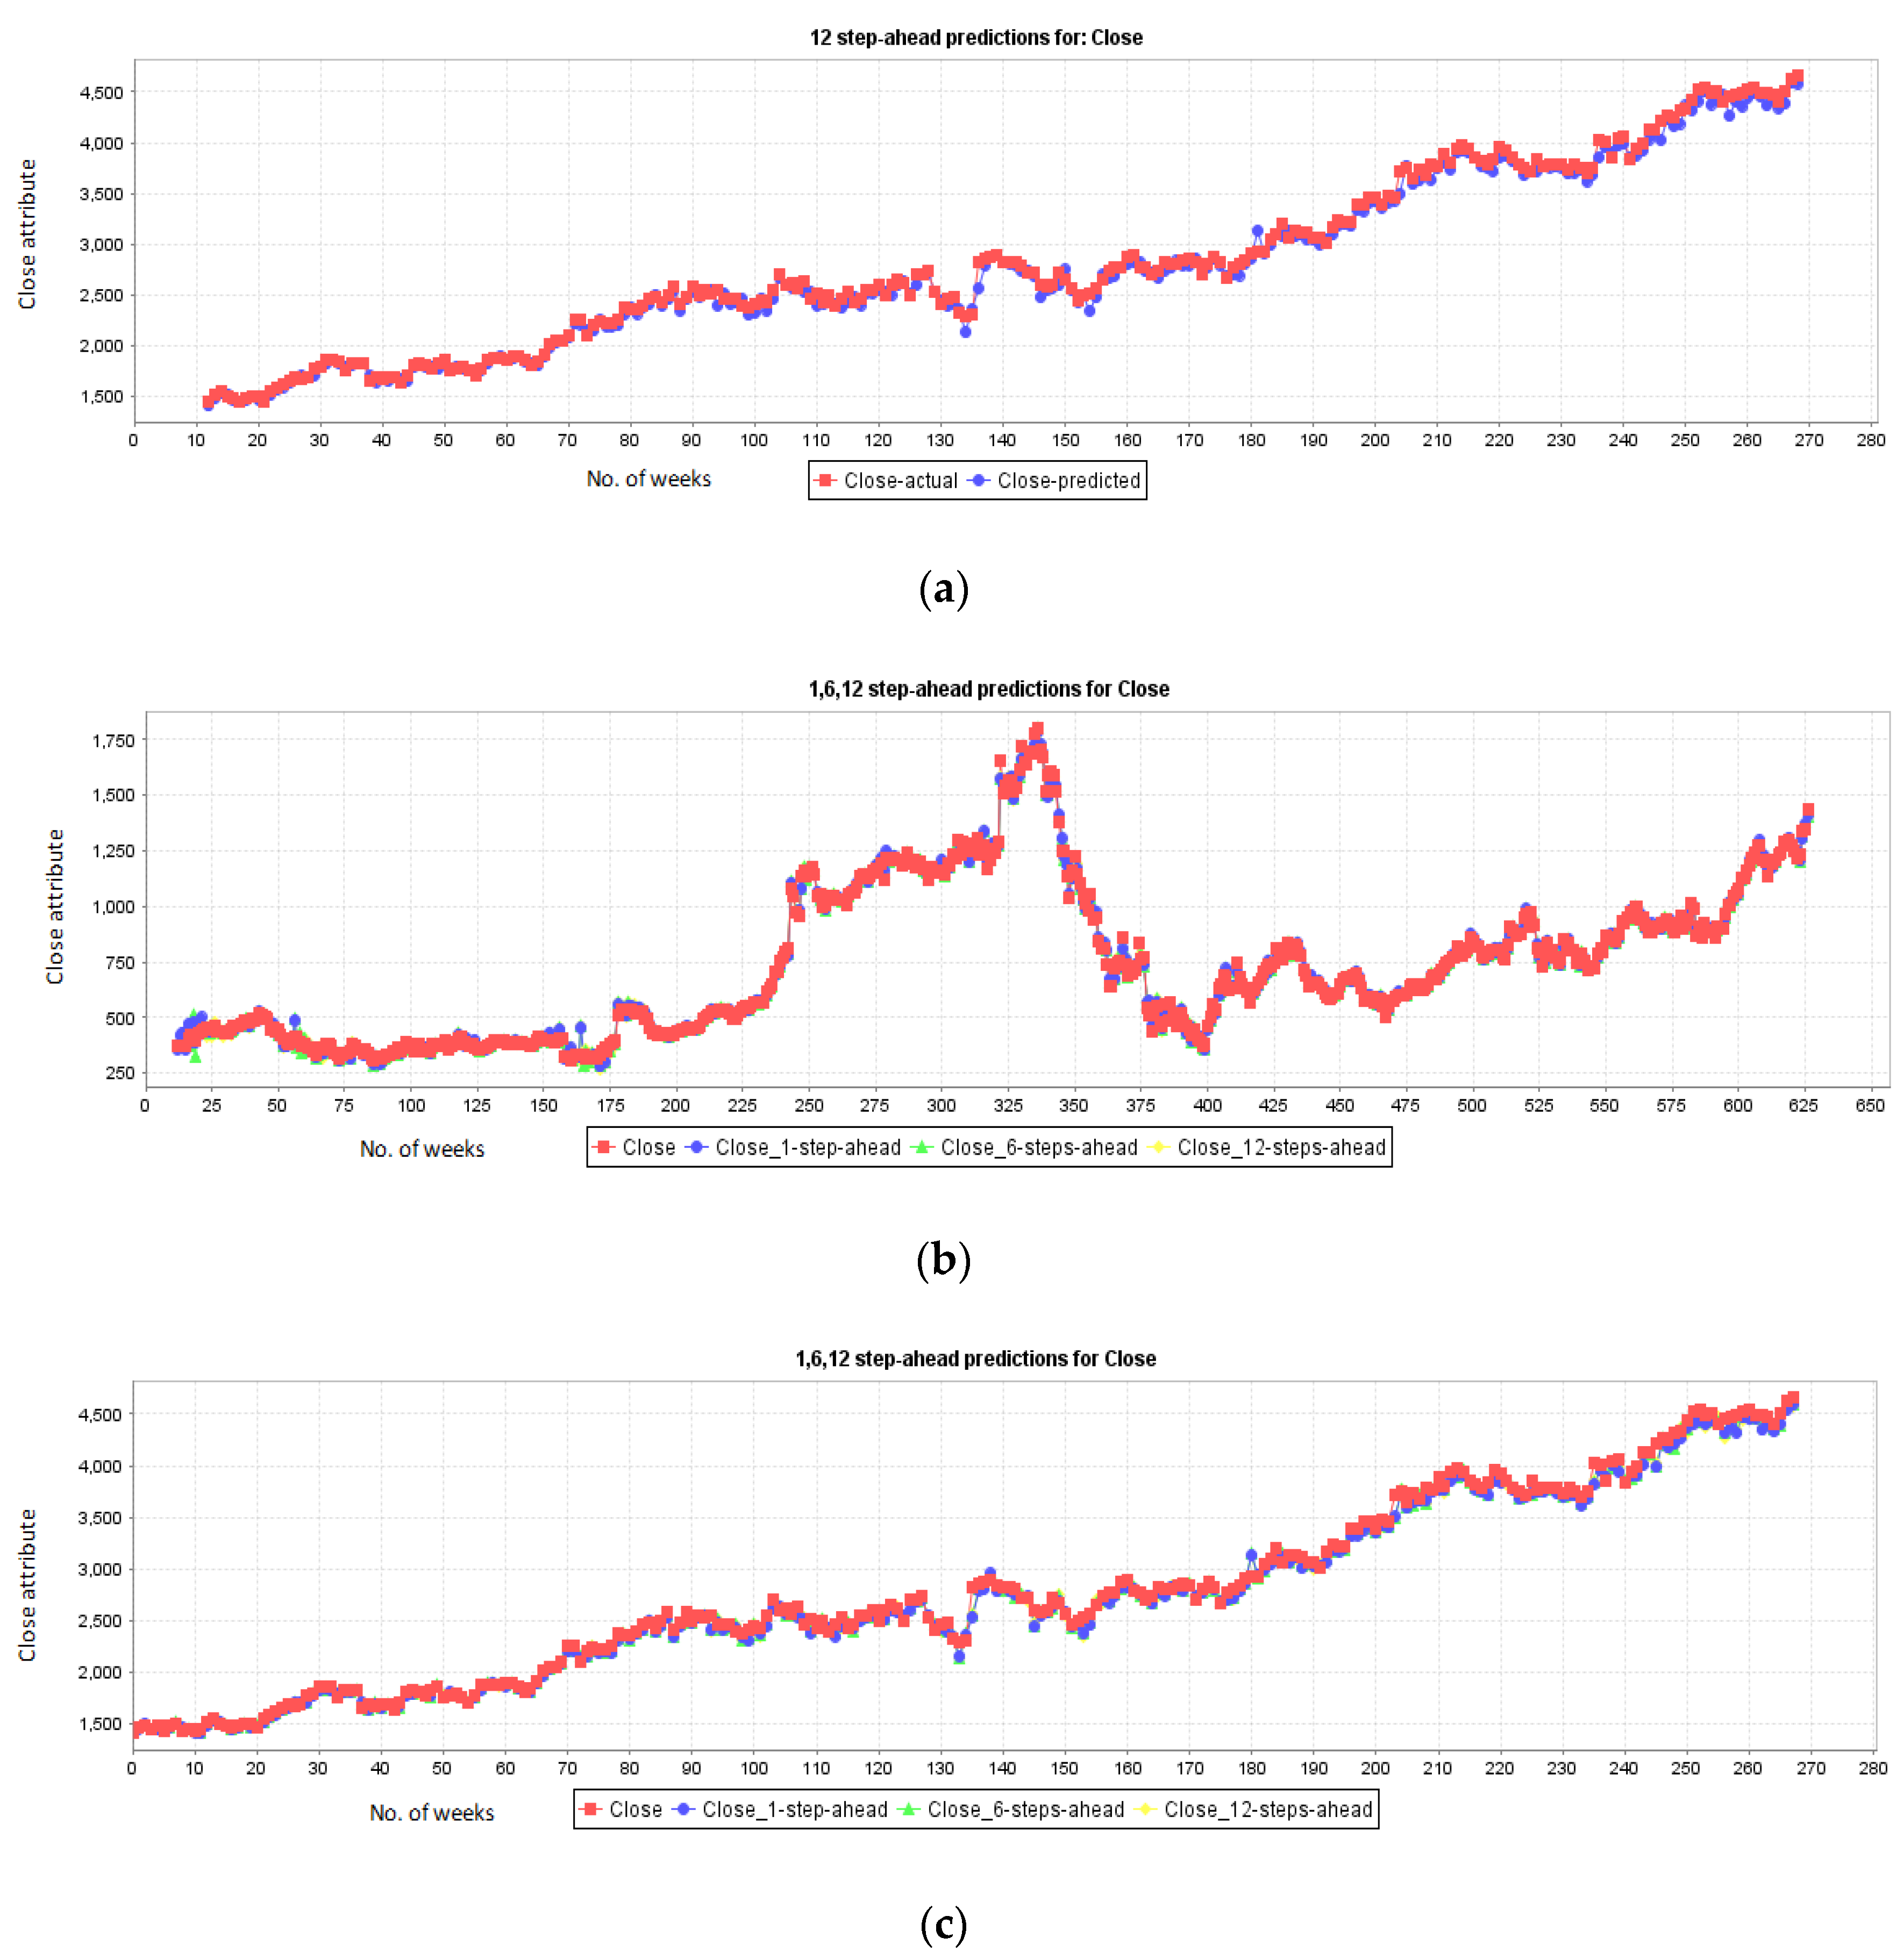
5.3. Results for London Stock Exchange
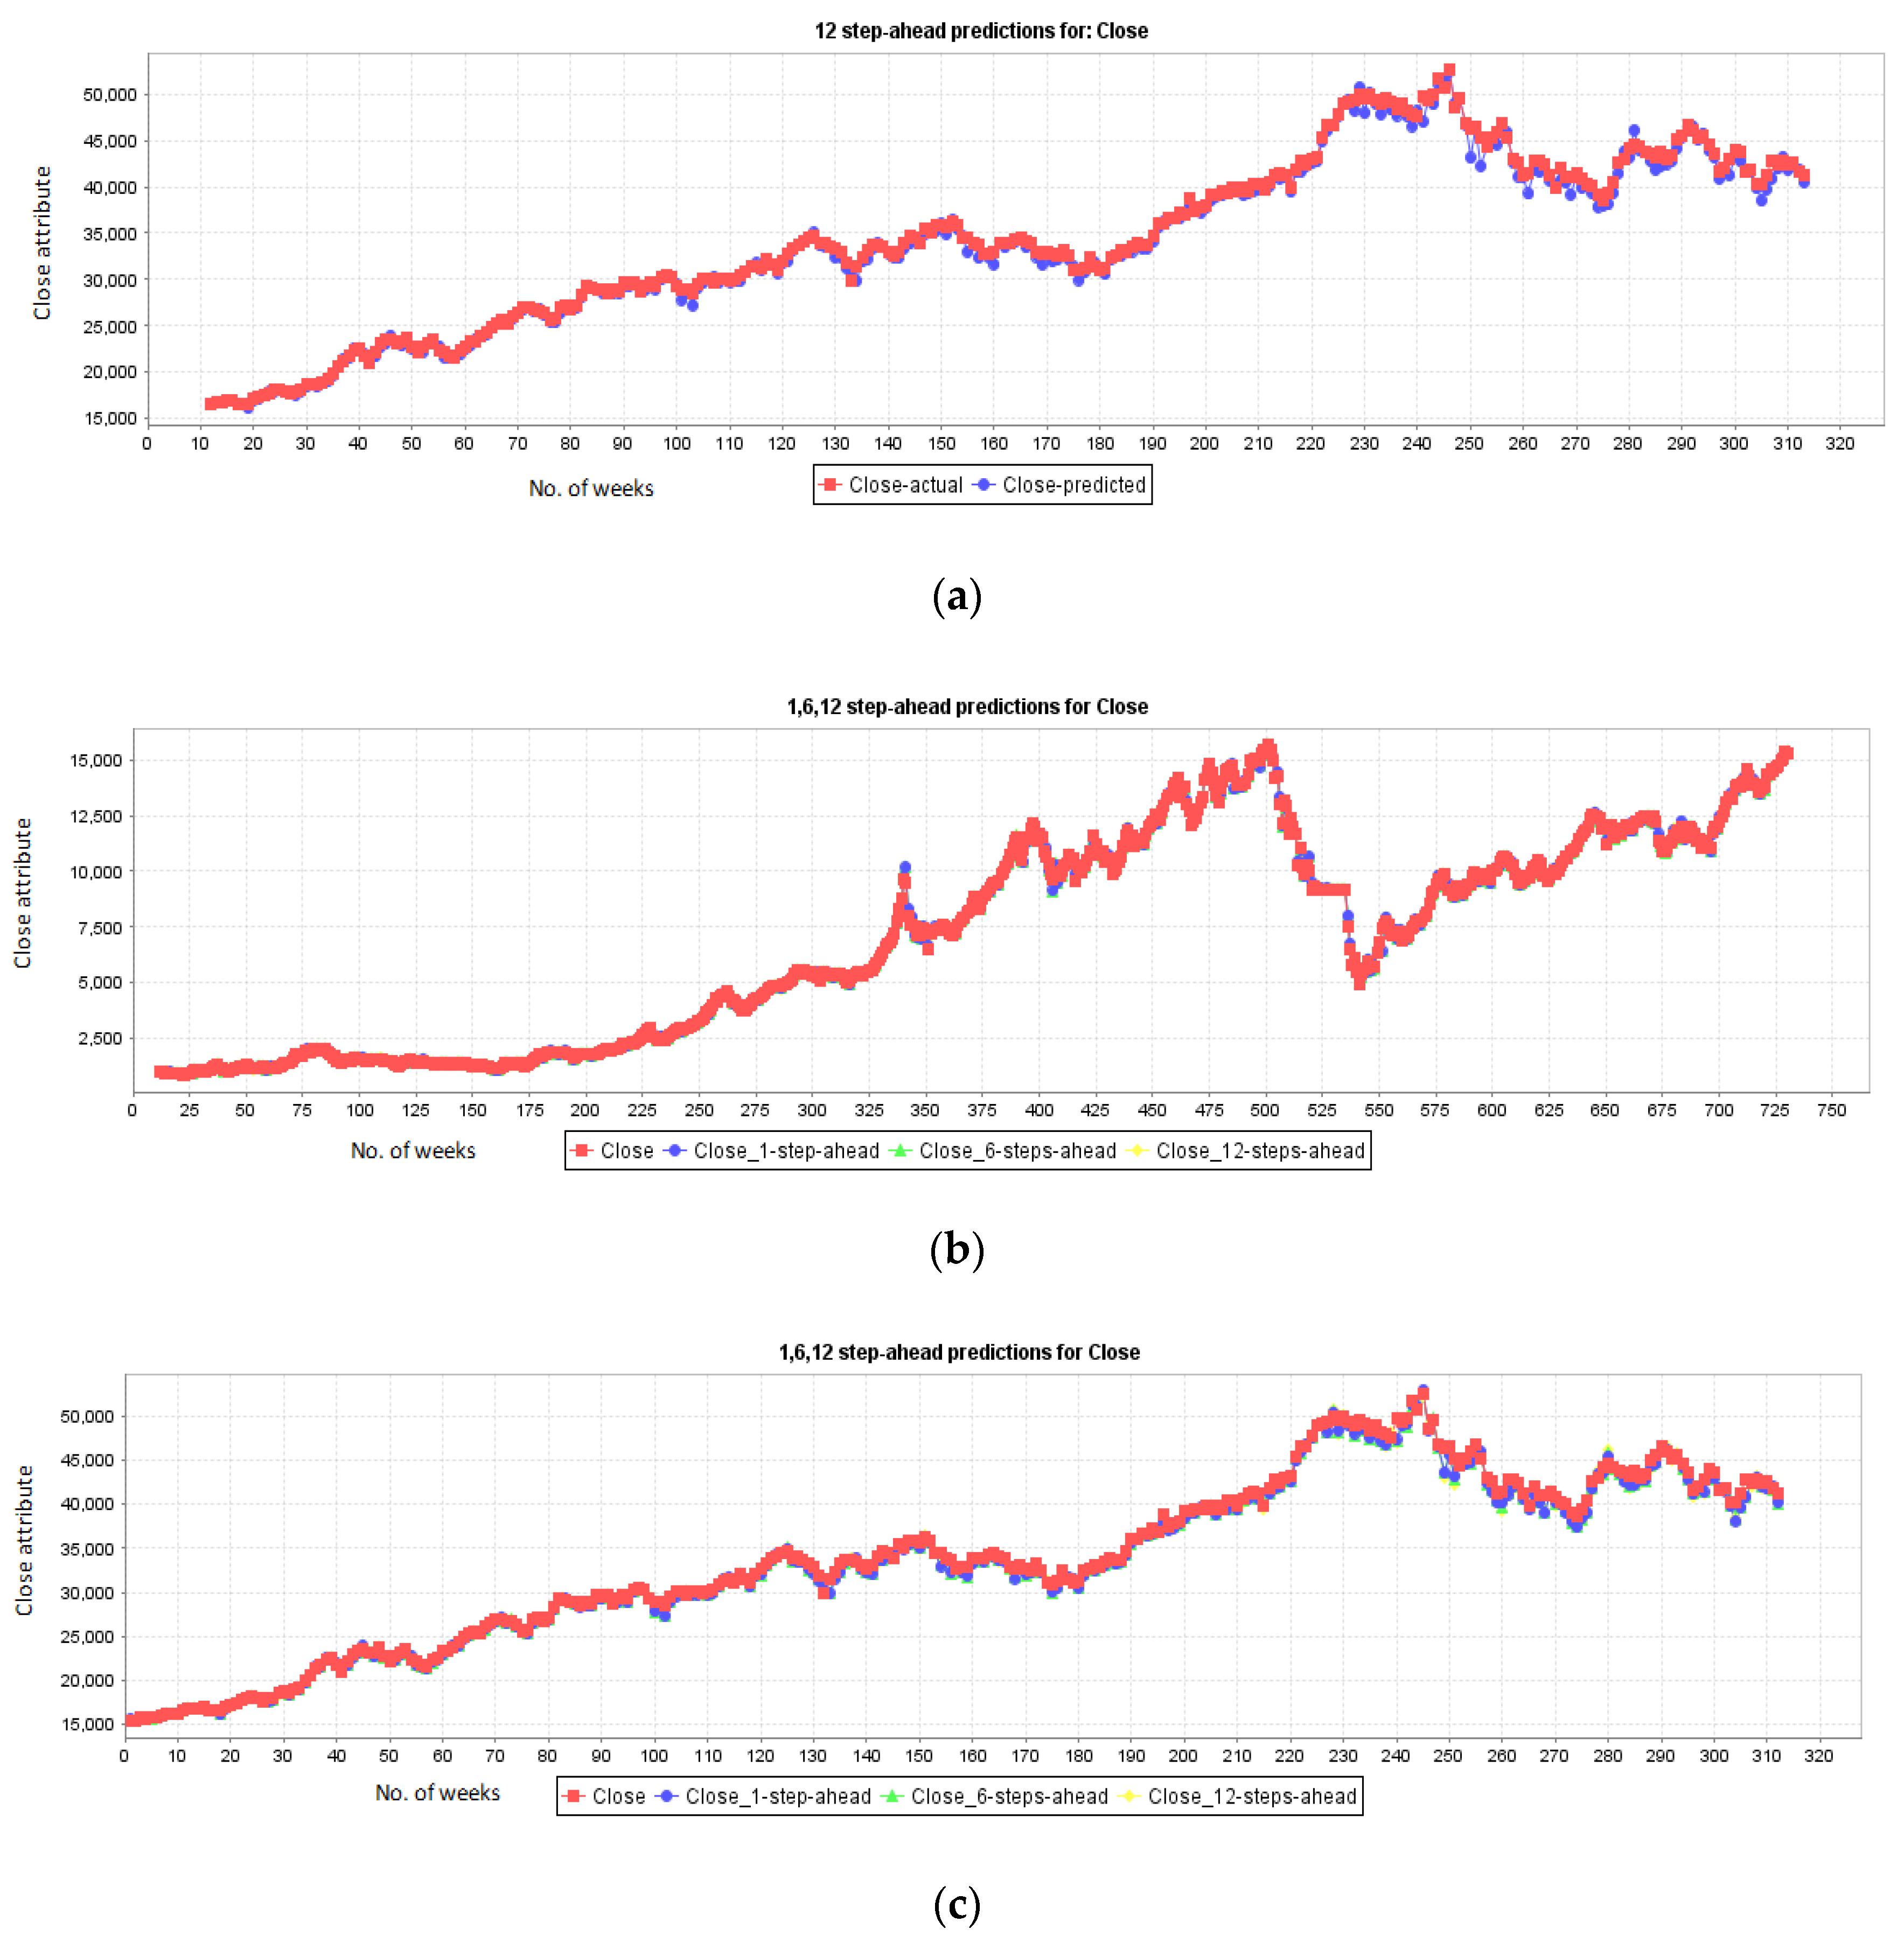
5.4. Results for Karachi Stock Exchange
5.5. Stock Prediction for Companies:
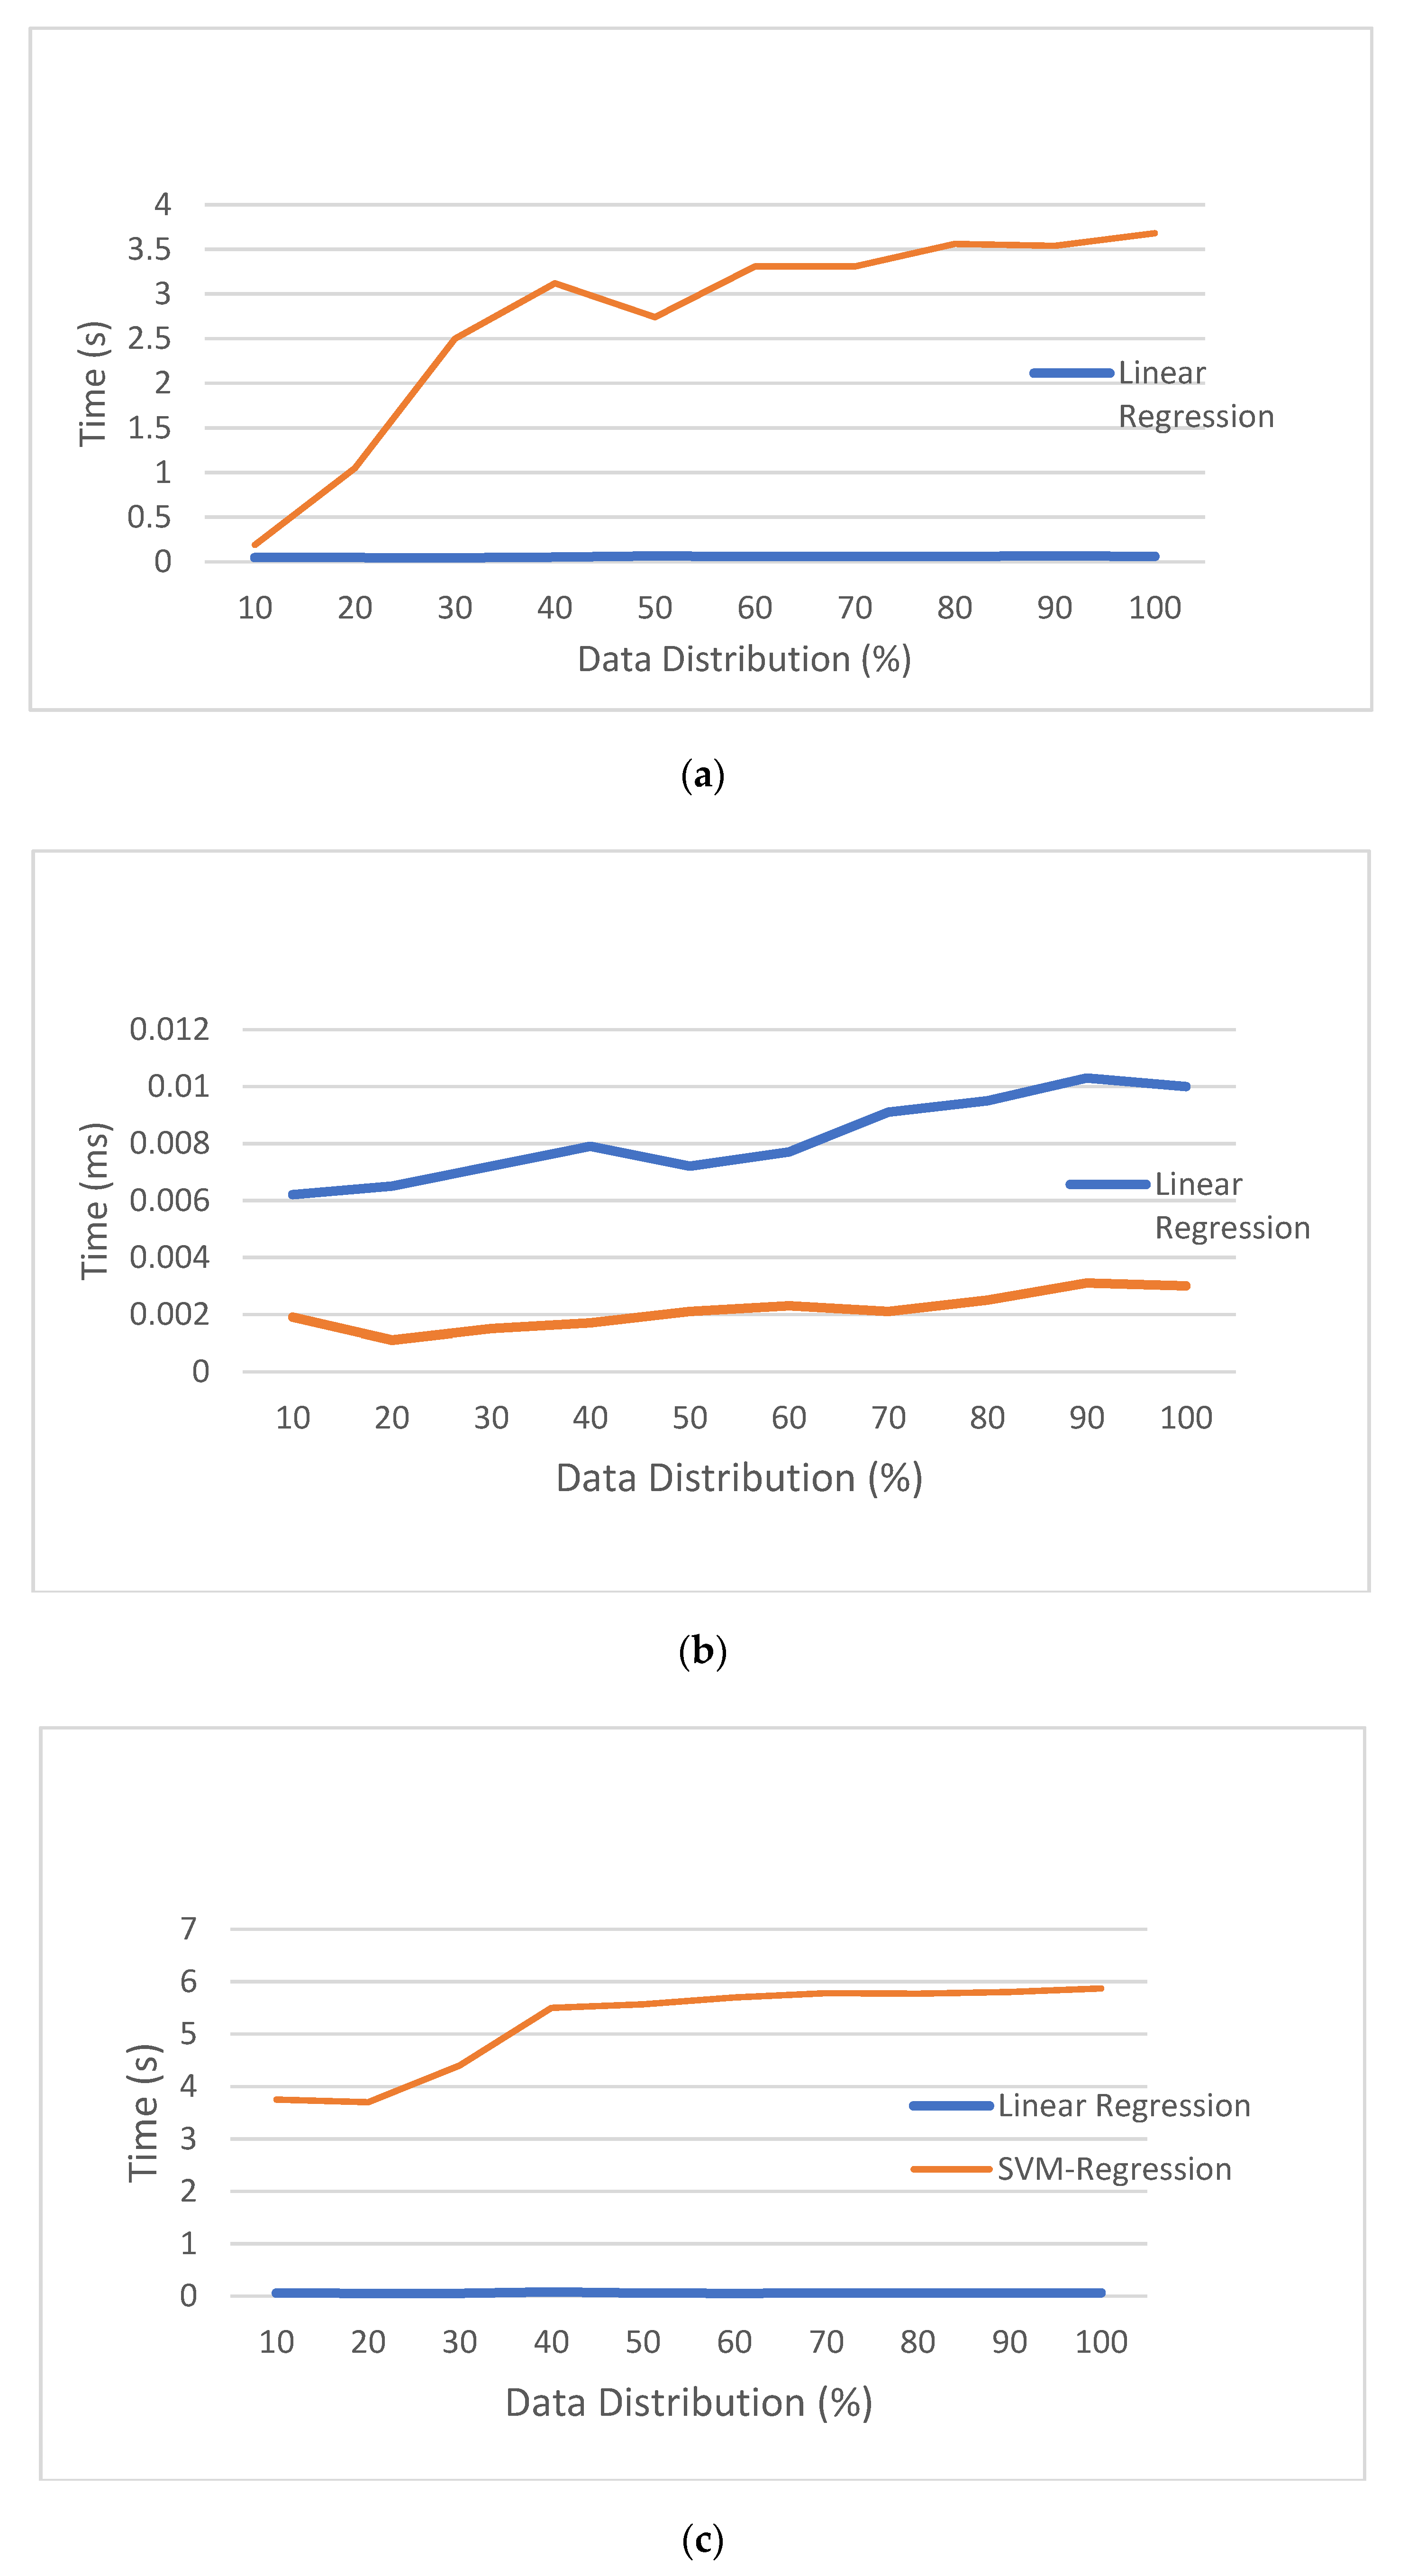
5.6. Robustness Analysis for the Proposed Method
6. Conclusions
Author Contributions
Funding
Acknowledgments
Conflicts of Interest
References
- Klein, M.D.; Datta, G.S. Statistical disclosure control via sufficiency under the multiple linear regression model. J. Stat. Theory Pract. 2018, 12, 100–110. [Google Scholar] [CrossRef]
- Guan, H.; Dai, Z.; Zhao, A.; He, J. A novel stock forecasting model based on high-order-fuzzy-fluctuation trends and back propagation neural network. PLoS ONE 2018, 13, e0192366. [Google Scholar] [CrossRef] [PubMed]
- Zhong, X.; Enke, D. Forecasting daily stock market return using dimensionality reduction. Expert Syst. Appl. 2017, 67, 126–139. [Google Scholar] [CrossRef]
- Gong, X.; Si, Y.-W.; Fong, S.; Biuk-Aghai, R.P. Financial time series pattern matching with extended UCR Suite and Support Vector Machine. Expert Syst. Appl. 2016, 55, 284–296. [Google Scholar] [CrossRef]
- Xi, Y.; Peng, H.; Qin, Y.; Xie, W.; Chen, X. Bayesian analysis of heavy-tailed market microstructure model and its application in stock markets. Math. Comput. Simul. 2015, 117, 141–153. [Google Scholar] [CrossRef]
- Rahman, H.F.; Sarker, R.; Essam, D. A genetic algorithm for permutation flow shop scheduling under make to stock production system. Comput. Ind. Eng. 2015, 90, 12–24. [Google Scholar] [CrossRef]
- Göçken, M.; Özçalıcı, M.; Boru, A.; Dosdoğru, A.T. Integrating metaheuristics and artificial neural networks for improved stock price prediction. Expert Syst. Appl. 2016, 44, 320–331. [Google Scholar] [CrossRef]
- Kodogiannis, V.; Lolis, A. Forecasting financial time series using neural network and fuzzy system-based techniques. Neural Comput. Appl. 2002, 11, 90–102. [Google Scholar] [CrossRef]
- Ravichandran, K.; Thirunavukarasu, P.; Nallaswamy, R.; Babu, R. Estimation of return on investment in share market through ANN. J. Theor. Appl. Inf. Technol. 2005, 3, 44–54. [Google Scholar]
- Xi, L.; Muzhou, H.; Lee, M.H.; Li, J.; Wei, D.; Hai, H.; Wu, Y. A new constructive neural network method for noise processing and its application on stock market prediction. Appl. Soft Comput. 2014, 15, 57–66. [Google Scholar] [CrossRef]
- Shen, W.; Zhang, Y.; Ma, X. Stock return forecast with LS-SVM and particle swarm optimization. In Proceedings of the International Conference on Business Intelligence and Financial Engineering (BIFE’09), Beijing, China, 24–26 July 2009; IEEE: Piscataway, NJ, USA, 2009. [Google Scholar]
- Wen, Q.; Yang, Z.; Song, Y.; Jia, P. Automatic stock decision support system based on box theory and SVM algorithm. Expert Syst. Appl. 2010, 37, 1015–1022. [Google Scholar] [CrossRef]
- Lin, Y.; Guo, H.; Hu, J. An SVM-based approach for stock market trend prediction. In Proceedings of the 2013 International Joint Conference on Neural Networks (IJCNN), Dallas, TX, USA, 4–9 August 2013; IEEE: Piscataway, NJ, USA, 2013. [Google Scholar]
- Yu, H.; Chen, R.; Zhang, G. A SVM stock selection model within PCA. Procedia Comput. Sci. 2014, 31, 406–412. [Google Scholar] [CrossRef]
- Wang, X.-Y.; Wang, Z.-O. Stock market time series data mining based on regularized neural network and rough set. In Proceedings of the 2002 International Conference on Machine Learning and Cybernetics, Beijing, China, 4–5 November 2002; IEEE: Piscataway, NJ, USA, 2002. [Google Scholar]
- Wang, Y.-F. Mining stock price using fuzzy rough set system. Expert Syst. Appl. 2003, 24, 13–23. [Google Scholar] [CrossRef]
- Nair, B.B.; Mohandas, V.; Sakthivel, N. A decision tree—Rough set hybrid system for stock market trend prediction. Int. J. Comput. Appl. 2010, 6, 1–6. [Google Scholar] [CrossRef]
- Ives, M.C.; Scandol, J.P. A Bayesian analysis of NSW eastern king prawn stocks (Melicertus plebejus) using multiple model structures. Fish. Res. 2007, 84, 314–327. [Google Scholar] [CrossRef][Green Version]
- Su, Z.; Peterman, R.M. Performance of a Bayesian state-space model of semelparous species for stock-recruitment data subject to measurement error. Ecol. Model. 2012, 224, 76–89. [Google Scholar] [CrossRef]
- Ticknor, J.L. A Bayesian regularized artificial neural network for stock market forecasting. Expert Syst. Appl. 2013, 40, 5501–5506. [Google Scholar] [CrossRef]
- Miao, J.; Wang, P.; Xu, Z. A Bayesian dynamic stochastic general equilibrium model of stock market bubbles and business cycles. Quant. Econ. 2015, 6, 599–635. [Google Scholar] [CrossRef]
- Wang, L.; Wang, Z.; Zhao, S.; Tan, S. Stock market trend prediction using dynamical Bayesian factor graph. Expert Syst. Appl. 2015, 42, 6267–6275. [Google Scholar] [CrossRef]
- Li, H.; Sun, J.; Sun, B.-L. Financial distress prediction based on OR-CBR in the principle of k-nearest neighbors. Expert Syst. Appl. 2009, 36, 643–659. [Google Scholar] [CrossRef]
- Teixeira, L.A.; De Oliveira, A.L.I. A method for automatic stock trading combining technical analysis and nearest neighbor classification. Expert Syst. Appl. 2010, 37, 6885–6890. [Google Scholar] [CrossRef]
- Fu-Yuan, H. Forecasting stock price using a genetic fuzzy neural network. In Proceedings of the International Conference on Computer Science and Information Technology (ICCSIT’08), Singapore, 12 September 2008; IEEE: Piscataway, NJ, USA, 2008. [Google Scholar]
- Sorensen, E.H.; Miller, K.L.; Ooi, C.K. The decision tree approach to stock selection. J. Portf. Manag. 2000, 27, 42–52. [Google Scholar] [CrossRef]
- Wu, M.-C.; Lin, S.-Y.; Lin, C.-H. An effective application of decision tree to stock trading. Expert Syst. Appl. 2006, 31, 270–274. [Google Scholar] [CrossRef]
- Hu, Y.; Feng, B.; Zhang, X.; Ngai, E.W.T.; Liu, M. Stock trading rule discovery with an evolutionary trend following model. Expert Syst. Appl. 2015, 42, 212–222. [Google Scholar] [CrossRef]
- Hassan, M.R.; Nath, B.; Kirley, M. A fusion model of HMM, ANN and GA for stock market forecasting. Expert Syst. Appl. 2007, 33, 171–180. [Google Scholar] [CrossRef]
- Huang, S.-C.; Wu, T.-K. Integrating GA-based time-scale feature extractions with SVMs for stock index forecasting. Expert Syst. Appl. 2008, 35, 2080–2088. [Google Scholar] [CrossRef]
- Cervelló-Royo, R.; Guijarro, F.; Michniuk, K. Stock market trading rule based on pattern recognition and technical analysis: Forecasting the DJIA index with intraday data. Expert Syst. Appl. 2015, 42, 5963–5975. [Google Scholar] [CrossRef]
- Kim, Y.; Enke, D. Developing a rule change trading system for the futures market using rough set analysis. Expert Syst. Appl. 2016, 59, 165–173. [Google Scholar] [CrossRef]
- Podsiadlo, M.; Rybinski, H. Financial time series forecasting using rough sets with time-weighted rule voting. Expert Syst. Appl. 2016, 66, 219–233. [Google Scholar] [CrossRef]
- Chiang, W.-C.; Enke, D.; Wu, T.; Wang, R. An adaptive stock index trading decision support system. Expert Syst. Appl. 2016, 59, 195–207. [Google Scholar] [CrossRef]
- Majhi, R.; Panda, G.; Sahoo, G. Development and performance evaluation of FLANN based model for forecasting of stock markets. Expert Syst. Appl. 2009, 36, 6800–6808. [Google Scholar] [CrossRef]
- Chakravarty, S.; Dash, P.K. A PSO based integrated functional link net and interval type-2 fuzzy logic system for predicting stock market indices. Appl. Soft Comput. 2012, 12, 931–941. [Google Scholar] [CrossRef]
- Dash, R.; Dash, P.K.; Bisoi, R. A self-adaptive differential harmony search based optimized extreme learning machine for financial time series prediction. Swarm Evol. Comput. 2014, 19, 25–42. [Google Scholar] [CrossRef]
- Huang, C.-F. A hybrid stock selection model using genetic algorithms and support vector regression. Appl. Soft Comput. 2012, 12, 807–818. [Google Scholar] [CrossRef]
- Wang, D.; Liu, X.; Wang, M. A DT-SVM strategy for stock futures prediction with big data. In Proceedings of the 2013 IEEE 16th International Conference on Computational Science and Engineering (CSE), Sidney, Australia, 3–5 December 2013; IEEE: Piscataway, NJ, USA, 2013. [Google Scholar]
- Nayak, R.K.; Mishra, D.; Rath, A.K. A Naïve SVM-KNN based stock market trend reversal analysis for Indian benchmark indices. Appl. Soft Comput. 2015, 35, 670–680. [Google Scholar] [CrossRef]
- Nunno, L. Stock Market Price Prediction Using Linear and Polynomial Regression Models; Computer Science Department, University of New Mexico: Albuquerque, NM, USA, 2014. [Google Scholar]
- Muhammad, K.; Ahmad, J.; Mehmood, I.; Rho, S.; Baik, S.W. Convolutional neural networks based fire detection in surveillance videos. IEEE Access 2018, 6, 18174–18183. [Google Scholar] [CrossRef]
- Mehmood, I.; Sajjad, M.; Muhammad, K.; Shah, S.I.S.; Sangaiah, A.K.; Shoaib, M.; Baik, S.W. An efficient computerized decision support system for the analysis and 3D visualization of brain tumor. Multimedia Tools Appl. 2018, 1–26. [Google Scholar] [CrossRef]
- Ateeq, T.; Majeed, M.N.; Anwar, S.M.; Maqsood, M.; Rehman, Z.; Lee, J.W.; Muhammad, K.; Wang, S.; Baik, S.W.; Mehmood, I. Ensemble-classifiers-assisted detection of cerebral microbleeds in brain MRI. Comput. Electr. Eng. 2018, 69, 768–781. [Google Scholar] [CrossRef]
- Aadil, F.; Raza, A.; Khan, M.F.; Maqsood, M.; Mehmood, I.; Rho, S. Energy aware cluster-based routing in flying ad-hoc networks. Sensors 2018, 18, 1413. [Google Scholar] [CrossRef] [PubMed]
- Muhammad, K.; Sajjad, M.; Mehmood, I.; Rho, S.; Baik, S. A novel magic LSB substitution method (M-LSB-SM) using multi-level encryption and achromatic component of an image. Multimedia Tools Appl. 2016, 75, 14867–14893. [Google Scholar] [CrossRef]
- Muhammad, K.; Hussain, T.; Baik, S.W. Efficient CNN based summarization of surveillance videos for resource-constrained devices. Pattern Recognit. Lett. 2018. [Google Scholar] [CrossRef]
- Khan, S.; Khan, A.; Maqsood, M.; Aadil, F.; Ghazanfar, M.A. Optimized gabor feature extraction for mass classification using cuckoo search for big data e-healthcare. J. Grid Comput. 2018. [Google Scholar] [CrossRef]
- Willmott, C.J.; Matsuura, K. Advantages of the mean absolute error (MAE) over the root mean square error (RMSE) in assessing average model performance. Clim. Res. 2005, 30, 79–82. [Google Scholar] [CrossRef]


| Feature | Description |
|---|---|
| Date | Corresponding Date for stock values |
| Open | Opening price of a stock on a particular day |
| High | Highest selling stock value for a day |
| Low | The lowest value of the selling price of a stock on a given day |
| Close | Contains closing value of a stock on a given day |
| Volume | The number of shares traded or bought on a given day |
| Adjusting Close | The closing price of a stock after paying dividends to the investors |
| Name | Historical Data | |
|---|---|---|
| From | To | |
| NASDAQ stock exchange | 7 October 1998 | 7 October 2018 |
| New York stock exchange | 7 October 1998 | 7 October 2018 |
| London stock exchange | 7 October 1998 | 7 October 2018 |
| Karachi stock exchange | 7 October 1998 | 7 October 2018 |
| Companies data | ||
| Microsoft | 7 October 1998 | 7 October 2018 |
| Apple | 7 October 1998 | 7 October 2018 |
| 7 October 2004 | 7 October 2018 (max available data) | |
| Company/Stock Market | p-Value of Stock Data (%) | p-Value of First Difference of Stock Data (%) |
|---|---|---|
| MSFT | 99.9 | 0.01 |
| APPLE | 99.3 | 0.01 |
| LSE | 99.9 | 0.01 |
| NASDAQ, | 99.9 | 0.01 |
| 99.9 | 0.01 | |
| KSE | 99.9 | 0.01 |
| NYSE | 99.9 | 0.01 |
| 1 Step | 2 Step | 3 Step | 4 Step | 5 Step | 6 Step | 7 Step | 8 Step | 9 Step | 10 Step | 11 Step | 12 Step | |
|---|---|---|---|---|---|---|---|---|---|---|---|---|
| 3.2 | 3.3 | 3.3 | 3.3 | 3.3 | 3.3 | 3.3 | 3.3 | 3.4 | 3.4 | 3.4 | 3.4 | |
| MSFT | 0.38 | 0.38 | 0.38 | 0.38 | 0.38 | 0.38 | 0.38 | 0.37 | 0.37 | 0.37 | 0.37 | 0.37 |
| APP | 0.23 | 0.24 | 0.24 | 0.24 | 0.24 | 0.24 | 0.24 | 0.24 | 0.24 | 0.24 | 0.24 | 0.24 |
| KSE | 63.5 | 64.3 | 64.5 | 64.5 | 65.0 | 65.1 | 65.1 | 65.3 | 65.3 | 65.7 | 65.7 | 65.7 |
| NSDQ | 26.6 | 26.4 | 26.5 | 26.4 | 26.5 | 26.7 | 26.8 | 26.8 | 26.9 | 26.8 | 26.9 | 26.9 |
| NY | 54.1 | 54.1 | 54.2 | 54.2 | 54.2 | 54.3 | 54.5 | 54.3 | 54.3 | 54.3 | 54.3 | 54.5 |
| LSE | 14.1 | 14.2 | 14.6 | 14.6 | 14.7 | 14.6 | 14.7 | 14.6 | 14.6 | 14.5 | 14.6 | 14.7 |
| 1 Step | 2 Step | 3 Step | 4 Step | 5 Step | 6 Step | 7 Step | 8 Step | 9 Step | 10 Step | 11 Step | 12 Step | |
|---|---|---|---|---|---|---|---|---|---|---|---|---|
| 4.4 | 4.6 | 4.6 | 4.6 | 4.6 | 4.7 | 4.7 | 4.7 | 4.7 | 4.7 | 4.7 | 4.7 | |
| MSFT | 0.5 | 0.5 | 0.5 | 0.5 | 0.5 | 0.5 | 0.5 | 0.5 | 0.3 | 0.5 | 0.5 | 0.5 |
| APP | 0.41 | 0.42 | 0.42 | 0.42 | 0.42 | 0.42 | 0.42 | 0.42 | 0.43 | 0.43 | 0.43 | 0.43 |
| KSE | 109.3 | 110.6 | 110.6 | 110.9 | 111.1 | 111.2 | 111.4 | 111.5 | 111.7 | 111.7 | 111.8 | 111.8 |
| NSDQ | 40.6 | 40.5 | 40.4 | 40.5 | 40.5 | 40.9 | 41.2 | 41.2 | 41.4 | 41.4 | 41.4 | 41.5 |
| NY | 75.9 | 75.9 | 75.8 | 75.9 | 76 | 76.1 | 76.1 | 75.9 | 75.9 | 76 | 76 | 76 |
| LSE | 20.1 | 20.5 | 20.8 | 20.7 | 20.1 | 20.9 | 20.9 | 20.5 | 20.5 | 20.4 | 20.5 | 20.7 |
| SR # | Stock Market Pair | Correlation |
|---|---|---|
| 1 | KSE, NASDAQ | −0.02 |
| 2 | KSE, NY | −0.019 |
| 3 | KSE, LSE | −0.025 |
| 4 | NASDAQ, LSE | 0.57 |
| 5 | NY, LSE | 0.522 |
| 6 | NY, NASDAQ | 0.829 |
© 2018 by the authors. Licensee MDPI, Basel, Switzerland. This article is an open access article distributed under the terms and conditions of the Creative Commons Attribution (CC BY) license (http://creativecommons.org/licenses/by/4.0/).
Share and Cite
Khan, U.; Aadil, F.; Ghazanfar, M.A.; Khan, S.; Metawa, N.; Muhammad, K.; Mehmood, I.; Nam, Y. A Robust Regression-Based Stock Exchange Forecasting and Determination of Correlation between Stock Markets. Sustainability 2018, 10, 3702. https://doi.org/10.3390/su10103702
Khan U, Aadil F, Ghazanfar MA, Khan S, Metawa N, Muhammad K, Mehmood I, Nam Y. A Robust Regression-Based Stock Exchange Forecasting and Determination of Correlation between Stock Markets. Sustainability. 2018; 10(10):3702. https://doi.org/10.3390/su10103702
Chicago/Turabian StyleKhan, Umair, Farhan Aadil, Mustansar Ali Ghazanfar, Salabat Khan, Noura Metawa, Khan Muhammad, Irfan Mehmood, and Yunyoung Nam. 2018. "A Robust Regression-Based Stock Exchange Forecasting and Determination of Correlation between Stock Markets" Sustainability 10, no. 10: 3702. https://doi.org/10.3390/su10103702
APA StyleKhan, U., Aadil, F., Ghazanfar, M. A., Khan, S., Metawa, N., Muhammad, K., Mehmood, I., & Nam, Y. (2018). A Robust Regression-Based Stock Exchange Forecasting and Determination of Correlation between Stock Markets. Sustainability, 10(10), 3702. https://doi.org/10.3390/su10103702