1. Introduction
Protected Areas (PAs) have long been considered a powerful tool for habitat and biodiversity conservation [
1,
2]. To date, nearly 15% of the terrestrial surface on Earth has been designated as PAs [
3]. It is important to determine whether PAs have effectively protected biodiversity and the extent to which these areas have promoted biodiversity conservation. The results of these evaluations can help government departments formulate biodiversity conservation policies and implement of specific plans. However, there are still some shortcomings in the assessment of the effectiveness of PAs on biodiversity conservation [
4].
Evaluation of the effectiveness of PAs is mainly achieved by comparison [
5,
6]. One evaluation method involves comparison before and after the establishment of PAs. For example, Liu, et al. [
7] assessed the rates of changes in patch numbers and other landscape indexes before and after the establishment of the Wolong Nature Reserve. Gaveau, et al. [
8] compared the rates of forest loss before and after the Bukit Barisan Selatan National Park was declared as a national park, and they found that this Park had a beneficial effect regarding protecting forest diversity. Another evaluation method involves comparison between areas inside and outside of PAs. For example, Gray, et al. [
9] compared species richness and other biodiversity measures inside and outside PAs on a global scale and found that more than half of the PAs had been effectively protected. Based on remote sensing data from 1990–2010, Gaveau, et al. [
10] found that deforestation rates inside in PAs in Sumatra were slower than those outside the PAs, indicating that the Sumatran PAs were well protected. In General, assessment of the conservation effectiveness of PAs is achieved by comparing a single PA. Different from these studies, Zheng, et al. [
11] conducted a comparative assessment of biodiversity conservation effectiveness between several wetland nature reserves at a national scale. These authors constructed a graded evaluation system for conservation effectiveness based on a conservation value index (the index was integrated from the keystone species number, endangered species number and rare species number) and then divided the conservation effectiveness levels of wetland nature reserves in China into three grades (i.e., excellent, medium and poor).
Yang, et al. [
12] challenged the scientific nature of this method and indicated that a conservation value index can reflect only the conservation capacity of each wetland nature reserve and cannot illustrate the conservation effectiveness of the measures taken. Here, conservation capacity refers to the species richness supported by a specific PA and conservation effectiveness embodies the change in the species richness of a PA under certain conservation measures such as habitat maintenance and improvement. For example, the conservation value index (a quantitative measure of conservation capacity) of the Sanjiangyuan Nature Reserve was low because of its low conservation capacity, and it was given a poor conservation effectiveness grade (i.e., excellent, medium and poor). Therefore, the result of this evaluation is not logical and cannot be applied in practice. Moreover, because of the vast geographical gaps that exist between wetlands at the national scale, the biodiversity conservation effectiveness cannot be directly assessed by combining these areas [
12]. In fact, there are also differences in environmental factors when assessing the conservation effectiveness of single PAs [
13]. Studies have proposed a matching analysis to eliminate environmental factor differences between inside and outside PAs [
14,
15,
16]. However, this method cannot be applied when evaluating conservation effectiveness between several PAs at a large scale. Therefore, it is imperative to develop a method that can be used for comparative evaluations between different PAs.
Biodiversity Ecological Function Zones (BEFZs) are types of PAs that were designated by the Ministry of Ecology and Environment of China in 2005 for the implementation of biodiversity conservation [
17]. The ministry measures the performance of local government departments by quantitatively assessing the conservation effectiveness of BEFZs and then adopts appropriate policy and funding investments according to the results. Therefore, an assessment method for comparison among different BEFZs is important to the ministry.
Due to difficulties related to regional comparisons of assessments of the biodiversity conservation effectiveness, this paper constructed an index that can be used to compare the biodiversity conservation effectiveness between regions based on a reference condition index. The index was then applied to three BEFZs in China. The specific objectives of this paper were to (1) construct a reference condition that can represent the difference of conservation capacity among different BEFZs and (2) develop an indicator for biodiversity conservation effectiveness based on the reference condition. Then a method was formed that can be used to compare biodiversity conservation effectiveness based on the indicator.
2. Materials and Methods
2.1. Study Area
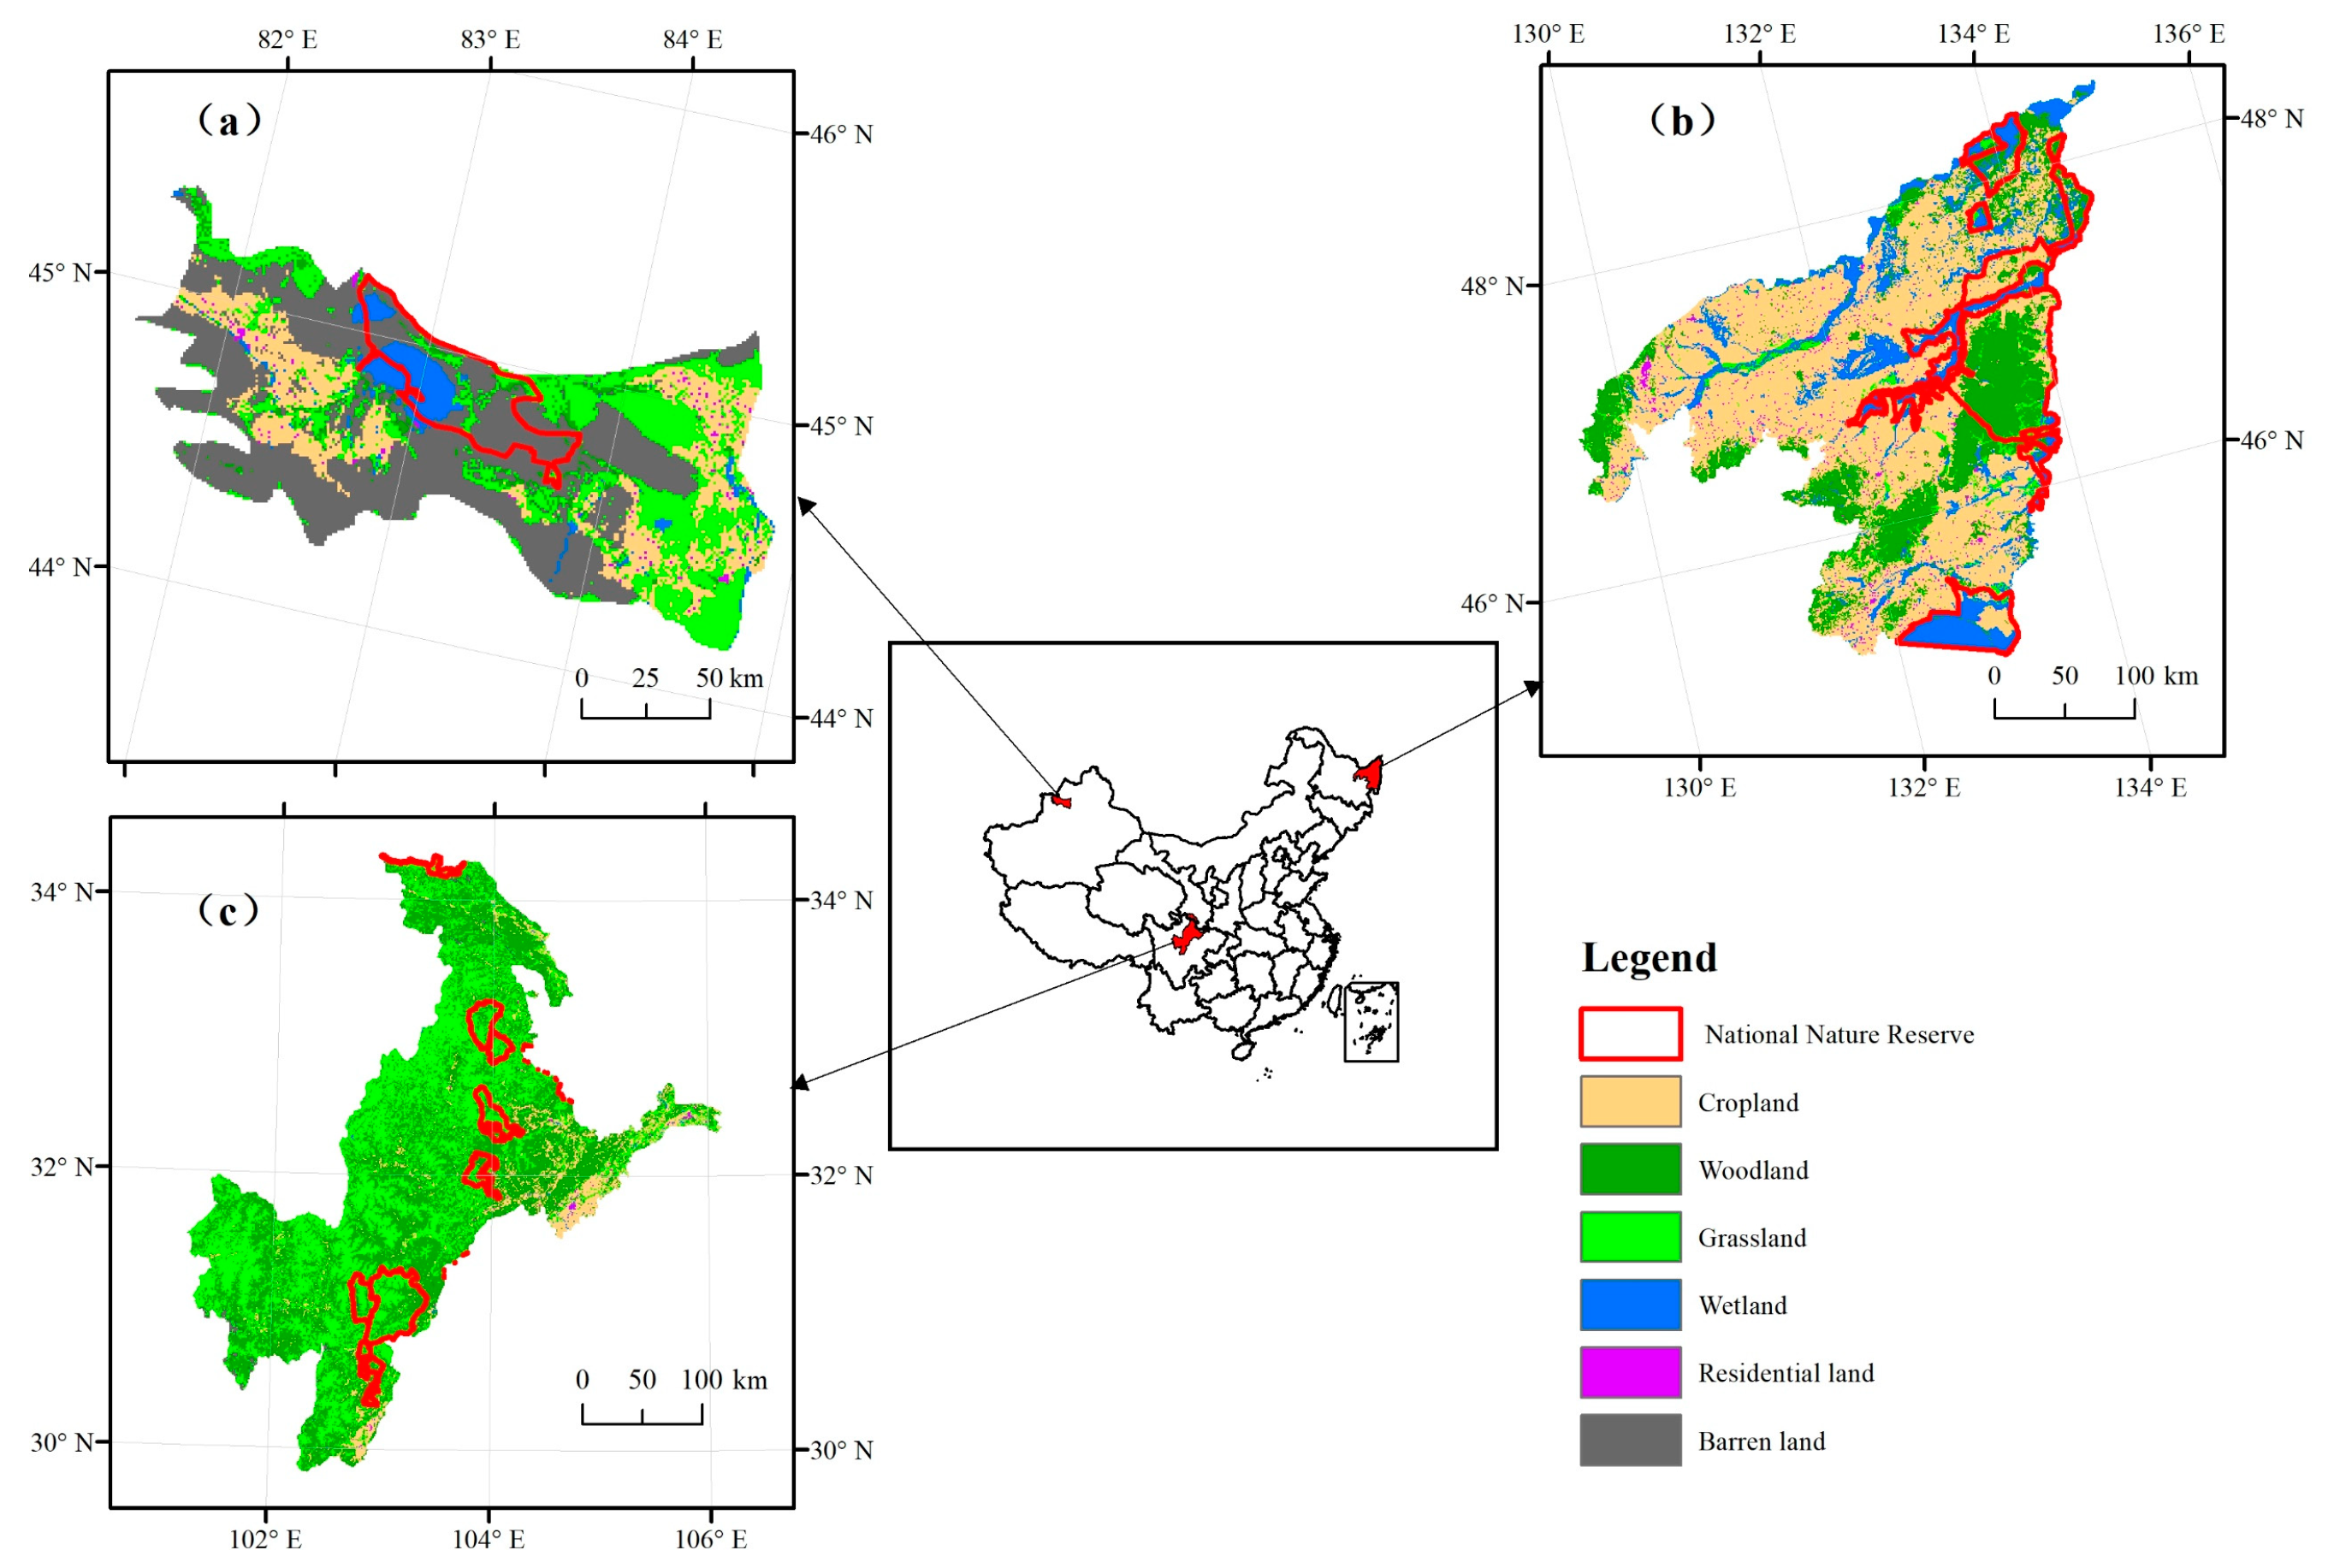
The West Part of the Yili-Tianshan Mountain BEFZ (YTZ) is located in the west part of Xinjiang Uygur Autonomous Region, ranging from 44°10′47″–45°22′ in latitude and 81°31′41″–84°52′25″ in longitude. The total area of the YTZ is 20,058 km2, covering three counties of Xinjiang Uygur Autonomous Region. The YTZ has a temperate continental semiarid climate with mean annual precipitation of 284–468 mm and a mean temperature of 9.4 °C. The main soil types are sierozem and aeolian sandy soil. There is a national nature reserve (Ebinur Lake) in this area. The biodiversity resources are abundant, mainly including Black bee, Testudohorsfieldi, Fraxinussogdiana Bunge, Juglanscathayensis, Piceaschrenkiana and other species and mountain meadow grassland ecosystems.
The San Jiang Plain Wetland BEFZ (SJZ) is located in the northeastern part of Heilongjiang Province, ranging from 45°0′57″–48°27′47″ in latitude and 129°29′52″–135°5′12″ in longitude. The total area of this region is 71,703 km
2, covering 14 counties of Heilongjiang Province. This area has a humid and semi-humid temperate continental climate, with mean annual precipitation of 500–650 mm and a mean annual temperature of 1.4–4.3 °C [
18]. The main soil types are Luvisols, Phaeozems, Cambisols, and Histosols. There are ten national reserves in this area: Sanjiang, Sanhuanpao, Dongfenghong, Bachadao, Xingkaihu, Baoqingqixinghe, Raolihe, Honghe, Zhenbaodao and Raohedongbeihei National Nature Reserves. More than 150 species of birds inhabit this area, including eight national first-class protected animals, such as
Grusjaponensis and
Coniaciconia.
The Minshan-Qionglai Mountain BEFZ (MQZ) is located in the Minshan and Qionglai Mountains, which are situated in the northwestern region of Sichuan Province. The MQZ ranges from 29°49′23″–34°19′19″ in latitude and 101°12′57″ in longitude. The area covers 16 counties of Sichuan Province and 2 counties of Gansu Province, with a total area of 73,113 km2. The MQZ belongs to the transition zone between the mid-subtropical monsoon climate and the continental plateau climate. Twelve national reserves are distributed in this area: The Jiuzhangou, Wolong, Tangjiahe, Xiaozhaizigou, Xiaojinsigu, Taohe, Wanglang, Baishuijiang, Baishuihe, Fengtongzhai, Xuebaoding, and Longxiyihong National Nature Reserves. There are abundant natural forests and wildlife resources in the area, which includes Ailuropodamelanoleuca, Budorcastaxicolor and Rhinopithecusroxellana habitat.
2.2. Data Sources
In this research, land use data were obtained from the China National Land Cover Database [
19]. This database is supported by the Science and Technology Support Program of China and the Innovative Program of the Chinese Academy of Science. The database was generated by artificial visual interpretation of multisource and multi seasonal Landsat TM/ETM satellite images from 1990, 1995, 2000, 2005 and 2010. The land use data are classified into 6 categories, with the first category including cropland, forestland, grassland, water, residential land and barren land; there are 25 land use types in the second category. After classification, the data were resampled to raster data with a spatial resolution of 1 km. Land use data of the three BEFZs from 1990–2010 was extracted using the corresponding boundaries. Since wetlands are not included in this database, water and marshes was clumped into wetland. The boundaries of the three BEFZs, the boundaries of the national nature reserves and the county administrative divisions were all downloaded from the Resource and Environment Data Cloud Platform [
19].
2.3. Methods
There are three aspects in this section. Firstly, habitat quality was used as a proxy for quantifying biodiversity. Secondly, a reference condition which can represent the difference of conservation capacity among different BEFZs was constructed. Thirdly, an indicator for biodiversity conservation effectiveness based on the reference condition was developed. Based on the indicator, temporal and spatial comparison of biodiversity conservation effectiveness was performed.
2.3.1. Habitat Quality
Stable habitat quality is an important basis for maintaining ecosystem biodiversity [
20]. Areas with high habitat quality are better able to support all levels of biodiversity, and decreases in habitat quality could lead to a continuous decline in biodiversity. Therefore, habitat quality is a reflection of conservation capacity, which is defined as the species richness supported by a specific PA. Terrado, et al. [
21] compared the habitat quality computed by the habitat quality module in the Integrated Valuation of Ecosystem Services and Tradeoffs (InVEST) model with the results of biodiversity observations and found a significant correlation (R
2 = 0.76) between the two measures. Therefore, InVEST model was employed to compute habitat quality, which was used as a proxy for biodiversity in this study [
22,
23,
24,
25].
The InVEST model is a comprehensive model used to evaluate ecosystem services and transactions and is an assessment tool that was jointly developed by Stanford University, The Nature Conservancy (TNC) and World Wildlife Foundation (WWF). The habitat quality in the InVEST model is reflected by the space occupied by species that can supply resources and breeding conditions for them. Habitat quality is determined by four factors: (1) the weights of the different sources of threat; (2) the relative sensitivity of each habitat to each source of threat; (3) the distance between the habitat and the source of threat; (4) the extent to which the land is legally protected. Cropland, residential land and other construction land were considered as threat factors in the three BEFZs. The specific formula for habitat quality is as follows:
where
Qxj is the quality of habitat in the grid cell
x;
Hj is the habitat suitability of land use type
j;
Dxj is the threat level in grid cell
x of land use type
j;
z (
z = 2.5) and
k are scaling parameters, and half saturation constant is 0.5.
Dxj is computed as follows:
where
wr indicates the relative negative impact of a threat;
R indexes all modeled degradation sources, and
y indexes all grid cells on
r’s raster map;
Yr indicates the set of grid cells on
r’s raster map; the impact of threat r that originates in grid cell
y,
ry, on habitat in grid cell
x is given by
irxy;
βx indicate the level of accessibility in grid cell
x, where 1 indicates complete accessibility;
Sjr indicates the sensitivity of land class (i.e., habitat type)
j to threat
r, where values closer to 1 indicate greater sensitivity.
irxy is computed as follows:
where
dxy is the linear distance between grid cell
x and grid cell
y,
drmax is the maximum effective distance of the threat factor.
As the geographic locations of the three BEFZs and the species biodiversity to be protected differ, each BEFZ should better be parameterized individually. According to the principle of the similarity of environment and conservation objects, for YTZ, SJZ and MQZ, Parameters employed in previous reports [
26,
27,
28] were chosen. When the method is applied in a different region or country in which the model cannot be easily parameterized individually, the parameters in different regions can be set to the same values without decreasing the utility of the method.
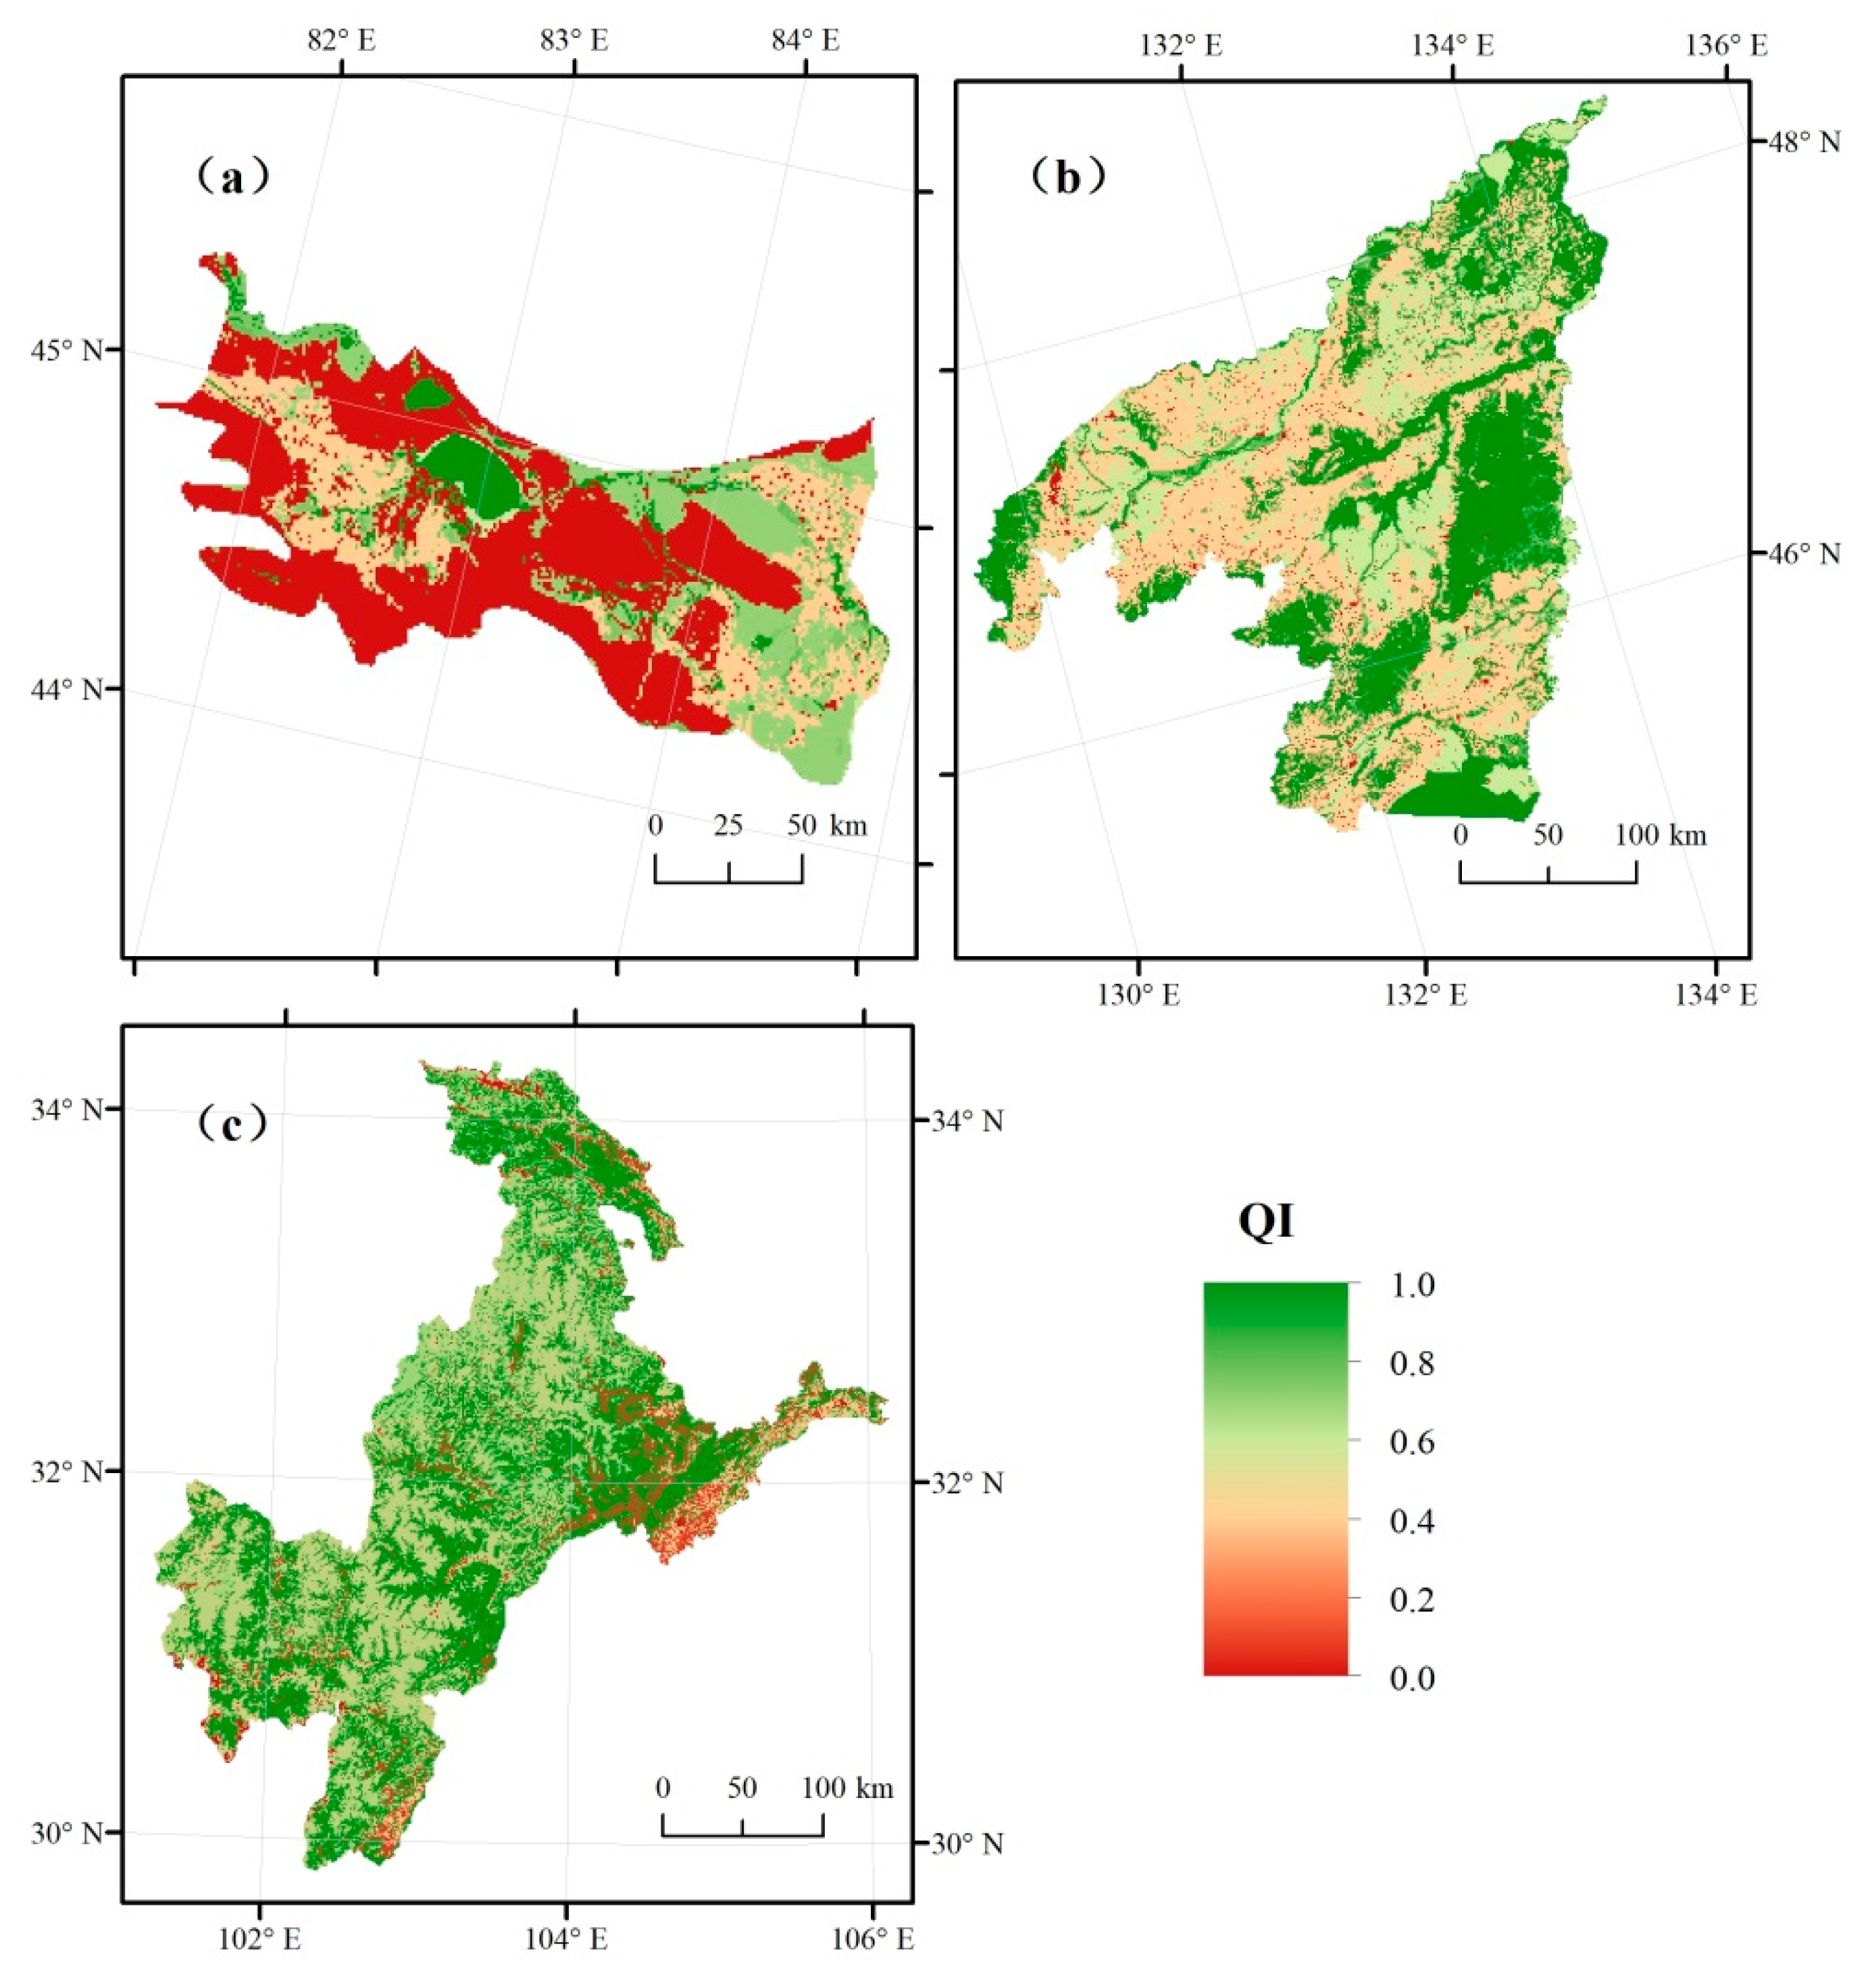
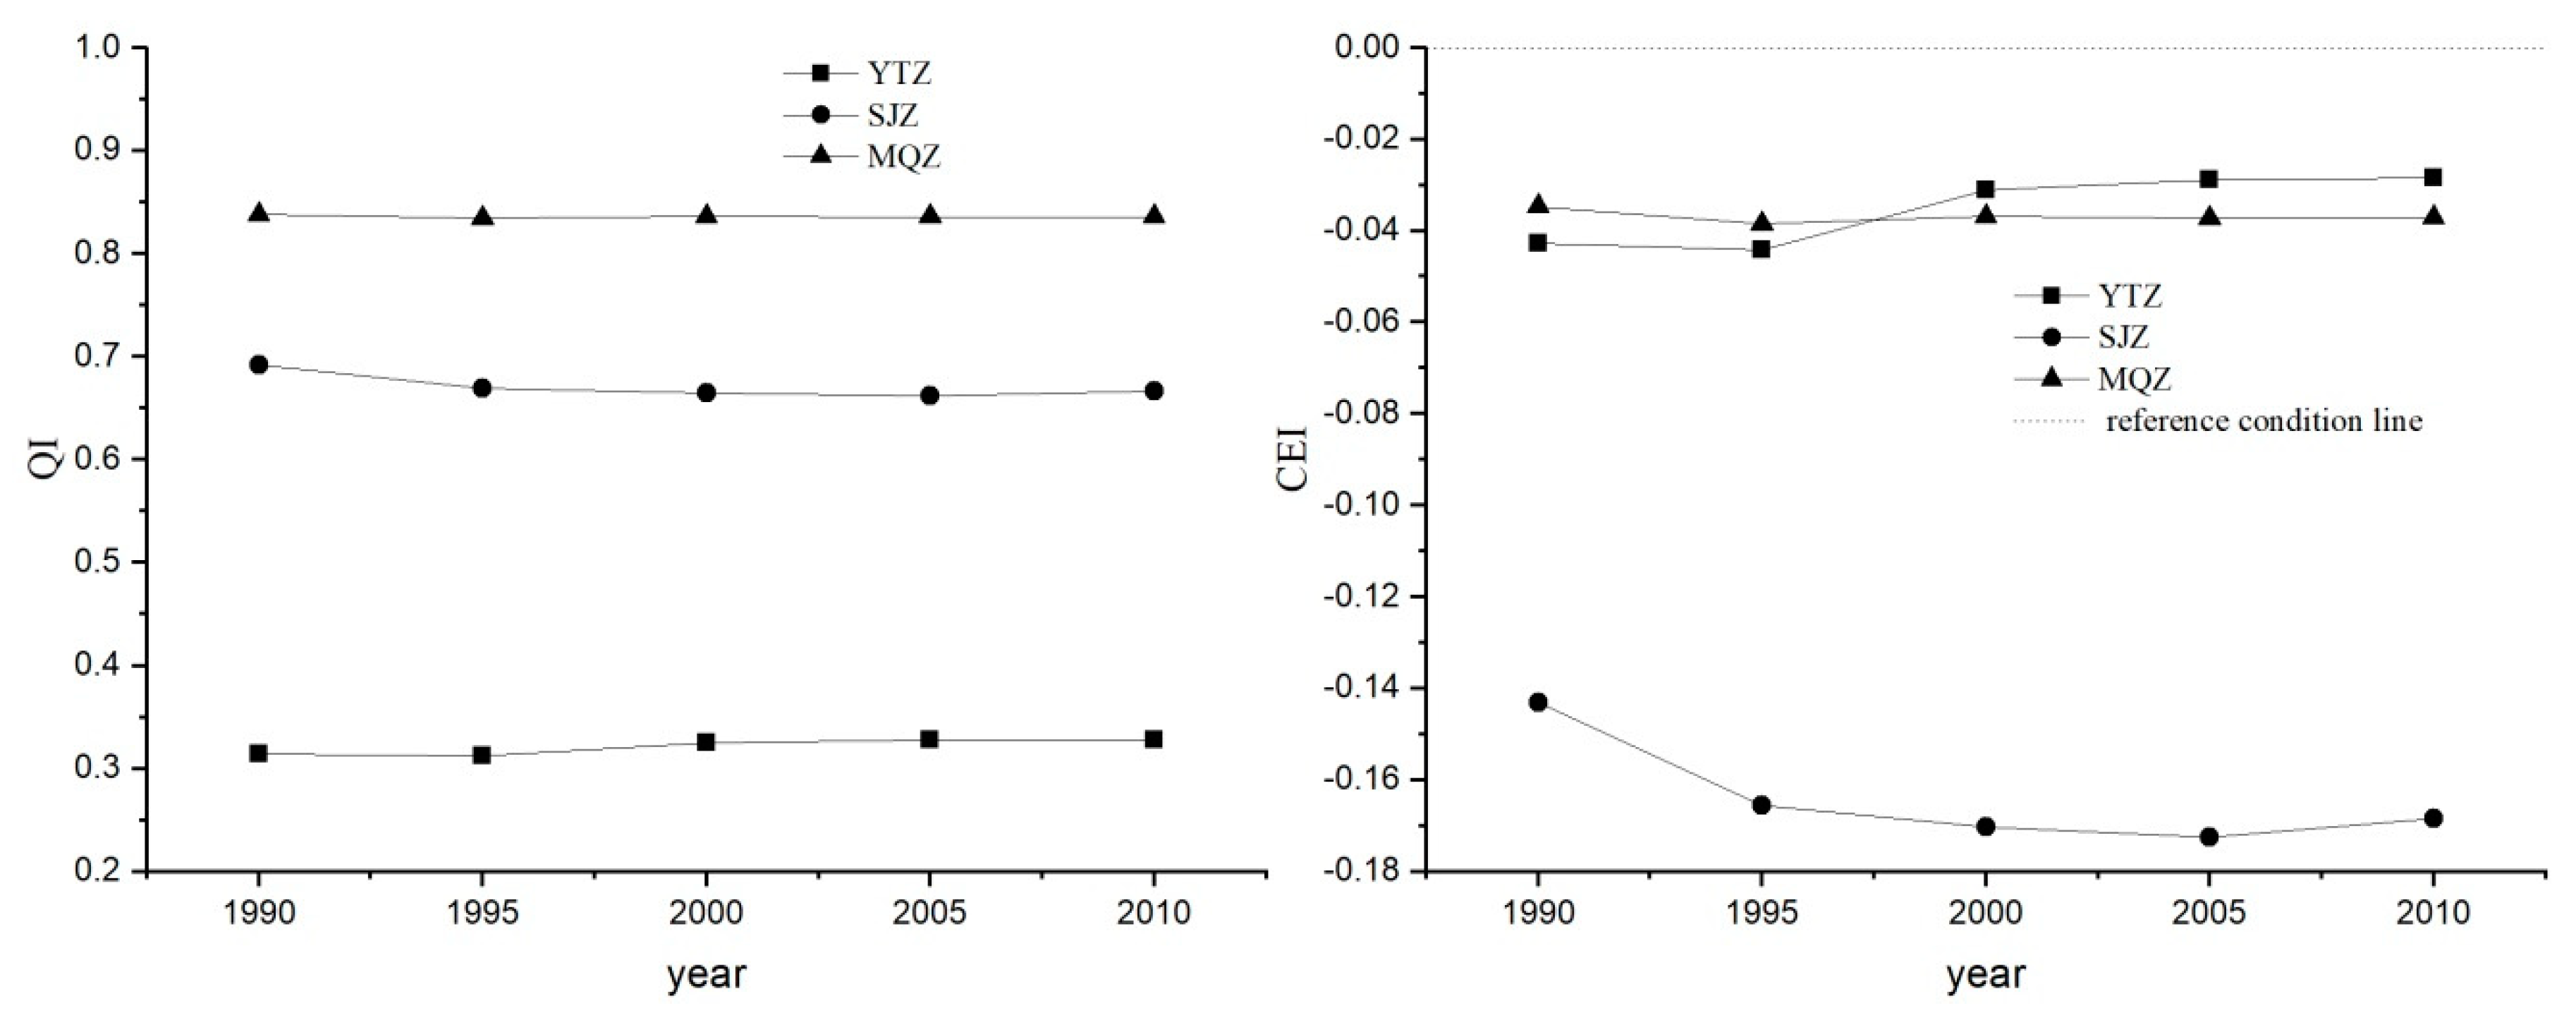
Then the QI of the three BEFZs from 1990–2010 based on the InVEST model was computed. Subsequently, the spatial distribution of the QI data from 1990–2010 was obtained. Here, QI was used as a proxy for the habitat quality index which is a reflection of conservation capacity.
2.3.2. Reference Ecosystem and Reference Condition Index
Due to the different geographic locations of the different BEFZs, they present regional differentiation in climate, hydrology, soil and biology. Therefore, the basic biodiversity resources have distinct differences. The spatial comparison of biodiversity conservation effectiveness is not persuasive if the differences in basic resources are not considered. A reference condition that reflects the differences in basic resources is introduced in this study to resolve this issue.
In restoration ecology, a reference condition is the set of attribute values or quantifiable characteristics of a reference ecosystem [
29]. Reference conditions have been widely used to evaluate river health and ecological environments and restore ecological environments. The principles used to select a reference ecosystem that can be used to formulate the reference condition are (1) the best of the existing conditions; (2) the absence of significant human disturbance; (3) the condition that the current sites might achieve if they were better managed [
30]. In essence, a reference condition supplies an ecosystem characteristic value that can reflect the background condition.
There are one or more national nature reserves in the BEFZs (
Figure 1) that are rarely disturbed by humans, and the ecosystem structures of these reserves are restricted only by the natural environment. These reserves satisfy the principles used to select reference ecosystems mentioned above. Therefore, the national nature reserves located in the BEFZs was selected as the reference ecosystem. Then the optimum value of ecological condition in the reference ecosystem was used as a reference condition index (RCI), which represents the optimum biodiversity conservation capacity. Specifically, the maximum habitat quality value in the national nature reserves throughout the study period was selected as the RCI. When RCI was determined for one BEFZ, it was applied across all years. In this study, the specific method used to compute the RCI was as follows: First, in ArcGIS10.5 software, the arithmetic mean was used to calculate the mean QI of the national nature reserves in the study period. The mean QI data for the national nature reserves in the three BEFZs from 1990–2010 were generated. Second, the maximum mean QI of the national nature reserves in one BEFZ during the study period was selected as the RCI.
2.3.3. Comparison of Biodiversity Conservation Effectiveness
- (1)
Conservation Effectiveness Index (CEI)
After having determined the reference system, conservation effectiveness can be redefined as the discrepancy between the actual value of species richness of a BEFZ and the optimal value of its corresponding reference system. Thus, a quantitative indicator for biodiversity conservation effectiveness was constructed based on QI and RCI:
The specific method used to compute the CEI is as follows: According to Formula (4), temporal and spatial variations of CEI in the three BEFZs from 1990–2010 can be obtained using raster calculator in ArcGIS 10.5 software.
- (2)
Spatial Comparison of Biodiversity Conservation Effectiveness
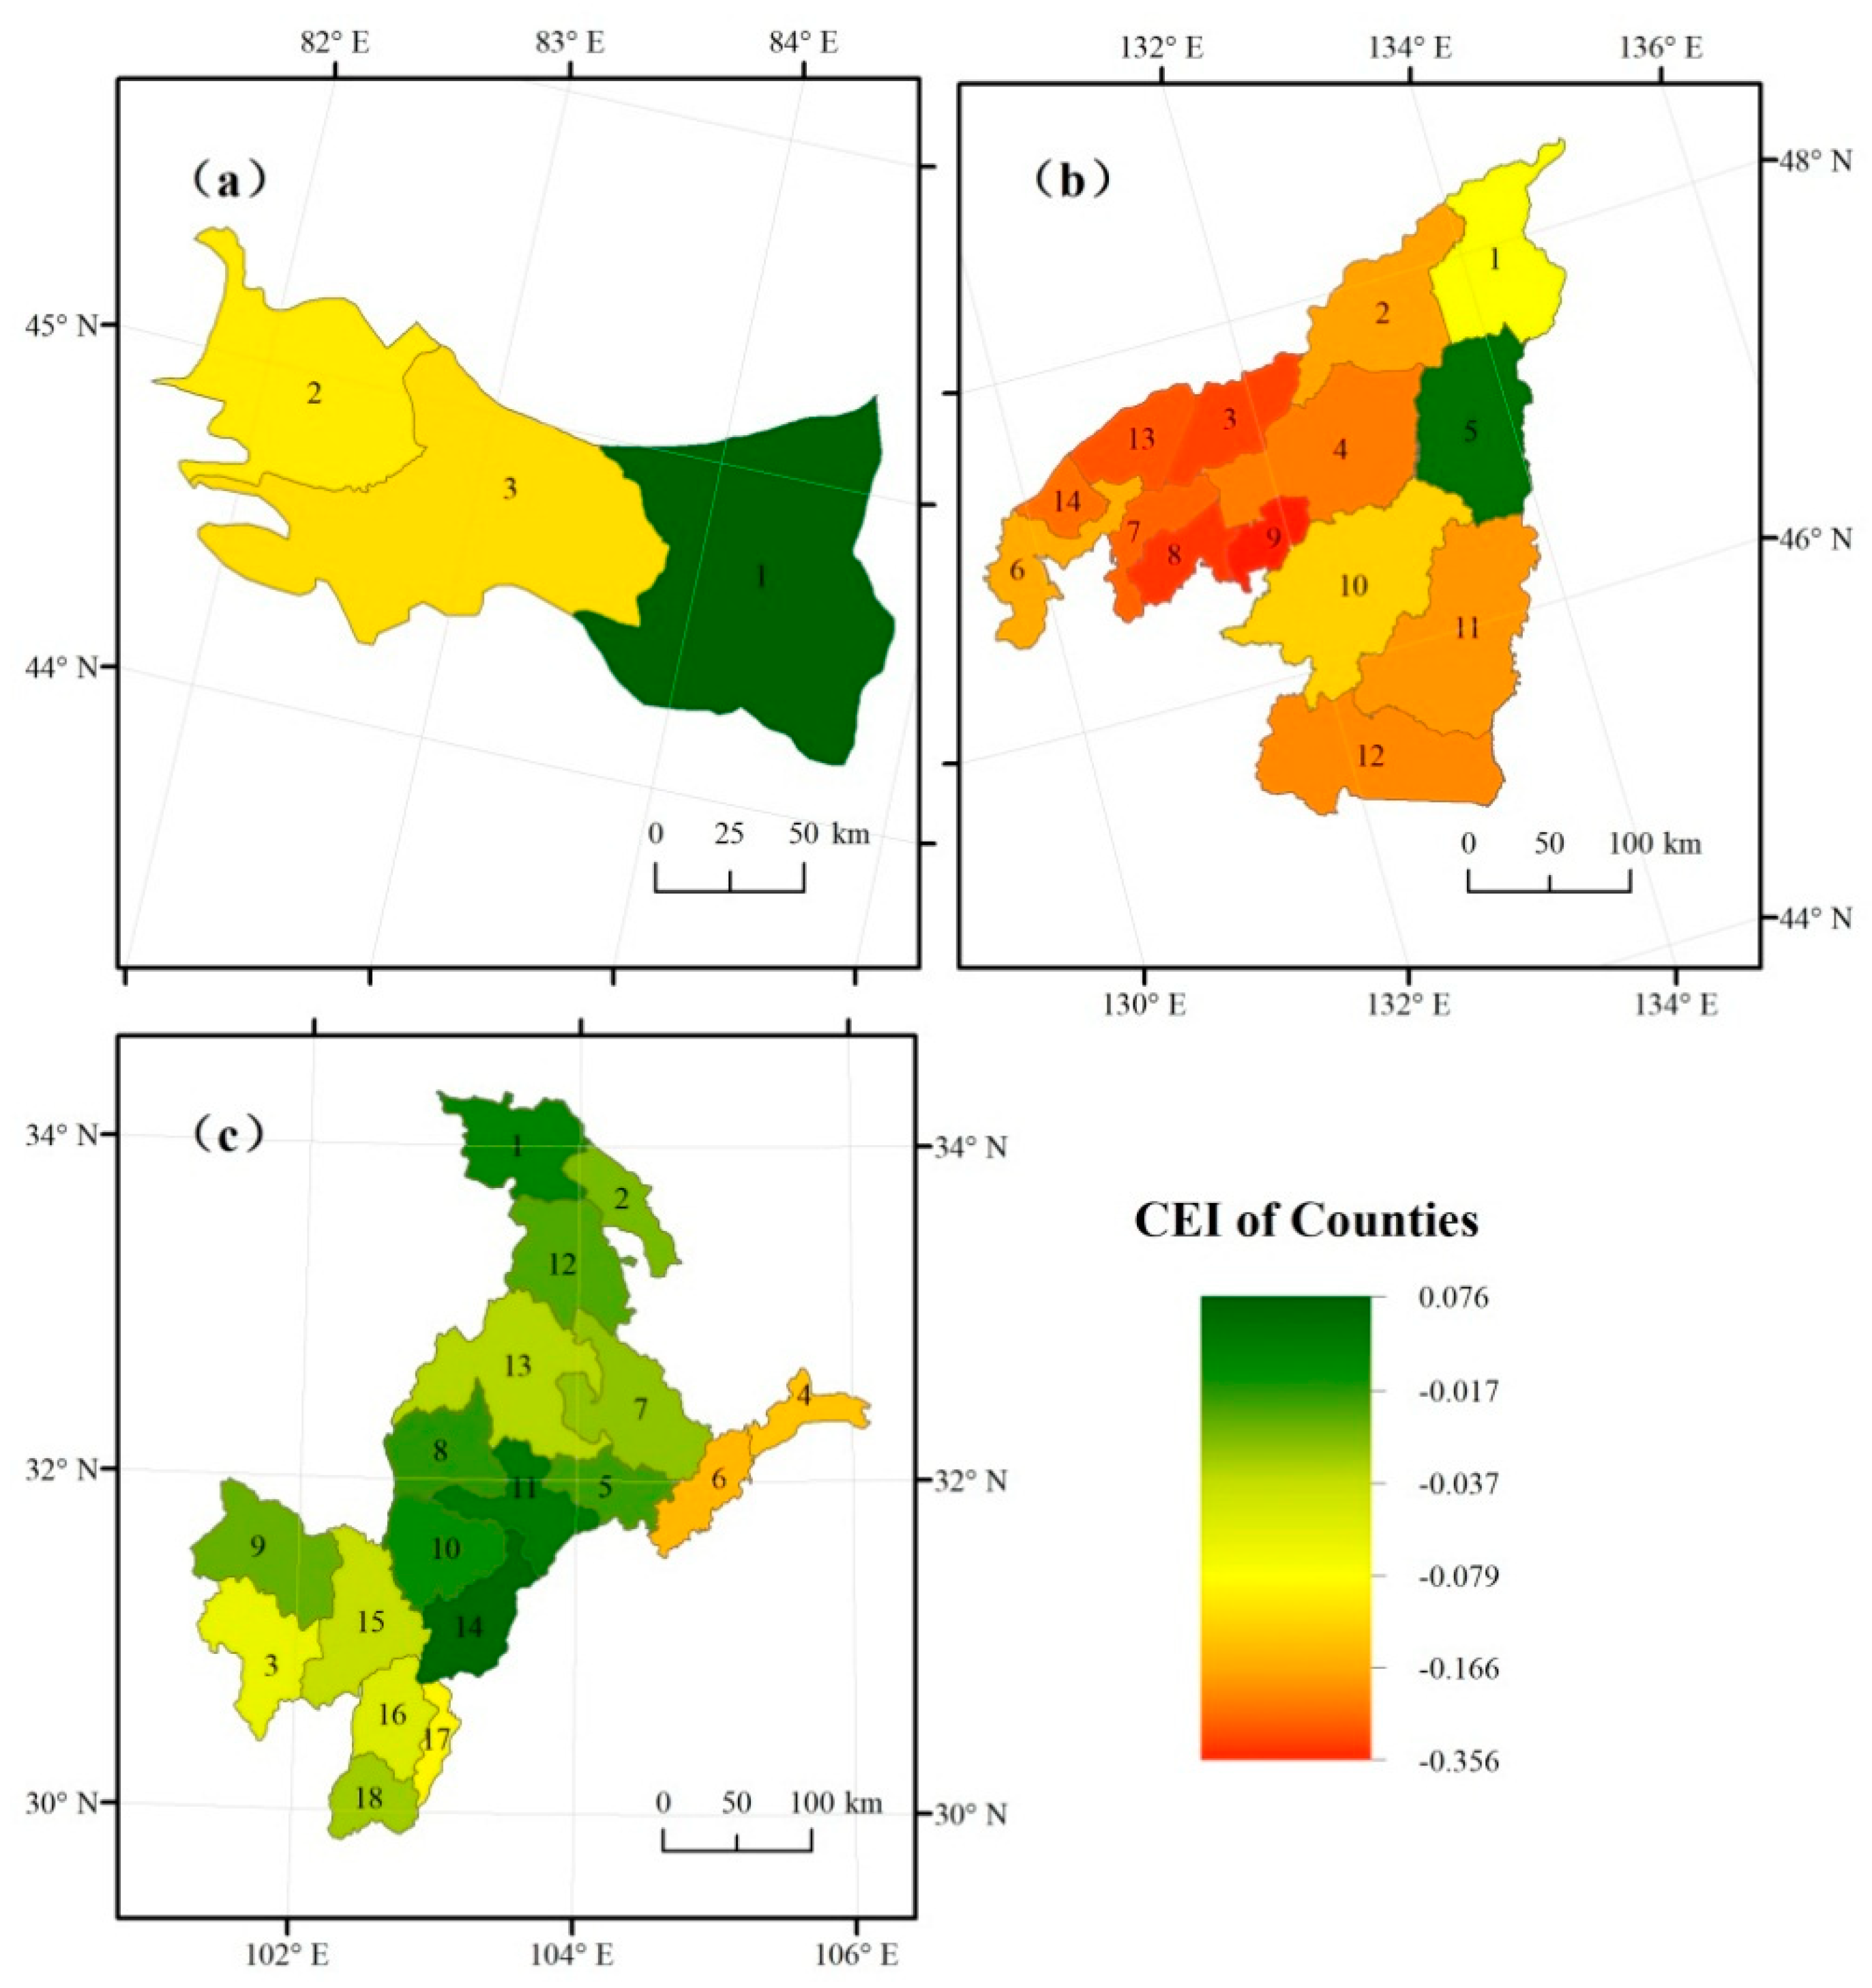
The CEI can be used to compare the biodiversity conservation effectiveness between different BEFZs. The mean CEI values in the three BEFZs from 1990–2010 were obtained using the arithmetic mean in ArcGIS 10.5 software based on the temporal and spatial data of the CEI. Based on this information, the difference in the biodiversity conservation effectiveness can be illustrated by comparing the mean CEI values in the three BEFZs.
The government sectors located in the BEFZs are responsible for the management of biodiversity conservation in this region. The CEI can also assess conservation effectiveness between administrative units in BEFZs. Therefore, CEI for each county was obtained using zonal statistics in ArcGIS 10.5 based on the raster data of CEI and the county boundaries in the three BEFZs.
- (3)
Temporal Comparison of Biodiversity Conservation Effectiveness
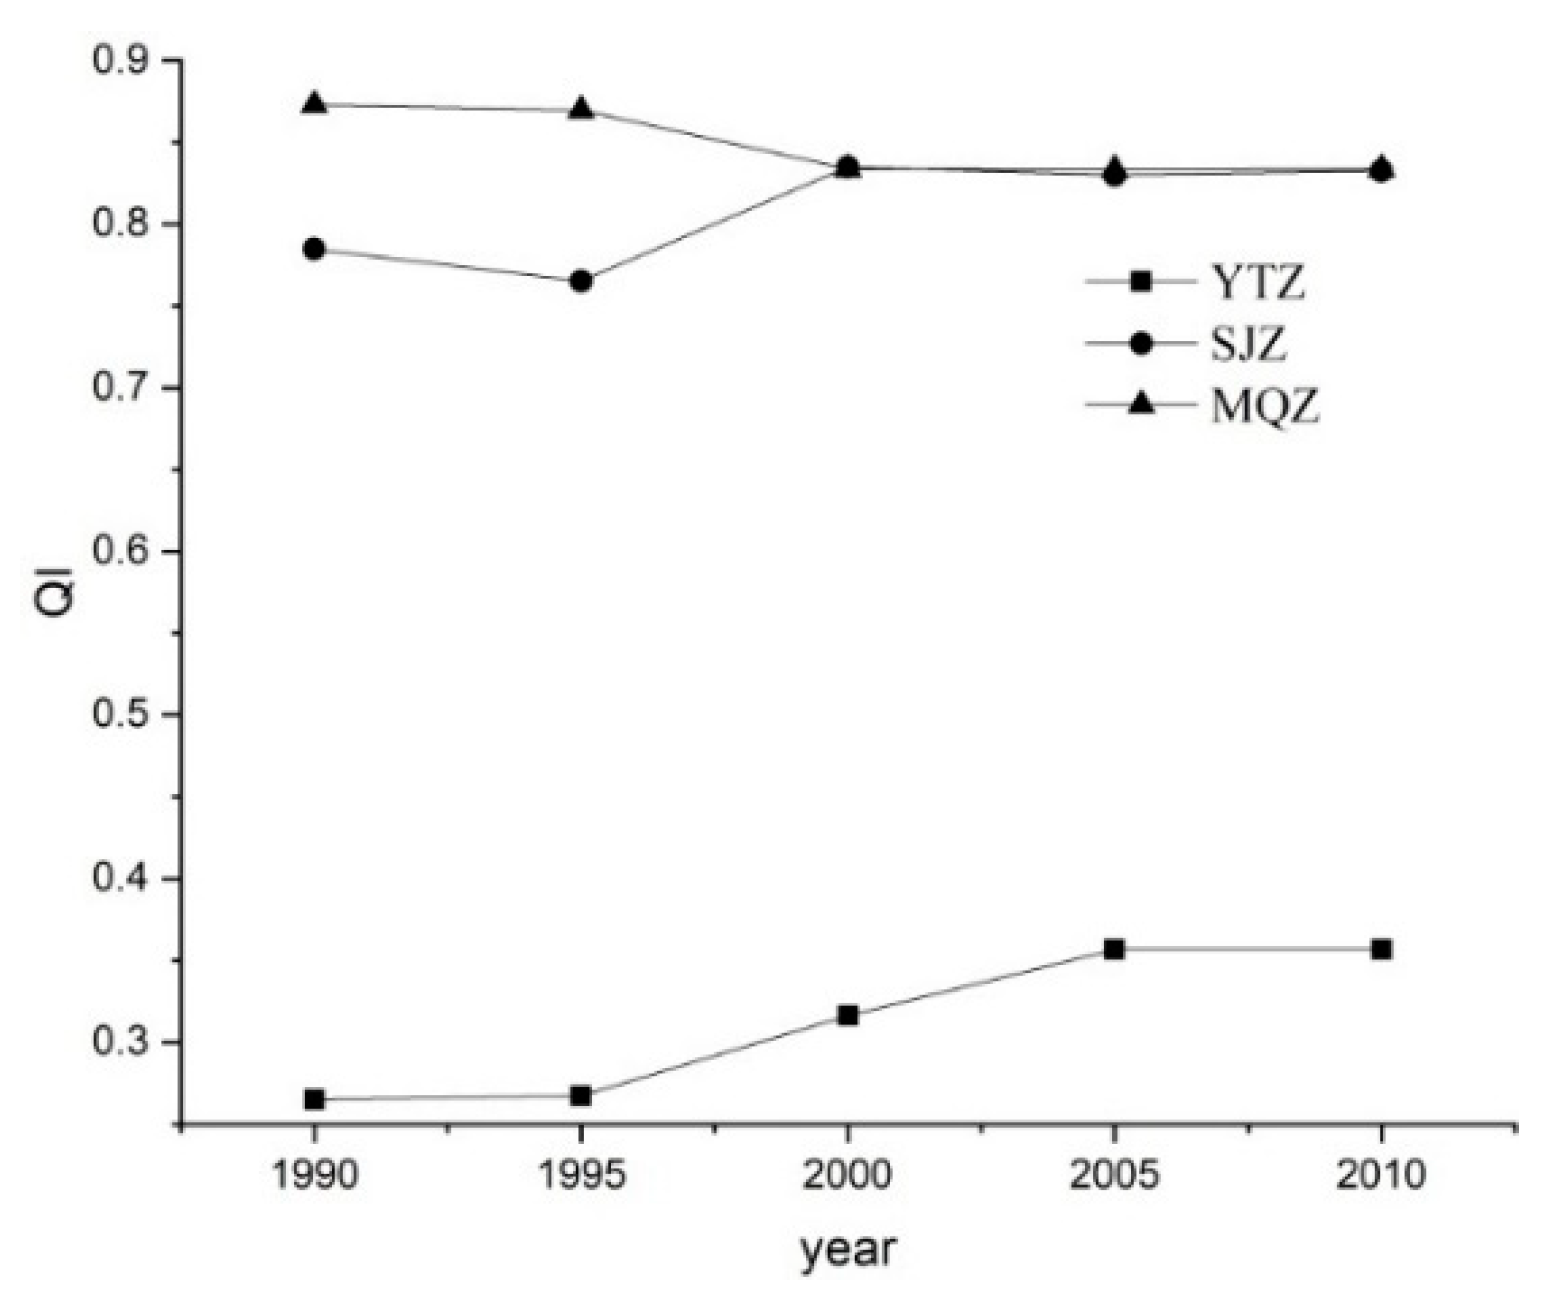
A comparative evaluation of the of biodiversity conservation effectiveness should aim at not only the spatial differences at a specific time but also the temporal changes in BEFZs and administrative units inside BEFZs. Then temporal and spatial variations in the biodiversity conservation effectiveness at different scales can be adequately determined. The specific operations are as follows: The mean QI of the three BEFZs from 1990–2010 was obtained and then subtracted their corresponding RCI values to obtain the CEI values of the three BEFZs during the study periods to reveal temporal changes in the biodiversity conservation effectiveness.
4. Discussion
This paper proposes a comparative assessment method to evaluate biodiversity conservation effectiveness that is applied to three BEFZs with different metrics. This method can be employed to objectively, comprehensively and scientifically assess the biodiversity conservation effectiveness in the BEFZs that exhibit substantially different geographic environments. The method is different from other methods of effectiveness evaluation [
7,
8,
9,
10,
11].
First, Equation (4) indicates that the CEI is determined by the difference between QI and RCI in the three BEFZs, where RCI exhibited the maximum QI value in the national nature reserves during the study period. Previous methods used non-protected areas outside the PAs as a reference system to assess the biodiversity conservation effectiveness in PAs. In contrast, this paper utilized the national nature reserves inside the BEFZs as the reference system, as the BEFZs are types of PAs. Zheng, et al. [
11] used a degradation evaluation system that was constructed by the conservation value index to assess the biodiversity conservation effectiveness between different wetland PAs. However, this assessment method can only reflect the biodiversity conservation capacity and cannot embody the change in biodiversity caused by conservation measures. The method proposed in this paper utilizes the difference value between the QI and CEI and can adequately reflect the biodiversity conservation effect.
Second, the proposed method can be used to compare the biodiversity conservation effectiveness between different BEFZs located in different geographic environments on a national scale. The success of the method lies in the use of the RCI, which is computed as follows. First, a reference ecosystem is selected that can represent the background geographic environment in a given region (for the detailed principles for selecting the reference ecosystem, see
Section 2.3.2). In this study, national nature reserves in the BEFZs were chosen as the reference ecosystem. Second, the optimum value of ecological condition in the reference ecosystem is taken as the RCI. Thus, the maximum habitat quality value in the national nature reserves for the entire study period was selected as the RCI. Once the RCI was determined in one BEFZ, it was applied across all years. The baseline reference year is very different for each BEFZ. For example, for YTZ, the RCI value was selected from 2010, whereas the RCI for MQZ was from 1990. This approach was taken because the RCI refers to the optimum value of ecological condition in the reference ecosystem, corresponding to the year when the QI value was at its maximum. The current evaluation methods used to assess the effectiveness of PAs are only suited to a single PA where the natural geographic environment is homogeneous and cannot be extended nationwide where the geographic environment is different. Although the method used to evaluate the effectiveness of biodiversity in wetlands proposed in a previous study [
11] can compare the effectiveness of wetlands at national scales, it overlooks the difference in geographic environment in different national nature reserves in the wetlands. As a result, their method cannot adequately reflect the difference in biodiversity conservation effects between different regions.
Third, in this study QI computed by the InVEST model was used as a proxy for biodiversity, where the measure of the QI included the suitability and sensitivity of different land use types to biodiversity. This method opens a new approach to revealing the change in biodiversity conservation capacity and the biodiversity conservation effectiveness. Thus, this paper can now lay the foundation for a method to scientifically evaluate the performance of government departments regarding biodiversity conservation in the BEFZs. The current methods used to evaluate biodiversity effectiveness always adopt different types of biodiversity measures or landscape measures aiming at protecting objects. The previous method that used biodiversity measures can reflect the change in biodiversity after the implementation of conservation measures, but there are no direct correlations to land use structures, which are considered the main biodiversity measures. It is thus difficult to apply the results of the assessment to improve the conservation measures. The latter method that used landscape measures can establish the connections to the adjustment of land use structure, but the relation to the effect of implementing conservation measures is lacking. Therefore, the method proposed in this paper based on the QI computed by the InVEST model is accurate and convenient for application.
Finally,
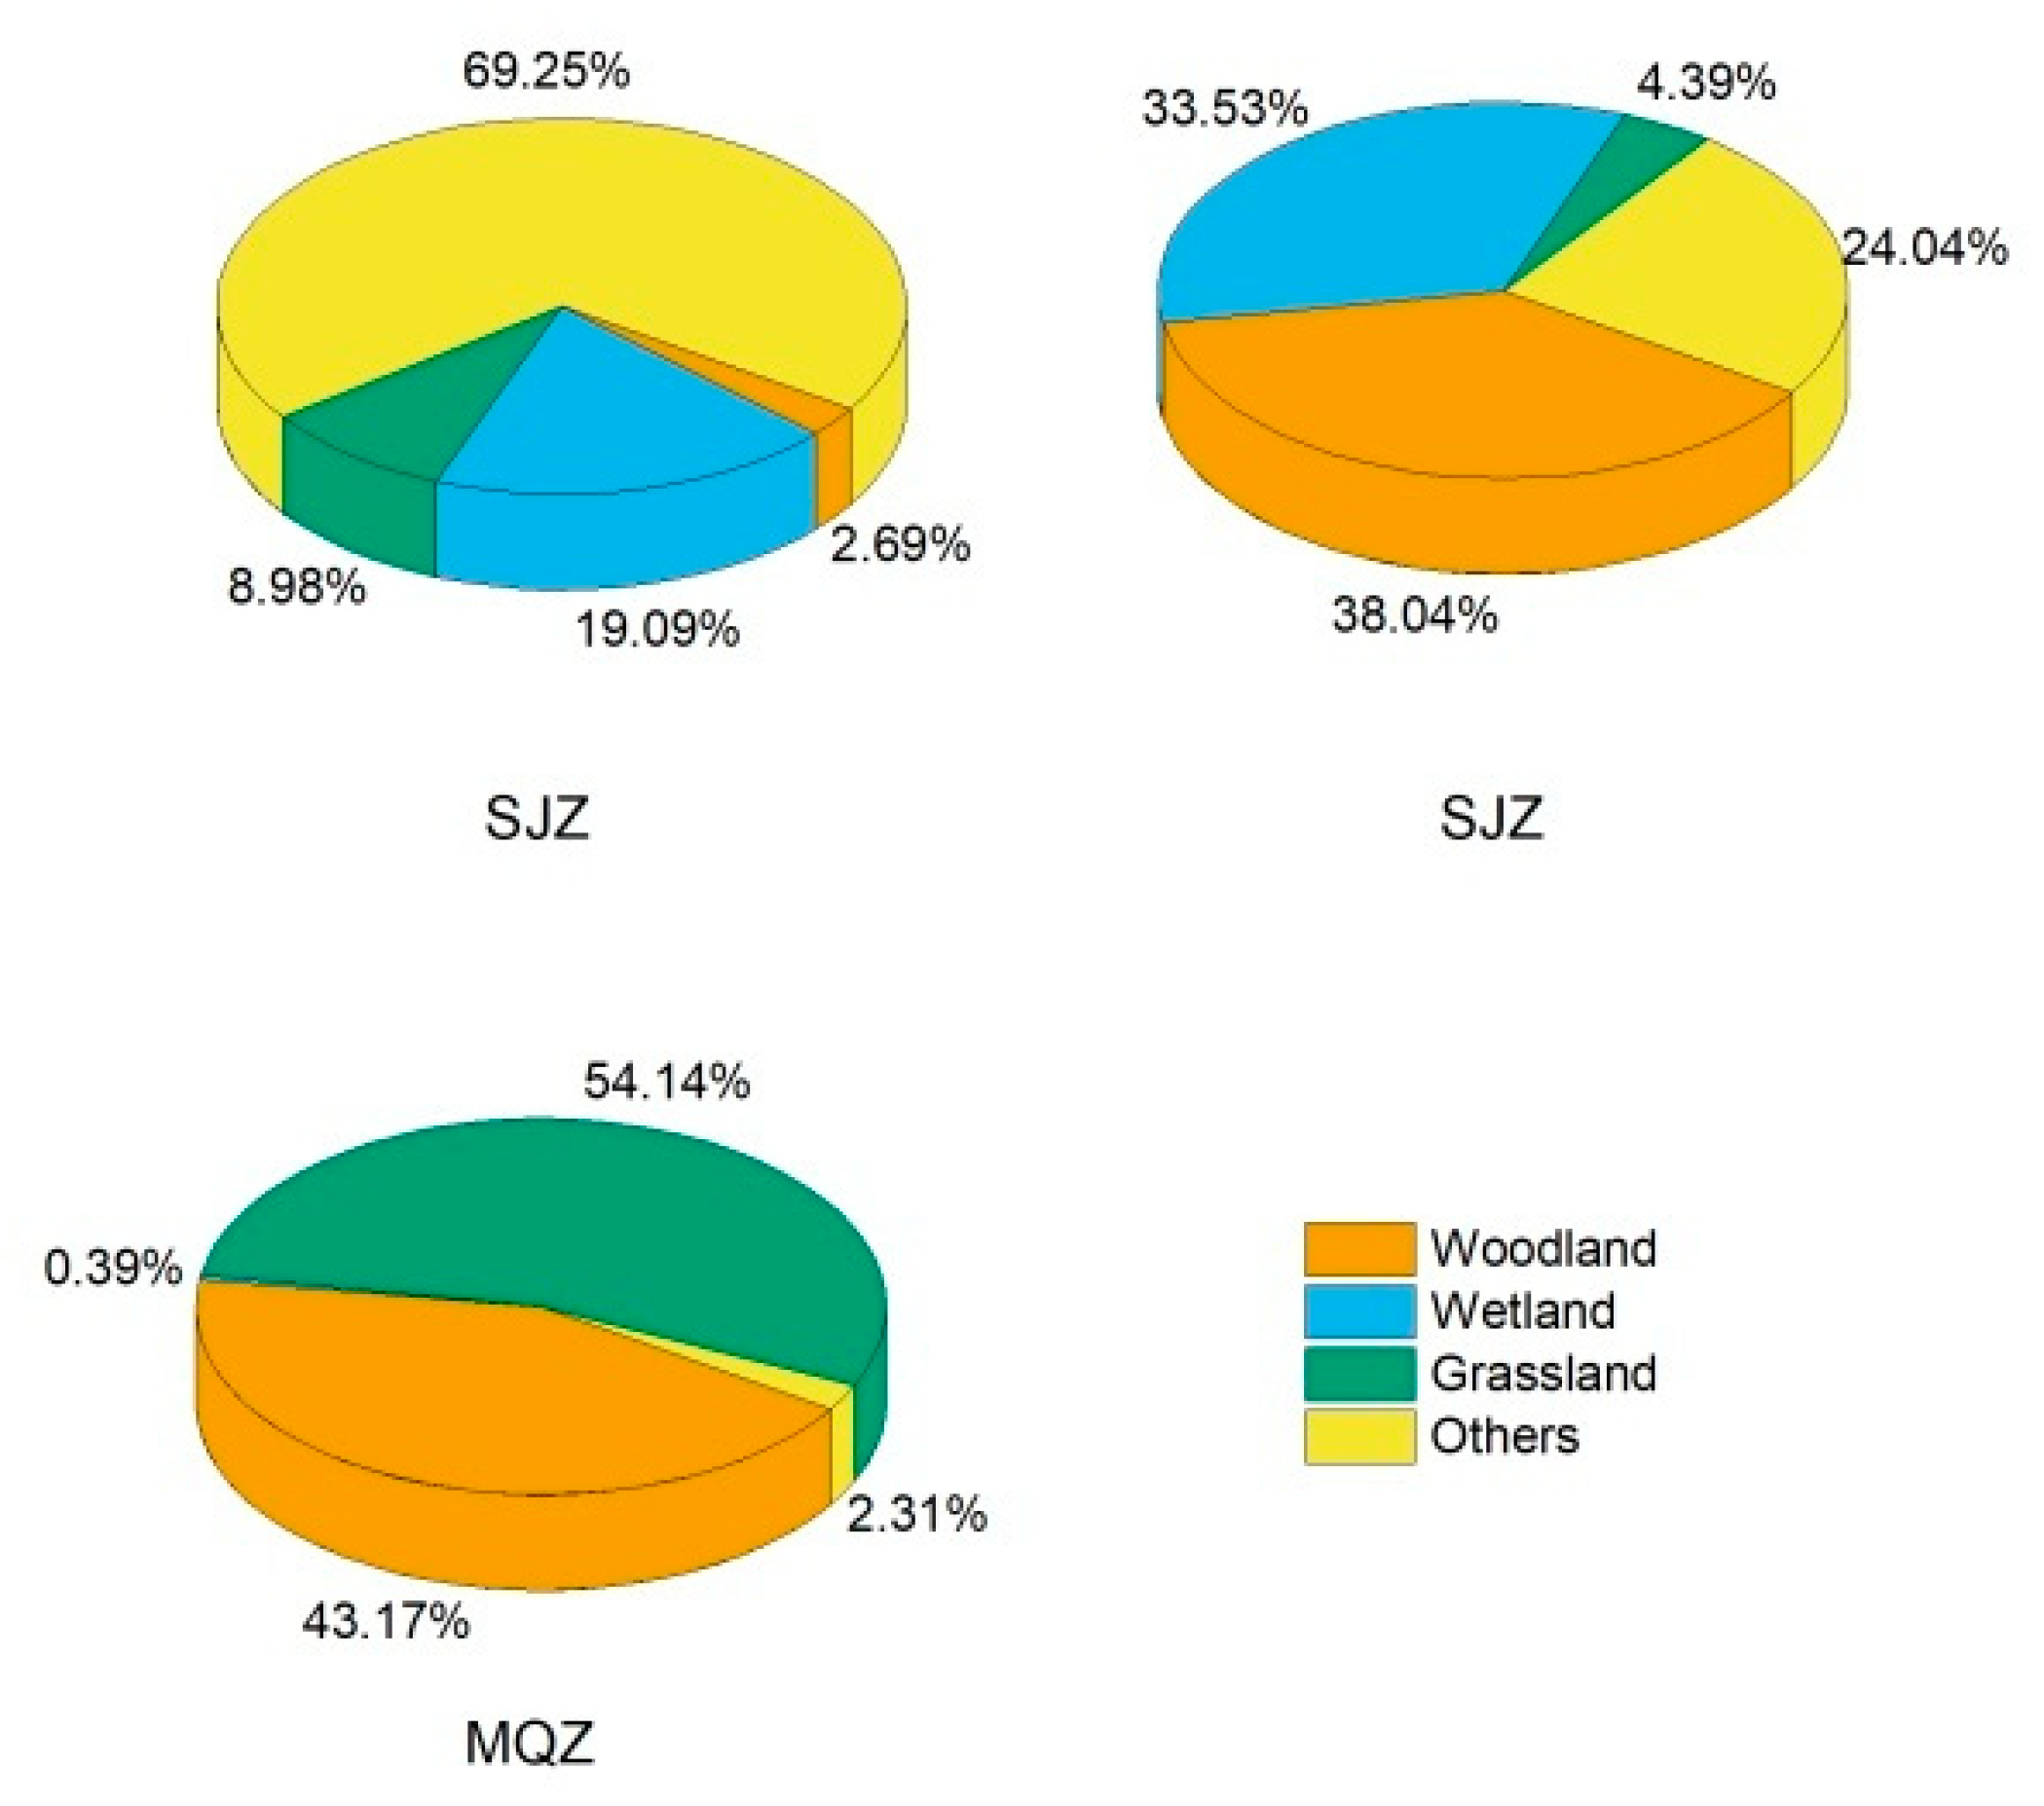
Figure 7 illustrates the proportion of ecological land use type in national nature reserves in the reference year. The highest cover of forestland, grassland and wetland areas was found in MQZ (97.69%), followed by SJZ (75.96%), and the cover was lowest in YTZ (30.75%). This pattern is consistent with the results of RCI (MQZ > SJZ > YTZ). Additionally, the proportion might also affect the optimum biodiversity conservation capacity, i.e., RCI. For example, the forest habitat in MQZ has a high suitability level for pandas, and the proportion of forestland is the highest in MQZ among the three BEFZs. The wetland habitat in SJZ is suitable for rare waterfowl, and the highest cover of wetland areas is found in SJZ among the three BEFZs. Therefore, the RCI can effectively illustrate the background difference in biodiversity conservation in the different BEFZs. In addition, the RCI is based on the assumption that the best habitat quality in the BEFZ is found in the national nature reserves and the habitat quality is affected by only the change in the environment when there is no or limited human disturbance. However, when designating the boundaries of the national nature reserves, to maintain the integrity, the QI of a national nature reserve is not always optimum. For example, there is a large proportion of barren land in YTZ, leading to the mean RCI value to be lower than that in other areas in the BEFZ, and then mean CEI values in these areas are greater than zero. This result may be inconsistent with the assumption of CEI. The method used to determine the RCI that utilized national nature reserves as reference ecosystems cannot ensure that the CEI will be larger than zero. For more accurate assessment results, the method used to determine the RCI can be improved in the future.
There are also some limitations to the method. In this paper, QI was computed by the InVEST model as a proxy for biodiversity and developed the RCI and CEI based on QI to compare the biodiversity conservation effectiveness between different regions. In the InVEST model, land use cover is the only considered factor that can affect biodiversity. Thus, the method proposed in this paper assumed that land use is the only direct determinant of conservation effectiveness. Threats such as invasive species and hunting pressure were not incorporated in this paper, which could also affect conservation effectiveness [
31,
32]. However, the limitations do not affect the practicality and rationality of the method.
The method proposed in this paper can also be used to compare the biodiversity conservation effectiveness between different regions in other countries. Certain factors should be considered. First, the background environment in a specific region should be similar. Second, national nature reserves inside the BEFZs were chosen as the reference ecosystem in this study. If there are no national nature reserves in the region of interest, the reference ecosystem should be selected according to principles of determining a reference ecosystem. Third, because the resolution of land use data will affect the accuracy of the QI, RCI and CEI, it is preferable to use high spatial resolution data to compute the QI.


