Building Retrofit Measures and Design: A Probabilistic Approach for LCA


Abstract
:1. Introduction
2. State of the Art
3. Materials and Methods
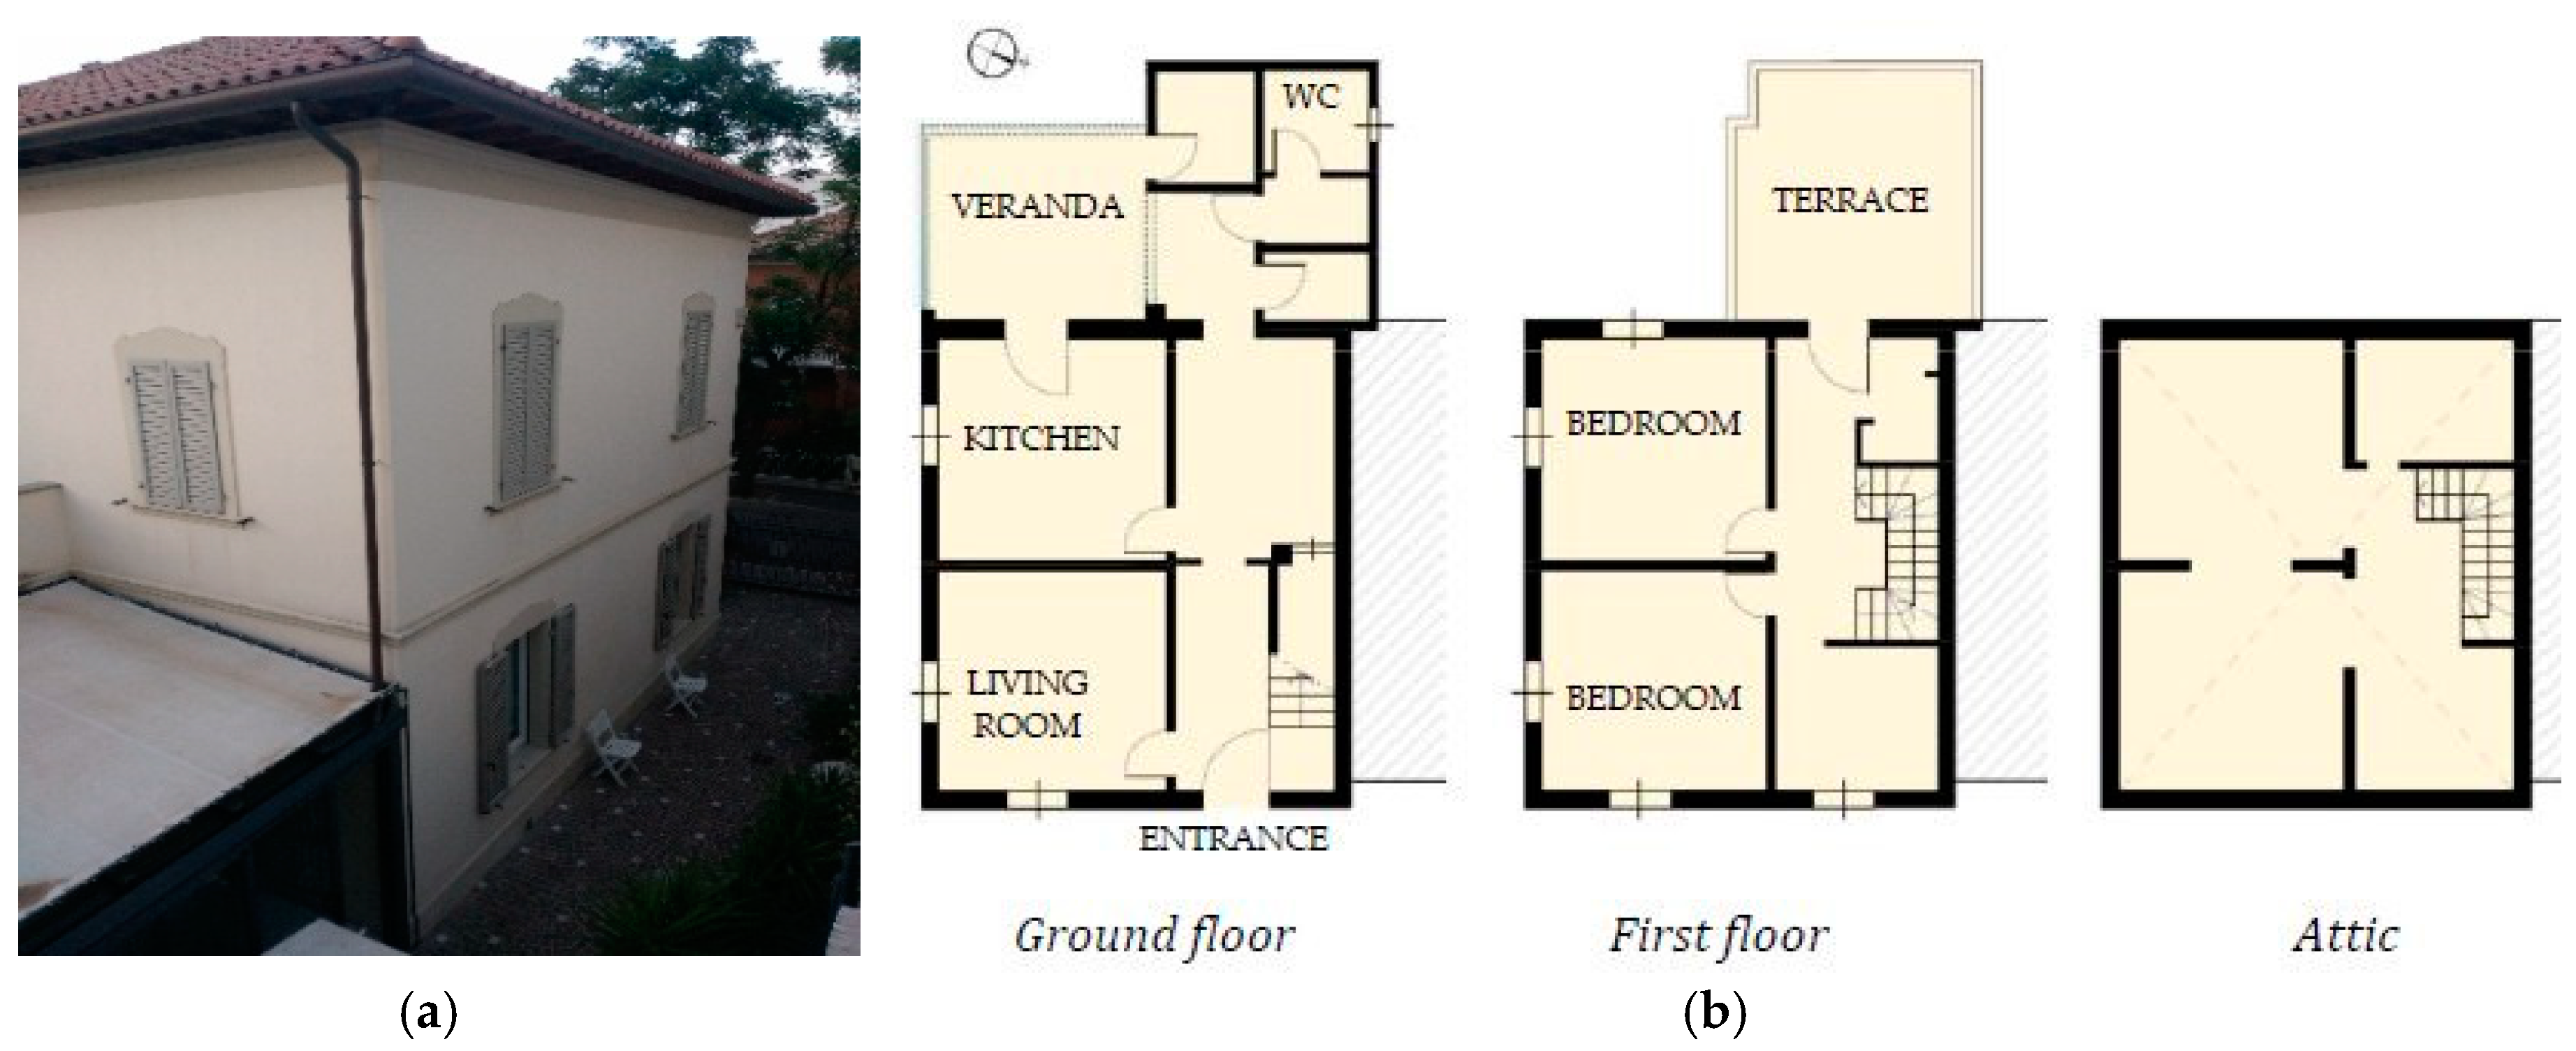
3.1. The Building Case Study
- Design option A (Table 1): 10 cm Expanded Polystyrene insulating material (EPS) coupled with plasterboard, without vapor barrier, directly fixed to the wall with a specific mortar.
- Design option B (Table 2): 12 cm Cork finished with a mortar as surface rendering (similar to ETICS—External Thermal Insulation Composite Systems used in building facades) and directly fixed to the wall with a specific mortar.
- Design option C (Table 3): 10 cm Rockwool coupled with plasterboard and a vapor barrier fixed to the wall by a metallic frame.
- Qh is the heat loss through the wall (kWh/m2)
- U is the wall U-value (W/m2K)
- HH is the heating hours a day (h) (set at 24 h)
- HDD are the annual heating degree-days (K)
- ETAh is the overall system efficiency for heating (-)
- EnFc is the conversion factor from delivered to primary energy (-)
3.2. The LCA Model
- EPS: Polystyrene foam slab (RER)| production | Alloc Rec, U
- Cork. Cork slab (RER) | production | Alloc Rec, U
- Rockwool: Rockwool, packed (RER)| production | Alloc Rec, U
- Mortar and Surface rendering: Adhesive mortar (RoW)| production | Alloc Rec, U
- Plasterboard: Gypsum plasterboard (RoW)| production | Alloc Rec, U
- Metallic frame and fixing screw: Steel, low-alloyed, hot rolled (RER)| production | Alloc Rec, U
- Vapour barrier: Aluminium alloy, AlMg3 (RER) | production | Alloc Rec,
- Primer + paint: Alkyd paint, white, without solvent, in 60% solution state (RER)| alkyd paint production, white, solvent-based, product in 60% solution state | Alloc Rec, U
- Skimcoat; Stucco (RoW)| production | Alloc Rec, U
- Gas: Heat, central or small-scale, natural gas (Europe without Switzerland)| heat production, natural gas, at boiler atm. low-NOx condensing non-modulating <100 kW | Alloc Rec, U;
- Municipal solid waste (waste scenario) (RoW)| Treatment of municipal solid waste and landfill | Alloc Rec, U.
3.3. Characterization of Probabilistic Input Parameters
- The mass of the materials used in the insulation measures;
- the unitary environmental impacts for each material.
- HDD of the Emilia Romagna Region, climatic zone E (Italy), where the building is located. Eurostat HDD data were processed, considering the spatial variability in the whole region and the time variability (data are available from 2000 to 2009), obtaining normal distributions;
- Thermal resistance of structural existing wall: 0.22 to 0.40 m2K/W (based on the wall thickness variation), defined by a normal distribution;
- The heating equipment efficiency. A uniform distribution was assigned, considering natural gas as heating source, based on authors’ judgment: 0.6–1.
- The environmental impact (both CC and CED-NRE) related to the Italian energy grid mix (primary energy) represented by a normal distribution (according with Eco-Invent 3.1 and MC analysis).
3.4. Uncertainty and Sensitivity Analysis
4. Results and Discussion
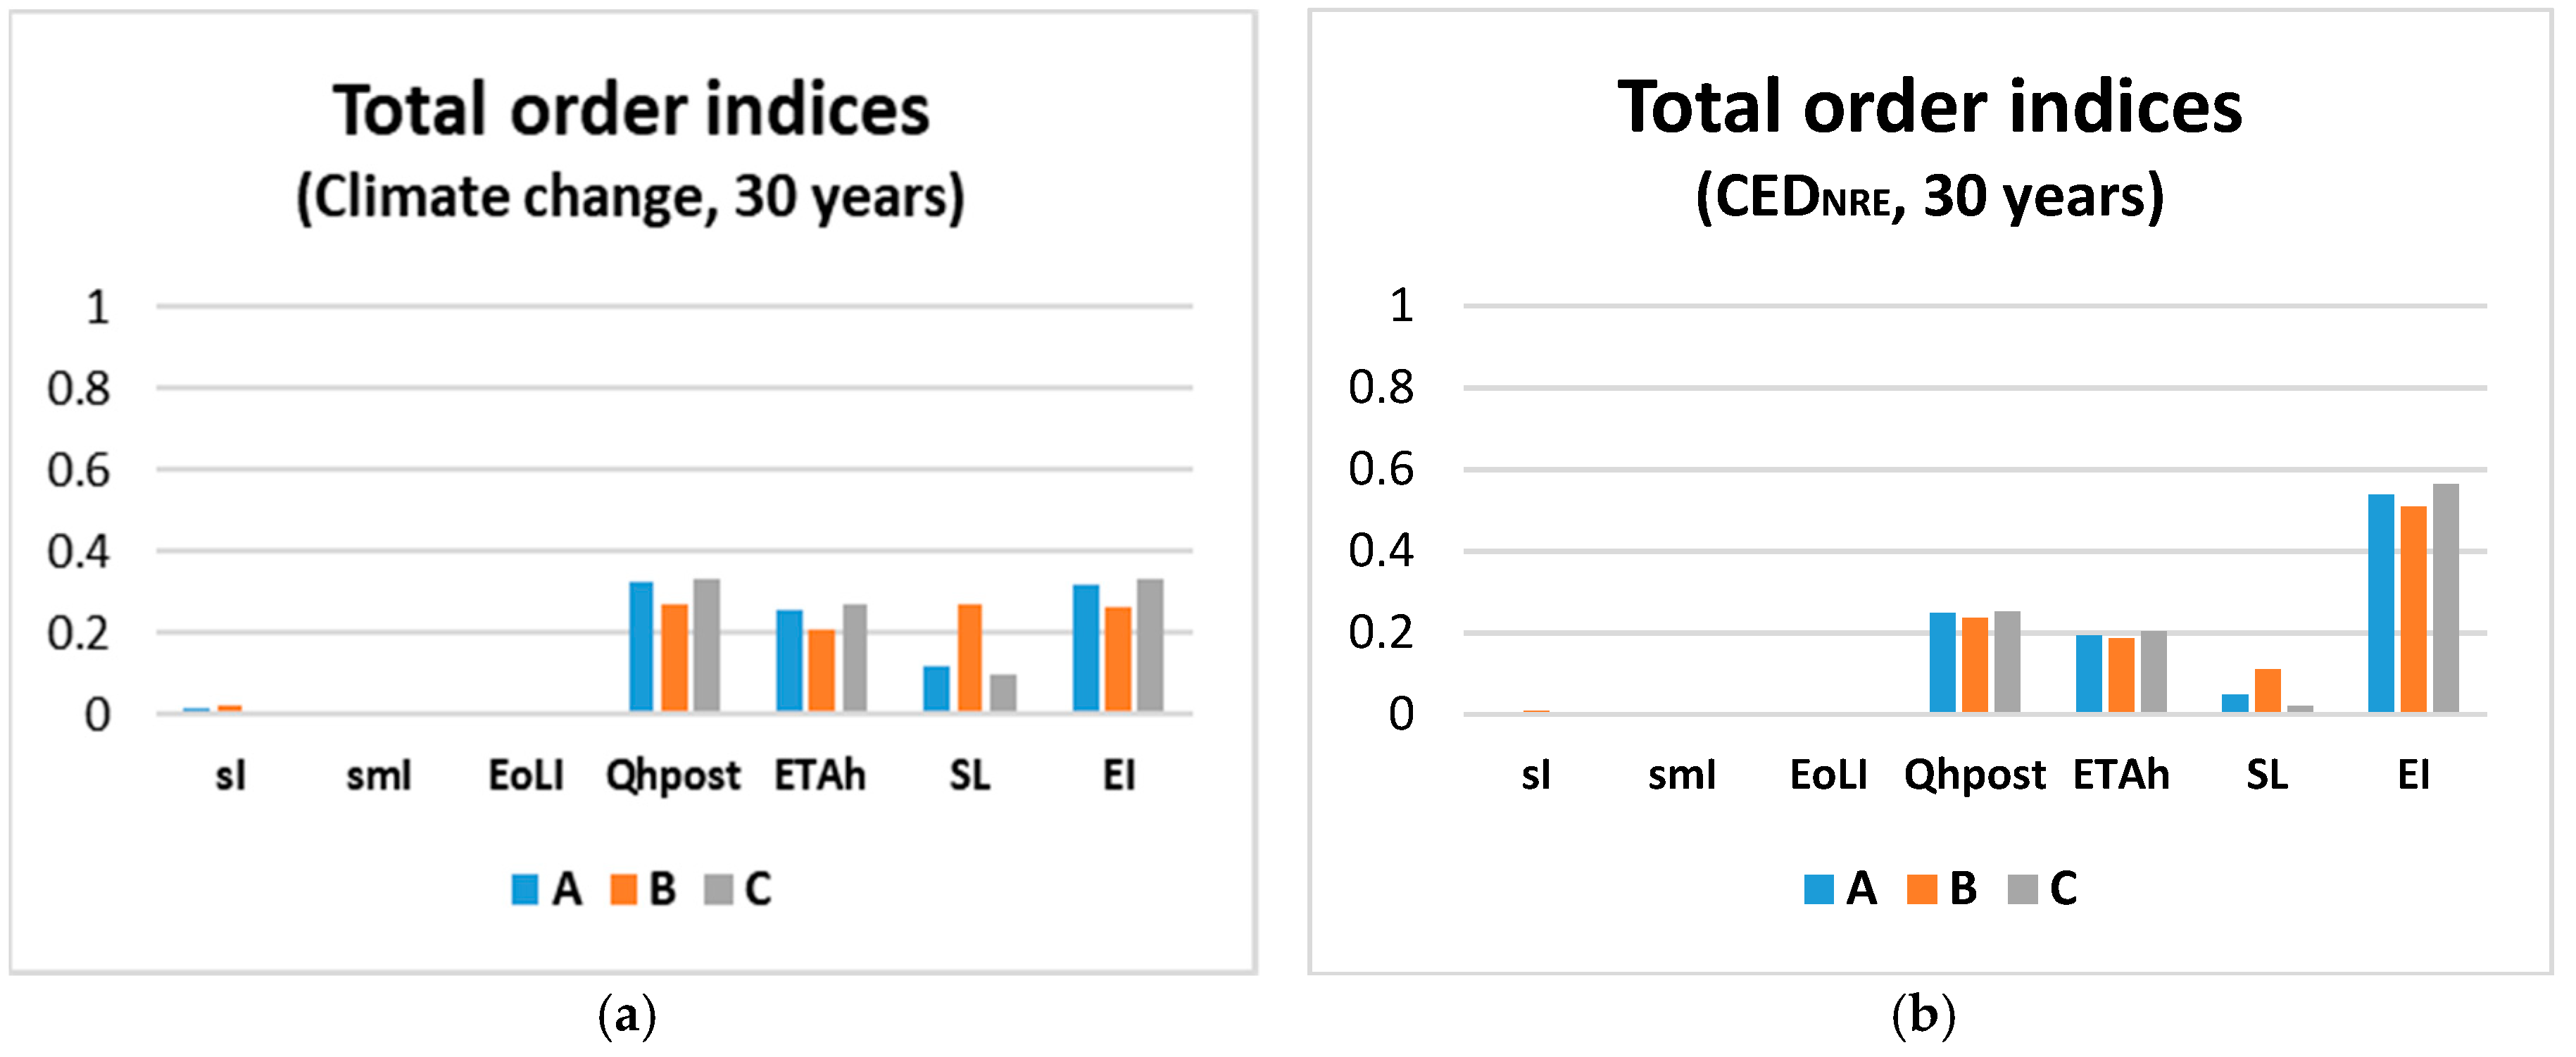
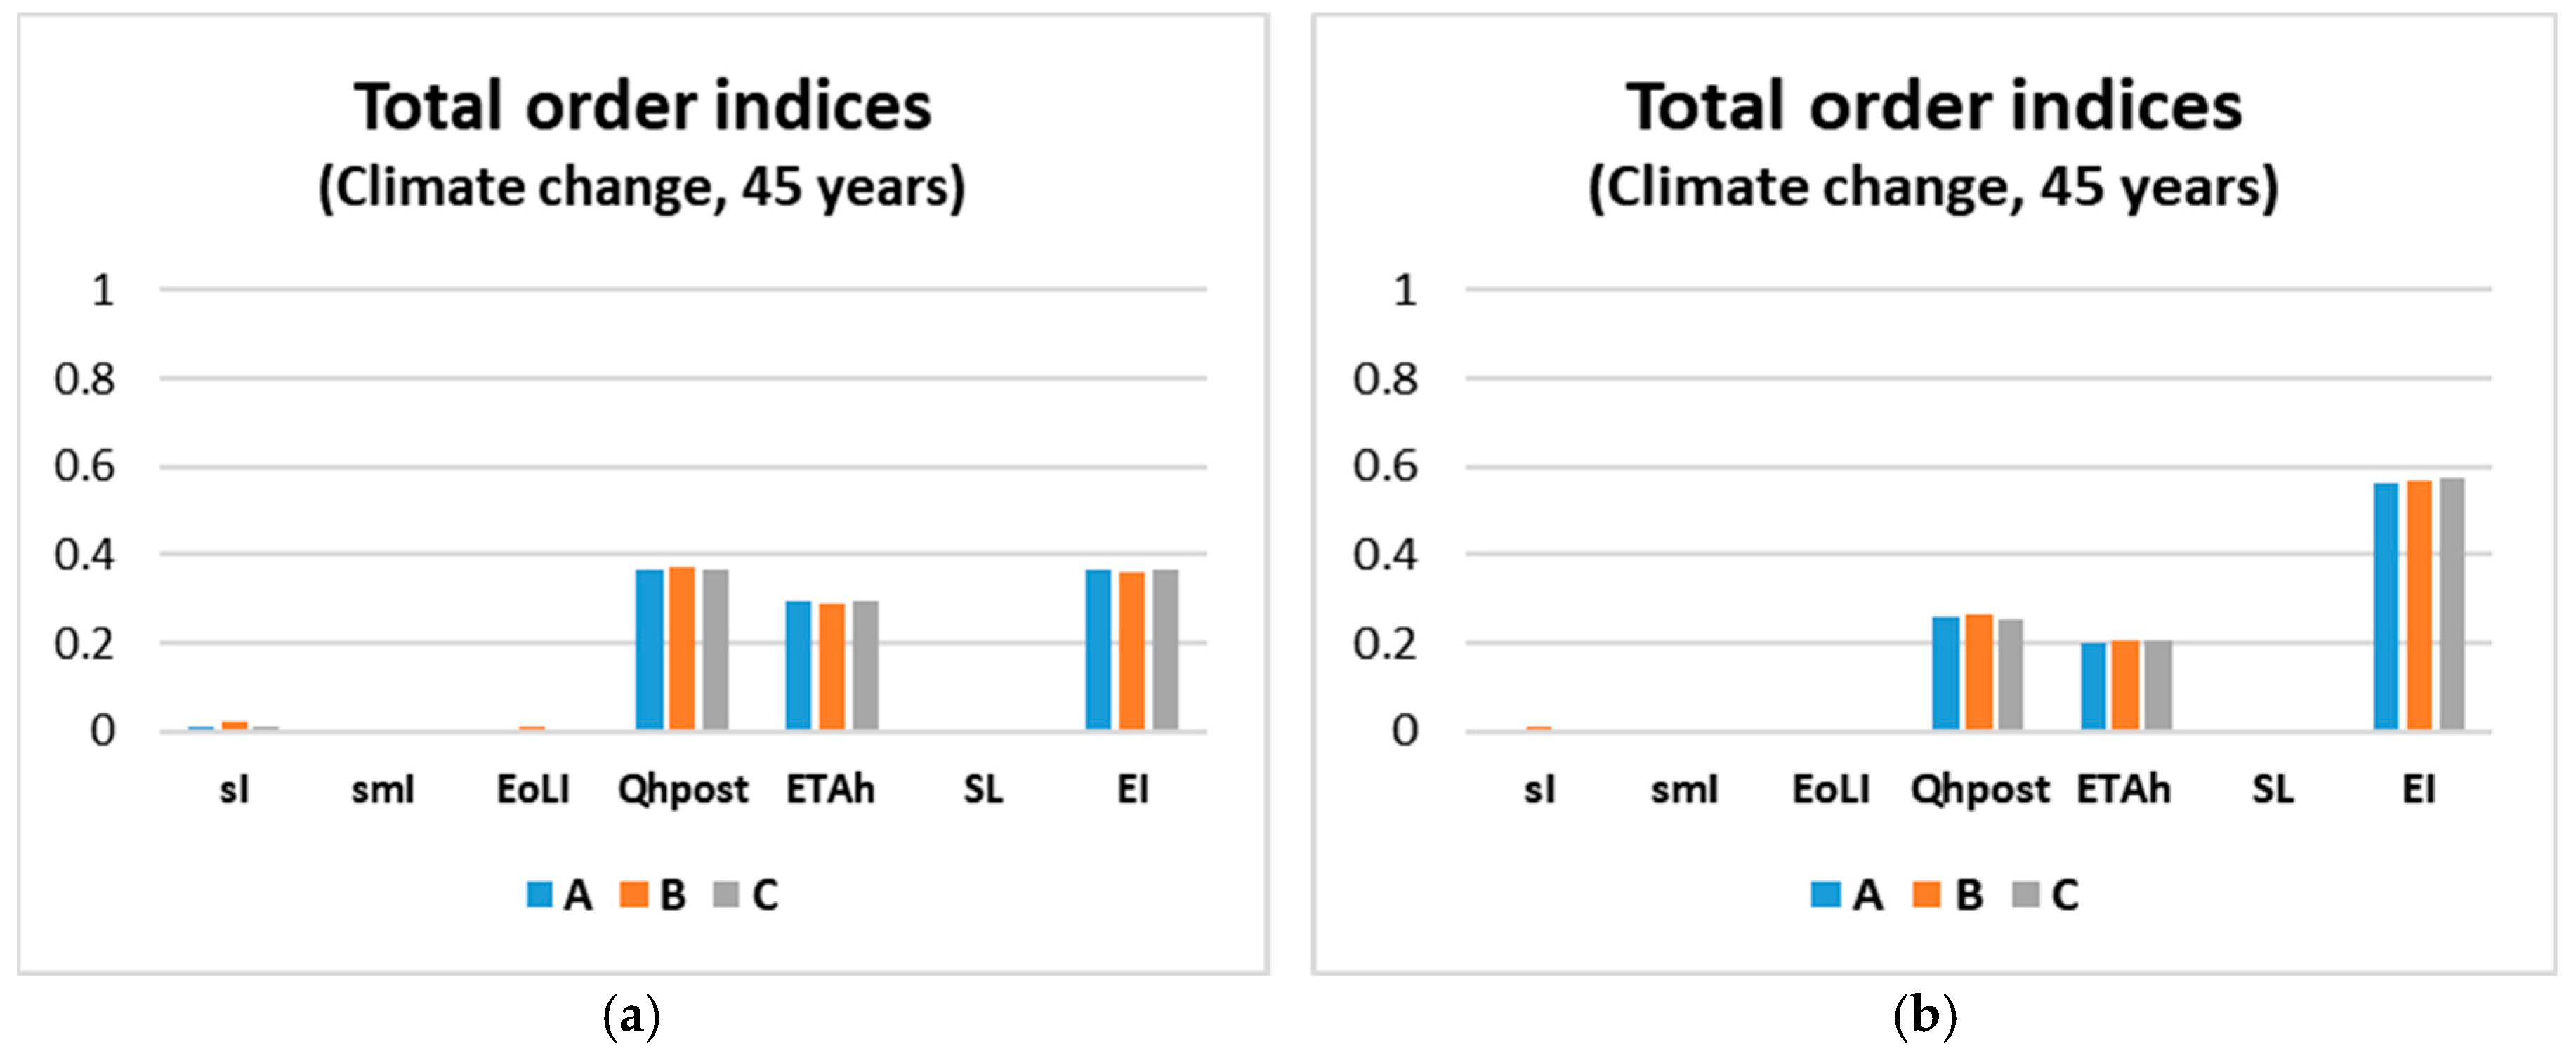
- sI: insulation system environmental impact related to production phase
- smI: insulation system environmental impact related to maintenance phase
- EoLI: insulation system environmental impact related to end of life phase
- Qhpost: heat transmission losses through the wall after renovation
- ETAh: overall system efficiency for heating
- SL: insulation system service life
- EI: unitary impact of the energy vector
5. Conclusions
Author Contributions
Funding

Conflicts of Interest
References
- European Commission. Ad-Hoc Industrial Advisory Group, Energy-Efficient Buildings PPP Multi-Annual Roadmap and Longer Term Strategy. 2010. Available online: http://www.ectp.org/cws/params/ectp/download_files/36d1191v1_eeb_roadmap.pdf (accessed on 1 July 2017).
- European Directive. Directive2010/31/EU of the European Parliament and of the Council of 19 May 2010 on the energy performance of buildings (recast). Off. J. Eur. Union 2010, 53, 13–35. [Google Scholar]
- Ferrante, A. Energy retrofit to nearly zero and socio-oriented urban environments in the Mediterranean climate. Sustain. Cities Soc. 2014, 13, 237–253. [Google Scholar] [CrossRef]
- Skaar, C.; Labonnote, N.; Gradeci, K. From Zero Emission Buildings (ZEB) to Zero Emission Neighbourhoods (ZEN): A Mapping Review of Algorithm-Based LCA. Sustainability 2018, 10, 2405. [Google Scholar] [CrossRef]
- Di Giuseppe, E.; Massi, A.; D’Orazio, M. Probabilistic Life Cycle Cost analysis of building energy efficiency measures: Selection and characterization of the stochastic inputs through a case study. In Proceedings of the International High-Performance Built Environment Conference—A Sustainable Built Environment Conference 2016 Series (SBE16), Sydney, Australia, 17–18 November 2016. [Google Scholar]
- Säynäjoki, A.; Heinonen, J.; Junnila, S. A scenario analysis of the life cycle greenhouse gas emissions of a new residential area. Environ. Res. Lett. 2012, 7, 034037. [Google Scholar] [CrossRef] [Green Version]
- BS EN 15978:2011. Sustainability of Construction Works. Assessment of Environmental Performance of Buildings. Calculation Method; BSI: London, UK, 2001. [Google Scholar]
- ISO 14040: 2006. Environmental Management–Life Cycle Assessment–Principles and Framework; International Organization for Standardization: Geneva, Switzerland, 2006. [Google Scholar]
- Ortiz, O.; Castells, F.; Sonnemann, G. Sustainability in the construction industry: A review of recent developments based on LCA. Constr. Build. Mater. 2009, 23, 28–39. [Google Scholar] [CrossRef]
- Chau, C.K.; Leung, T.M.; Ng, W.Y. A review on life cycle assessment, life cycle energy assessment and life cycle carbon emissions assessment on buildings. Appl. Energy 2015, 143, 395–413. [Google Scholar] [CrossRef]
- Huijbregts, M.A.J. Application of uncertainty and variability in LCA, part I: A general framework for the analysis of uncertainty and variability in life cycle assessment. Int. J. Life Cycle Assess. 1998, 3, 273–280. [Google Scholar] [CrossRef]
- Roh, S.; Tae, S.; Kim, R. Analysis of Embodied Environmental Impacts of Korean Apartment Buildings Considering Major Building Materials. Sustainability 2018, 10, 1693. [Google Scholar] [CrossRef]
- Oregi, X.; Hernandez, P.; Gazulla, C.; Isasa, M. Integrating Simplified and Full Life Cycle Approaches in Decision Making for Building Energy Refurbishment: Benefits and Barriers. Buildings 2015, 5, 354–380. [Google Scholar] [CrossRef] [Green Version]
- Der Kiureghian, A.; Ditlevsen, O. Aleatory or epistemic? Does it matter? Struct. Saf. 2009, 31, 105–112. [Google Scholar] [CrossRef]
- Chouquet, J.; Bodin, O.; Kohler, N. Dealing with sensitivity and uncertainty analysis in integrated building LCA model. In Proceedings of the International Conference on the Applications of Computer Science and Mathematics in Architecture and Civil Engineering, Weimar, Germany, 10–12 June 2003. [Google Scholar]
- Weidema, B.P.; Wesnaes, M.S. Data quality management for life cycle inventories-an example of using data quality indicators. J. Clean. Prod. 1996, 4, 167–174. [Google Scholar] [CrossRef]
- Huijbregts, M.A.J.; Norris, G.; Bretz, R.; Ciroth, A.; Maurice, B.; von Bahr, B. Framework for modelling data uncertainty in life cycle inventories. Int. J. Life Cycle Assess. 2001, 6, 127–132. [Google Scholar] [CrossRef]
- Guo, M.; Murphy, R.J. LCA data quality: Sensitivity and uncertainty analysis. Sci. Total Environ. 2012, 435–436, 230–243. [Google Scholar] [CrossRef] [PubMed]
- Frischknecht, R.; Rebitzer, R. The ecoinvent database system: A comprehensive web-based LCA database. J. Clean. Prod. 2005, 13, 1337–1343. [Google Scholar] [CrossRef]
- Simapro. Available online: http://www.simapro.co.uk/ (accessed on 25 January 2017).
- Hoxha, E.; Habert, G.; Lasvaux, S. Influence of construction material uncertainties on residential building LCA reliability. J. Clean. Prod. 2017, 144, 33–47. [Google Scholar] [CrossRef]
- Kellenberger, D.; Althaus, H.J. Relevance of simplifications in LCA of building components. Build. Environ. 2009, 44, 818–825. [Google Scholar] [CrossRef]
- Ashworth, A. Estimating the life expectancies of building components in lifecycle costing calculations. Struct. Surv. 1996, 14, 4–8. [Google Scholar] [CrossRef]
- Hoxha, E.; Habert, G.; Chevalier, J.; Bazzana, M.; Le Roy, R. Method to analyze the contribution of material’s sensitivity in buildings’ environmental impact. J. Clean. Prod. 2014, 66, 54–64. [Google Scholar] [CrossRef]
- Hopfe, C.J.; Hensen, J.L.M. Uncertainty analysis in building performance simulation for design support. Energy Build. 2011, 43, 2798–2805. [Google Scholar] [CrossRef] [Green Version]
- Nguyen, A.T.; Reiter, S.; Rigo, P. A review on simulation-based optimization methods applied to building performance analysis. Appl. Energy 2014, 113, 1043–1058. [Google Scholar] [CrossRef] [Green Version]
- De Vries, B.J.M.; van Vuuren, D.P.; Hoogwijk, M.M. Renewable energy sources: Their global potential for the first-half of the 21st century at a global level: An integrated approach. Energy Policy 2007, 35, 2590–2610. [Google Scholar] [CrossRef] [Green Version]
- Tian, W.; de Wilde, P. Uncertainty and sensitivity analysis of building performance using probabilistic climate projections: A UK case study. Autom. Constr. 2011, 20, 1096–1109. [Google Scholar] [CrossRef]
- Saltelli, A.; Ratto, M.; Andres, T.; Campolongo, F.; Cariboni, J.; Gatelli, D.; Saisna, M.; Tarantola, S. Global Sensitivity Analysis. The Primer; John Wiley & Sons: Chichester, UK, 2008. [Google Scholar]
- Janssen, H.; Roels, S. Annex 55 Reliability of Energy Efficient Building Retrofitting-Probability Assessment of Performance and Cost Probabilistic Tools; International Energy Agency: Paris, France, 2015. [Google Scholar]
- Favi, C.; Meo, I.; Di Giuseppe, E.; Iannaccone, M.; D’Orazio, M.; Germani, M. Towards a probabilistic approach in LCA of building retrofit measures. Energy Procedia 2017, 134, 394–403. [Google Scholar] [CrossRef]
- EeBGuide. Guidance Document. Part B: Buildings. Operational Guidance for Life Cycle Assessment Studies of the Energy-Efficient Buildings Initiative. 2011. Available online: https://www.eebguide.eu/ (accessed on 1 April 2018).
- Goedkoop, M.; Heijungs, R.; Huijbregts, M.; De Schryver, A.; Struijs, J.; van Zelm, R. ReCiPe 2008: A Life Cycle Impact Assessment Method Which Comprises Harmonised Category Indicators at the Midpoint and the Endpoint Level. Report I: Characterisation-First Edition-VROM–Ruimte en Milieu, Ministerie van Volkshuisvesting, Ruimtelijke Ordening en Milieubeheer. 2009. Available online: http://www.lcia-recipe.net (accessed on 1 April 2018).
- Jungbluth, N.; Frischknecht, R. Implementation of Life Cycle Impact Assessment Methods—Chapter 2: Cumulative Energy Demand. Ecoinvent Report No. 3, Swiss Centre for LCI, Dübendorf, CH. 2010. Available online: http://www.ecoinvent.org (accessed on 1 April 2018).
- IPCC. Climate Change 2007: The Physical Science Basis. Contribution of Working Group I to the Fourth Assessment Report of the Intergovernmental Panel on Climate Change; Cambridge University Press: Cambridge, UK; New York, NY, USA, 2007. [Google Scholar]
- Heijungs, R.; Frischknecht, R. Representing statistical distributions for uncertain parameters in LCA: Relationships between mathematical forms, their representation in EcoSpold, and their representation in CMLCA. Int. J. Life Cycle Assess. 2012, 10, 248–254. [Google Scholar] [CrossRef]
- Nguyen, A.T.; Reiter, S. A performance comparison of sensitivity analysis methods for building energy models. Build. Simul. 2015, 8, 651–664. [Google Scholar] [CrossRef] [Green Version]


| Materials | Thickness (m) | Density (kg/m3) | Thermal Conductivity (W/mK) |  |
| Adhesive mortar | 0.006 | 1400 | 0.540 | |
| EPS | 0.100 | 18 | 0.035 | |
| Adhesive mortar | 0.006 | 1400 | 0.540 | |
| Plasterboard | 0.013 | 680 | 0.200 | |
| Skimcoat | 0.004 | 1200 | - | |
| Primer + Paint | 0.0002 | 1670 | - |
| Materials | Thickness (m) | Density (kg/m3) | Thermal Conductivity (W/mK) | 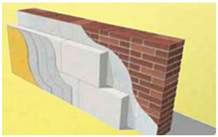 |
| Adhesive mortar | 0.007 | 950 | 0.310 | |
| Cork | 0.120 | 120 | 0.040 | |
| Surface rendering | 0.007 | 950 | 0.310 | |
| Primer + Paint | 0.0002 | 1670 | - |
| Materials | Thickness (m) | Density (kg/m3) | Thermal Conductivity (W/mK) | 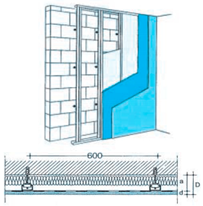 |
| Rockwool | 0.1 | 70 | 0.035 | |
| Vapor barrier | 0.002 | 2700 | - | |
| Metallic frame | - | 7800 | - | |
| Plasterboard | 0.013 | 680 | 0.200 | |
| Skimcoat | 0.004 | 1200 | - | |
| Primer + Paint | 0.0002 | 1670 | - |
| LCA Parameter | Design Option A | Design Option B | Design Option C | Mass Quantity (kg) | Unitary Impact for Material CC—(kg CO2 eq/kg) | |||
|---|---|---|---|---|---|---|---|---|
| PDF * | Reference for PDF | PDF for Phases A1–A3 | PDF for Phases C1–C4 | Reference for PDF | ||||
| Adhesive mortar and surface rendering | X | Tri (6.38; 7.39; 6.72) | [11] | Nor (1.376;0.366) | Nor (0.515;0.220) | Eco-Invent DB3.1 with MC analysis | ||
| X | Tri (9.48; 10.97; 9.98) | [11] | Nor (1.376;0.366) | Nor (0.515;0.220) | Eco-Invent DB3.1 with MC analysis | |||
| Plasterboard | X | X | Tri (8.08; 9.35; 8.50) | [11] | Nor (0.399;0.055) | Nor (0.518;0.223) | Eco-Invent DB3.1 with MC analysis | |
| EPS | X | Tri (1.71; 1.98; 1.80) | [11] | Nor (4.46; 0.344) | Nor (0.118;0.064) | Eco-Invent DB3.1 with MC analysis | ||
| Cork | X | Tri (13.68; 15.84;14.40) | [11] | Nor (1.58; 0.163) | Nor (0.502;0.202) | Eco-Invent DB3.1 with MC analysis | ||
| Rockwool | X | Tri (6.65; 7.70; 7.00) | [11] | Nor (1.45; 0.142) | Nor (0.496;0.208) | Eco-Invent DB3.1 with MC analysis | ||
| Vapor barriers | X | Tri (0.38; 0.45; 0.41) | [11] | Nor (4.96; 0.946) | Nor (0.505;0.212) | Eco-Invent DB3.1 with MC analysis | ||
| Fixing screw (carbon steel) | X | Tri (0.13; 0.15; 0.14) | [11] | Nor (2.03; 0.446) | Nor (0.005;0.002) | Eco-Invent DB3.1 with MC analysis | ||
| C-shape frame (carbon steel) | X | Tri (0.72; 0.83; 0.75) | [11] | Nor (2.03;0.446) | Nor (0.005;0.002) | Eco-Invent DB3.1 with MC analysis | ||
| U-shape frame (carbon steel) | X | Tri (0.19; 0.22; 0.20) | [11] | Nor (2.03;0.446) | Nor (0.005;0.002) | Eco-Invent DB3.1 with MC analysis | ||
| Skim coat | X | X | Tri (0.23; 0.26; 0.24) | [11] | Nor (0.103; 0.012) | Nor (0.504;0.220) | Eco-Invent DB3.1 with MC analysis | |
| Primer and paint | X | X | X | Tri (0.32, 0.37; 0.33) | [11] | Nor (5.26; 8.93) | Nor (0.089;0.049) | Eco-Invent DB3.1 with MC analysis |
| LCA Parameter | Design Option A | Design Option B | Design Option C | Quantity | Unitary Impact for Material | |
|---|---|---|---|---|---|---|
| PDF * | PDF for Phase B6 | Reference for PDF | ||||
| Energy needs for heating (natural gas) | X | Nor (14.12; 2.35) [kWh] | Nor (0.26; 0.04) (kg CO2 eq/kWh) | Eco-Invent DB3.1 with MC analysis | ||
| X | Nor (13.79; 2.34) [kWh] | Nor (0.26; 0.04) (kg CO2 eq/kWh) | Eco-Invent DB3.1 with MC analysis | |||
| X | Nor (14.21; 2.35) [kWh] | Nor (0.26; 0.04) (kg CO2 eq/kWh) | Eco-Invent DB3.1 with MC analysis | |||
| Overall system efficiency for heating | X | X | X | Uni (0.6; 1) | - | - |
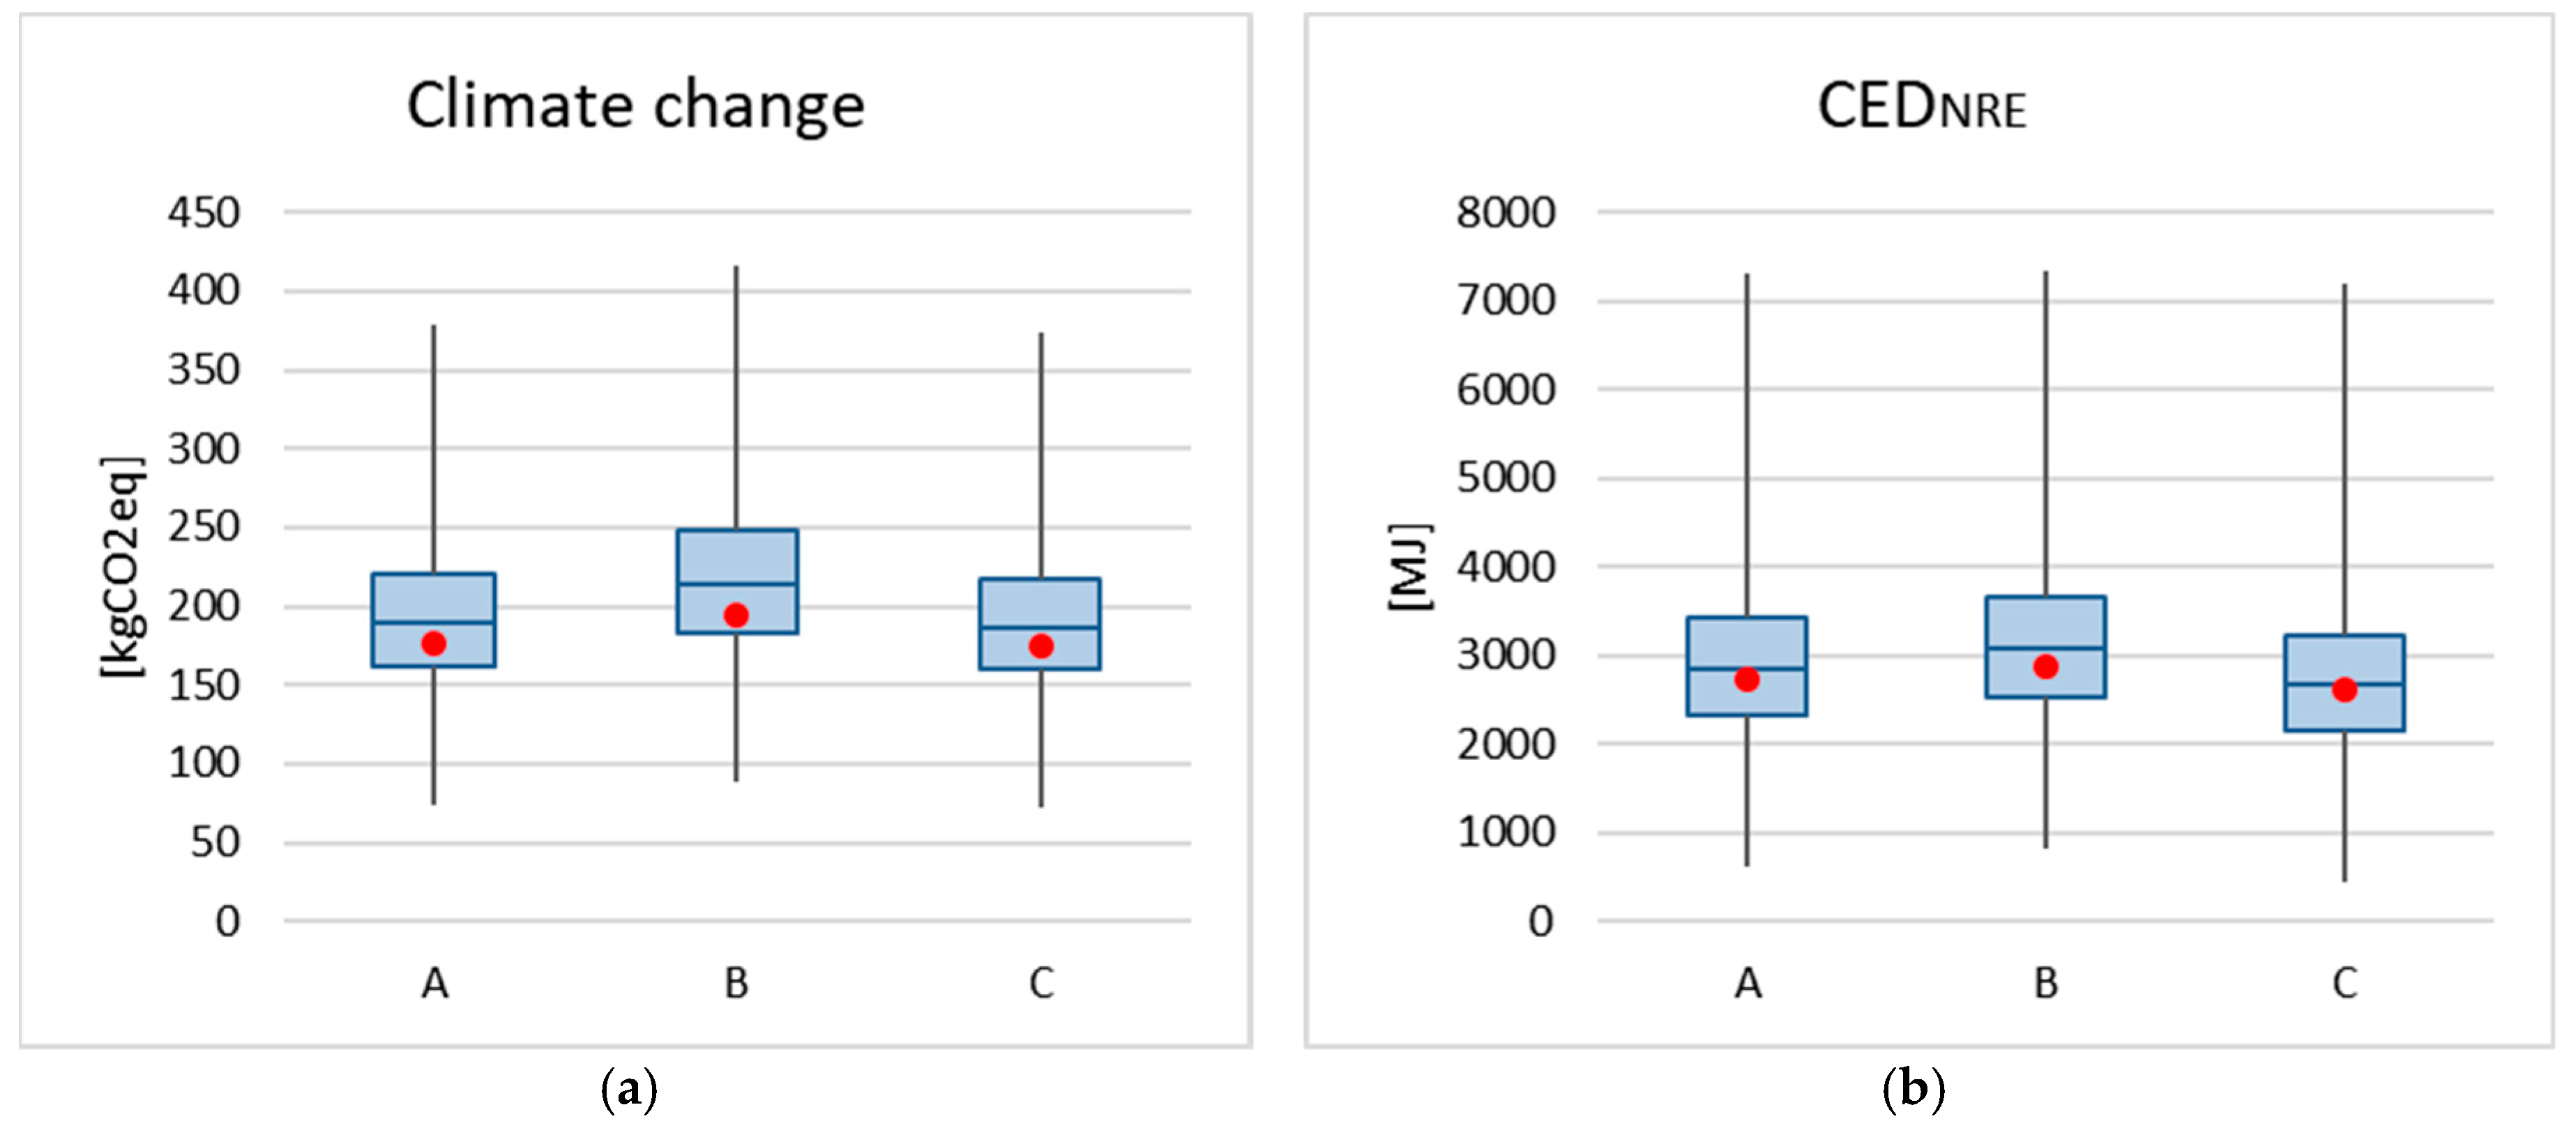
| Design Options | Climate Change Indicator | CED-NRE Indicator | ||
|---|---|---|---|---|
| Median Value | Standard Deviation | Median Value | Standard Deviation | |
| A (EPS) | 193.05 kg of CO2 eq | 43.90 | 2932.20 MJ | 831.30 |
| B (cork) | 217.85 kg of CO2 eq | 47.90 | 3138.80 MJ | 841.20 |
| C (Rockwool) | 190.52 kg of CO2 eq | 43.47 | 2750.40 MJ | 818.80 |
| Phase | Climate Change Indicator | CED-NRE Indicator | ||||
|---|---|---|---|---|---|---|
| A (EPS) | B (Cork) | C (Rockwool) | A (EPS) | B (Cork) | C (Rockwool) | |
| Production + Maintenance | 13.65% | 20.63% | 12.16% | 14.48% | 20.36% | 9.83% |
| Use | 81.71% | 72.97% | 83.14% | 85.29% | 79.33% | 89.94% |
| End of Life | 4.64% | 6.40% | 4.70% | 0.22% | 0.30% | 0.23% |
© 2018 by the authors. Licensee MDPI, Basel, Switzerland. This article is an open access article distributed under the terms and conditions of the Creative Commons Attribution (CC BY) license (http://creativecommons.org/licenses/by/4.0/).
Share and Cite
Favi, C.; Di Giuseppe, E.; D’Orazio, M.; Rossi, M.; Germani, M. Building Retrofit Measures and Design: A Probabilistic Approach for LCA. Sustainability 2018, 10, 3655. https://doi.org/10.3390/su10103655
Favi C, Di Giuseppe E, D’Orazio M, Rossi M, Germani M. Building Retrofit Measures and Design: A Probabilistic Approach for LCA. Sustainability. 2018; 10(10):3655. https://doi.org/10.3390/su10103655
Chicago/Turabian StyleFavi, Claudio, Elisa Di Giuseppe, Marco D’Orazio, Marta Rossi, and Michele Germani. 2018. "Building Retrofit Measures and Design: A Probabilistic Approach for LCA" Sustainability 10, no. 10: 3655. https://doi.org/10.3390/su10103655
APA StyleFavi, C., Di Giuseppe, E., D’Orazio, M., Rossi, M., & Germani, M. (2018). Building Retrofit Measures and Design: A Probabilistic Approach for LCA. Sustainability, 10(10), 3655. https://doi.org/10.3390/su10103655