1. Introduction
It is one of the important topics to construct “Apply what you’ve learned” from the curricula of science and technology in higher education [
1]. Project-based learning (PBL) is considered as an important way to effectively develop university students’ integration and application abilities in the field of industrial education [
2,
3]. Many studies have showed that the use of PBL can indeed cultivate independent thinking, problem discovery and resolution, multiple ways of thinking, and meaningful learning among university students [
4,
5,
6,
7]. The effectiveness of PBL not only improves students’ problem-solving ability, but also enhances the motivation and attitude of their learning [
8], thus enhancing their employability [
1]. Warin et al. [
9] point out that PBL has several characteristics, which are usually multidisciplinary and possibly long-term effect (i.e., in weeks or months). To create a new product or performance, participate in a real task, and have general routines followed by flexible steps, are all factors that are integrated in project-based application curricula.
In the past, research on this topic and PBL focused on the two main aspects of the capstone course [
10,
11] and the capstone project [
12]. The former of the capstone course is the final and peak learning experience of university education. The former method enables students to integrate and deepen what they have learned in the university, so that learning can be completed steadily. It is a very important experience for senior students [
10]. The latter capstone project is also known as the capstone experience, the culminating project, and the senior exhibition, which can be regarded as a multifaceted assignment designed for those students who have high academic and intellectual skill; this usually is implemented in the last year of their high school or junior high school, or at the end of an academic course or learning pathway [
12]. For example, ChanLin [
13] applies technology to PBL in an integrated manner and teaches students to use various Web material sources, and the use of different software to record, analyze and present information. Li [
14] takes the teaching experiment method, carrying on four years of project-based design and experiment-oriented curricula to verify the effectiveness of the project making curricula.
The definition of project-based “Learning” (PBL) in this study is based on the philosophy of constructivism in order to eliminate the phenomenon of knowledge fossilization after learning. The item of project making is to lay emphasis on the writing of application software systems of solar cell modules, photovoltaic technologies, Internet of Things (IoT), Information Technology (IT), and so on. The definition of the project-based “Curricula” is that the curricula design is to arrange complex and real tasks as the core of the project. It focuses on the integration of knowledge learning in different technology areas. Learners need to go through a series of exploratory actions and situations of cooperative learning, in order to learn the knowledge of problem solving [
15], and skills of flexible use for the knowledge. The implementation of the curricula has the characteristics of teachers’ interdepartmental support and introduction of enterprise teachers’ guidance. Among the learning units in the curricula, emphasis is placed on working in tandem with the project-making of technological applications and providing structured features with highly transverse linkage and longitudinal integration for enhancing education of sustainability. The structure of the paper begins with the learning theory of “Learning by doing” to explore the assessment tool of learning effectiveness based on project-based curricula. Finally, the feasibility of the tool was confirmed by the study through empirical survey.
2. Literature Review
2.1. Learning Theory
Project-based curricula planning and implementation is based on the theory of “Learning by doing” put forward by John Dewey. Dewey was a pragmatist whose central idea was that the truth of theory, the justice of action, or the value of a common practice and custom are all determined by its effectiveness. He emphasized durability, portability, and practicality [
16]. “Learning by doing” is one of Dewey’s most important educational ideas, which can be regarded as the product of empiricism, behaviorism and progress theory. In other words, creating sufficient conditions for learners to “Experience” is the key to education [
16]. The significance of Dewey’s experience is that it contains the dual semantics of both the content and result of experience (i.e., what men do) and the activity and process of experience (i.e., how men act) [
17]. Dewey’s experience-based philosophy emphasizes not only “Something to do”, but also “Something to learn”. He advocated letting learners in the experiential learning situation realize” Learning by doing”, through the learners self-reflective thinking to understand the relationship between things, so that the learning becomes “A matter of course” [
17].
Dewey advocated that the crucial premise of education should be closely related to the learner. He believed that the approach to truth is through observation and experimentation and that knowledge should be the product from learning by doing. Unless it is generated from the experiment results, there is no true knowledge and understanding of things [
18]. Dewey also believed that through the process of reflective thinking, learners will be able to transform the original experience, without introspection, into a deeper experience of self-examination. The learned meaning of this kind of autonomous learning is formed by the students themselves from the familiar experience of the individual, rather than acquired by the teachers’ extrinsic indoctrination, while the experience gained by the students’ own learning will internalize the learning result, and be profound and long lasting. Therefore, it is vital to provide the necessary auxiliary environment for learners to promote their learning experience.
2.2. Evaluation of the Learning Effectiveness of Project-Based Curricula
PBL, an effective way of learning, can be described as follows [
2,
7,
19]:
- (1)
To integrate different disciplines through the special project of knowledge and skills;
- (2)
To arrange complicated homework, design situations that can promote learning motivation, develop individual meta-cognitive strategies, and utilize cooperative learning, so that learners can not only acquire knowledge, but also skills to solve problems;
- (3)
To learn how to apply knowledge and solve the problems.
The adoption of PBL enables the implementation of project-making curricula to be realized with the learning effect of integration and application. Students will be able to improve their learning effectiveness of professional skills in their own professional course.
The evaluation of the effectiveness of PBL is usually based on formative and summative evaluations. For example, the research of Chien and Liu [
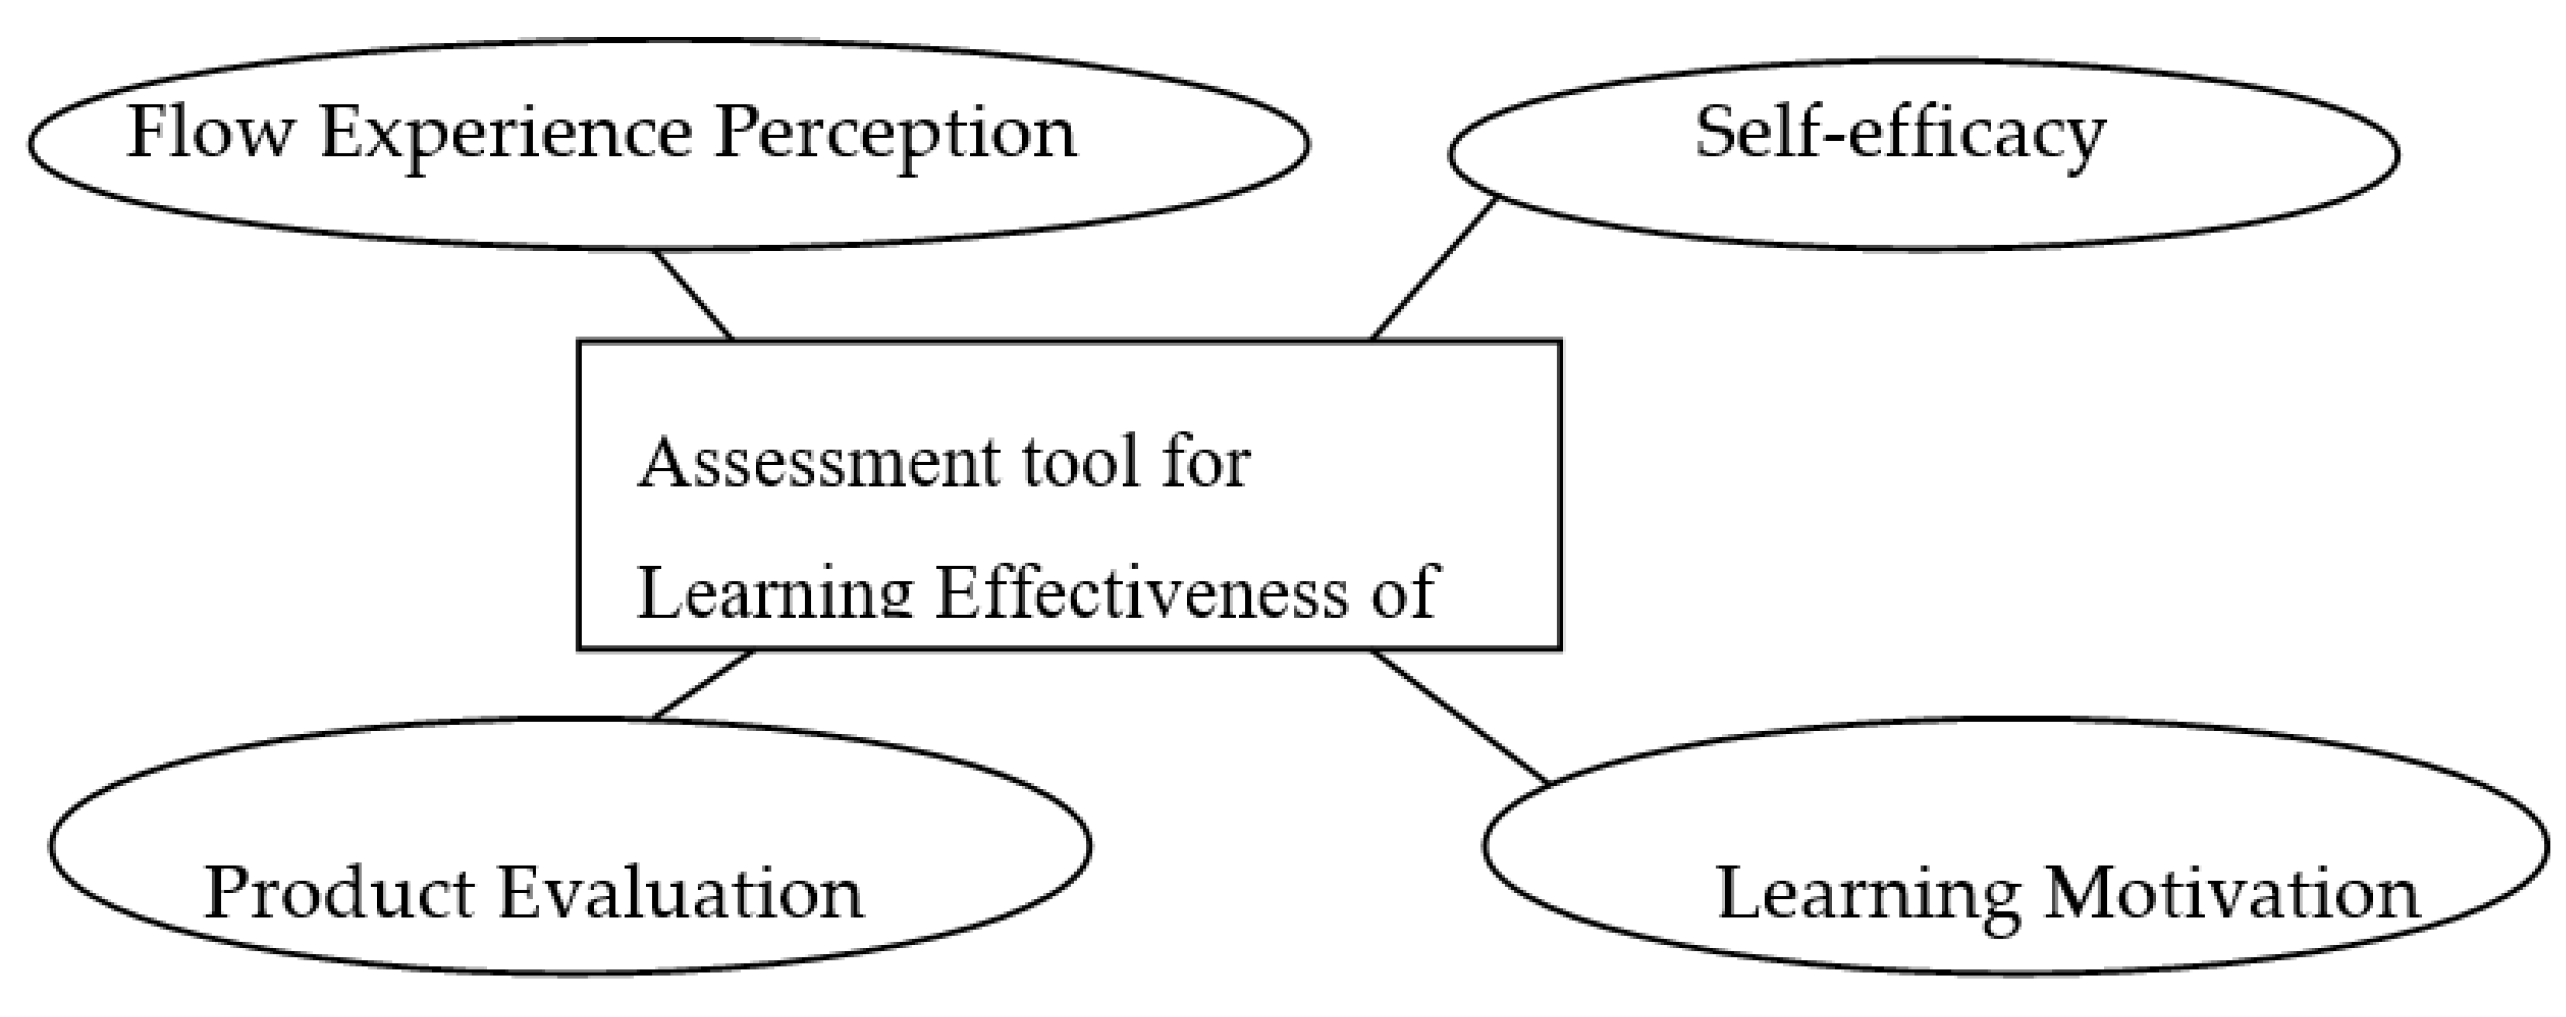
2] in quantitative data collection is to use learning motivation scales, game-making flow meters, and Game Maker learning self-efficacy scales. In the collection of qualitative data, the researchers’ observation record, teaching interviews, digital game project production and learning process files, etc. are adopted [
20]. After the literature review in this study, four subscales for project making such as flow experience perception, self-efficacy, product evaluation, and learning motivation are developed as a tool for evaluating the learning effectiveness. The structure of this assessment tool can be regarded as
Figure 1.
2.2.1. “Flow Experience Perception” Subscale
According to the definition from Qiu [
21], the so-called “Flow” is fully concentrated to and engaged in the immediate activity, as a result that anything else is insignificant. It is in a state of loss of self-consciousness and regardless of the passage of time. Every behavior, action, and thought, with the previous initiatives, is issued naturally and inevitably, as if it were of playing Jazz music. Experience itself is so pleasant that people are willing to do it, even if it costs too much. Not for anything else, just for the sake of the activity itself, and doing it for the sake of doing [
22,
23,
24].
Measuring the degree of perceived flow from students after completing the product generated by the project making can help us understand the learning effectiveness of the project making. Chien and Liu [
2] designed the scale of the “Digital game production flow meter”. The scale was composed of two subscales; they include the “Heart flow experience perception scale” and the “Flow experience self-perception scale”. Csikszentmyhalyi [
25] uses Experience Sampling Method for the study of flow; four indexes are used as the basis. These are:
Challenges and Skills: these two scoring ratios are used to determine whether personal experience has entered a flow state.
Experience Quality: the perception of the activity by the tester and the distinction between the seven grades, such as obsession, concentration, devotion, selflessness and sense of achievement.
Activity: asks the tester to describe the activities they are engaged in.
Motivation: asks the tester to evaluate individual motivation.
Based on the above increase of “Clear target” indexes, the first draft of the items is shown in
Table 1 below.
2.2.2. “Self-Efficacy” Subscale
(1) Definition of Self-Efficacy
Students learning self-efficacy has a strong predictive ability for academic achievement [
3,
26,
27,
28,
29]. Self-efficacy is defined as: a person believes that he can successfully achieve a particular result [
30]. Students with high self-efficacy can more quickly participate in learning activities, have a more active learning attitude, and are willing to work hard spontaneously. In the face of difficulties, there is a higher persistence and less anxiety. They tend to accept challenging tasks, are willing to spend more time pursuing the goal, experience in-depth understanding before handling things, and are able to self-regulate and adopt better strategies [
4,
5,
27,
31,
32]. Dellingera et al. [
33] pointed out that efficacy belief has both situation and task specificity. The efficacy belief will be different depending on strength, level and generality. The “Strength” refers to how strong the learner’s belief is to have the ability to accomplish a task. The “Level” refers to the efficacy belief being different because of the difficulty of tasks, or tasks with different levels. “Generality” refers to the scope of a task which can be generalized into another similar activity.
(2) Assessment Indexes
Bandura [
26] uses “Multi-level self-efficacy scale” to measure students’ learning self-efficacy, which can be divided into four dimensions: ability, effort, persistence, and learning method. On the basis of the four dimensions, Hong, Huang, and Qiu [
34] simplified the indexes of learner’s self-efficacy to three dimensions: ability, effort and persistence, and learning method. This study adopted the previous mentioned four dimensions: ability, effort, persistence, and learning methods, and the first draft of the items is shown in
Table 2.
2.2.3. “Product Evaluation” Subscale
The planning and implementation of higher education curricula emphasizes the acquisition of students’ broad skills, knowledge, and attitude so as to successfully guide their future career development in the job market [
35,
36]. PBL is an integrated learning approach and an important way of achieving this goal [
8]. In particular, it is important for learners to acquire integrated knowledge, skills, and attitudes instead of focusing on competition in learning grades among peers.
Filho, Shiel, and Paco [
8] point out that integrated project learning should pay attention to: commitment, knowledge, diversification, dynamism, and communication. On the assessment of project outcomes, Zhang et al. [
37] use six dimensions to assess the effectiveness of project making. They are: good teaching, clear goals, appropriate workload, generic skills, motivation, and information technology (IT) usage. Warin et al. [
9] explore project making, adopting new PBL methods, and applying them to STEM (Science, Technology, Engineering, and Mathematics) subjects. They also evaluate the project outcomes by using following two dimensions: “Application method” and “Software skill development”. The first draft of the items is shown in
Table 3 below.
2.2.4. “Learning Motivation” Subscale
The main types of motivation are: extrinsic motivation, which relies on external things, such as reward temptation to motivate learners’ learning behavior; and intrinsic motivation, which relies on the learner’s fondness for the activity itself to initiate learning action [
21,
24,
38].
Chienand Liu [
2] designed five indexes for the measurement of learning motivation. (1). Value: intrinsic motivation orientation. (2). Value: extrinsic motivation orientation. (3). Value: the value of homework. (4). Expectation: the control belief of learning. (5). Expectation: the self-efficacy belief in learning and achievement. The motivation scale used by Huang, et al. [
39] includes four variables, namely, concentration, relationship of immediate concern to oneself, self-confidence and sense of satisfaction. Among them, “Concentration” refers to whether it can arouse curiosity or interest in students so that they pay attention to it. “Relationship of immediate concern to oneself” refers to whether students perceive if the teacher’s teaching can meet the learning needs, andifthe knowledge they are learning is useful. “Self-confidence” concerns whether a student can perceive that he or she will succeed in completing the task of learning through many efforts. “Sense of satisfaction” is the internal and external rewards that are received from the teaching.
This study uses the two dimensions of value and expectation, and the first draft of the items is shown in
Table 4 below.
3. Methodology
Literature Review: The exploration and analysis of the literature is to establish four drafts of the subscale to form a draft scale, to serve as a basis for discussion and revision by the experts of focus group.
Focus group method: Focus group discussion is one of the most popular qualitative research methods in the social sciences, with a particular emphasis and application in the developmental program evaluation [
40]. The focus group meeting was designed to establish the content validity of the four subscales required for the evaluation of learning effectiveness. Eight experts were invited in the fields of the curricula, IT, Internet of Things (IoT), and solar energy nanomaterials. A draft of the scale was sent out one month before the meeting, and two focus group meetings were held to jointly discuss and revise the draft of the total scale. Based on the literature review and expert consultation, flow experience perception, self-efficacy, product evaluation and learning motivation were confirmed as the 4 assessment subscales.
Survey Research Method
● Development of research instruments: The assessment tool consists of four subscales, flow experience perception (11 items), self-efficacy (17 items), product evaluation (19 items), learning motivation (21 items), and demographic information (i.e., gender and identification). Each subscale item was compiled in accordance with the operational definitions, as well as behavioral patterns displaying the learning effectiveness for PBL. The items were designed on the basis of a 5-point Likert scale (1 = not important, 5 = very important).
A draft scale was pretested after it is revised and confirmed by the focus group experts. The pre-test stage was conducted by the third-grade undergraduate students majoring in the fields of the IT, IoT, and solar energy who are performing the project-making curricula in a university of science and technology. Approximately 37 copies of valid questionnaires were recovered. After analysis, the reliability of the scale was established by taking Cronbach’s Alpha value greater than 0.7 as the item.
● Statistical analysis: The official test was conducted two months after the implementation of the pre-test in all the third-grade undergraduate students of 4universities of science and technology. The official test was performed at the end of the semester for the students to complete the software of the project making.
In total, 232 returned copies, or 77.33% of the questionnaires, were valid. In terms of students’ sampling, an example of PBL on Nanotechnology curricula, included the solar raw materials industry in the upstream end (e.g., pure metals, iron alloys and titanium metal, etc. and other metal materials, silicon chip production); the solar manufacturing industry in the midstream end (e.g., amorphous silicon thin film solar cells and modules; mono-crystalline silicon, polycrystalline silicon solar cells and modules; silicon solar cells and modules; poly-silicon solar cells and modules; silicon, thin film solar cells), and the solar module and integration industry in the downstream end (e.g., small-scale solar power systems, solar electric power converter and solar power system).
In statistical analysis, in addition to presenting the scale pre-test reliability, the Independent Samples Test was used to examine whether there were differences of views between male and female students in the subscales. By using Multiple Regression Analysis, take the four subscales of the product evaluation (X
1), self-efficacy (X
2), flow experience perception (X
3), and learning motivation (X
4) as the “Predictor” and project making learning effectiveness (Y) as the “Criterion”. By using independent variables (i.e., subscales) and an estimated multiple regression equation, a prediction of the dependent variable (i.e., learning effectiveness) can be made. Then, the following multiple regression equation can be established:
4. Results
4.1. Reliability of the Scale in the Pre-Test
The overall reliability of the total scale reached an excellent level by setting the Cronbach’s Alpha value at 0.976. The results of the pre-test reliability analysis are shown in
Table 5.
4.2. Formal Test Results Analysis
The subjects under test were undergraduate junior students. The test was conducted at the end of the semester during the same week for finishing implementation of the project-making curricula of the solar nanotechnology. Among them, 143persons were male students (61.6%) and 89 persons were female students (38.4%). The Cronbach’s Alpha value was 0.987, so that the overall reliability of the scale reached an excellent level.
4.3. Difference Test in the Average Number of Male and Female Students in the Project Making
In order to understand the PBL of the professional applications, the Independent-Samples T Test was used to see if there were any differences of views between male and female students on the scales. The results are shown in
Table 6.
As a result, the items have significant differences of views between male and female students on the overall scale, shown in
Table 7.
4.4. Regression Analysis
The purpose of the regression analysis is to understand the extent to which the subscales can explain the learning effectiveness of the total scale.
Table 8 provides the relevant data for the stepwise regression of the following four modes.
Mode 2: The multivariate correlation coefficient (R) of the independent variables Eva (i.e., product evaluation), Eff (i.e., Self-efficacy) with respect to the dependent variable is equal to 0.991. The R squared is equal to 0.981 and the R squared after the adjustment is equal to 0.981. The standard error is 9.678, and the R squared change quantity is 0.074. According to the coefficient of determination, R squared (i.e., Multiple Determination Coefficient), the “Self-efficacy” in model 1 can explain 90.7% of the total variance correlated to the dependent variable of the “Project making learning effectiveness”. In model 2, the Eva and Eff accounted for 98.1% explanation of the total variance, and 7.4% explanation of the total variance can be improved by the addition of the independent variable Eff.
Mode 3: variables that include in the regression model are Eva, Eff, and Flo. The multivariate correlation coefficient of the project making overall score Tal with respect to these variables is 0.997. The combined explanation variance is 99.4%, and the Flo could improve 1.3% of the total explanation variance. Similarly, in model 4, the multivariate correlation coefficient of the variables Eva, Eff, Flo, Mov with respect to the project making overall score Tal is 1. The combined explanation variance is 100%, and the Mov could improve 0.6% of the total explanation variance.
The results of Collinearity Diagnostics are shown in
Table 9. The maximum Condition Index (CI) value shown in Mode 4 is 40.052, which is greater than 30, indicating that there is a multi-collinearity problem among independent variables. However, the Variance Proportions of the variables Eva (0.39) and Eff (0.35) shown in the Table are not high enough, which indicates that the multi-collinearity problem is not serious and still within the acceptable range.
Based on the above relevant data, the four subscales of learning motivation, product evaluation, self-efficacy, and flow experience perception, are used to predict the learning effectiveness of the project making. The summary of the stepwise multiple regression analysis is shown in
Table 10. The results indicate that the multivariate correlation coefficient of the learning effectiveness of the project making predicted by the four predictable variables of the four subscales is 1.000. The combined explanation variance is 1.000. That is to say, the four predictable variables can predict the students’ learning effectiveness of the project making up to 100%.
From the observation of the explanation variance among individual variables, the prediction power of “Product evaluation” reaching 90.7% is the best. The rest orders are: “Self-efficacy” 7.4%, “Flow experience” 1.3%, and “Learning motivation” 0.6%. From the standardized regression coefficient observation, the value of coefficients of the four variables, namely, product evaluation (X1), self-efficacy (X2), flow experience perception (X3), and learning motivation (X4) are all positives. This means that the effect of the four variables on the project making learning effectiveness (Y) a positive relationship. The four predictable variables with respect to the project making, namely, learning motivation, product evaluation, self-efficacy, and flow experience perception, can be used as the criterion variables to completely and positively predict the “Learning effectiveness” of the students.
Therefore, the standardized regression equation obtained is as follows:
The original regression equation is as follows:
5. Discussion
5.1. Flow Experience Perception Positively Predicts the PBL Effectiveness
The results of this study are consistent with those of Csikszentmyhalyi [
22,
23] and Qiu [
21]. The results show that the project making “Flow experience perception” subscale contains indexes, such as clear goals, challenges and skills, empirical quality, activity, motivation, and so on. It is enough to fully perceive the flow experience of the learners. From the differences of views between male and female students, the main objections should be on two indexes: “Clear goals” and “Empirical quality”. In view of the implementation of the PBL, the male and female students should pay attention to how to operate the next action to achieve the current goal, and the step-by-step actions to accomplish the goal. The project making activities should focus on the learning effect of the activity itself, and try to make learners feel engaged with the activities, and achieve different levels of effects such as obsession, concentration, devotion, selflessness and sense of achievement.
5.2. Self-Efficacy Positively Predicts the PBL Effectiveness
The results of this study are consistent with those of Bandura [
26], Pajares and Kranzler [
29], and Pajares [
41]. The results show that student learning self-efficacy has a strong ability to predict the consistent results of academic achievement. The different views between male and female students are mainly reflected in the two indexes of “Ability” and “Learning method”. In view of the implementation of the PBL, male and female students should pay attention to the reinforcement of these two indexes in the learning guidance of self-efficacy.
5.3. Product Evaluation Positively Predicts the PBL Effectiveness
The results of this study are consistent with those of Filho, Shiel, and Paco [
8], as well as Sterling and Thomas [
42]. The results show that it is important for individual learners to acquire integrated knowledge, skills and attitudes in the project making curricula, rather than academic grades in competition between peers. The following four indexes, namely, clear goals, flexible subjects design, application methods, and value skills development, can be used as the four evaluation indexes of the project product. The different views between male and female students are mainly reflected in a single index of “Clear goal”. In view of the implementation of the PBL, male and female students should pay attention to the desired goal that the subject wants to achieve, which is particularly important for project making.
5.4. Learning Motivation Positively Predicts the PBL Effectiveness
The results of this study are consistent with those of Qiu [
21], Csikszentmyhalyi [
24], and Chien and Liu [
2]. The results show that in the course of PBL activities, learners should be encouraged to enjoy the project making activities themselves, so as to arouse learning action. The different views between male and female students are mainly reflected in the two indexes of “External goal orientation (value)” and “Learning control beliefs (expectation)”. In view of the implementation of the PBL, male and female students’ should pay attention to the value of external goals and the reinforcement of expectations.
5.5. Subscales Can Positively Predict the Learning Effectiveness
The significance of the original regression equation obtained in this study is:
It means that, if students have high scores on the four scales, namely, strong learning motivation, good product evaluation results, high self-efficacy, and positive flow experience perception, it is predictable that these students “Learning effectiveness” in the PBL must be excellent.
6. Conclusions
This study is based on Dewey’s theory of “Learning by doing” to develop the integration and application abilities and cultivate independent thinking among university students, to achieve the educational philosophy of finding and solving problems, diversification of thinking, and meaningful learning, thereby conducting the effectiveness evaluation on the PBL for enhancing education of sustainability. The study through the process of literature analysis, focus group expert discussion, and survey research, establishes four project making subscales, namely, flow experience perception, self-efficacy, product evaluation, and learning motivation, suitable for forming a learning effectiveness assessment tool on the project making curricula of scientific and technological education.
The multiple regression equation obtained from this study shows that the four subscales of the students’ learning motivation, product evaluation, self-efficacy and flow experience perception, can positively and comprehensively predict students’ “Learning effectiveness” on project making. As a result, this scale can be applied practically to the evaluation of the learning effectiveness on the project making curricula.
However, in this study, the objects to be tested with these subscales are the students who are performing the project making. Formal questionnaires will be filled out after the students have completed the project curricula. There is no experimental study on teaching differences before and after learning. In addition, the selection of core competencies and curriculum group contents in the PBL curricula is not in the scope of this study. It is suggested that future study can further strengthen of the establishment of the core competencies and the planning and design of the project making curricula in the PBL curricula, using the tool obtained from this study for teaching experiments to evaluate the learning effectiveness of PBL.


