Ecological Footprint, Foreign Direct Investment, and Gross Domestic Production: Evidence of Belt & Road Initiative Countries


Abstract
:1. Introduction
2. Literature Review
2.1. Three Hypotheses on FDI and Pollution
2.2. Literatures on Different Target Regions
2.3. Literatures on PVAR
3. Theoretical Analysis
3.1. Correlation between FDI and Environment
3.2. PVAR Model Specification
4. Data Description
5. Econometric Analysis and Results
5.1. Model Specification
5.2. Estimation Procedure
5.2.1. Unit Root Test
- Ho: all panels contain unit roots
- Ha: at least one panel is stationary
5.2.2. Lag Length Selection
5.2.3. Co-Integration Test
5.2.4. PVAR Granger Causality Test
- Ho: Excluded variable does not Granger-cause Equation variable
- Ha: Excluded variable Granger-causes Equation variable
5.3. Results of PVAR and Corresponding FEVD
5.3.1. Results of PVAR
5.3.2. Results of the FEVD Estimates
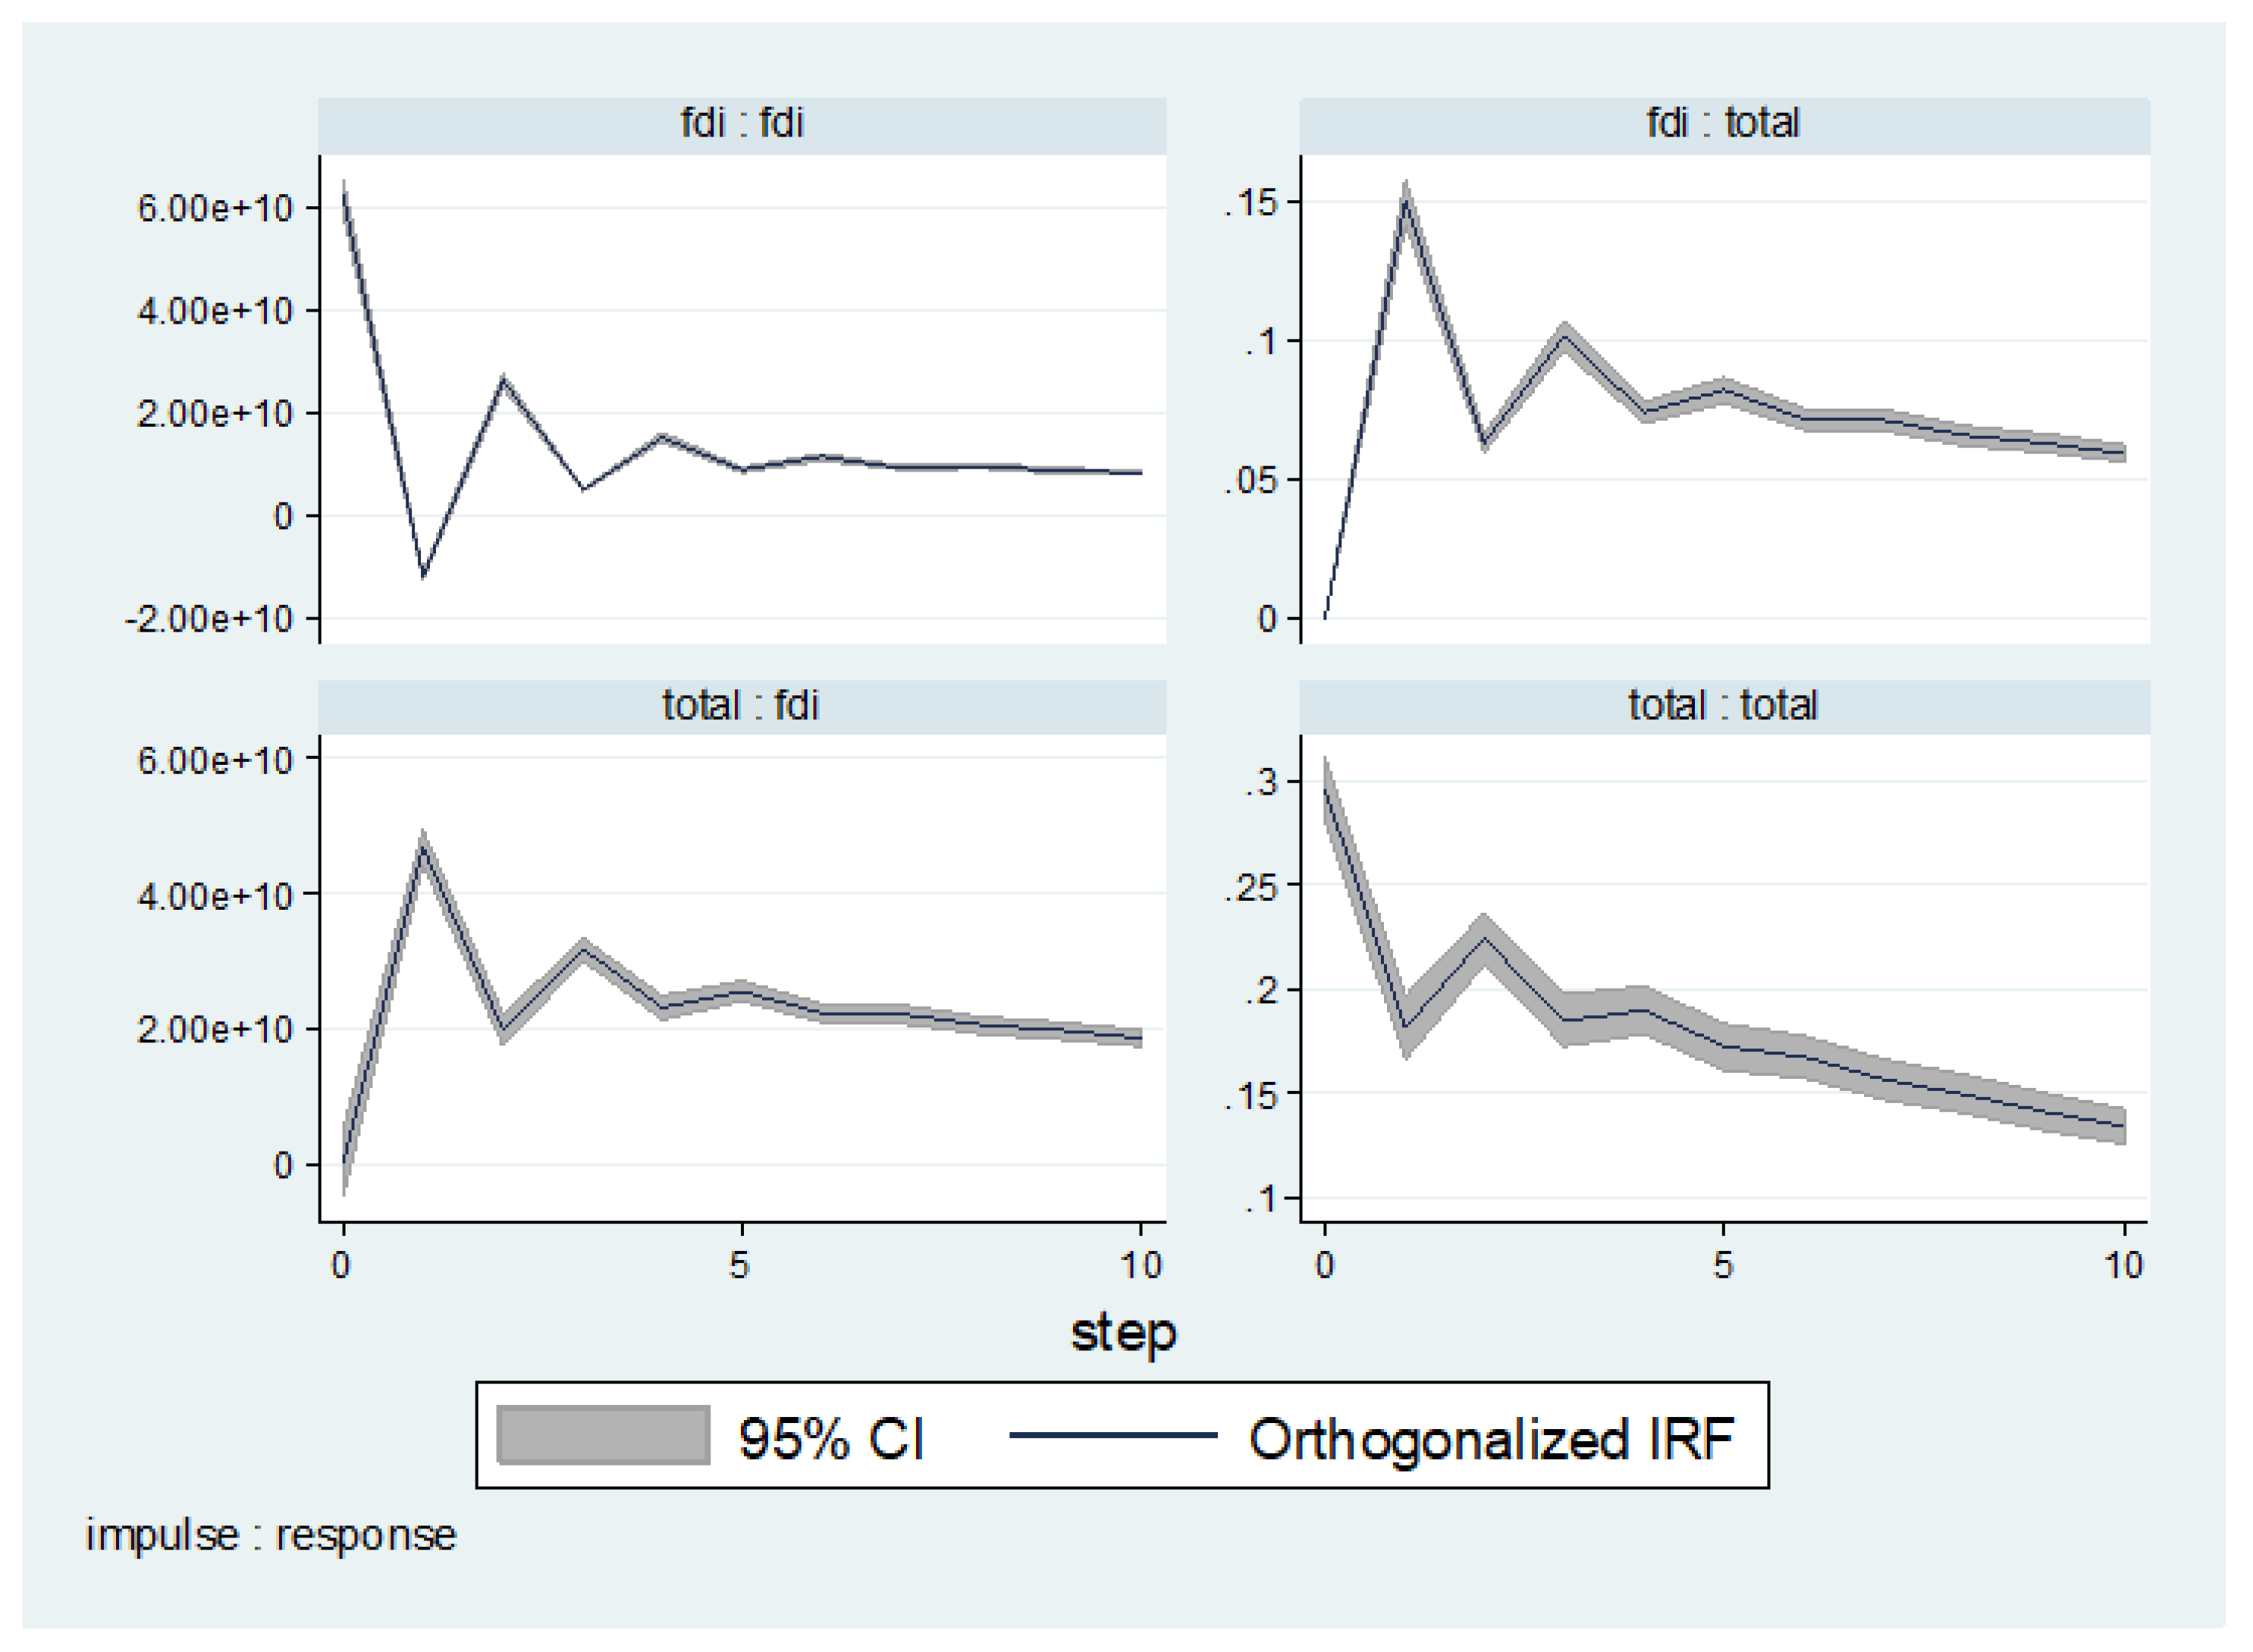
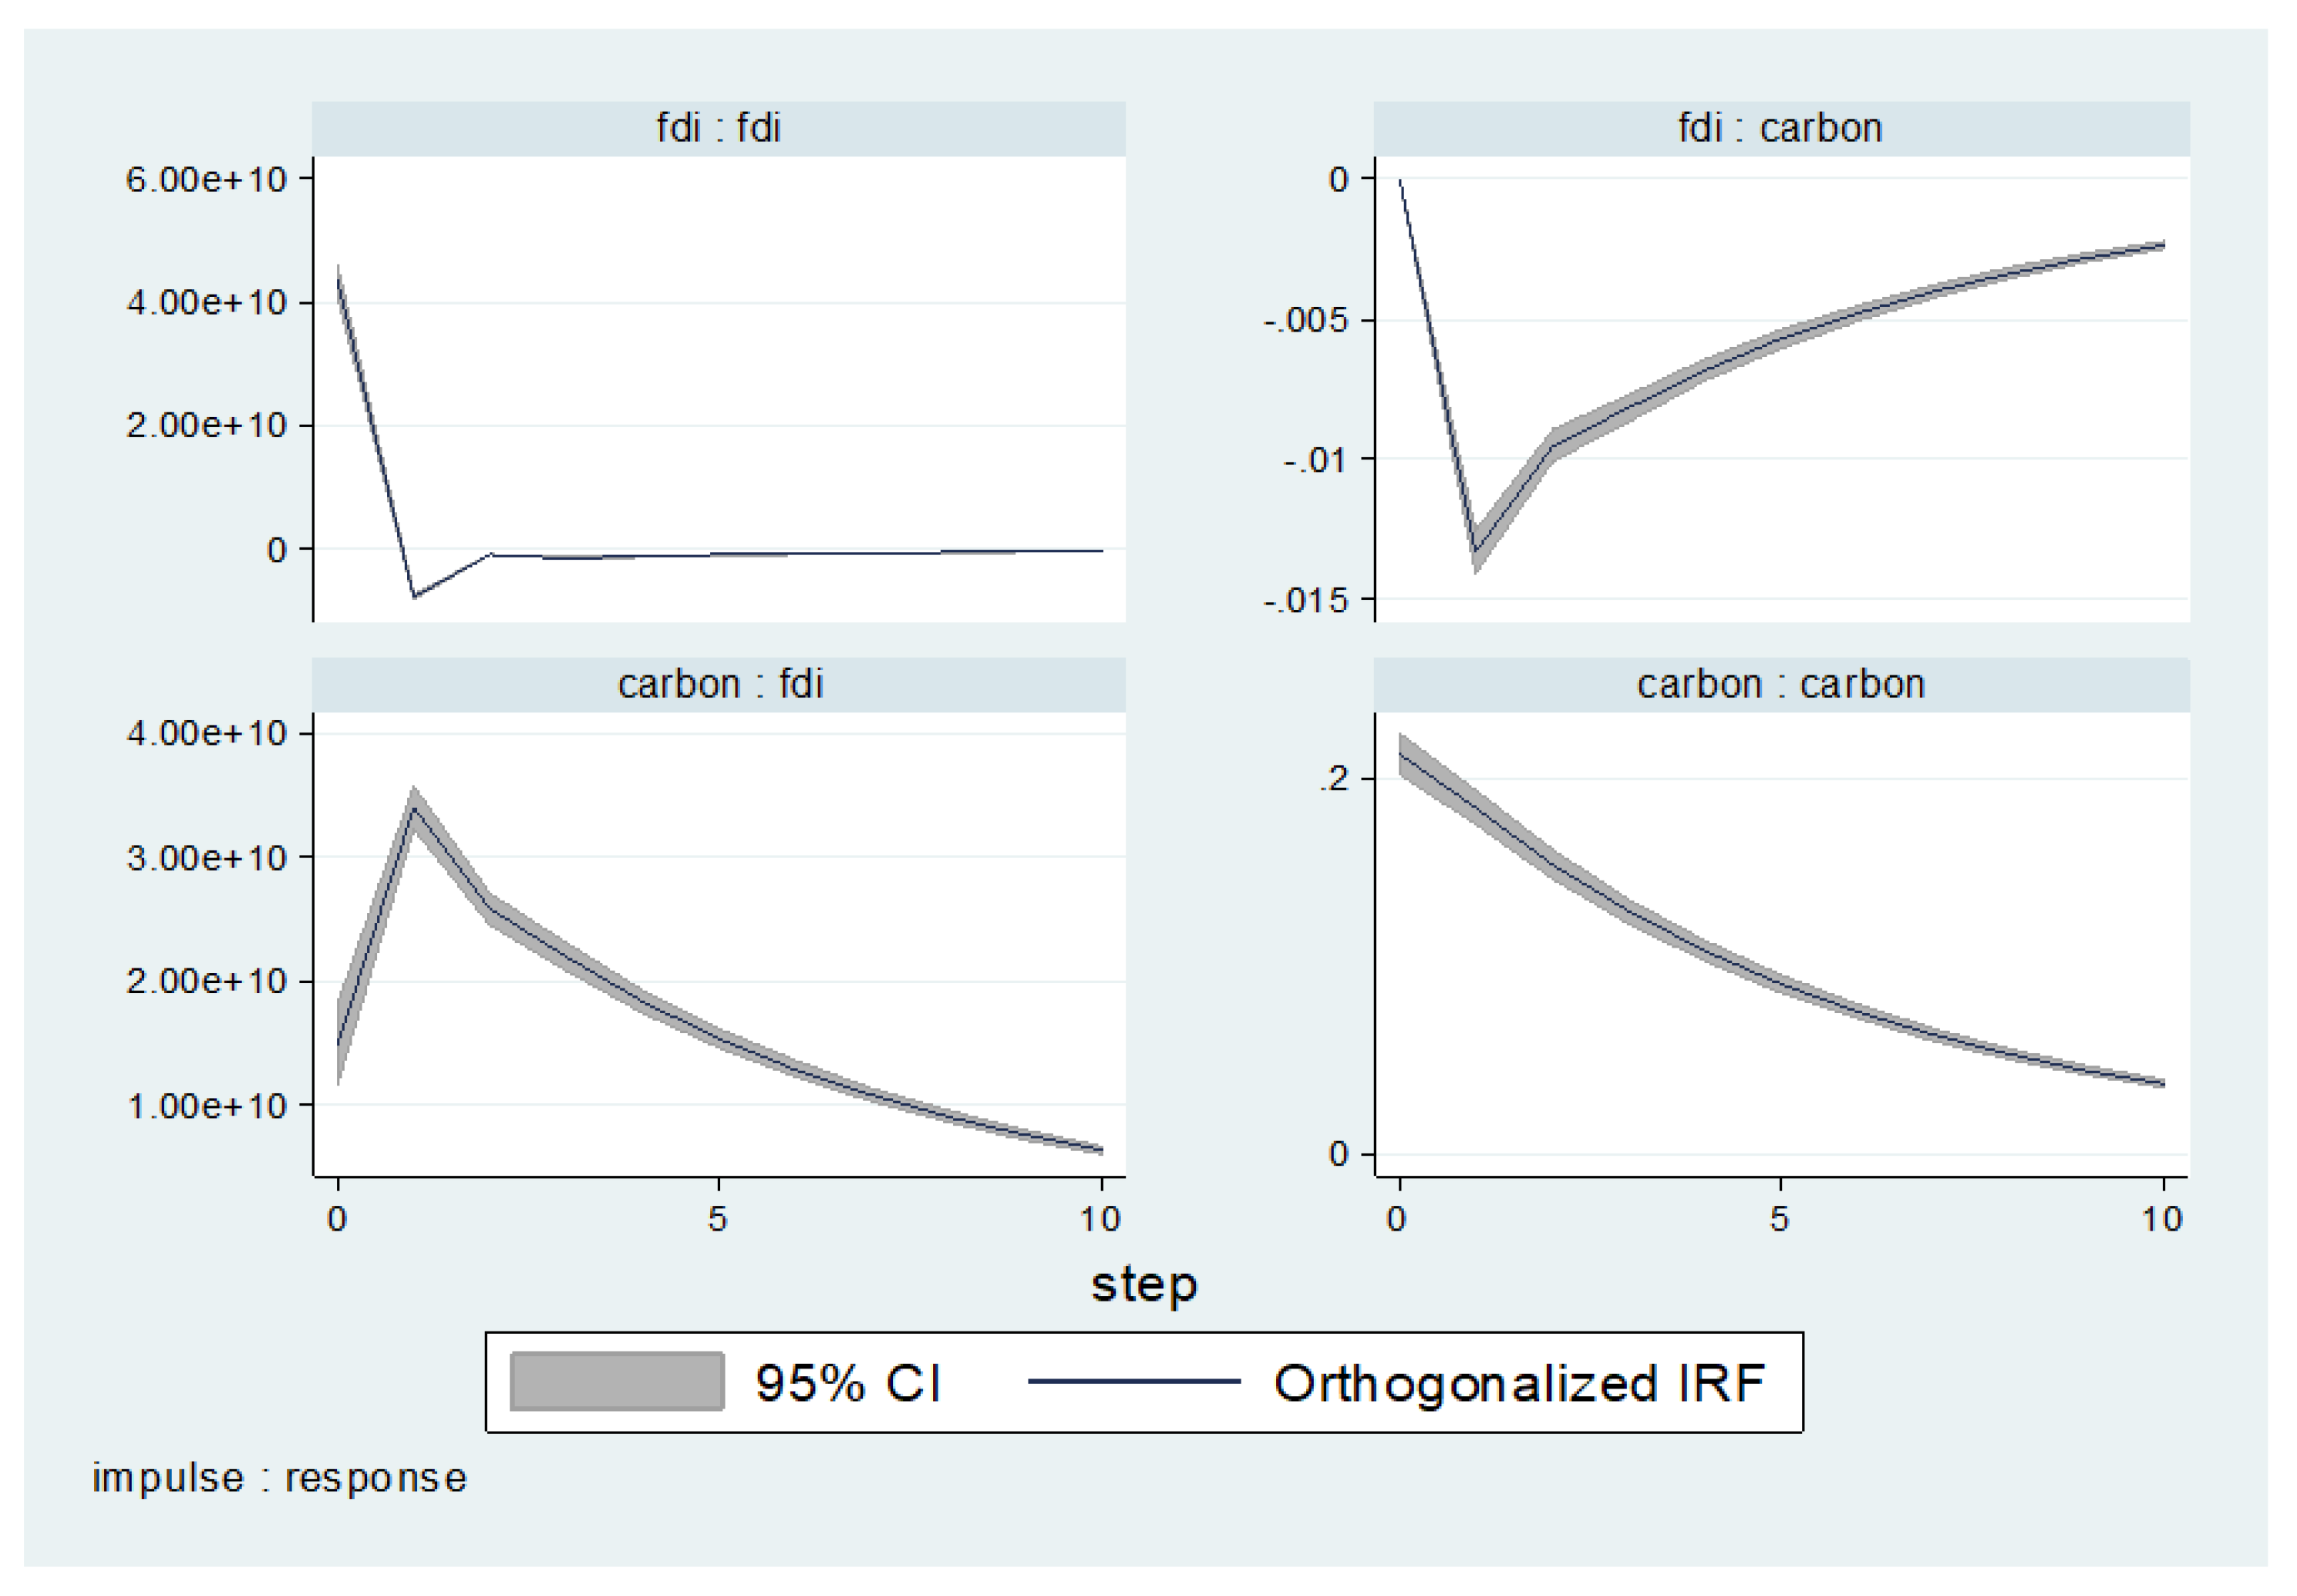
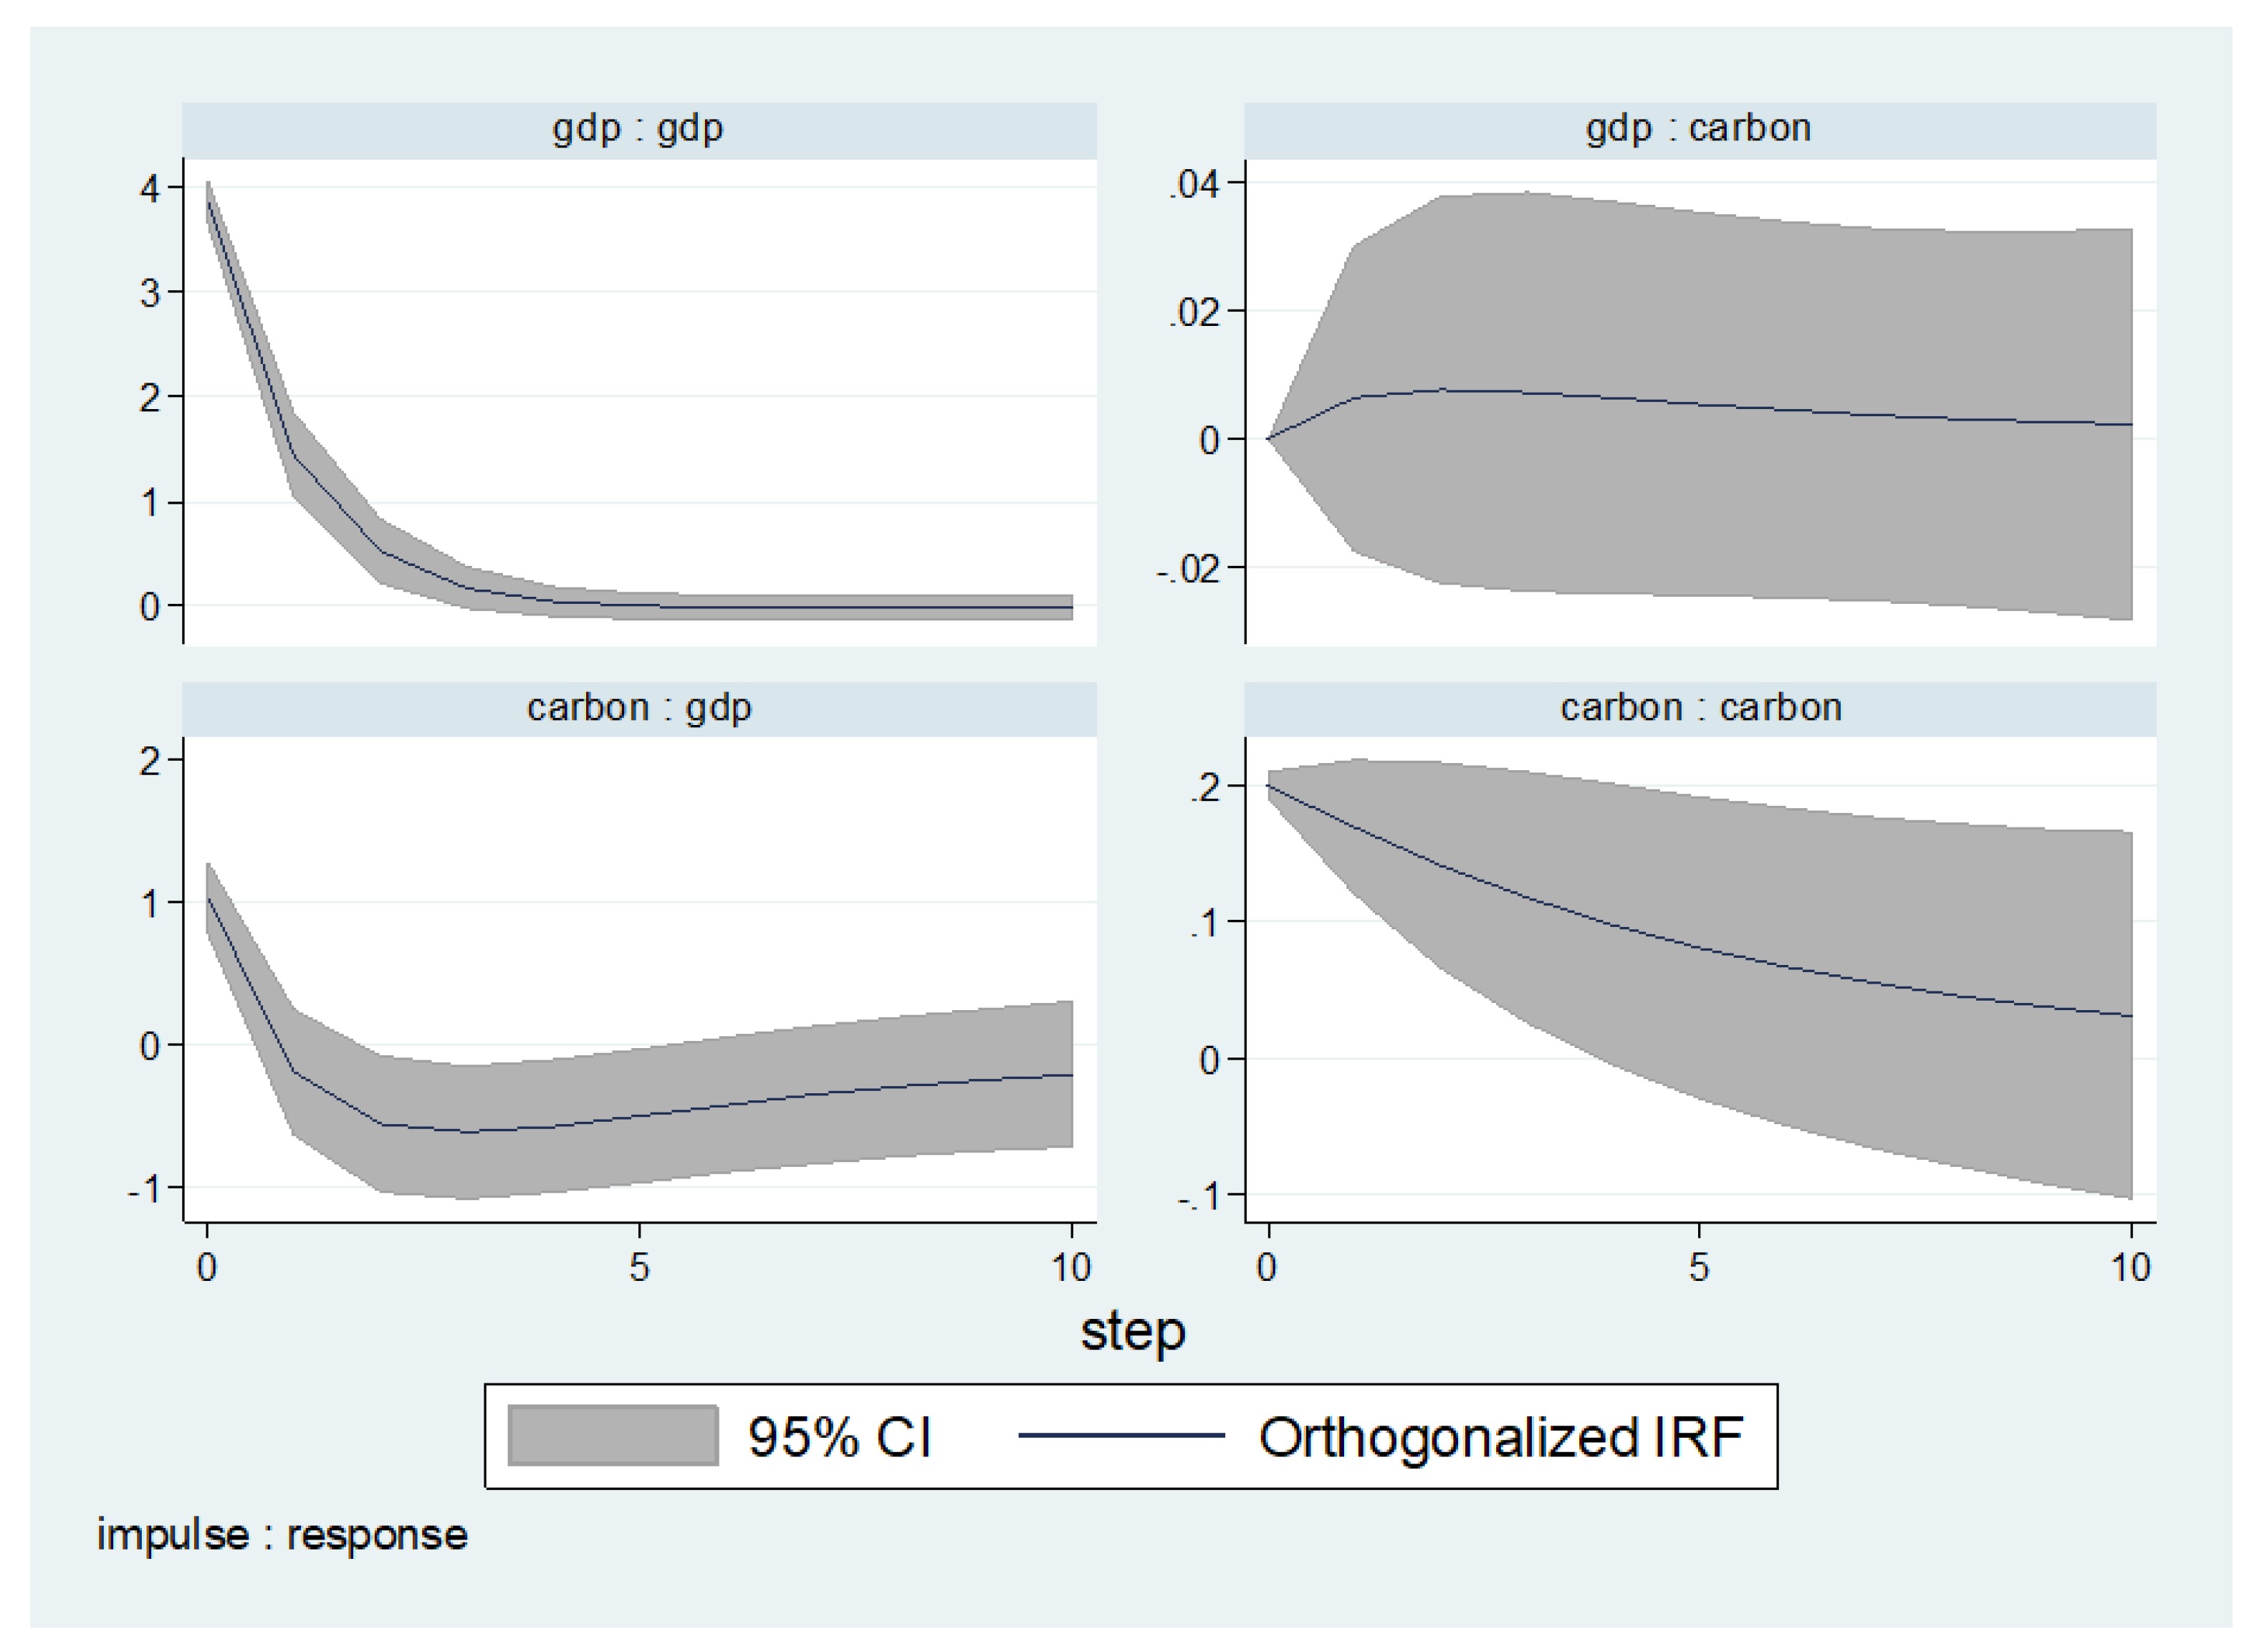
5.3.3. Impulse Response Functions
6. Conclusions
Author Contributions
Funding
Acknowledgments
Conflicts of Interest
Appendix A. Results of Unit Root Test


Appendix B. Results of the FEVD Estimates (Total Footprint)


Appendix C. Results of the FEVD Estimates (Carbon Footprint)

Appendix D. Results of the FEVD Estimates (Forecast-Error Variance Decomposition)

| Total | GDP | FDI | Total_w | GDP_w | FDI_w | ||
|---|---|---|---|---|---|---|---|
| Total | 0 | 0 | 0 | 0 | 0 | 0 | 0 |
| 1 | 1 | 0 | 0 | 0 | 0 | 0 | |
| 2 | 0.2729872 | 0.3113742 | 0.1904543 | 0.0559764 | 0.1024007 | 0.0162377 | |
| 3 | 0.1042024 | 0.2590105 | 0.0746439 | 0.0754784 | 0.0620527 | 0.0074815 | |
| 4 | 0.0503231 | 0.2311534 | 0.0345107 | 0.0573566 | 0.0547333 | 0.0085252 | |
| 5 | 0.0507172 | 0.2302332 | 0.0269293 | 0.0455589 | 0.0501147 | 0.0080496 | |
| 6 | 0.0524706 | 0.2224286 | 0.0231806 | 0.0434394 | 0.0462321 | 0.0072384 | |
| 7 | 0.0538884 | 0.2199838 | 0.022402 | 0.0428509 | 0.0450956 | 0.0070641 | |
| 8 | 0.0544239 | 0.2191629 | 0.0221126 | 0.0425863 | 0.044692 | 0.0069989 | |
| 9 | 0.0546112 | 0.2188358 | 0.0220114 | 0.0425053 | 0.044547 | 0.0069752 | |
| 10 | 0.054685 | 0.2187308 | 0.021981 | 0.0424776 | 0.0444977 | 0.0069675 | |
| Total | GDP | FDI | Total_w | GDP_w | FDI_w | ||
|---|---|---|---|---|---|---|---|
| GDP | 0 | 0 | 0 | 0 | 0 | 0 | 0 |
| 1 | 0.5803802 | 0.4196198 | 0 | 0 | 0 | 0 | |
| 2 | 0.2960931 | 0.4130535 | 0.1940907 | 0.0100347 | 0.0466805 | 0.0114994 | |
| 3 | 0.2056349 | 0.2879183 | 0.1873958 | 0.015766 | 0.0411985 | 0.0167622 | |
| 4 | 0.1364163 | 0.2440374 | 0.1135423 | 0.03444 | 0.0491563 | 0.0159092 | |
| 5 | 0.0764843 | 0.2368277 | 0.0427532 | 0.0354312 | 0.04693 | 0.0092217 | |
| 6 | 0.0574348 | 0.216825 | 0.0237428 | 0.0414286 | 0.0434009 | 0.0069177 | |
| 7 | 0.0557434 | 0.2185673 | 0.0225232 | 0.0423138 | 0.0443466 | 0.007009 | |
| 8 | 0.0549465 | 0.2185257 | 0.0219544 | 0.0423719 | 0.0443564 | 0.0069473 | |
| 9 | 0.0547751 | 0.2185597 | 0.0219416 | 0.0424481 | 0.0444277 | 0.0069567 | |
| 10 | 0.0547484 | 0.2186496 | 0.02196 | 0.0424557 | 0.0444587 | 0.0069618 | |
| Total | GDP | FDI | Total_w | GDP_w | FDI_w | ||
|---|---|---|---|---|---|---|---|
| FDI | 0 | 0 | 0 | 0 | 0 | 0 | 0 |
| 1 | 0.3923546 | 0.4005113 | 0.0907443 | 0 | 0 | 0 | |
| 2 | 0.215026 | 0.3464602 | 0.2273232 | 0.0010855 | 0.0634985 | 0.0277523 | |
| 3 | 0.228313 | 0.3308179 | 0.2334994 | 0.0010356 | 0.0635267 | 0.0310513 | |
| 4 | 0.2274611 | 0.3214023 | 0.2249864 | 0.0034546 | 0.0609543 | 0.0299885 | |
| 5 | 0.2222104 | 0.3144613 | 0.222342 | 0.0034222 | 0.0608899 | 0.0296872 | |
| 6 | 0.2236479 | 0.3055883 | 0.2098522 | 0.0038 | 0.0581065 | 0.0282042 | |
| 7 | 0.1989613 | 0.2761485 | 0.1723641 | 0.0071741 | 0.0502627 | 0.0233663 | |
| 8 | 0.13535 | 0.2343416 | 0.0949496 | 0.0223688 | 0.0425361 | 0.0145486 | |
| 9 | 0.0791403 | 0.2175597 | 0.0381161 | 0.035672 | 0.0413326 | 0.0083966 | |
| 10 | 0.0603904 | 0.2154625 | 0.023771 | 0.0407164 | 0.0426275 | 0.0069747 | |
| Total | GDP | FDI | Total_w | GDP_w | FDI_w | ||
|---|---|---|---|---|---|---|---|
| Total_w | 0 | 0 | 0 | 0 | 0 | 0 | 0 |
| 1 | 0.5798764 | 0.2451898 | 0.0697621 | 0.073704 | 0 | 0 | |
| 2 | 0.3227322 | 0.2936386 | 0.2428648 | 0.0327497 | 0.04847 | 0.0150644 | |
| 3 | 0.2840617 | 0.2900498 | 0.2588234 | 0.0275094 | 0.0718941 | 0.0292734 | |
| 4 | 0.2236199 | 0.2875167 | 0.1884545 | 0.0238179 | 0.060882 | 0.0214839 | |
| 5 | 0.1288141 | 0.2211411 | 0.0919521 | 0.0395862 | 0.0441483 | 0.0117798 | |
| 6 | 0.0746816 | 0.2223146 | 0.0387449 | 0.0416383 | 0.0450886 | 0.0084859 | |
| 7 | 0.0580627 | 0.2179335 | 0.0238557 | 0.0418764 | 0.0438804 | 0.0070334 | |
| 8 | 0.0553997 | 0.2180903 | 0.022205 | 0.0423937 | 0.0442652 | 0.0069637 | |
| 9 | 0.0549365 | 0.2185673 | 0.0219966 | 0.0424195 | 0.0444026 | 0.0069593 | |
| 10 | 0.0547727 | 0.2185882 | 0.021945 | 0.0424516 | 0.0444327 | 0.0069569 | |
| Total | GDP | FDI | Total_w | GDP_w | FDI_w | ||
|---|---|---|---|---|---|---|---|
| GDP_w | 0 | 0 | 0 | 0 | 0 | 0 | 0 |
| 1 | 0.0587837 | 0.2363376 | 0.0164409 | 0.0437329 | 0.2316438 | 0 | |
| 2 | 0.1780399 | 0.2084704 | 0.0813591 | 0.1251542 | 0.0650408 | 0.0002897 | |
| 3 | 0.0923775 | 0.1580604 | 0.0271952 | 0.0768084 | 0.0306546 | 0.0005893 | |
| 4 | 0.0607027 | 0.1992721 | 0.0228974 | 0.0493401 | 0.0435409 | 0.0069037 | |
| 5 | 0.0573754 | 0.2201142 | 0.0234538 | 0.0421934 | 0.0452801 | 0.0072447 | |
| 6 | 0.0550688 | 0.2177749 | 0.0217253 | 0.0424681 | 0.0441055 | 0.0068639 | |
| 7 | 0.0549094 | 0.2183572 | 0.0219344 | 0.042514 | 0.0443592 | 0.0069464 | |
| 8 | 0.0547901 | 0.2185965 | 0.0219449 | 0.0424563 | 0.0444316 | 0.0069574 | |
| 9 | 0.0547411 | 0.2186307 | 0.021952 | 0.0424608 | 0.044454 | 0.0069603 | |
| 10 | 0.0547322 | 0.2186589 | 0.0219605 | 0.0424621 | 0.0444647 | 0.0069623 | |
| Total | GDP | FDI | Total_w | GDP_w | FDI_w | ||
|---|---|---|---|---|---|---|---|
| GDP_w | 0 | 0 | 0 | 0 | 0 | 0 | 0 |
| 1 | 0.0017691 | 0.3957767 | 0.0325533 | 0.0178445 | 0.1265757 | 0.011514 | |
| 2 | 0.0466656 | 0.2538268 | 0.0307276 | 0.0455623 | 0.0565016 | 0.0053304 | |
| 3 | 0.054623 | 0.2236274 | 0.0221681 | 0.043589 | 0.0445038 | 0.0061264 | |
| 4 | 0.0532808 | 0.2186349 | 0.0214142 | 0.0421125 | 0.0448085 | 0.0069024 | |
| 5 | 0.0543636 | 0.2197206 | 0.0222199 | 0.0421252 | 0.0449794 | 0.0070586 | |
| 6 | 0.0545773 | 0.2190187 | 0.0220189 | 0.0423565 | 0.0446001 | 0.0069782 | |
| 7 | 0.0546678 | 0.2187463 | 0.0219771 | 0.0424497 | 0.0445048 | 0.0069665 | |
| 8 | 0.0547073 | 0.2187033 | 0.0219708 | 0.0424597 | 0.0444839 | 0.0069651 | |
| 9 | 0.0547176 | 0.2186799 | 0.0219649 | 0.0424624 | 0.0444741 | 0.0069636 | |
| 10 | 0.0547222 | 0.2186726 | 0.0219636 | 0.0424633 | 0.0444709 | 0.0069631 | |
References
- Yu, H. Motivation behind China’s ‘One Belt, One Road’ initiatives and establishment of the Asian infrastructure investment bank. J. Contemp. China 2017, 26, 353–368. [Google Scholar] [CrossRef]
- Tracy, E.F.; Shvarts, E.; Simonov, E.; Babenko, M. China’s new Eurasian ambitions: The environmental risks of the Silk Road Economic Belt. Eurasian Geogr. Econ. 2017, 58, 56–88. [Google Scholar] [CrossRef]
- Hu, J.; Wang, Z.; Lian, Y.H.; Huang, Q.H. Environmental regulation, foreign direct investment and green technological progress—Evidence from Chinese manufacturing industries. Int. J. Environ. Res. Public Health 2018, 15, 221. [Google Scholar] [CrossRef]
- Levi, M. Go east, young oilman. Foreign Aff. 2015, 94, 108–117. [Google Scholar]
- Harashima, Y.; Morita, T. A comparative study on environmental policy development processes in the three East Asian countries: Japan, Korea, and China. Environ. Econ. Policy Stud. 1998, 1, 39–67. [Google Scholar] [CrossRef]
- Stroik, P.C. Technology, Trade and the Environment. Ph.D. Thesis, University of California, Irvine, CA, USA, 2016. [Google Scholar]
- Doytch, N. FDI halo vs. pollution haven hypothesis. In Proceedings of the New York State Economics Association, New York, NY, USA, 5–6 October 2012. [Google Scholar]
- Doytch, N.; Uctum, M. Globalization and the Environmental Spillovers of Sectoral FDI. Available online: http://www.freit.org/WorkingPapers/Papers/ForeignInvestment/FREIT530.pdf (accessed on 14 September 2018).
- Sassi, S.; Gasmi, A. The dynamic relationship between corruption-inflation: Evidence from panel vector autoregression. Jpn. Econ. Rev. 2017, 68, 458–469. [Google Scholar] [CrossRef]
- Canova, F.; Ciccarelli, M. Panel Vector Autoregressive Models: A Survey, 1st ed.; Emerald Group Publishing Limited: Bingley, UK, 2013; pp. 205–246. [Google Scholar]
- Zhang, N.; Liu, Z.; Zheng, X.M.; Xue, J.J. Carbon footprint of China’s belt and road. Science 2017, 357, 1107. [Google Scholar] [CrossRef] [PubMed]
- Wang, C.J.; Wang, F. China can lead on climate change. Science 2017, 357, 764. [Google Scholar] [CrossRef] [PubMed]
- Zwerg, A.M.; Carlos, L.; Vieira, A. The impact of foreign direct investment on developing economies and the environment. AD-minister 2008, 8, 111–128. [Google Scholar]
- He, J. Pollution haven hypothesis and environmental impacts of foreign direct investment: The case of industrial emission of sulfur dioxide (SO2) in Chinese provinces. Ecol. Econ. 2006, 60, 228–245. [Google Scholar] [CrossRef]
- Jiang, Y.Q. Foreign direct investment, pollution, and the environmental quality: A model with empirical evidence from the Chinese regions. Int. Trade J. 2015, 29, 212–227. [Google Scholar] [CrossRef]
- Driffield, N.; Taylor, K. FDI and the labour market: A review of the evidence and policy implications. Oxf. Rev. Econ. Pol. 2000, 16, 90–103. [Google Scholar] [CrossRef]
- Cole, M.A. Trade, the pollution haven hypothesis and the environmental Kuznets curve: Examining the linkages. Ecol. Econ. 2004, 48, 71–81. [Google Scholar] [CrossRef]
- Birdsall, N.; Wheeler, D. Trade policy and industrial pollution in Latin America: Where are the pollution havens? J. Environ. Dev. 1993, 2, 137–149. [Google Scholar] [CrossRef]
- Mabey, N.; McNally, R. Foreign Direct Investment and the Environment: From Pollution Havens to Sustainable Development. Available online: http://www.oecd.org/investment/mne/2089912.pdf (accessed on 14 September 2018).
- Brucal, A.; Javorcik, B.; Love, I. Pollution Havens or Halos? Evidence from Foreign Acquisitions in Indonesia. Available online: https://editorialexpress.com/cgi-bin/conference/download.cgi?db_name=SED2017&paper_id=306 (accessed on 14 September 2018).
- Grossman, G.M.; Krueger, A.B. The inverted-U: What does it mean? Env. Dev. Econ. 2008, 1, 119–122. [Google Scholar] [CrossRef]
- Stern, D.I. The environmental Kuznets curve after 25 years. J. Bioecon. 2017, 19, 7–28. [Google Scholar] [CrossRef]
- Pao, H.T.; Tsai, C.M. Multivariate Granger causality between CO2 emissions, energy consumption, FDI (foreign direct investment) and GDP (gross domestic product): Evidence from a panel of BRIC (Brazil, Russian Federation, India, and China) countries. Energy 2011, 36, 685–693. [Google Scholar] [CrossRef]
- Girma, S. Absorptive capacity and productivity spillovers from FDI: A threshold regression analysis. Oxf. Bull. Econ. Stat. 2005, 67, 281–306. [Google Scholar] [CrossRef]
- Moran, T.H. Does Foreign Direct Investment Promote Development, 3rd ed.; Institute for International Economics: Washington, DC, USA, 2005; pp. 281–313. [Google Scholar]
- Wei, Y.; Liu, X. Productivity spillovers from R&D, exports and FDI in China’s manufacturing sector. J. Int. Bus. Stud. 2006, 37, 544–557. [Google Scholar] [CrossRef]
- Holtz-Eakin, D.; Newey, W.; Rosen, H.S. Estimating vector autoregressions with panel data. Econometrica 1988, 6, 1371–1395. [Google Scholar] [CrossRef]
- Brana, S.; Djigbenou, M.L.; Prat, S. Global excess liquidity and asset prices in emerging countries: A PVAR approach. Emerg. Mark. Rev. 2012, 13, 256–267. [Google Scholar] [CrossRef]
- Canova, F.; Ciccarelli, M. Estimating multicountry VAR models. Int. Econ. Rev. 2009, 50, 929–959. [Google Scholar] [CrossRef]
- Ang, A.; Piazzesi, M. A no-arbitrage vector autoregression of term structure dynamics with macroeconomic and latent variables. J. Monetary Econ. 2003, 50, 745–787. [Google Scholar] [CrossRef] [Green Version]
- Enders, W.; Sandler, T. The effectiveness of antiterrorism policies: A vector-autoregression-intervention analysis. Am. Political Sci. Rev. 1993, 87, 829–844. [Google Scholar] [CrossRef]
- Toda, H.Y.; Phillips, P.C. Vector autoregression and causality: A theoretical overview and simulation study. Econ. Rev. 1994, 13, 259–285. [Google Scholar] [CrossRef]
- Canh, N.T.; Phong, N.A. Effect of public investment on private investment and economic growth: Evidence from Vietnam by economic industries. Appl. Econ. Financ. 2018, 5, 95–110. [Google Scholar] [CrossRef]
- Koengkan, M. The nexus between energy consumption, economic growth, and urbanization in Latin American and Caribbean countries: An approach with PVAR model. Rev. Valore 2017, 2, 202–219. [Google Scholar] [CrossRef] [Green Version]
- Ramadhani, N.Q.; Saraswati, E.; Fuad, A. Social responsibility and value added acreation. IJournals 2017, 6, 1–9. [Google Scholar]
- Javorcik, B.S. Does foreign direct investment increase the productivity of domestic firms? In search of spillovers through backward linkages. Am. Econ. Rev. 2004, 94, 605–627. [Google Scholar] [CrossRef]
- Qu, J.Z.; Zhang, Z.M. Relationship between Financial Development and International Trade in China—Based on the Data of 1991–2005. J. Int. Trade 2008, 1, 16. [Google Scholar]
- Yang, W.P.; Yuan, X.L. The Effect of Foreign Trade and FDI on Environmental Pollution: An analysis based on the Impulse Response Function of Time Series in China: 1982–2006. World Econ. Stud. 2008, 12, 12. [Google Scholar]
- Arellano, M.; Bover, O. Another look at the instrumental variable estimation of error-components models. J. Econ. 1995, 68, 29–51. [Google Scholar] [CrossRef]
- Baltagi, B. Econometric Analysis of Panel Data, 4th ed.; Instituto de Economía, INTA: Buenos Aires, Argentina, 2008. [Google Scholar]
- Kneller, R.; Pisu, M. Industrial link ages and export spillovers from FDI. World Econ. 2007, 30, 105–134. [Google Scholar] [CrossRef]
- Dong, B.; Gong, J.; Zhao, X. FDI and environmental regulation: Pollution haven or a race to the top? J. Reg. Econ. 2012, 41, 216–237. [Google Scholar] [CrossRef]
- Lairson, T.D. The Global Strategic Environment of the BRI: Deep Interdependence and Structural Power, in China’s Belt and Road Initiative, 1st ed.; Palgrave Macmillan: Cham, Switzerland, 2018; pp. 35–53. [Google Scholar]
- Neequaye, N.A.; Oladi, R. Environment, growth, and FDI revisited. Int. Rev. Econ. Financ. 2015, 39, 47–56. [Google Scholar] [CrossRef]
- Dovern, J.; Meier, C.P.; Vilsmeier, J. How resilient is the German banking system to macroeconomic shocks? J. Bank Financ. 2010, 34, 1839–1848. [Google Scholar] [CrossRef] [Green Version]
- Dees, S.; Mauro, F.; Pesaran, M.H.; Smith, L.V. Exploring the international linkages of the euro area: A global VAR analysis. J. Appl. Econ. 2007, 22, 1–38. [Google Scholar] [CrossRef]
- Lof, M.; Malinen, T. Does sovereign debt weaken economic growth? A panel VAR analysis. Econ. Lett. 2014, 122, 403–407. [Google Scholar] [CrossRef] [Green Version]
- Love, I.; Zicchino, L. Financial development and dynamic investment behavior: Evidence from panel VAR. Quart. Rev. Econ. Financ. 2006, 46, 190–210. [Google Scholar] [CrossRef] [Green Version]
- Metiu, N.; Hilberg, B.; Grill, M. Financial Shocks, Credit Regimes, and Global Spillovers. Available online: https://www.bundesbank.de/Redaktion/EN/Downloads/Publications/Discussion_Paper_1/2015/2015_03_17_dkp_04.pdf?__blob=publicationFile (accessed on 14 September 2018).
- Sadorsky, P. The impact of financial development on energy consumption in emerging economies. Energy Policy 2010, 38, 2528–2535. [Google Scholar] [CrossRef]
- Raddatz, C. Are external shocks responsible for the instability of output in low-income countries? J. Dev. Econ. 2007, 84, 155–187. [Google Scholar] [CrossRef]
- Li, Q.; Hu, H.; Luo, H.J.; Lin, L.Y.; Shi, Y.; Zhang, Y.J.; Zhou, L. Two-way coupling relationship between economic growth and environmental pollution-Regional difference analysis based on PVAR model. Acta Scientiae Circumstantiae 2015, 6, 1875–1886. [Google Scholar]
- Abrigo, M.R.; Love, I. Estimation of Panel Vector Autoregression in Stata: A Package of Programs. Available online: http://paneldataconference2015.ceu.hu/Program/Michael-Abrigo.pdf (accessed on 14 September 2018).
- Kuzyk, L.W. The ecological footprint housing component: A geographic information system analysis. Ecol. Indic. 2012, 16, 31–39. [Google Scholar] [CrossRef]
- Świąder, M.; Szewrański, S.; Kazak, J.K.; Hoof, J.V.; Lin, D.; Wackernagel, M.; Alves, A. Application of ecological footprint accounting as a part of an integrated assessment of environmental carrying capacity: A case study of the footprint of food of a large city. Resources 2018, 7, 52. [Google Scholar] [CrossRef]
- Borucke, M.; Moore, D.; Cranston, G.; Gracey, K.; Iha, K.; Larson, J.; Lazarus, E.; Morales, J.C.; Wackernagel, M.; Galli, A. Accounting for demand and supply of the biosphere’s regenerative capacity: The National Footprint Accounts’ underlying methodology and framework. Ecol. Indic. 2013, 24, 518–533. [Google Scholar] [CrossRef]
- Monfreda, C.M.; Wackernagel, M.; Deumling, D. Establishing national natural capital accounts based on detailed ecological footprint and biological capacity assessments. Land Use Policy 2004, 21, 231–246. [Google Scholar] [CrossRef]
- Bank, T.W. World Development Indicators 2014. 2014. Available online: https://books.google.com.hk/books?hl=zh-TW&lr=&id=pQqKAwAAQBAJ&oi=fnd&pg=PP1&dq=World+Development+Indicators+2014&ots=UPXPhnMR4D&sig=VMnHpQLEA69eghugijTXQTJBcP4&redir_esc=y#v=onepage&q=World%20Development%20Indicators%202014&f=false (accessed on 25 September 2018).[Green Version]
- Doytch, N.; Narayan, S. Does FDI influence renewable energy consumption? An analysis of sectoral FDI impact on renewable and non-renewable industrial energy consumption. Energy Econ. 2016, 54, 291–301. [Google Scholar] [CrossRef]
- Engle, R.F.; Granger, C.W. Co-integration and error correction: Representation, estimation, and testing. Econometrica 1987, 2, 251–276. [Google Scholar] [CrossRef]
- Friedl, B.; Getzner, M. Determinants of CO2 emissions in a small open economy. Ecol. Econ. 2003, 45, 133–148. [Google Scholar] [CrossRef]
- Elliot, B.; Rothenberg, T.; Stock, J. Efficient tests of the unit root hypothesis. Econometrica 1996, 64, 13–36. [Google Scholar]
- Akaike, H. Fitting autoregressive models for prediction. Ann. Inst. Stat. Math. 1969, 1, 243–247. [Google Scholar] [CrossRef]
- Hannan, E.J.; Quinn, B.G. The determination of the order of an autoregression. J. R. Stat. Soc. 1979, 2, 190–195. [Google Scholar]
- Schwarz, G. Estimating the dimension of a model. Ann. Stat. 1978, 2, 461–464. [Google Scholar] [CrossRef]
- Lütkepohl, H. New Introduction to Multiple Time Series Analysis, 1st ed.; Springer Science & Business Media: Berlin, Germany, 2005. [Google Scholar]
- Asafu-Adjaye, J. The relationship between energy consumption, energy prices and economic growth: Time series evidence from Asian developing countries. Energy Econ. 2000, 22, 615–625. [Google Scholar] [CrossRef]
- Sigmund, M.; Ferstl, R.; Unterkofler, D. Panel Vector Autoregression in R with the Package Panelvar. Available online: https://papers.ssrn.com/sol3/Delivery.cfm/SSRN_ID3194239_code1405094.pdf?abstractid=2896087&mirid=1 (accessed on 14 September 2018).
- Becketti, S. Introduction to Time Series Using Stata, 1st ed.; Stata Press: College Station, TX, USA, 2013. [Google Scholar]
- Henriques, I.; Sadorsky, P. Oil prices and the stock prices of alternative energy companies. Energy Econ. 2008, 30, 998–1010. [Google Scholar] [CrossRef]
- Winkler, A.M.; Ridgway, G.R.; Webster, M.A.; Smith, S.M.; Nichols, T.E. Permutation inference for the general linear model. Neuroimage 2014, 92, 381–397. [Google Scholar] [CrossRef] [PubMed]
- Pesaran, H.H.; Shin, Y.C. Generalized impulse response analysis in linear multivariate models. Econ. Lett. 1998, 58, 17–29. [Google Scholar] [CrossRef] [Green Version]
- Tiwari, A.K. Comparative performance of renewable and nonrenewable energy source on economic growth and CO2 emissions of Europe and Eurasian countries: A PVAR approach. Econ. Bull. 2011, 31, 2356–2372. [Google Scholar]
| Name of the Hypothesis | Meaning | Literature |
|---|---|---|
| Pollution Havens Hypothesis (PHH) | Local government tend to make lax environmental standards in order attract more FDI and obtain relative advantages in regional economic development | [3] [17] [18] |
| FDI Halo Hypothesis | FDI is hypothesized to exert positive environmental spillover effects, because FDI is supposed to be able to transfer advance technologies from developed countries to under-developed ones. | [7] [19] [20] |
| EKC Hypothesis | Economic development influences environment through scale, composition and technique effect which leads to an inverted U-shaped relationship between the two variables. | [21] [22] |
| Author | Dependent Variable | Independent Variable | Region | Time | Method |
|---|---|---|---|---|---|
| Hoffmann et al., 2005 | CO2, SO2 Emission | FDI | 112 countries | 1990–2005 | Granger causality analysis |
| Girma, 2005 | Changes in TFP | FDI, absorptive capacity (ABC) | UK | 1989–1999 | Endogenous threshold model, input Cobb–Douglas |
| Wei and Liu, 2006 | TFP | R&D, export, FDI spillover | China | 1998–2001 | Cobb–Douglas production function |
| Zheng et al., 2010 | Housing Price | Productivity, geography, quality of life | 35 major Chinese cities | 1991–2006 | Hedonic regression |
| Bekhet and bt Othman, 2011 | Electricity Consumption | CPI, GDP and FDI | Malaysia | 1971–2009 | VECM |
| Pao and Tsai, 2011 | CO2 Emissions | Energy consumption, FDI, Economic Growth | BRIC | 1980–2005 | Panel cointegration |
| Jiang, 2015 | Pollution emission | FDI, output, capital stock, human capital stock, labor input | China, 28 provincial-level | 1997–2012 | OLS, Panel data |
| Doytch and Narayan, 2016 | Energy consumption | GDP, FDI, net FDI capital inflow share of GDP | 74 Countries | 1985–2012 | Dynamic panel estimation |
| VAR Types | Characteristics |
|---|---|
| VAR |
|
| SVAR (Structural VAR) |
|
| GVAR (Global VAR) |
|
| PVAR (Panel VAR) |
|
| TVAR (Threshold VAR) |
|
| PVAR applications | Energy consumption, financial development, economic growth [50] |
| Financial development, investment decisions [48] | |
| Corruption and inflation [9] | |
| External shocks (commodity price, natural disaster, international economy) to output instability [51] | |
| The influence of global excess liquidity on commodities and asset prices [28] | |
| Two-dimension analysis between economic growth and pollution [52] |
| Variables | Observations | Mean | Standard Deviation | Minimum | Maximum |
|---|---|---|---|---|---|
| Ecological Footprint (Carbon) | 1017 | 1.6899 | 1.284045 | 0.021174 | 6.704063 |
| Ecological Footprint (Total) | 1017 | 3.0032 | 1.821681 | 0.4308162 | 9.314663 |
| GDP | 1538 | 3.1564 | 8.1022 | −99.2 | 60.3 |
| FDI | 1030 | 7.13 × 10 9 | 2.45 × 10 10 | −2.09 × 10 10 | 2.91 × 10 11 |
| Variables | Inverse Chi-Squared | Inverse Normal | Inverse Logit | Modified Inverse Chi-Squared |
|---|---|---|---|---|
| 268.94 (0.00) | –9.87 (0.00) | –10.42 (0.00) | 13.64 (0.00) | |
| 273.16 (0.00) | –10.05 (0.00) | –10.68 (0.00) | 13.96 (0.00) | |
| 725.05 (0.00) | –21.04 (0.00) | –26.46 (0.00) | 40.47 (0.00) | |
| 156.98 (0.00) | –6.13 (0.00) | –5.89 (0.00) | 6.09 (0.00) | |
| 486.11 (0.00) | –13.96 (0.00) | –17.27 (0.00) | 24.64 (0.00) | |
| 488.03 (0.00) | –14.26 (0.00) | –17.41 (0.00) | 24.77 (0.00) | |
| 725.05 (0.00) | –21.03 (0.00) | –26.45 (0.00) | 40.46 (0.00) | |
| 302.32 (0.00) | –9.35 (0.00) | –10.31 (0.00) | 12.47 (0.00) |
| Lag | Interactions between EF (Carbon) and GDP | Interactions between EF (Total) and GDP | ||||||||
|---|---|---|---|---|---|---|---|---|---|---|
| CD | J | MBIC | MAIC | MQIC | CD | J | MBIC | MAIC | MQIC | |
| 1 | 0.99 | 11.5 | −68.7 | −12.5 | −34.1 | 0.99 | 15.2 | −65.0 | −8.8 | −30.4 |
| 2 | 0.99 | 7.0 | −46.4 | −8.9 | −23.4 | 0.99 | 8.6 | −44.8 | −7.4 | −21.8 |
| 3 | 0.99 | 3.3 | −23.5 | −4.7 | −11.9 | 0.99 | 4.6 | −22.2 | −3.5 | −10.6 |
| Lag | Interactions between EF (Carbon) and FDI | Interactions between EF (Total) and FDI | ||||||||
|---|---|---|---|---|---|---|---|---|---|---|
| CD | J | MBIC | MAIC | MQIC | CD | J | MBIC | MAIC | MQIC | |
| 1 | 0.99 | 11.82 | −68.3 | −12.18 | −33.76 | 0.992 | 13.26 | −66.9 | −10.74 | −32.32 |
| 2 | 0.99 | 6.98 | –46.4 | −9.02 | −23.41 | 0.993 | 6.33 | −47.1 | −9.67 | −24.05 |
| 3 | 0.98 | 3.67 | −23.0 | −4.33 | −11.52 | 0.984 | 1.08 | −25.6 | −6.92 | −14.11 |
| Lag | Interactions between EF_w(carbon)and GDP | Interactions between EF_w(total) and GDP | ||||||||
|---|---|---|---|---|---|---|---|---|---|---|
| CD | J | MBIC | MAIC | MQIC | CD | J | MBIC | MAIC | MQIC | |
| 1 | 0.99 | 18.18 | −61.98 | −5.23 | −27.40 | 0.99 | 0.18 | −63.88 | −7.73 | −29.31 |
| 2 | 0.99 | 10.99 | −42.45 | −5.01 | −19.39 | 0.97 | 0.28 | −43.58 | −6.14 | −20.53 |
| 3 | −1.52 | 3.34 | −23.38 | −4.66 | −11.86 | −9.49 | 0.33 | −22.11 | −3.39 | −10.58 |
| Lag | Interactions between EF_w(carbon) and FDI | Interactions between EF_w(total) and FDI_w | ||||||||
|---|---|---|---|---|---|---|---|---|---|---|
| CD | J | MBIC | MAIC | MQIC | CD | J | MBIC | MAIC | MQIC | |
| 1 | 0.999 | 15.02 | –63.79 | –8.98 | –30.15 | 0.999 | 16.41 | –62.40 | –7.59 | –28.76 |
| 2 | 0.999 | 11.73 | –40.82 | –4.27 | –18.39 | 0.999 | 5.73 | –46.82 | –10.27 | –24.39 |
| 3 | 0.978 | 6.86 | –19.41 | –1.34 | –8.19 | 0.974 | 8.93 | –17.35 | 0.93 | –6.13 |
| Response of | Response to | |||||
|---|---|---|---|---|---|---|
| D (Ln_EF) | D (Ln_GDP) | D (Ln_FDI) | D (Ln_EFw) | D (Ln_GDPw) | D (Ln_FDIw) | |
| Mode1. Ecological Footprint (Total) and GDP, FDI, and their weights | ||||||
| D (Ln_EF) | 8.10 × 10⁻¹ (1.57 × 10⁹) | 6.10× 10⁻¹ (8.28 × 10⁸) | 3.46 × 10⁻¹² (1.01 × 10⁹) | −2.64 (−2.64 × 10⁹) | −1.41 × 10⁻² (−1.95 × 10⁸) | 4.94 × 10⁻¹¹ (2.12 × 10⁹) |
| D (Ln_GDP) | 3.58 (6.94 × 10⁹) | 6.80 × 10⁻¹ (9.14 × 10⁹) | −7.21 × 10⁻¹³ (−2.10 × 10⁸) | 2.62 × 10 (−2.63 × 10¹⁰) | 2.86 × 10⁻² (3.95 × 10⁸) | 3.38 × 10⁻¹⁰ (1.45 × 10¹⁰) |
| D (Ln_FDI) | 1.40 × 10¹¹ (2.71 × 10²⁰) | 1.04 × 10¹⁰ (1.40 × 10²⁰) | 6.17 × 10⁻¹ (1.80 × 10²⁰) | −3.88 × 10¹¹ (−3.89 × 10²⁰) | −5.48 × 10⁹ (−7.57 × 10¹⁹) | 3.56 (1.53 × 10²⁰) |
| D (Ln_EFw) | 4.40 × 10⁻¹ (8.60 × 10⁸) | 6.80 × 10⁻² (9.19 × 10⁸) | 6.35 × 10⁻¹³ (1.85 × 10⁸) | −1.84 (−1.85 × 10⁹) | −2.52 × 10⁻² (−3.48 × 10⁸) | 1.86 × 10¹¹ (8.02 × 10⁸) |
| D (Ln_GDPw) | 1.28 (2.49 × 10⁹) | 4.43 × 10⁻¹ (5.97 × 10⁹) | 9.69 × 10⁻¹² (2.83 × 10⁹) | −2.01 × 10 (−2.02 × 10¹⁰) | 1.88 × 10⁻¹ (2.60 × 10⁹) | 2.21 × 10⁻¹⁰ (9.52 × 10⁹) |
| D (Ln_FDIw) | −2.97 × 10⁹ (−5.76 × 10¹⁸) | 1.71 × 10⁹ (2.30 × 10¹⁸) | 3.89 × 10⁻² (1.13 × 10¹⁹) | −1.88 × 10¹⁰ (−1.88 × 10¹⁹) | 9.15 × 10⁷ (1.26 × 10¹⁸) | 1.55 (6.68 × 10¹⁹) |
| Mode2. Ecological Footprint (Carbon) and GDP, FDI and their weights | ||||||
| D (Ln_EF) | 1.10 (1.76 × 10⁹) | 5.70 × 10⁻² (7.44 × 10⁸) | 2.23 × 10⁻¹³ (5.02 × 10⁻⁷) | −2.08 (−1.27 × 10¹⁹) | −3.67 × 10⁻² (−4.70 × 10⁸) | 2.39 × 10⁻¹¹ (6.79 × 10⁸) |
| D (Ln_GDP) | 5.69 (9.11 × 10⁹) | 7.27 × 10⁻¹ (9.48 × 10⁹) | −1.65 × 10⁻¹¹ (−3.73 × 10⁹) | −3.48 × 10 (−2.13 × 10¹⁰) | −1.31 × 10⁻¹ (−1.68 × 10⁹) | 4.09 × 10⁻¹⁰ (1.16 × 10¹⁰) |
| D (Ln_FDI) | 1.93 × 10¹¹ (3.10 × 10²⁰) | 1.24327 × 10¹⁰ (1.62 × 10²⁰) | 2.00 × 10⁻¹ (4.50 × 10¹⁹) | −4.22 × 10¹¹ (−2.58 × 10²⁰) | −9.23 × 10⁹ (−1.18 × 10²⁰) | 3.27 (9.30 × 10¹⁹) |
| D (Ln_EFw) | 2.90 × 10⁻¹ (4.69 × 10⁸) | 3.34 × 10⁻² (4.35 × 10⁸) | −1.18 × 10⁻¹³ (−2.65 × 10⁷) | −1.20 (−7.31 × 10⁸) | −1.32 × 10⁻² (−1.69 × 10⁸) | 1.32 × 10⁻¹¹ (3.77 × 10⁸) |
| D (Ln_GDPw) | 1.90 (3.05 × 10⁹) | 395 × 10−1 (5.14 × 10⁹) | 4.80 (1.08 × 10⁹) | −2.83 × 10 (−1.73 × 10¹⁰) | 1.51 × 10⁻¹ (1.94 × 10⁹) | 3.13 × 10¹⁰ (8.91 × 10⁹) |
| D (Ln_FDIw) | −4.50 × 10¹⁰ (−3.92 × 10¹⁸) | 1.58 × 10⁹ (2.06 × 10¹⁸) | 3.36 × 10⁻² (7.56 × 10¹⁸) | −2.67 × 10¹⁰ (−1.63 × 10¹⁹) | −1.09 × 10⁷ (−1.39 × 10¹⁷) | 1.60 (4.56 × 10¹⁹) |
| Equation/Excluded | Chi2 | DF | Prob > Chi2 | |
|---|---|---|---|---|
| Total | GDP | 0.708 | 1 | 0.400 |
| Total_w | 4.238 | 1 | 0.040 | |
| GDP_w | 7.560 | 1 | 0.006 | |
| ALL | 11.803 | 3 | 0.008 | |
| GDP | Total | 3.935 | 1 | 0.047 |
| Total_w | 0.005 | 1 | 0.942 | |
| GDP_w | 28.961 | 1 | 0.000 | |
| ALL | 32.361 | 3 | 0.000 | |
| Total_w | Total | 15.524 | 1 | 0.000 |
| GDP | 0.532 | 1 | 0.466 | |
| GDP_w | 243.276 | 1 | 0.000 | |
| ALL | 259.348 | 3 | 0.000 | |
| GDP_w | Total | 0.436 | 1 | 0.509 |
| GDP | 8.576 | 1 | 0.003 | |
| Total_w | 6.739 | 1 | 0.009 | |
| ALL | 65.064 | 3 | 0.000 | |
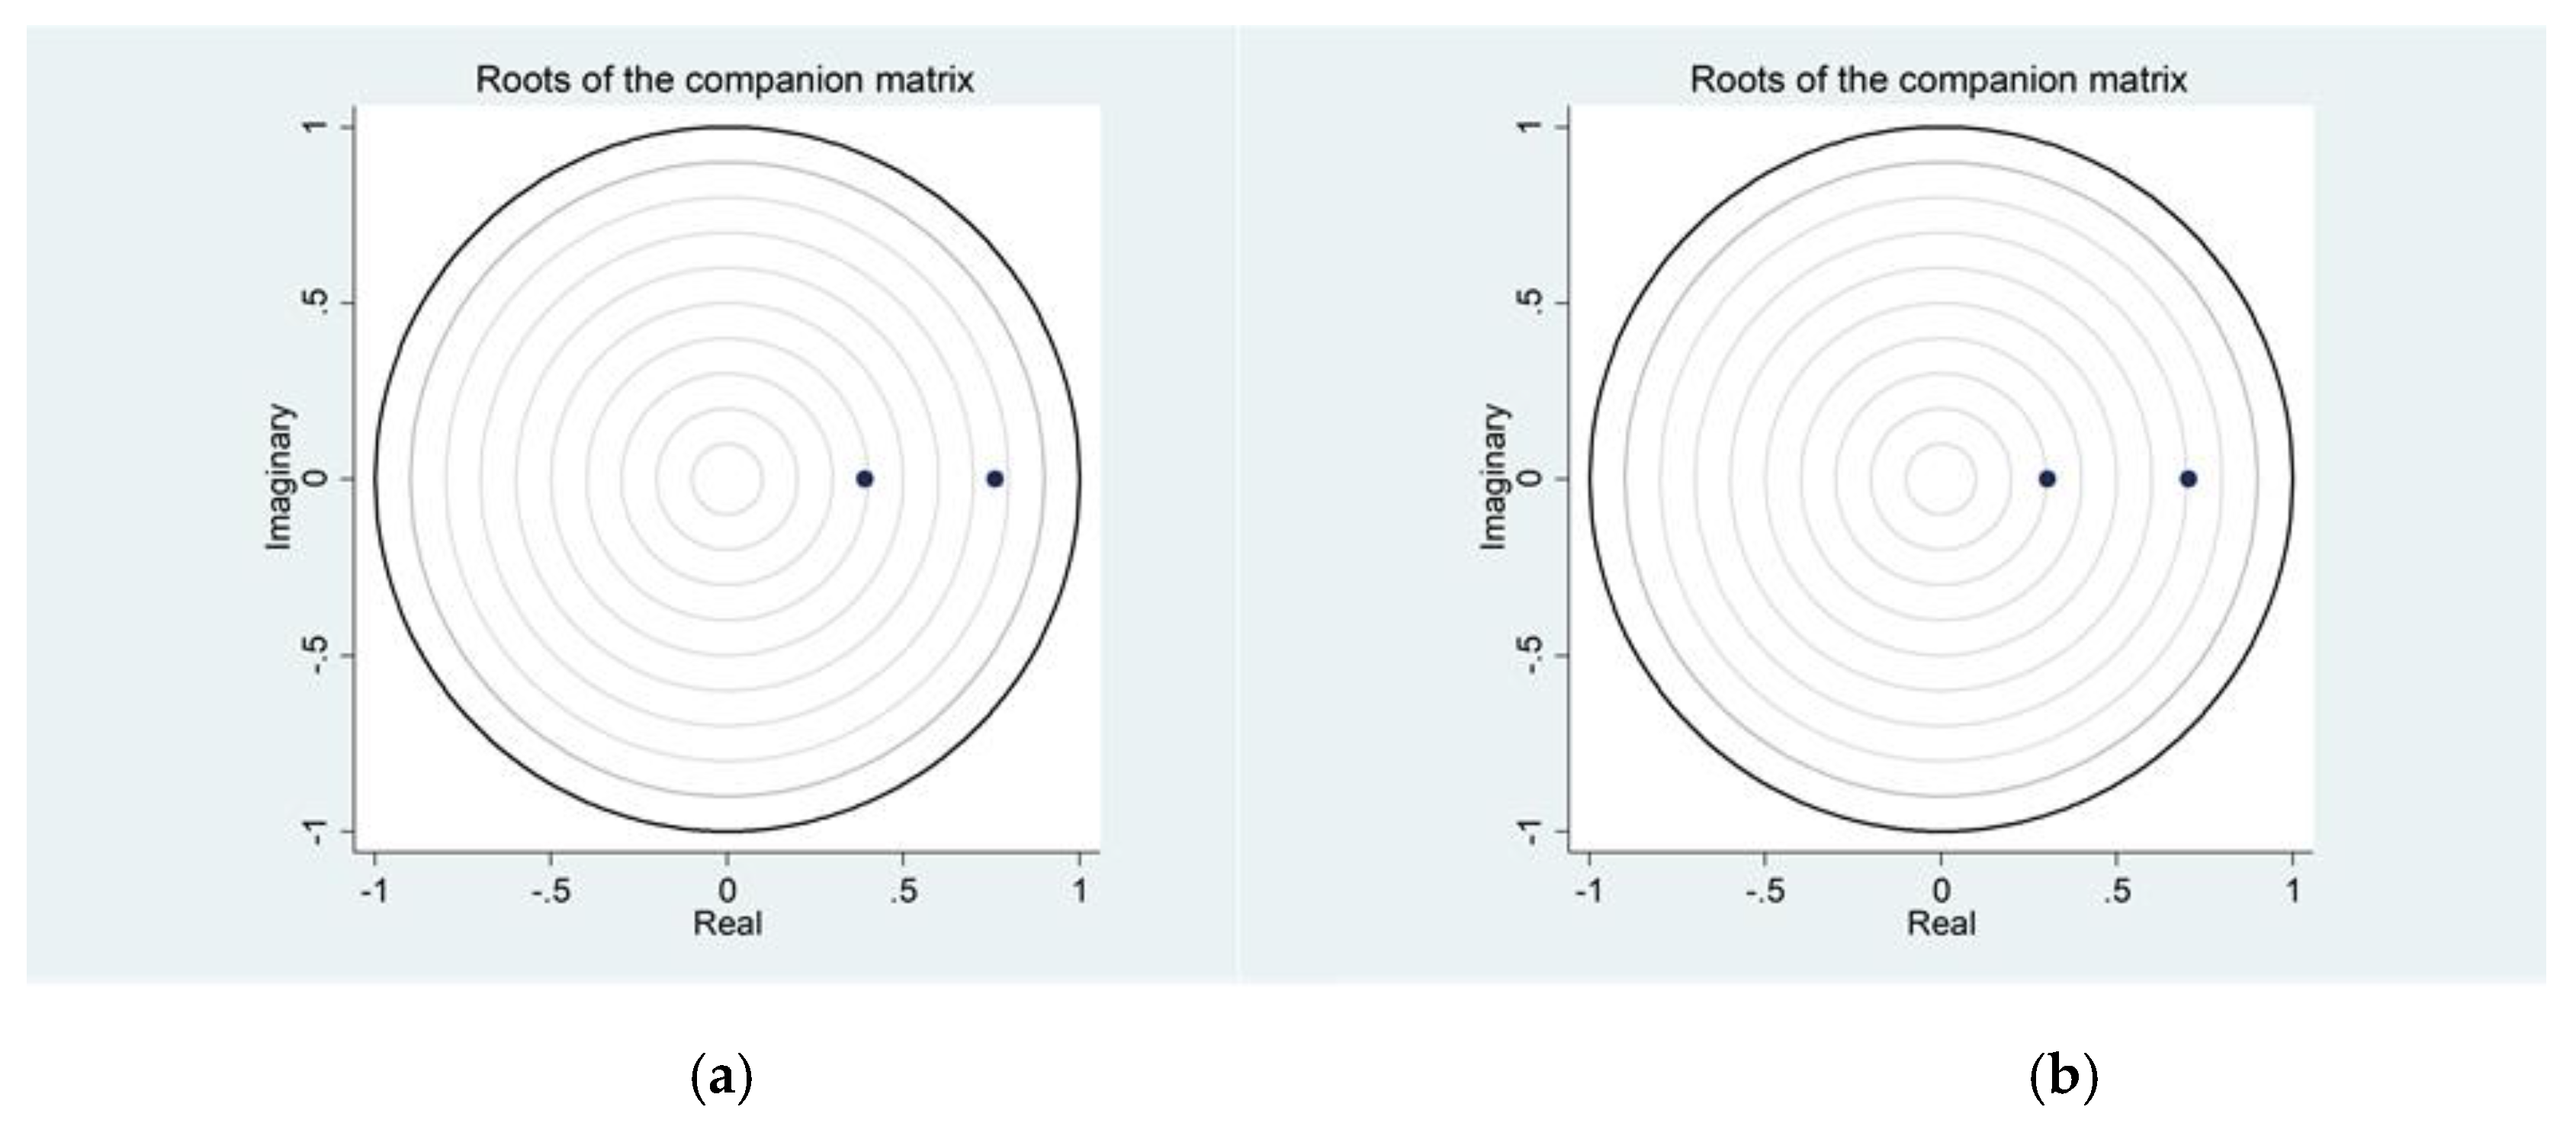
| Eigenvalue | Graph | ||
|---|---|---|---|
| Real | Imaginary | Modulus | 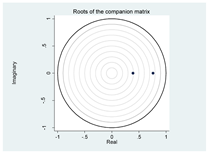 |
| 0.7595 | 0 | 0.7595 | |
| 0.3917 | 0 | 0.3917 | |
| Response Variable and Forecast Horizon | Impulse Variable | Response Variable and Forecast Horizon | Impulse Variable | ||||
|---|---|---|---|---|---|---|---|
| FDI | Total | Total | FDI | ||||
| FDI | 0 | 0 | 0 | Total | 0 | 0 | 0 |
| 1 | 1 | 0 | 1 | 1 | 0 | ||
| 2 | 0.64431 | 0.35568 | 2 | 0.84227 | 0.15772 | ||
| 3 | 0.64360 | 0.35639 | 3 | 0.86560 | 0.13439 | ||
| 4 | 0.56646 | 0.43353 | 4 | 0.84762 | 0.15237 | ||
| 5 | 0.54406 | 0.45593 | 5 | 0.85058 | 0.14941 | ||
| 6 | 0.51133 | 0.48866 | 6 | 0.84656 | 0.15343 | ||
| 7 | 0.49292 | 0.50707 | 7 | 0.84647 | 0.1535242 | ||
| 8 | 0.4747 | 0.52521 | 8 | 0.84512 | 0.15487 | ||
| 9 | 0.46164 | 0.53835 | 9 | 0.844684 | 0.15531 | ||
| 10 | 0.45001 | 0.54998 | 10 | 0.84404 | 0.15595 | ||
| Total | 0 | 0 | 0 | FDI | 0 | 0 | 0 |
| 1 | 0.00163 | 0.99998 | 1 | 0.00001 | 0.99998 | ||
| 2 | 0.15927 | 0.84728 | 2 | 0.35497 | 0.64502 | ||
| 3 | 0.13610 | 0.86389 | 3 | 0.35636 | 0.64363 | ||
| 4 | 0.15439 | 0.84560 | 4 | 0.43366 | 0.56633 | ||
| 5 | 0.15154 | 0.84845 | 5 | 0.45636 | 0.54363 | ||
| 6 | 0.15568 | 0.84431 | 6 | 0.48925 | 0.51074 | ||
| 7 | 0.15583 | 0.84416 | 7 | 0.50782 | 0.49217 | ||
| 8 | 0.15724 | 0.8425 | 8 | 0.52607 | 0.47392 | ||
| 9 | 0.15772 | 0.84227 | 9 | 0.53931 | 0.46068 | ||
| 10 | 0.15839 | 0.84160 | 10 | 0.55101 | 0.44898 | ||
| Response Variable and Forecast Horizon | Impulse Variable | Response Variable and Forecast Horizon | Impulse Variable | ||||
|---|---|---|---|---|---|---|---|
| FDI | Carbon | Carbon | FDI | ||||
| FDI | 0 | 0 | 0 | Carbon | 0 | 0 | 0 |
| 1 | 1 | 0 | 1 | 1 | 0 | ||
| 2 | 0.64 | 0.36 | 2 | 0.9977 | 0.0022 | ||
| 3 | 0.55 | 0.45 | 3 | 0.9974 | 0.0025 | ||
| 4 | 0.49 | 0.51 | 4 | 0.9972 | 0.0028 | ||
| 5 | 0.47 | 0.53 | 5 | 0.9971 | 0.0029 | ||
| 6 | 0.45 | 0.55 | 6 | 0.9971 | 0.0030 | ||
| 7 | 0.43 | 0.57 | 7 | 0.9970 | 0.0030 | ||
| 8 | 0.43 | 0.57 | 8 | 0.9970 | 0.0030 | ||
| 9 | 0.42 | 0.58 | 9 | 0.9970 | 0.0030 | ||
| 10 | 0.41 | 0.58 | 10 | 0.9970 | 0.0031 | ||
| Carbon | 0 | 0 | 0 | FDI | 0 | 0 | 0 |
| 1 | 0.11 | 0.894 | 1 | 0.106 | 0.894 | ||
| 2 | 0.088 | 0.911 | 2 | 0.415 | 0.585 | ||
| 3 | 0.084 | 0.916 | 3 | 0.513 | 0.487 | ||
| 4 | 0.083 | 0.918 | 4 | 0.565 | 0.435 | ||
| 5 | 0.082 | 0.919 | 5 | 0.595 | 0.405 | ||
| 6 | 0.081 | 0.919 | 6 | 0.614 | 0.386 | ||
| 7 | 0.080 | 0.920 | 7 | 0.626 | 0.374 | ||
| 8 | 0.080 | 0.920 | 8 | 0.634 | 0.366 | ||
| 9 | 0.079 | 0.920 | 9 | 0.640 | 0.360 | ||
| 10 | 0.079 | 0.920 | 10 | 0.643 | 0.357 | ||
© 2018 by the authors. Licensee MDPI, Basel, Switzerland. This article is an open access article distributed under the terms and conditions of the Creative Commons Attribution (CC BY) license (http://creativecommons.org/licenses/by/4.0/).
Share and Cite
Liu, H.; Kim, H. Ecological Footprint, Foreign Direct Investment, and Gross Domestic Production: Evidence of Belt & Road Initiative Countries. Sustainability 2018, 10, 3527. https://doi.org/10.3390/su10103527
Liu H, Kim H. Ecological Footprint, Foreign Direct Investment, and Gross Domestic Production: Evidence of Belt & Road Initiative Countries. Sustainability. 2018; 10(10):3527. https://doi.org/10.3390/su10103527
Chicago/Turabian StyleLiu, Hongbo, and Hanho Kim. 2018. "Ecological Footprint, Foreign Direct Investment, and Gross Domestic Production: Evidence of Belt & Road Initiative Countries" Sustainability 10, no. 10: 3527. https://doi.org/10.3390/su10103527