1. Introduction
In recent years, extensive studies have been conducted in the areas of multi-field traffic demand management and traffic planning, traffic control, and traveler behavior guidance and control. Travel demand management (TDM) has been adopted as an efficient tool to improve the system’s level of service and balance traffic supply and demand. It has been studied and widely applied in practice in some cities, especially those with relatively limited resources that cannot satisfy the growing travel demand, such as Singapore, Curitiba, Vancouver, etc. TDM measures can be mainly categorized into five groups: (i) improvement in travel options; (ii) provisions of incentives to change travel modes; (iii) land-use management; (iv) reformation of planning policies; and (v) support of programs [
1,
2,
3,
4,
5,
6,
7,
8]. The implementation of these measures aims to not only alleviate the excessive concentration of travel demand in time and space but also attract travelers to use high-efficiency and low-pollution travel modes. It is widely recognized that the effort on improving existing infrastructure (e.g., constructing new roads or public transport system) is less effective than coercive management strategies, such as road pricing, prohibition or road closures, which change the private vehicle users’ travel behavior significantly [
9,
10,
11,
12].
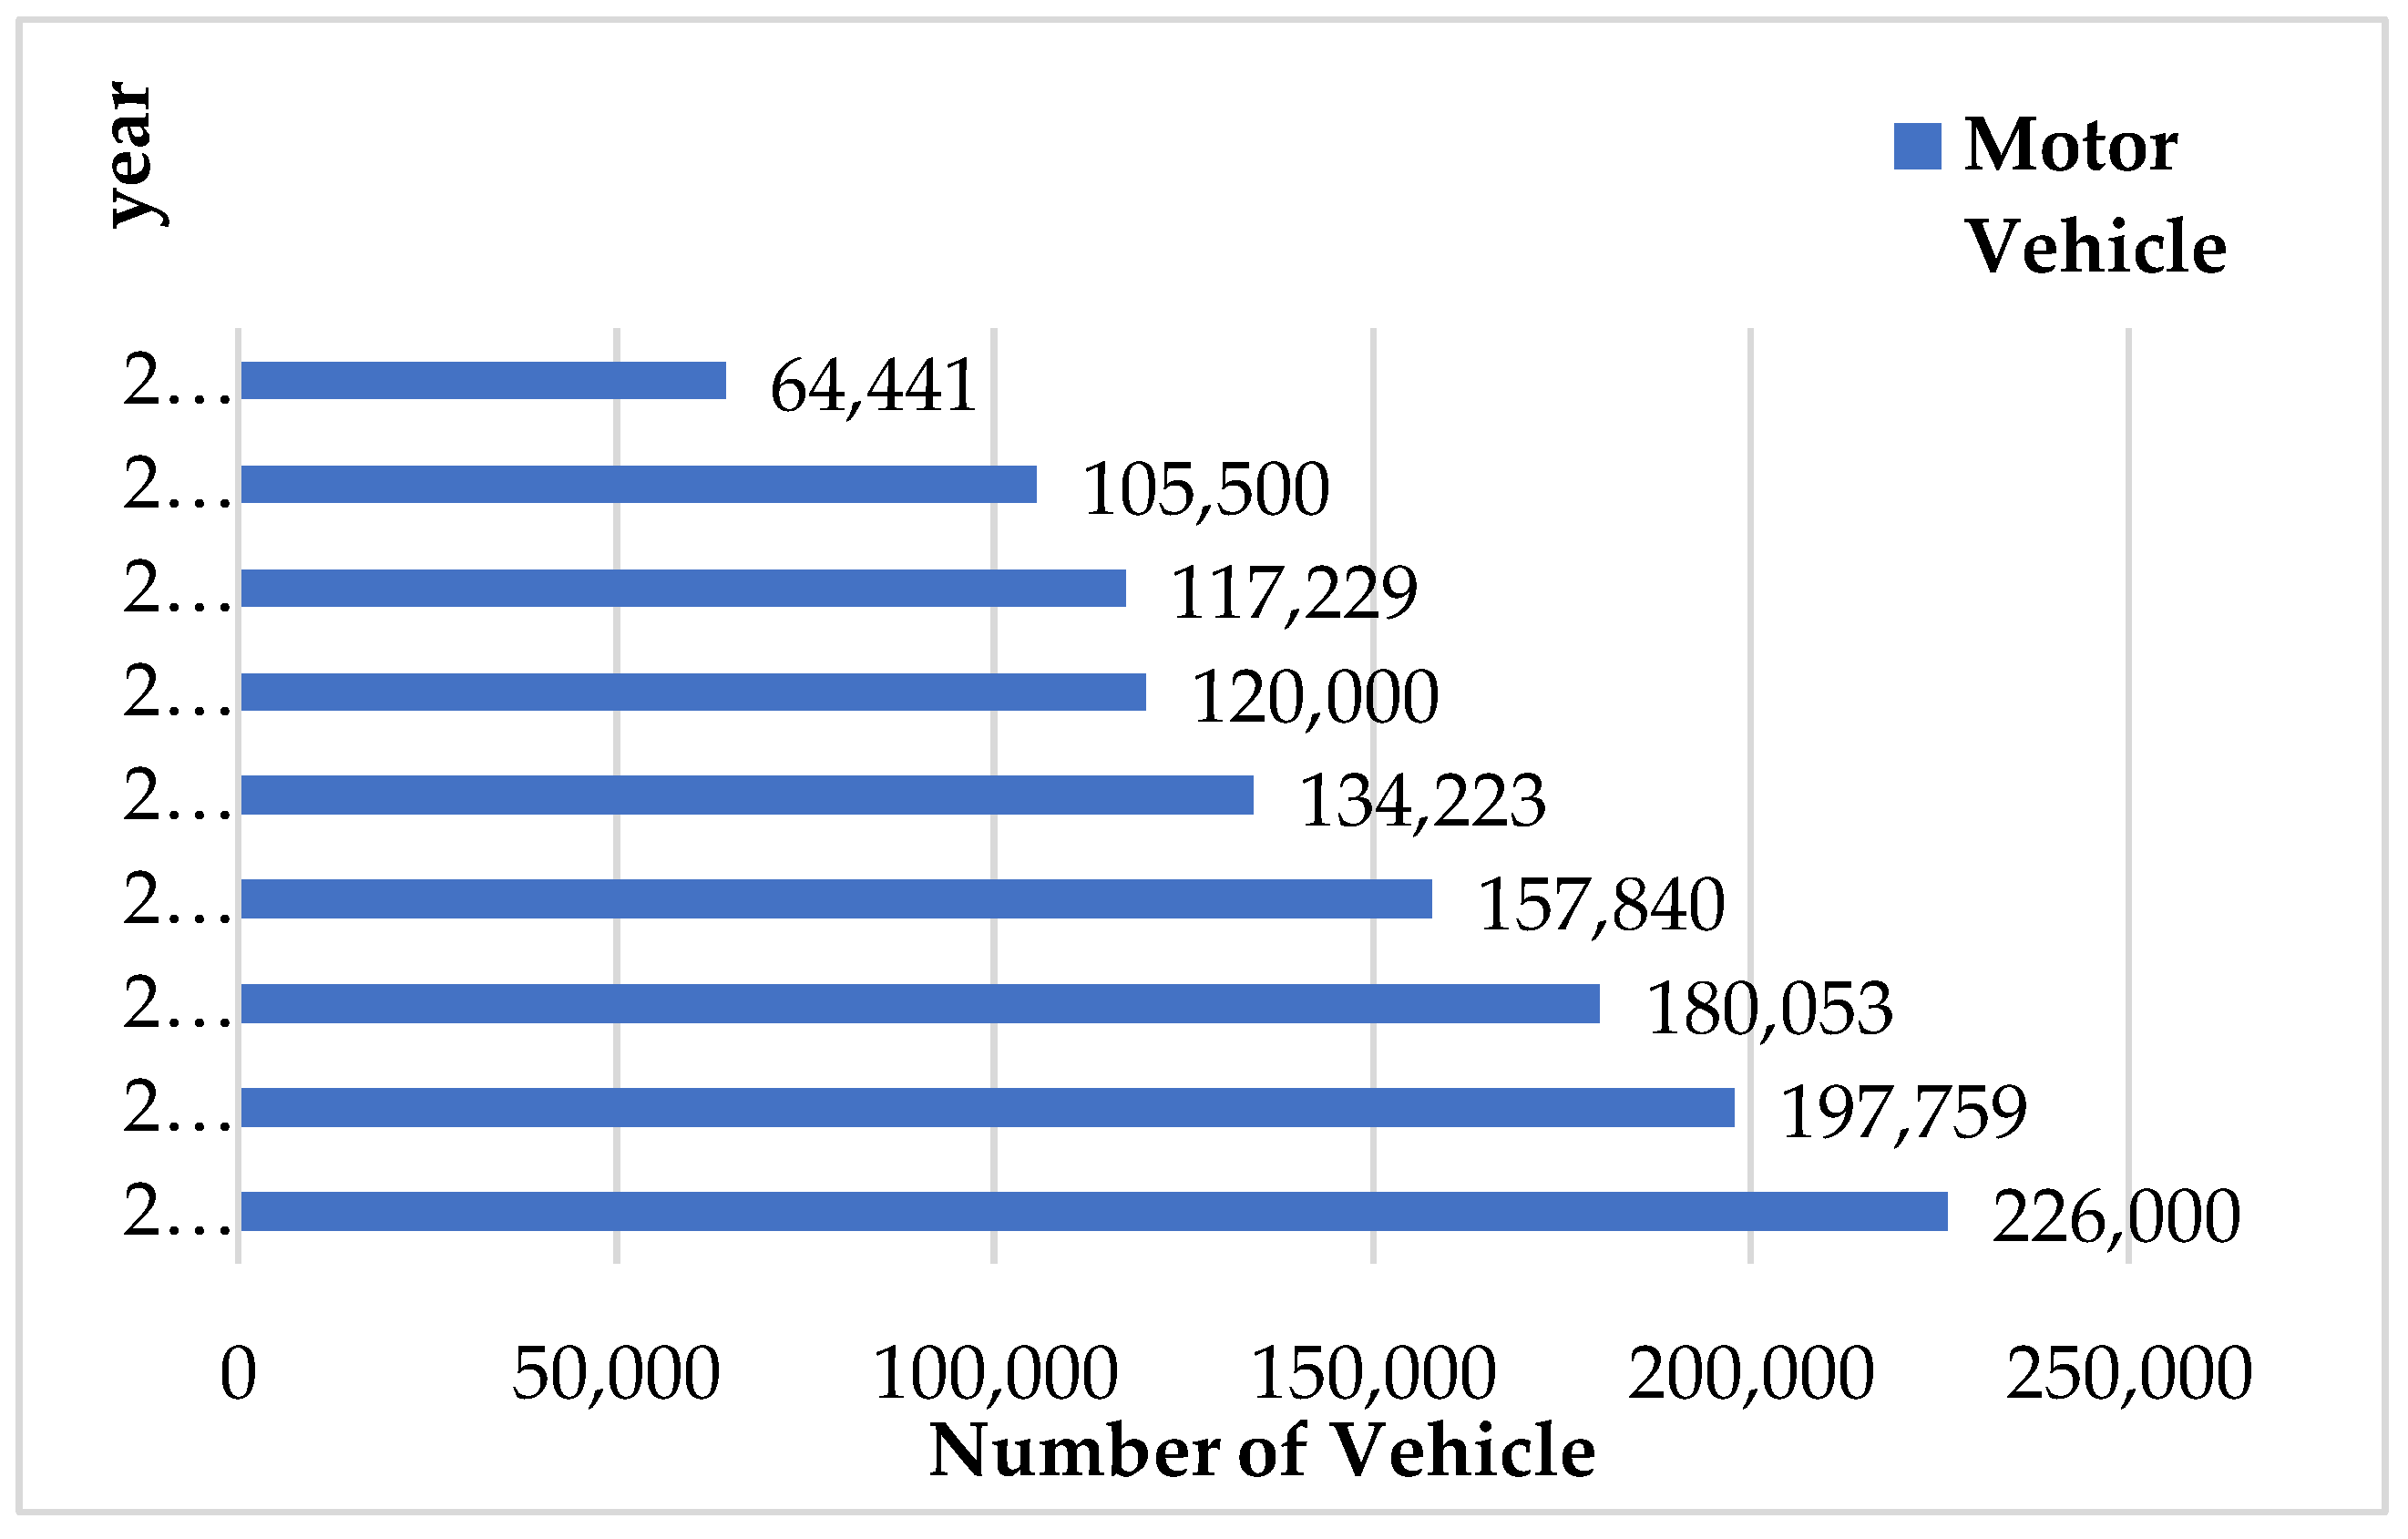
In China, underdeveloped areas refer to those regions with a certain economic strength and potential gap compared with the developed regions such as Shanghai, Shenzhen, and Beijing. The development of productive forces is unbalanced and the level of science and technology is not developed in those areas. During the reform and opening-up, the gap between the underdeveloped areas and the developed areas became more obvious. The underdeveloped areas are mainly distributed in the central and western regions of China, and Lhasa is one of the typical underdeveloped areas. As a world-known tourist city, Lhasa attracts millions of tourists every year from all over the world, which brings more than ten thousand sightseeing buses and self-driving vehicles. Moreover, Lhasa is also regarded as the sacred place of Tibetan Buddhism. Most Tibetans are devout Buddhists and expect to go on pilgrimages in their lives. Because Lhasa is located in the remote area of West China and surrounded by a mountainous environment, it is still one of the underdeveloped areas and lacks both financial investment and political support. Thanks to the tourism industry, the income of Lhasa residents has increased rapidly, resulting in a boom in private cars. As shown in
Figure 1, the total number of vehicles including private cars has increased rapidly in recent years and causing severe traffic congestion and pollution as well.
As aforementioned, the pilgrimage activity is an integral part of the citizens’ daily lives in Lhasa. Most pilgrims have to go on the pilgrimage at least five times a week. However, due to the limited financial support and transportation resources, the importance and necessity of TDM, especially for pilgrims, has not drawn enough attention in Lhasa. Hence, it is of great importance to investigate the characteristics of the transportation system in the underdeveloped area of Lhasa and develop efficient TDM strategy to maintain sustainable transportation development.
This paper recognizes the potential of transportation improvements which could promote more sustainable transportation system and investigates the links between transportation improvements and the travel mode choice behavior for pilgrimage trips in Lhasa, Tibet, China. It provides an interesting case study in an international context to highlight the extraordinary nature of the city of Lhasa, which is an underdeveloped city with limited transportation resources and pilgrim-oriented travelers. Study on the TDM in this kind of area has not received enough attention and related studies are scarce. Second, few previous studies explore the influence of traffic improvements on the travel behavior of pilgrims by using self-reported preference data collected from pilgrims using a special travel survey. This paper aims to fill these gaps [
13,
14].
2. Literature Review
Due to the importance and necessity of a sustainable transport system, scholars have conducted significant research on traffic demand management aiming to motivate travelers to choose sustainable and low-carbon travel modes. Several studies have been conducted on the travel behavior of different groups, including commuters, the elderly, college students, homosexuals, and many others [
15,
16,
17,
18]. It is obvious that different groups of travelers have various travel behavior characteristics. For instance, in Lhasa, pilgrims arrange their pilgrimages based on their own conditions. Generally, the pilgrimage begins in the morning which highly coincides with the travel time of morning commuters [
19,
20]. However, the investigation of the interrelationship between pilgrim and general commuter travel behavior has not received enough attention, especially in areas with strong religious culture and pilgrimages having specific characteristics of religious belief.
These areas have received little attention from transportation scholars. As a group of people engaged in public travel, pilgrims have the same attributes as many other people; however, they also have their own special attributes. A complete overview of the traffic environment and travel behavior in urban China was made by Wang and Zhou [
21]. Feng et al. identified a considerable increase in transport using private cars and public transport, which occurred at the expense of non-motorized transport modes [
22]. They also found a widening gap in travel behavior among low-, middle- and high-income groups. Gärling et al. proposed a conceptual framework that analyzes the changes in household travel, based on the range of potential measures available to policy makers [
23]. As another example, Aamaas and Peters studied the impact of climate on travel behavior [
24].
Studying the factors that affect the travel demands of different groups of people can help to implement specific traffic demand management strategies for those individual groups. This literature review mainly focuses on the factors that are potential determinants of the traveler’s mode choice behavior. We also highlight useful insights from recent developments and identify some literature gaps. Several TDM measures such as improving public transport, improving infrastructure and increasing the level of public transport subsidies are used to change travel related choices [
17,
23].
For example, some scholars have studied the traffic demand management of commuters, focusing on the impact of commuting benefits on commuter travel, such as employer transport benefits [
25,
26]. As pointed out by Bueno et al., employer-funded benefits programs for transit passes and bike reimbursements increase their respective mode shares and increase efficiency and sustainability of daily mobility patterns [
27]. Free car parking policy for employers is significantly associated with lower levels of commuting by public transport as well as less walking and cycling to work [
28]. Webb reported that employees who receive significant parking subsidies are more likely to drive than use alternative modes of transport [
29].
Rotaris and Danielis found that the best policy would be a mix of bus subsidies and parking restrictions which could reduce car use and improve the environmental and social sustainability of commuting to college [
30]. The model suggests the adoption of a policy mix based on a relatively low hourly parking tariff and the use of the parking revenues to subsidize the bus users design better transport policies.
In general, policymakers are convinced that there are few options for residents to choose and income is not useful to predict travel behavior in underdeveloped areas. Mercado et al. reported a geographic-based and balanced promotion of public and private mobility programs and policies to address TDM of low-income workers [
31]. Older adults with lower incomes, those who drive frequently, and those who live closer to downtown are more likely to have benefited from Oakville’s free bus program [
32]. Better transit services and street connectivity can reduce car dependency more effectively in mid-sized and small cities [
33]. A preliminary exploratory analysis sheds light on the differences in activity participation, trip chaining, time-of-day preferences for trip departure, and transportation mode selection by non-workers in Bangalore city [
34].
This literature review focuses mainly on traffic demand management of different populations under different conditions, some of which are considered as potential determinants of transport mode selection. We also highlight useful insights from recent developments and note some literature gaps. Despite the increased attention devoted to the study of the impact of traffic mode choice, there are some difficulties in evaluating public travel demand management. Even though increasing attention has been devoted to the effect of TDM measurements on the improvement of transportation, the current literature has certain gaps that have motivated this research. To the best of our knowledge, no research has been conducted on pilgrim travel behavior with respect to transportation improvements, especially in underdeveloped areas. In light of the above considerations, this study focused on how pilgrim travel behavior is affected by different types of transportation improvements, which would provide an intuitive understanding of the characteristics of pilgrim travel behavior as well as the future improvement guidance.
Overall, the contributions of this paper are threefold. First, the existing research on the effect of improving transportation mainly focuses on the cities in developed countries of Europe and the U.S., while research that is focused on Chinese urban residents is relatively scarce. Previous studies—with few exceptions, such as the one conducted by Long Cheng et al. for the case of Fushun, China—are based on surveys to research the TDM on low-income groups instead of underdeveloped cities [
35,
36,
37]. We are among the first to investigate the effects of improving transportation on travel behavior in an underdeveloped area where the transportation resource is limited and need to promote sustainable transportation system.
Second, previous studies are based on surveys conducted with people who have experienced transit improvements, or surveys that have more broadly revealed travel preferences from regional household surveys [
8,
11,
38]. The sample data studied in this paper have higher variability, because religious travel is not a daily activity and travel has some characteristics of randomness. Survey respondents were included in a follow-up survey of some of the pilgrims within a month, reducing potential bias in the results. This study could simultaneously capture the separate effects of different factors on pilgrim travel mode selection. As such, the model provides detailed information on shifts in travel behavior.
Third, the analysis developed in this research explicitly considered the influence that the condition of the pilgrim’s colony may have on pilgrim’s mode choice. We estimated context specific effects, by accounting for the spatial clustering of individuals within the entire analyzed area. Particularly, we assumed that pilgrims living in densely populated area that have better transit services would show different mobility patterns when compared to those living in rural area.
Lastly, due to the influence of pilgrimage custom, the travel behavior of pilgrims is different from other groups [
20,
21,
22,
23,
24,
25,
26,
27]. The most typical feature of pilgrims compared with other groups is the social background. The analysis in this research explicitly considered the influence of age and employment status on pilgrim choice of transportation mode. In particular, we expected that a group of pilgrims over the age of 48 may have more time for pilgrimage, and may, therefore, show different mobility patterns when compared to people under 48 years old. Most previous studies in this field have included overall income as a variable explaining mode choice instead of personal disposable income, which has higher accuracy [
33]. To this end, the multinomial logit model developed in this study was complemented with a multilevel model extension.
3. The Case of Lhasa
Chinese cities are of interest when exploring the determinants of travel mode selection in developing countries. For a fairly long period, the TDM measurement has been given a high priority in many big cities such as Chengdu and Zhengzhou, while the urban transport in cities located in underdeveloped areas has not been paid enough attention, which has great potentials for development.
One major reason is that available transportation resources are very limited. To develop this analysis, we selected one region of particular interest: Lhasa, the capital of Tibet Autonomous Region, which is the core Tibetan settlement area. The following section presents a brief summary of the main characteristics of this region, especially the religious atmosphere, population, income distribution, and some mobility patterns. Lhasa is one of the highest altitude cities in the world and is also one of the most impoverished areas in China. The city requires government policies to alleviate poverty. Low-income people account for a large proportion of the population; the proportion of middle- and high-income people is relatively small. Although residential income in Lhasa is lower than other areas, the use of cars is very extensive. Lhasa Vehicle Management Office statistics report there are more cars per person in Lhasa than in many cities in China. This situation is closely related to the serious lag in public transport development in Lhasa and its geographical position. In recent years, the number of private cars in Lhasa has also increased rapidly, which worsens a situation that is already affected by the terrain and traffic pressure. Buses serve as the main form of public transportation; taxis, tricycles, and bicycles are auxiliary elements of the system. Because of economic conditions, there are fewer buses and open bus routes in Lhasa, and the coverage rate of bus services is low.
Pilgrims usually travel in Lhasa’s old town, where roads are narrow and there is poor road infrastructure. Many motor vehicles and non-motorized vehicles travel in this area, saturating the traffic capacity of the city’s core sections. The old town, with its complicated traffic environment, is the main area for pilgrimage, as well as for other people [
39].
4. Data Sources, Variables and Model Development
To explore the effects of transportation improvements on pilgrim group travel behavior in Lhasa, we established a multinomial logit model based on data obtained from the 2010–2016 Travel Behavior of Pilgrimage Groups Survey. intermittent observations have been collected since 2010. In 2015 and 2016, questionnaires were used to gather information from respondents for statistical analysis. Follow-up surveys were conducted for more information.
The survey is particularly useful for studying the relationship between transportation improvements and the travel mode choice behavior of individual pilgrims. The provision of transportation improvements can be categorized into four types: (i) transit-related (e.g., discounted and free tickets); (ii) private transport-related (e.g., free parking available for the pilgrims and provision of special purpose vehicles for pilgrimages); (iii) pedestrian-related (e.g., pilgrimage exclusive lane); and (iv) bicycle-related (e.g., bike sharing and manpower tricycle).
The variables initially included in the modeling approach are listed in
Table 1. The dependent variable refers to the self-reported usual pilgrimage mode (driving, public transport, walking, and cycling). During the study, it was found that manpower tricycles operate mainly in the core of the pilgrimage area but road lanes designed for bicycles are scarce in Lhasa. In this regard, we combined bicycle traffic into pedestrian traffic, where available options have been grouped into these three categories: (i) private transportation providing motorized door-to-door service, including private vehicles and taxis; (ii) public transportation, including buses only; and (iii) pedestrian for short-distance trips, including walking and bicycles.
The explanatory variables include both individual and extrinsic characteristics (see
Table 1). Individual characteristics include gender, age (self-report age), language habits (Tibetan only or Tibetan–Chinese), education level, and religious rating. Extrinsic characteristics include personal disposable income, family status, employment status, regional characteristics (distinguishing habits and customs), and others. The condition of the pilgrim’s colony to capture residential-specific factors was also evaluated and can be divided into high, moderate and low demand density areas.
The sample of pilgrims included a balanced proportion of men (48.6%) and women (51.4%) while the number of respondents aged between 55 and 64 years old (29.6%) is much more than other age groups. The personal disposable income of respondents typically falls above RMB 1500. The number of respondents who are aged 24 and 48 that use private vehicles is only 33% (25% of the sample). Due to the nature of the database, it is also noticeable that more than half of the respondents are employed (54.2%). According to the sample, which is representative of the region, fewer pilgrims drive to pilgrimage (23.8%) than use public transportation (56.3%). In addition, 61.5% reported receiving transportation improvement benefits, including free and/or discounted tickets, using discount tickets, pedestrian lanes for pilgrimage, and/or other benefits.
This study adopted the multinomial logit model to explore effects of the transportation improvements on pilgrim’s travel behavior. The logit model is derived from the utility maximization behavior, assuming that decision makers are utility maximizers. According to economic theory, the individual will choose the option with the largest utility [
40].
Random utility theory was used to describe the pilgrim travel mode choice behavior with specific characteristics that relate to traffic behavior impact utility. In the overall analytical process, the pilgrim’s utility can be seen as a random variable. Let
denote the utility function, which is composed of a fixed term and a random error term. According to the utility theory, we set the aggregate of the selection scheme that is chosen by the traveler
as
; the utility of selecting scheme
is
; and the condition that the traveler
chooses from the scheme
which belongs to is
must follow:
Thus, if the utility of traveler
who chooses scheme
is
, then
can be represented by Equation (2):
where
is the fixed term in the utility function;
is the probability term in the utility function;
is a vector of observed variables relating to the alternative
that defines individual or extrinsic characteristics such as gender, age, employment status, personal disposable income or transport accessibility; and
is a vector of coefficients to be estimated.
According to Train, for the choice between different transportation mode alternatives, the multinomial logit regression model is given by Equation (3), where
equals the probability that the traveler
chooses scheme
[
41]:
MNL models the odds of each category relative to a baseline category as a function of covariates. The odds are the ratio of the probability that the event of interest occurs to the probability that it does not [
42]. Regarding the interpretation of the results, the
coefficient indicates that, for a unitary increase in a certain explanatory variable
, the odds ratio in favor of happening
increases by
.
We computed the marginal effects (MEs) of the continuous variable and the categorical variable of the model. If the explanatory factor increases, even though the total utility achieved increases, the resulting unit of utility diminishes. Variable classification is qualitative, which involves a class of attribute, or an incompatibility (only one type can be selected), such as sex in men and women. Some variables are continuous variables, such as a pilgrim’s disposable income. Among marginal benefits, categorical variables show differences in prediction probabilities, whereas continuous variables measure the instantaneous rate of change. There were many independent variables in this study, but the number of valid samples as well as quantity of covariate was limited. The cross-validation technique was adopted to predict the accuracy of the final model and to verify the accuracy in practice, preventing overfitting. We divided the data into two parts: 90% of the sample data were used to build the multinomial logit model and 10% of the data were used to test model results.
The condition of the pilgrim’s colony was also added as dummy variables to explore the potential differences between groups of pilgrims living in areas with different geographical patterns. Considering the population distribution characteristics of Lhasa, we used population density towards the residence of pilgrim living conditions, based on their residence location. This analysis represented an extension to reinforce the developed model, by applying the standard multilevel binary logit analysis based on random coefficients [
43]. Pilgrim populations may be densely populated, moderately concentrated, or sparsely populated. It was assumed that, in densely populated areas, the transportation is relatively developed; and, in sparsely populated areas, the traffic is relatively less convenient.
5. Results
This section summarizes the main findings from the multinomial logit regression analysis, which discusses the impact of transportation improvements on pilgrim travel behavior.
The explanatory variables, including education level, religious rating, and family status were excluded from the final model because they had a non-statistically significant impact on model results (
p-value > 0.10). Pilgrimage has become a part of a life in Lhasa, where 54.2% of the pilgrims occupy a certain position in their family.
Table 2 shows the final results of the model analysis.
The results confirm that pilgrim travel mode choice behavior is influenced by both individual and extrinsic characteristics. Among the extrinsic characteristics, transportation improvements are found to be the most significant determinant of their choices. In underdeveloped areas such as Lhasa, there is a significantly positive correlation between transportation improvements and pilgrimage travel. This result is consist with the conclusions proposed by Cheng et al., who studied travel during ethnic and religious holidays and passenger service optimization [
44].
Overall, pilgrims who have experienced improvements in transportation are more likely to use public transport or walk rather than to take a private car. For instance, in Lhasa, people aged 60 or above have access to important public transportation-related improvements such as free tickets. On the other hand, the improvements in private transportation are strongly correlated with increased travel using private cars. Compared to individuals who have not recognized the improvements, pilgrims are more likely to choose private cars instead of choosing other travel modes. Private travel has a greater impact on pilgrim travel, based on vehicle possession per capita in this area. In fact, walking/cycling is better for short distance travel in a safe and comfortable road environment. However, the number of people who choose to walk/cycle is the lowest (20% of the sample). In underdeveloped areas, the government has not paid enough attention to non-motorized transportation infrastructures. Therefore, transportation improvements provided by the government have a significant impact on a pilgrim’s travel mode choice, motivating them towards lower-carbon options (e.g., riding public transport or walking/cycling), rather than choosing a private car.
This study also used the time-based accessibility approach to examine public transport using the Geographic Information Systems technology [
45]. This allowed us to determine the accessibility of public transport to the pilgrim community. In the research process, we primarily used large-scale residential communities as a research point. Data for dispersed pilgrims were aggregated with data for other pilgrims at the nearest research site. In places without access to public transport, pilgrims tended to prefer private cars as a means of travel; the
of public transportation and walking were 0.315 and 0.084, respectively. People with more access can easily choose public transportation.
Considering pilgrim colony conditions, when comparing public transportation and walking/cycling, significant differences in travel behavior were observed between densely and sparse population areas. The probability of pilgrims in rare populated areas choosing private cars is 1.414 times and 13.598 times compared with public transportation and walking/cycling, respectively. One of the reasons is that, in sparsely populated areas, the level of service in public transportation and pedestrian/cycling systems is relatively low. Admittedly, there is a greater probability that pilgrims will choose a private car to travel. The income variable does not appear to have a statistically significant influence. This study used the disposable income of pilgrims, rather than personal income, because it eliminates the contrast between overall income and pilgrim travel expenses. As income increases, the relative probability of pilgrims selecting public transportation and walking is 0.077 and 0.072, respectively. From the perspective of saving time, many young pilgrims choose private cars for travel. Public transport travels faster than walking, and older pilgrims have no strict time requirements and think walking is better for exercise. Some pilgrims believe that public transport and walking have different advantages in short distance travel. Therefore, under the premise of choosing private cars to travel, the relative probability of pilgrims choosing public transportation and walking does not look significantly different. People with higher disposable income are more likely to choose private cars. In general, people with higher disposable income have higher income overall, and their probability of having private cars is higher.
When considering individual characteristics, employment status and age are very significant determinants that influence the pilgrim’s mode choice. As age increases, the probability of choosing buses and walking significantly increases, compared with the probability of choosing a private car; the values were 1.93 and 2.048, respectively. Human visual ability and responsiveness decline as we grow older; as such, many people give up driving cars and transition to other modes of transportation. Compared with those who are not employed, employed pilgrims generally selected private car travel, rather than buses and walking. This is to save travel time. The probability of choosing buses and walking were 0.38 and 0.335, respectively.
In terms of gender, when considering the three traffic modes (private cars, public transportation, and walking/cycling), men had a higher probability of choosing a private vehicle than female pilgrims. Compared with female pilgrims, the relative probability of male pilgrims selecting public transportation and walking is 0.242 and 0.041, respectively. Influenced by Chinese traditional culture, female pilgrims generally participate in family life activities, and such activities do not require much private car travel, while the male pilgrims usually participate in social activities, which demand for private cars frequently. The result is similar to the findings of previous studies about other groups [
14]. Female pilgrims are found to be more likely to walk, followed by taking public transportation.
As one of the minority nationalities in China, some pilgrims are accustomed to using the Tibetan language, while others are proficient in both Chinese and Tibetan. Pilgrims who are accustomed to using Tibetan for communication are generally older, and prefer to take the bus more than private vehicles.
The influence of the explanatory factors can also be interpreted by accounting for the marginal effects of predicted probabilities.
Table 3 shows the main results obtained from this analysis. Among all the variables modeled, those having the greatest impact on travel mode choice decisions include transportation improvements, employment status, age, and the condition of the pilgrim’s colony.
According to the results, setting all variables at their means shows that, if the pilgrims experience public transportation improvements, the probability of using private cars decreases by 10%, and the probability of walking/cycling decreases by 12%. As age increases, the proportion of bus riders reduces the probability of driving by 3%. When personal disposable income increases, the proportion of bus riders increases by 15%. When pilgrims live in densely populated area, the proportion of bus riders increases by 6%, while the probabilities for walking/cycling (−24%) is strongly reduced. By contrast, a change towards non-employment reduces the probability of driving by 18% and increases the likelihood for riding public transport by 32%.
Similar marginal effect findings are obtained for the variables related to public transport accessibility. When public transport is not accessible, the probability of choosing the private car alternative increases by 9%.
Table 3 provides additional information about the marginal effects reported for other explanatory variables included in this research.
Finally, the influence of the condition of the pilgrim’s colony on pilgrim choice of transportation mode is analyzed within the study area. Estimated results indicate the differences in travel habits between densely populated areas and sparsely populated areas are associated with a decreased likelihood of riding public transportation, walking, and cycling to work (see
Table 2). As aforementioned, we tested the internal validity of the model by using a 10-fold cross-validation method. This simulation shows that the model correctly predicts an average of 88% of the transport mode choices made by surveyed individuals. This is further evidence that our model can accurately predict travel behavior.
6. Summary and Conclusions
This study aimed to investigate the impact of transportation improvements on the travel behavior of pilgrims in Lhasa, Tibet. The paper’s authors have worked at the Tibet University and have been facilitating the long-term and intermittent observation and research on local resident lifestyles, including travel behavior, disposable income change, traffic volume, etc. This study used individual data for 2015–2016 and investigated pilgrim travel behavior. We specifically investigated how the improvements in transportation could influence the pilgrim’s travel model choice behavior, including both individual and extrinsic factors, by comparing different pilgrims who travel using different modes of transportation.
To that end, a multinomial logit model was applied to analyze the impact of individual and external factors, particularly different types of transportation improvements, on the choice of transportation mode. We also explored the relative importance of additional explanatory variables, including age, employment status, accessibility to public transport, personal disposable income, and others. The analysis yielded some interesting conclusions.
The first conclusion is that transportation improvements (public, private, and pedestrian) have significant impacts on guiding public travel. In underdeveloped areas with limited public transportation resources, private travel accounts for a large proportion of travel. Therefore, making private car improvements can rapidly increase the public’s attraction to this mode. The attractiveness of improved public transportation needs to be strengthened.
As a remote city in a developing country, Lhasa has a shortage of public transportation resources, resulting in an abnormal development of private cars. Our goal is to reduce the public’s reliance on private cars; efforts to invest in better public traffic improvement would reverse this situation and ensure that traffic resources in underdeveloped areas can achieve sustainable development, for example improvements include increasing bus fare discounts and adjusting the age at which pilgrims receive free bus tickets (from 60 to 55). In addition, we can strengthen public access to transportation by improving infrastructure and facilities. For pedestrian transportation, we need to increase its attractiveness for short distance travel.
This result is important to inspire the transportation agency to develop policies on increasing low-carbon traffic in China’s underdeveloped areas by introducing a multi-modal transit system including public transportation and pedestrian traffic. At the same time, in such underdeveloped areas, it is better to reconstruct the entire public transit system rather than simply restrict private car development. This would improve the efficiency of a specific mode of transportation.
As such, we also studied other individual and external factors that could influence the choice of traffic patterns. Based on this study’s results, we conclude that age, disposable income, and employment status will affect traffic pattern choices. Along with the growth of the pilgrim’s age, they are more likely to be affected by their physical condition. However, the probability of choosing public transportation and walking increases because most pilgrims believe that it could express their attitudes towards religion, which is also a special characteristic of pilgrim travel behavior. Employed people with higher incomes are more likely to choose a private cars without significant access to public transportation.
Although many factors could influence the travel behavior of a group of pilgrims, many of these factors are not easy to change or fix. Transportation improvements have a higher degree of implementation in underdeveloped areas, and also facilitate change by those using that transportation. As such, this study supports the finding that transportation improvements are an important driver of transportation choices. This result is important, as policy efforts are directed towards reducing car dependency in China. We recommend promoting the popularity and intensity of transport improvements in economically underdeveloped areas, where there are inadequate transportation resources, such as Lhasa. This includes increasing pilgrim dependency on public transportation or walking/cycling, reducing the use of private cars on the trip, and making pilgrimage as a model for low carbon travel.


