Article

Analysis of the Ecosystem Soil Conservation Function Based on the Major Function-Oriented Zones across the Yangtze River Economic Belt, China

1
Nanjing Institute of Environmental Sciences, Ministry of Environmental Protection, Nanjing 210042, China
2
Key Laboratory of Land Surface Pattern and Simulation, Institute of Geographic Sciences and Natural Resources Research, Chinese Academy of Sciences, Beijing 100101, China
3
School of Architecture and Civil Engineering, Chengdu University, Chengdu 610106, China
*
Author to whom correspondence should be addressed.
Sustainability 2018, 10(10), 3425; https://doi.org/10.3390/su10103425
Submission received: 7 August 2018 / Revised: 18 September 2018 / Accepted: 19 September 2018 / Published: 26 September 2018

Abstract

:
The Yangtze River Economic Belt (YREB) is an important ecological security barrier for China. The spatial-temporal pattern of land use changes and changing characteristics of soil conservation function were analyzed based on the Major Function-Oriented Zones (MFOZs) from 2010 to 2015. Soil conservation was calculated by the Revised Universal Soil Loss Equation (RUSLE). Results were as follows: in 2015, the area ratio of built-up land in the optimal development zones (ODZs), key development zones (KDZs), agricultural production zones (APZs) and key ecological function zones (KEFZs) was 25.25%, 6.55%, 3.70% and 0.40%, respectively, which reflected the gradient of territorial development based on their functions. The average annual soil retention was 18.76 billion t/year during the study period, and the per unit soil retention was 91.54 t/hm2/year. The soil conservation function capacity was weakened in the order of KEFZs, APZs, KDZs and ODZs. Soil conservation function of the YREB showed an overall improvement from 2010 to 2015. The implementation of the MOFZs strategy has contributed significantly to improving the ecological security capability of the YREB.

1. Introduction

Since the reform and opening-up policy, China’s economy and society have developed rapidly and urbanization and industrialization have accelerated, but this has led to unplanned development of national land spaces [1,2,3]. To create a sustainable development pattern, China approved the implementation of the “National Plan for Major Function-Oriented Zones (MFOZs)” in 2010, which clarified the main objectives and strategic structure of future land development. The plan divides China’s national land space into four categories and two levels, based on regional resources and environmental carrying capacity, existing development density and development potential [4,5]. The MFOZs strategy is a new method of spatial regulation in China. The approach has important strategic significance for creating a land space development pattern that is coordinated with the population, economy and resource environment, accelerating the transformation of economic development and promoting long-term stable social and economic growth [6,7,8].
Ecosystem services have become a research focus in international ecology and economics since the 1990s. “Soil conservation” is an important ecosystem service [9,10]. It not only provides a basis for human agricultural production and crop productivity, but also provides protection by reducing flood risks, preventing ecological deterioration and mitigating global warming. There are good research foundations into the comprehensive assessment of soil conservation function for regional ecosystem management and decision-making [11,12,13]. The development of GIS and remote sensing technologies and their application in the ecological field also provide technical and real-time dynamic information support for its comprehensive assessment [14,15]. The Revised Universal Soil Loss Equation (RUSLE) was an empirical model for predicting soil erosion rates in the USA [16]. Because of its simple form and fewer required parameters, it has been widely used all over the world [17,18,19,20]. In recent years, the key scientific issues of soil conservation have focused on the close relationship between ecosystem structure, process and service [21,22], benefits evaluation of different farming practices [23,24,25], contribution rate of climate change and land use change [26,27,28], trade-offs and decision management of ecosystem service [12,13].
The Yangtze River Economic Belt covers 11 provinces (municipalities), accounting for about 21% of China’s territory. More than 40% of China’s population and GDP come from this region. In recent years, high population density and development intensity has led to an expansion of urban construction and a reduction in ecological space. The ecosystem pattern has changed considerably. Soil erosion has been prominent in some areas, and ecological function has been degraded [29,30,31]. The region has seven national-level key prevention regions for soil erosion and eight national-level key rehabilitation regions for soil erosion. Soil conservation function of natural ecosystems needs to be strengthened. Promoting development in the YREB has been a major decision-making arrangement of China. At the beginning of 2016, the goal of “together with great protection and no major development” for the YREB was clarified. At present, a number of studies related to soil erosion or soil conservation have been performed of this region [32,33,34]. However, most of these previous studies are on regional or basin scales, while studies related to the MFOZs on soil conservation ability are infrequent. Characteristics analysis of land use changes and soil conservation function based on the MFOZs are of great significance for assessing the development intensity of the land space and improving the ecological security capacity across the YREB.
This paper focuses on the temporal and spatial variations of the soil conservation function across the YREB after the implementation of the plan for MFOZs. The objectives of this study during the period of 2010–2015 were: (1) to quantitatively evaluate land use changes in the YREB and the four MFOZs; and (2) to quantitatively evaluate spatial and temporal changes of soil conservation function in the YREB and the four MFOZs. Findings from the study have great significance for promoting the ecological security ability of the study area.

2. Materials and Methods
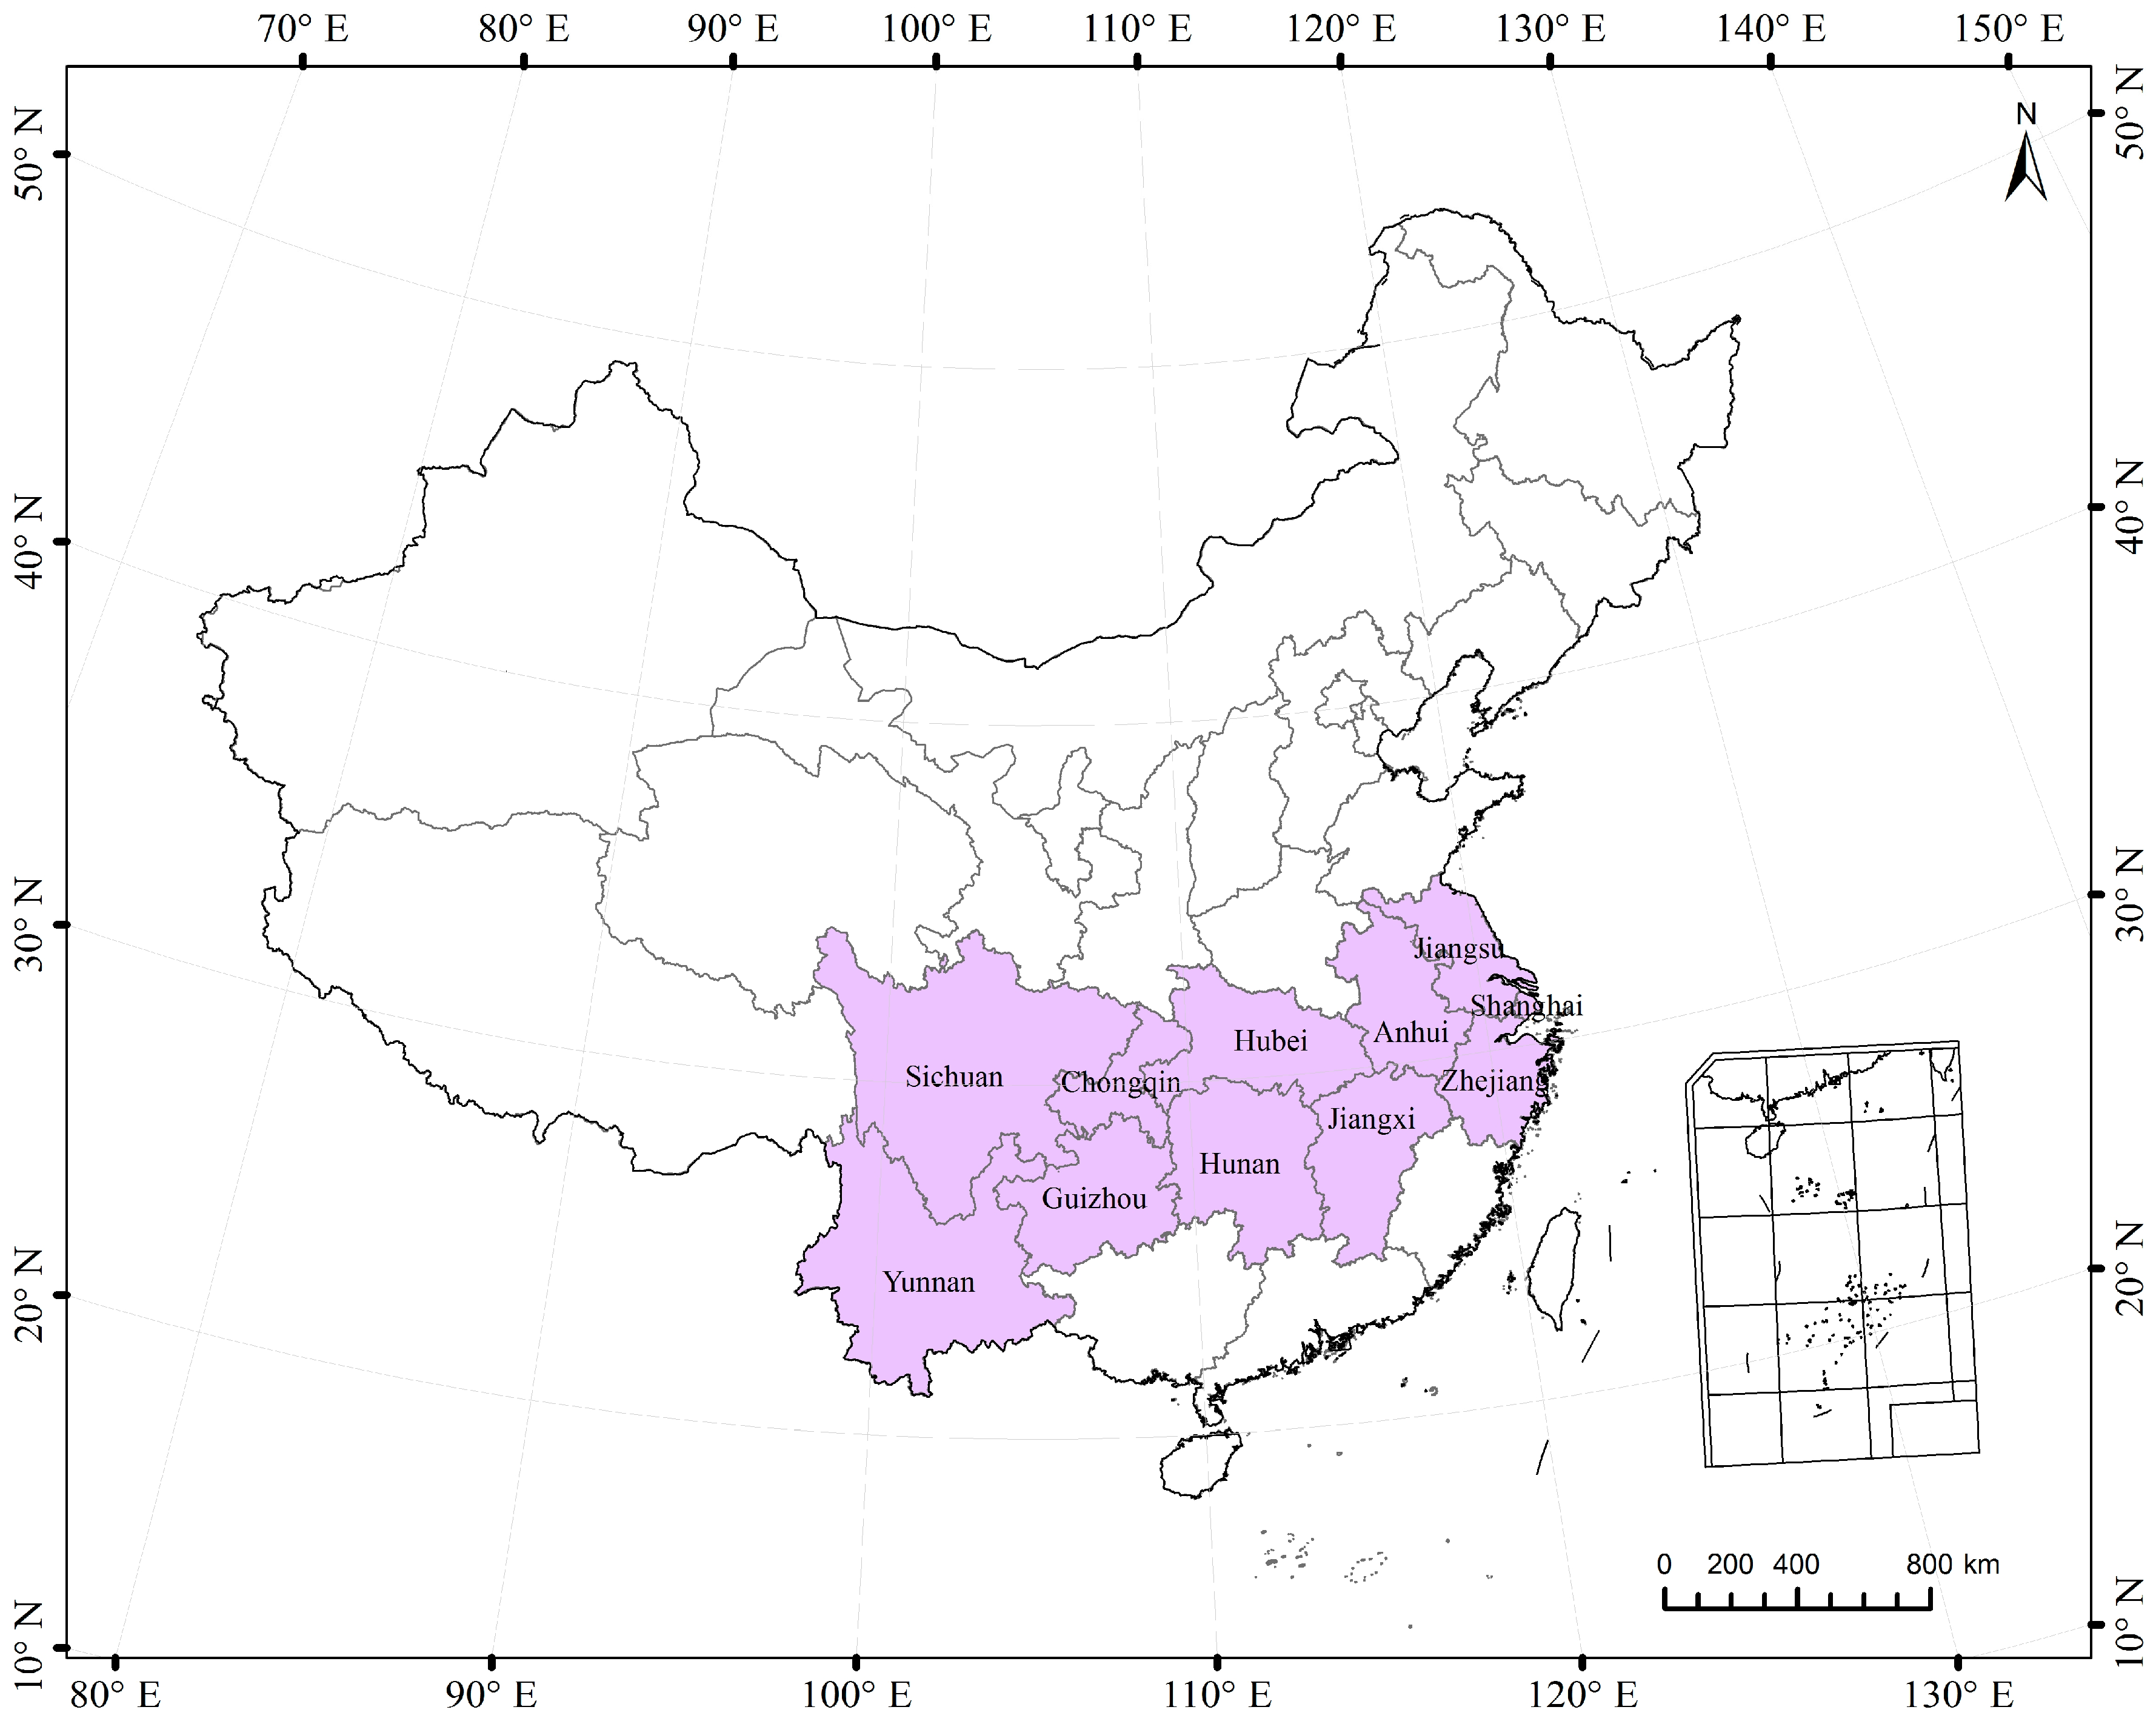
2.1. Study Area

The YREB (21°08′45′′–34°56′47′′ N, 97°31′50′′–121°53′23′′ E) covers 11 provinces (municipalities), including Shanghai, Jiangsu, Zhejiang, Anhui, Jiangxi, Hubei, Hunan, Chongqing, Sichuan, Yunnan and Guizhou (Figure 1). The total area is 205 million hm2. The terrain and landforms are complex, with the Yunnan-Guizhou Plateau, Sichuan Basin, Three Gorges Reservoir, Dongting Lake, Poyang Lake, Jiangnan Hills and Huang-huai Plain. The region experiences a subtropical monsoon climate. The annual temperature ranges from 6 to 16 °C, and annual precipitation ranges from 800 to 1600 mm.
The YREB has unique locational advantages and great potential for development. The Yangtze River is an important waterway for industrial distribution and three industrial and urban agglomerations have formed in Chengdu–Chongqing, the middle reaches of the Yangtze River and the Yangtze River delta.
The YREB contains 131 counties with national-level optimal development zones (ODZs) covering an area of 40,600 km2 (1.99% of the total area of the YREB), which are mainly distributed in the Yangtze River Delta region. The key development zones (KDZs) involve 210 counties covering 9.93% and are mainly distributed in the middle reaches of the Yangtze River, Chengdu-Chongqing, central Guizhou and Yunnan. The agricultural production zones (APZs) cover 293 counties with an area of 30.54% and are mainly distributed in plain areas such as Taihu Lake, Chaohu Lake, Poyang Lake, Dongting Lake, Han River, Jiang-huai and Chengdu. The key ecological function zones (KEFZs) involve 149 counties with an area of 28.74% and are mainly distributed in the upper and middle reaches of the Yangtze River (Figure 2).

2.2. Methods

2.2.1. Land Use Dynamics

The indicator of “changing rate of land use types” was adopted to show land use changes over a certain period across the YREB. The formula is as follows:
K = U b U a U a × 1 T × 100 %
where Ua (km2) and Ub (km2) represent the initial and final areas of a given land use, respectively; T is the number of years; and K is the changing rate of land use types (%/year).

2.2.2. Soil Conservation Assessment

In this paper, soil conservation function was explained by soil retention and soil retention rate.
The soil retention (Ac) was defined as the potential soil erosion in conditions of extreme degradation minus the soil erosion with the current land use/land cover [35]. The formula is calculated as:
A c = A p A r  
where Ap is the soil erosion rates (t/ha/year) in conditions of extreme degradation without vegetation cover and Ar is the soil erosion rates with the current land cover and management conditions.
Soil erosion intensity was calculated by the Revised Universal Soil Loss Equation (RUSLE) [36]:
A = R × K × L × S × C × P  
where A is the annual soil erosion module (t/hm2/year); R is the rainfall erodibility factor (MJ·mm/(t/hm2/year)); K is the soil erodibility factor (t·h/(MJ·mm)); L is the slope length factor; S is the slope factor; C is the vegetation cover factor; and P is the erosion control practice factor.

Rainfall Erodibility Factor (R)

Rainfall is a driving factor for soil erosion. The R factor was calculated using the method of Zhang et al. (2002) [37], which has been widely used in China [38,39]. It was estimated as follows:
M i = α j = 1 k D j β  
where Mi is the half-month rainfall erodibility (MJ·mm·hm−2·h−1·year−1). Dj is the effective rainfall for day j in one half-month. Dj is equal to the actual rainfall if the actual rainfall is larger than the threshold value of 12 mm, which is the standard for China’s erosive rainfall. Otherwise, Dj is equal to zero [23]. k is the number of days in the half-month. α and β are the undetermined parameters:
β = 0.8363 + 18.144 P ¯ d 12 + 24.455 P ¯ y 12  
α = 21.586 β 7.189   1  
where P ¯ d 12 is the average daily rainfall which is more than 12 mm and P ¯ y 12 is the yearly average rainfall for days with rainfall more than 12 mm.

Soil Erodibility Factor (K)

The K factor is an indicator of the sensitivity of soil properties to soil erosion [40], which was calculated using the EPIC equation [41] as follows:
K = { 0.2 + 0.3 exp [ 0.0256 SAN ( 1 SIL ) 100 ] } ( SIL CLA + SIL ) 0.3 × [ 1.0 0.25 C C + exp ( 3.72 2.95 C ) ] [ 1.0 0.7 SNI SNI + exp ( 5.51 + 22.9 SNI ) ] × 0.1317
where SAN, SIL and CLA are the content of soil sand (%), silt (%), and clay (%), respectively; C is the content of soil organic carbon (%); SNI is equal to 1 − SAN/100; and 0.1317 is the conversion factor from US customary units to SI units.

Topographic Factor (LS)

Topography is a direct inducer of soil erosion [42], which was calculated using the algorithms developed by McCool et al. (1989) [43] and Liu et al. (1994) [44] as follows:
L = ( λ 22.13 ) m  
m = β / ( 1 + β )
β = ( sin θ / 0.0896 ) / [ 3.0 ( sin θ ) 0.8 + 0.56 ]  
S = { 10.8   sin θ + 0.03 θ < 9 % 16.8   sin θ 0.50 9 % θ 18 % 21.91 sin θ 0.96 θ > 18 %  
where λ is the slope length (m); m is a dimensionless constant depending on the percent slope (θ); and S is the slope (rad).

Vegetation Cover Factor (C)

Vegetation is the most sensitive factor that influenced soil erosion [45]. The C factor estimation was calculated using the method of Cai et al. (2000) [46]. The formula is as follows:
C = { 1 f = 0 0.6508 0.3436 lgf 0 < f 78.3 % 0 f > 78.3 %  
Vegetation coverage (f) was calculated according to the following equation [47]:
f = NDVI NDVI soil NDVI veg NDVI soil  
where NDVI is the value for a pixel; NDVIsoil and NDVIveg is the NDVI values of bare soil and pure vegetation, respectively.

Erosion Control Practice Factor (P)

The P factor refers to the ratio of the amount of soil erosion after some cultivation measures for slope planting, which was roughly determined from the land use data of the YREB (Table 1).
The soil retention rate refers to the level of soil retention for a certain ecosystem type in the assessed area compared with that of the same optimal ecosystem [48], which can eliminate the impact of inter-annual precipitation fluctuations on the assessment of ecosystem conservation capability. The formula is calculated as:
SP = SK SK g × 100 %  
where SP is the soil retention rate for a certain ecosystem type (%); SK is the soil retention for a certain ecosystem type (t/hm2); and SKg is the soil retention for the same optimal ecosystem (t/hm2).

2.2.3. Change Trend Analysis

The slope of the linear trend can be calculated for a certain period in ArcGIS [49]. It is expressed as:
Slope = n × i = 1 n i × X i i = 1 n i i = 1 n X i n × i = 1 n i 2 ( i = 1 n i ) 2  
where i is the number of years; n is the total number of years; and Xi is the value of the variable for each year i.

2.3. Data Sources

2.3.1. Land Use Datasets

Land use datasets for 2010 and 2015 were supplied by the Resource and Environmental Science Data Center, Chinese Academy of Sciences. They were refined through human–computer interaction and interpretation, using Landsat TM/ETM images based on a remote sensing classification system [50]. The datasets included six first-level categories (Woodland, Grassland, Cropland, Built-up land, Water body and Unused land) and 25 sub-classes (Table 2).

2.3.2. Major Function-Oriented Zones

The data for MFOZs were collected from the National Plan for Major Function-Oriented Zones issued by the State Council. It was designed as a national-level and provincial-level hierarchy. This paper only refers to the national level. Based on current development intensity and future development potential, land was divided into the optimal development zones (ODZs), key development zones (KDZs), restricted development zones (RDZs) and prohibited development zones (PDZs) [6] (Table 3). The RDZs were further divided into agricultural production zones (APZs) and key ecological function zones (KEFZs). As the areas of PDZs are relatively small, this study chose not to consider them.

2.3.3. Other Data

Daily rainfall data from 2010 to 2015 were provided by the National Meteorological Information Center. Soil texture data were collected from the Resource and Environmental Science Data Center, Chinese Academy of Sciences. DEM dataset with a resolution of 90 m was derived from Geospatial Data Cloud. The gridded 16-day 1 km NDVI MOD13A products (2010–2015) were obtained from NASA EOS DATA.

3. Results

3.1. Analysis and Changes in Land Use

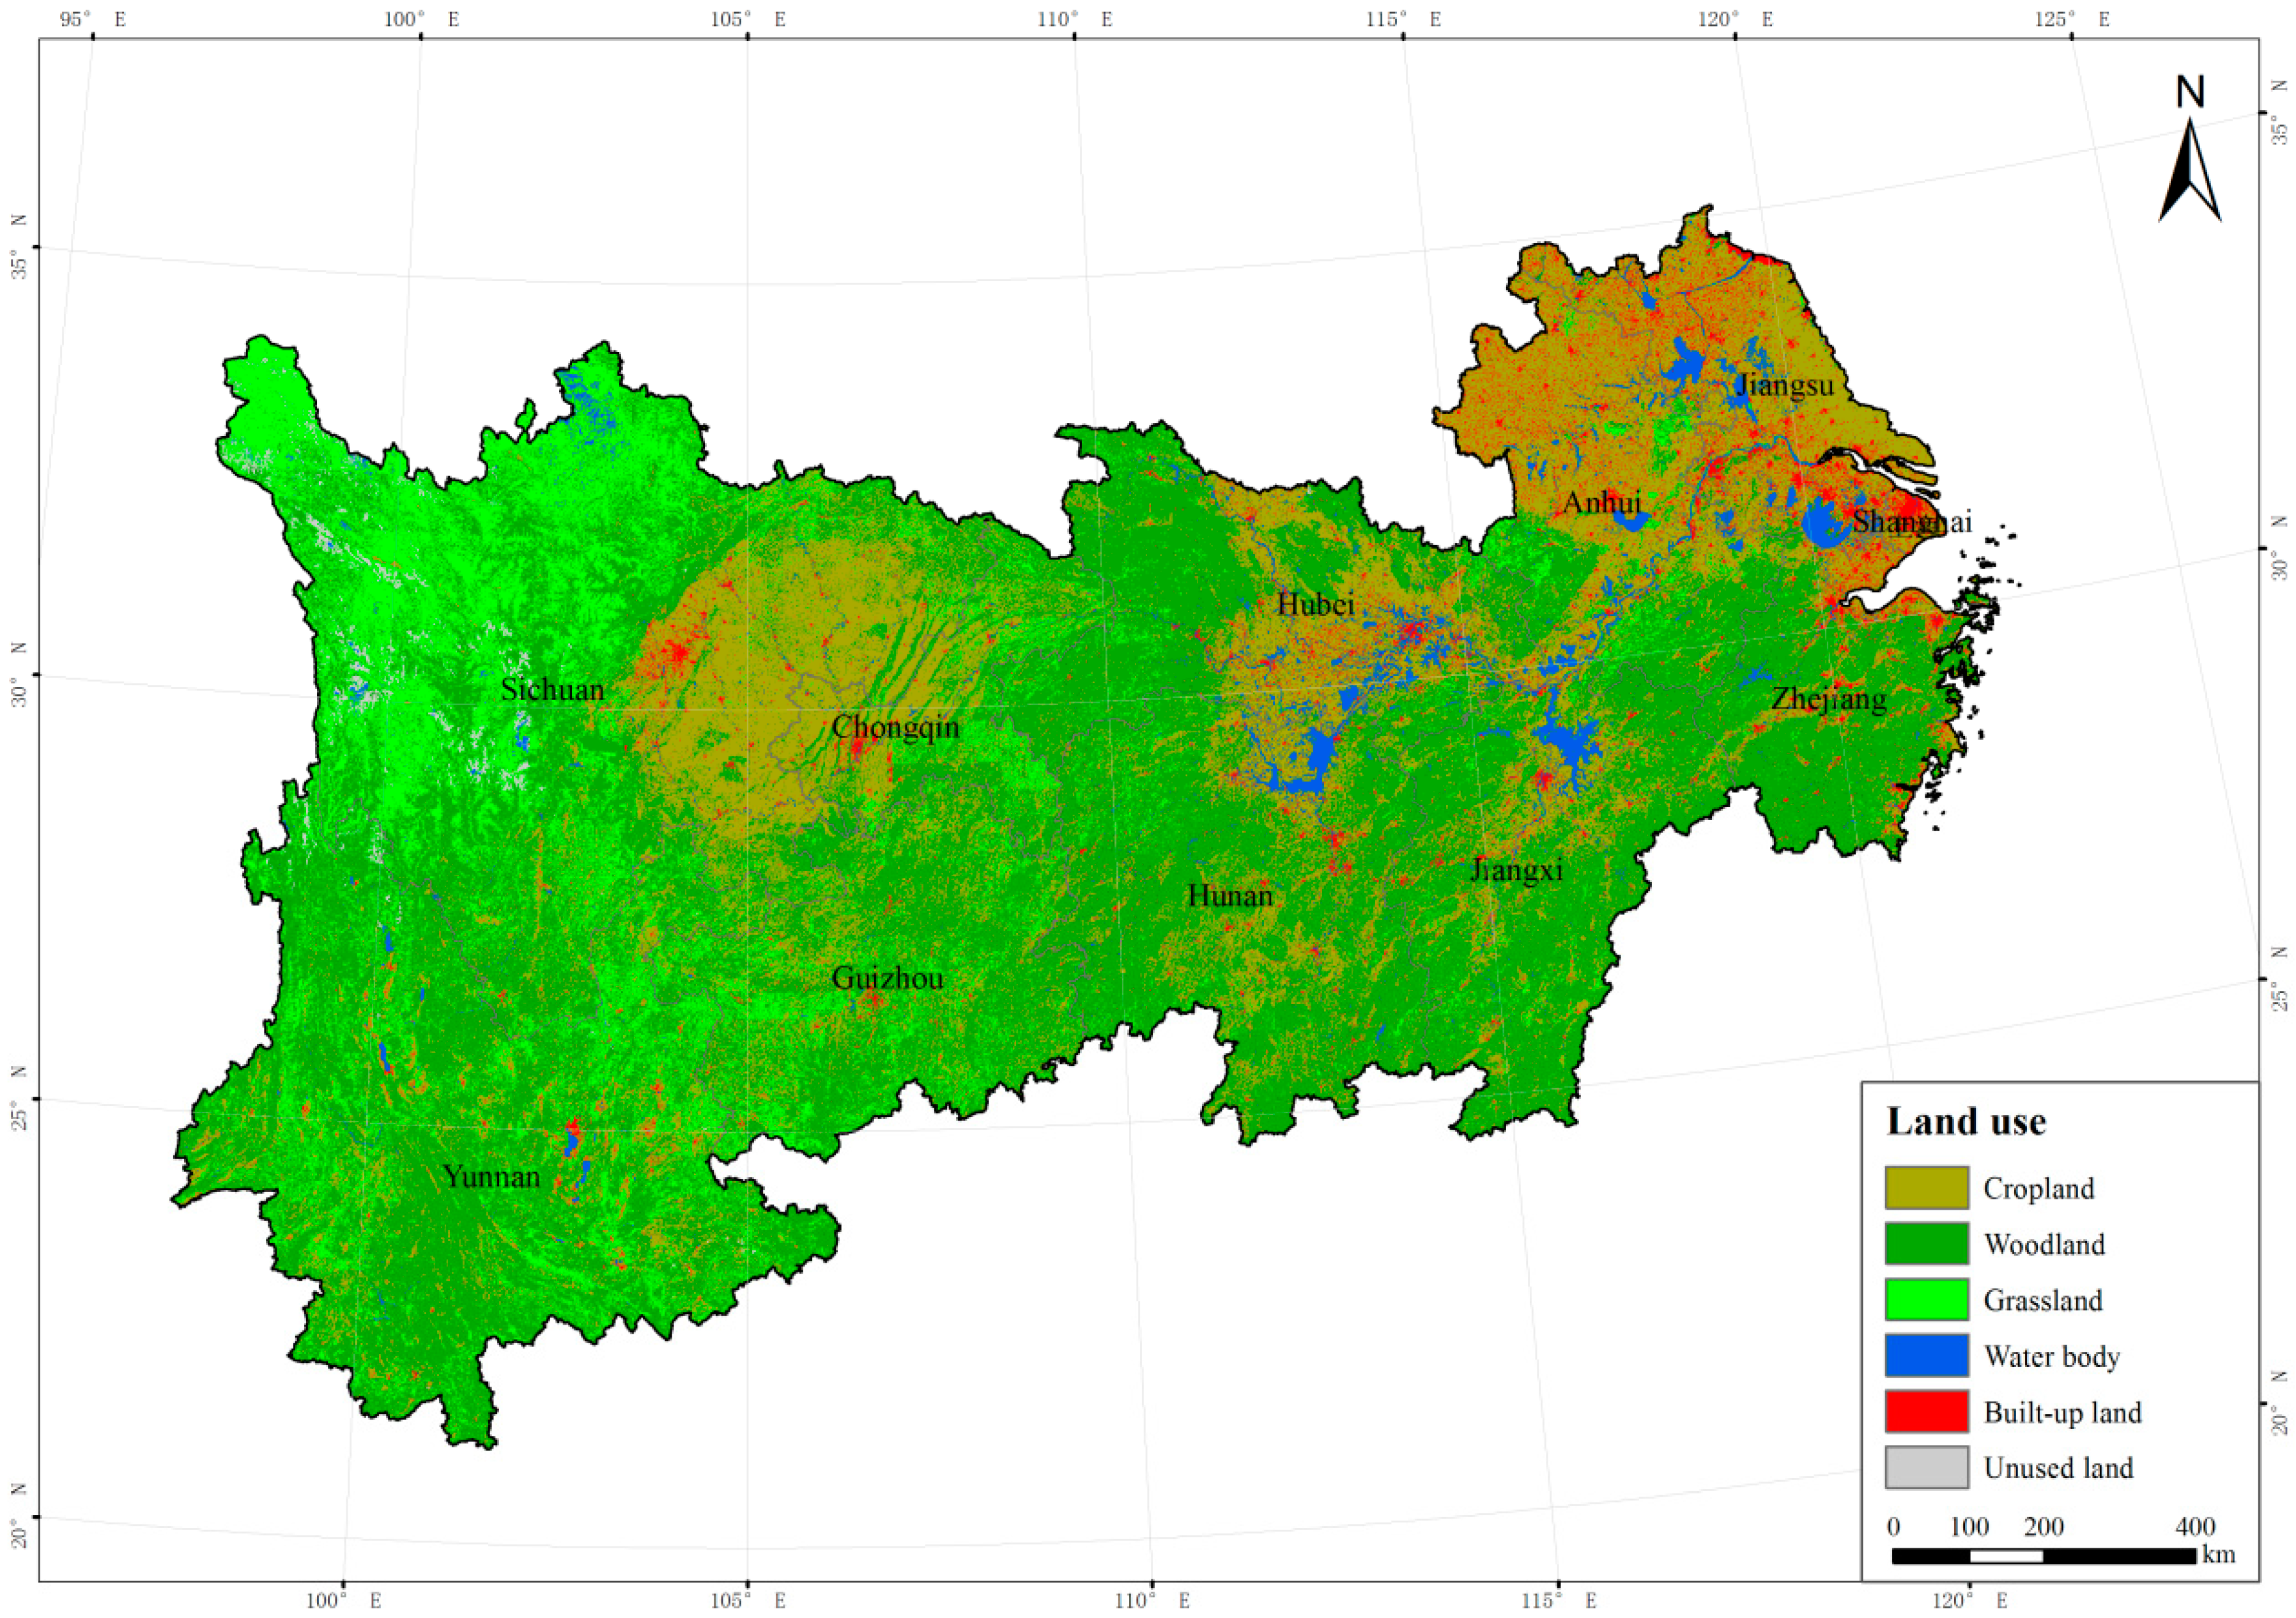
3.1.1. Land Use Analysis in 2015

In 2015, the area of land use types in descending order was woodland, cropland, grassland, built-up land, water body and unused land across the YREB. Woodland covered 93.67 × 10⁴ km2, which was mainly distributed in Zhejiang, Hunan, Jiangxi, Yunnan and Guizhou. Grassland covered 33.79 × 10⁴ km2, which was mainly distributed in northwestern Sichuan. The area of cropland was 61.77 × 10⁴ km2 (30.31%) and was mainly distributed in the Sichuan Basin and Jianghuai Plain. The area of water body was 6.24 × 10⁴ km2 (3.06%) and was mainly distributed in Jiangsu, Anhui and Hubei. The built-up land covered an area of 6.70 × 10⁴ km2, accounting for 3.29%, and was mainly distributed in the Yangtze River Delta urban agglomeration, the middle reaches of the Yangtze River and the Chengdu-Chongqing urban agglomeration. The unused land covered an area of 1.64 × 10⁴ km2, which was mainly distributed in parts of Sichuan (Figure 3).
The total area of built-up land in national MFOZs was 4.89 × 10⁴ km2 in 2015, accounting for 2.38% of the YREB’s land area. Of this, ODZs, KDZs, APZs and KEFZs accounted for 1.03 × 10⁴ km2, 1.32 × 10⁴ km2, 2.31 × 10⁴ km2 and 0.23 × 10⁴ km2, or 25.25%, 6.55%, 3.70% and 0.40%, respectively (Table 4). The proportion of built-up land sub-classes in different MFOZs was clearly different. The amount of urban land in ODZs reached 46.40%, which reflected the urban-centered development model in those regions. The proportion of urban land, rural residential land and other construction land in KDZs was 32.07%, 42.01% and 25.92%, respectively, which reflected the equal conditions for urban, rural and industrial development in KDZs. Rural residential areas accounted for 73.74% of APZs, which reflected the fact that the focus was on rural development in APZs. The proportion of rural residential land and other construction land in KEFZs was 41.12% and 41.68%, respectively, which reflected the equal conditions for rural and industrial development in KEFZs. Thus, the proportion of built-up land sub-classes clearly showed the different development stages of the MFOZs.

3.1.2. Land Use Changes between 2010 and 2015

According to the changing rate of land use types during 2010 and 2015 (Table 5), the development intensity of built-up areas was greater than that of other types. The change rate for KEFZs was the highest. For the three secondary types of built-up land (Figure 4), the change rate for rural residential land in the four types of functional areas was small. The lowest change rate for urban land was in the ODZs, which may show that the urbanization process was slowing down. The other construction land in the KDZs was expanding rapidly, which was consistent with the development policies of key areas in the MFOZs. The change rate for urban land in the KEFZs was higher than that in the ODZs and KDZs. Although the expansion area was small, the growth rate was relatively fast. The change rate for other construction land in the KEFZs was much higher than that for the other three functional zones, which did not conform to the functional orientation of restricted development for this region.

3.2. Analysis and Changes in the Soil Conservation Function

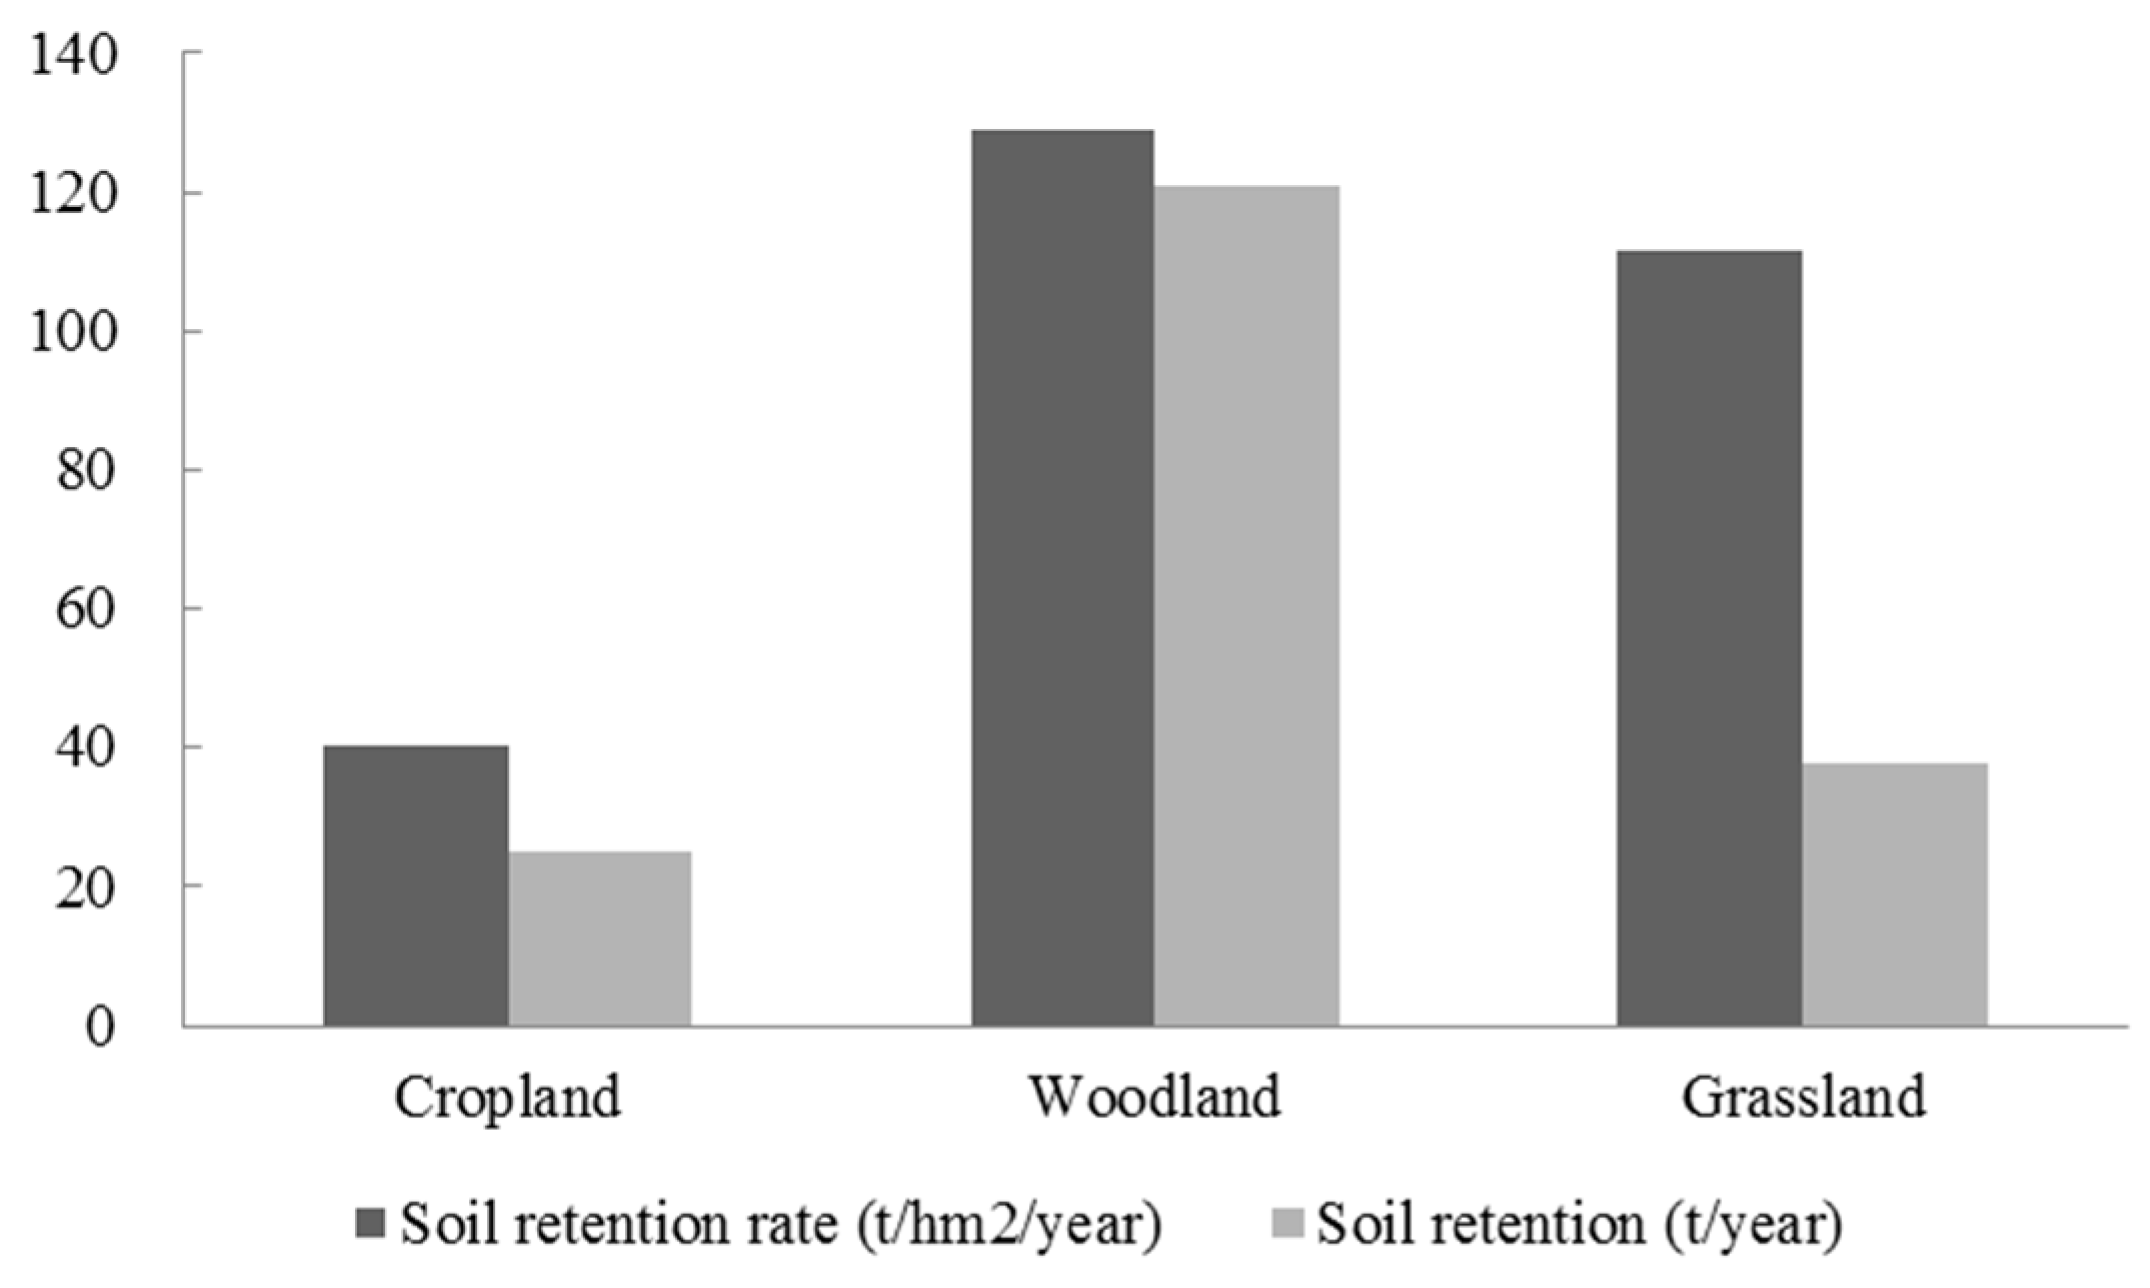
3.2.1. Analysis of the Soil Retention in the YREB

The average annual soil retention was 18.76 billion t/year, and the per unit soil retention was 91.54 t/hm2/year from 2010 to 2015. The performance of the soil conservation function in different land use types showed significant variation (Figure 5). Cropland had the lowest soil retention, with the average annual of 2.49 billion t/year and a capacity of 40.38 t/hm2/year per unit area. Grassland was second, with average annual soil retention of 3.76 billion t/year. Its soil conservation capacity was 2.76 times that of cropland. Woodland had a strong soil conservation capacity, with average annual soil retention of 12.08 billion t/year. The per unit soil retention was 3.20 and 1.16 times that of cropland and grassland, respectively.
From the perspective of spatial distribution, soil conservation capacity was weaker in the Jianghuai Plain, the Poyang Lake Plain, the Lianghu Plain and the Sichuan Basin, where cropland was concentrated. The soil conservation capacity was higher in grassland areas, such as the western Sichuan Plateau, and woodland areas, such as the Yunnan-Guizhou Plateau and the Jiangnan Hills (Figure 6).
The soil conservation function for the different MFOZs in the YREB performed differently between 2010 and 2015, which generally reflected the cascade characteristics of development in the main functional zones. The per unit soil retention of the national ODZs and KDZs was low, with 27.93 and 47.17 t/hm2/year, respectively. The per unit soil retention of the APZs was better, with 63.10 t/hm2/year. The per unit soil retention of the KEFZs was the highest, with 133.89 t/hm2/year. The average annual soil retention during the study period among ODZs, KDZs, APZs and KEFZs was 0.11, 0.95, 3.92 and 7.84 billion t/year, respectively.

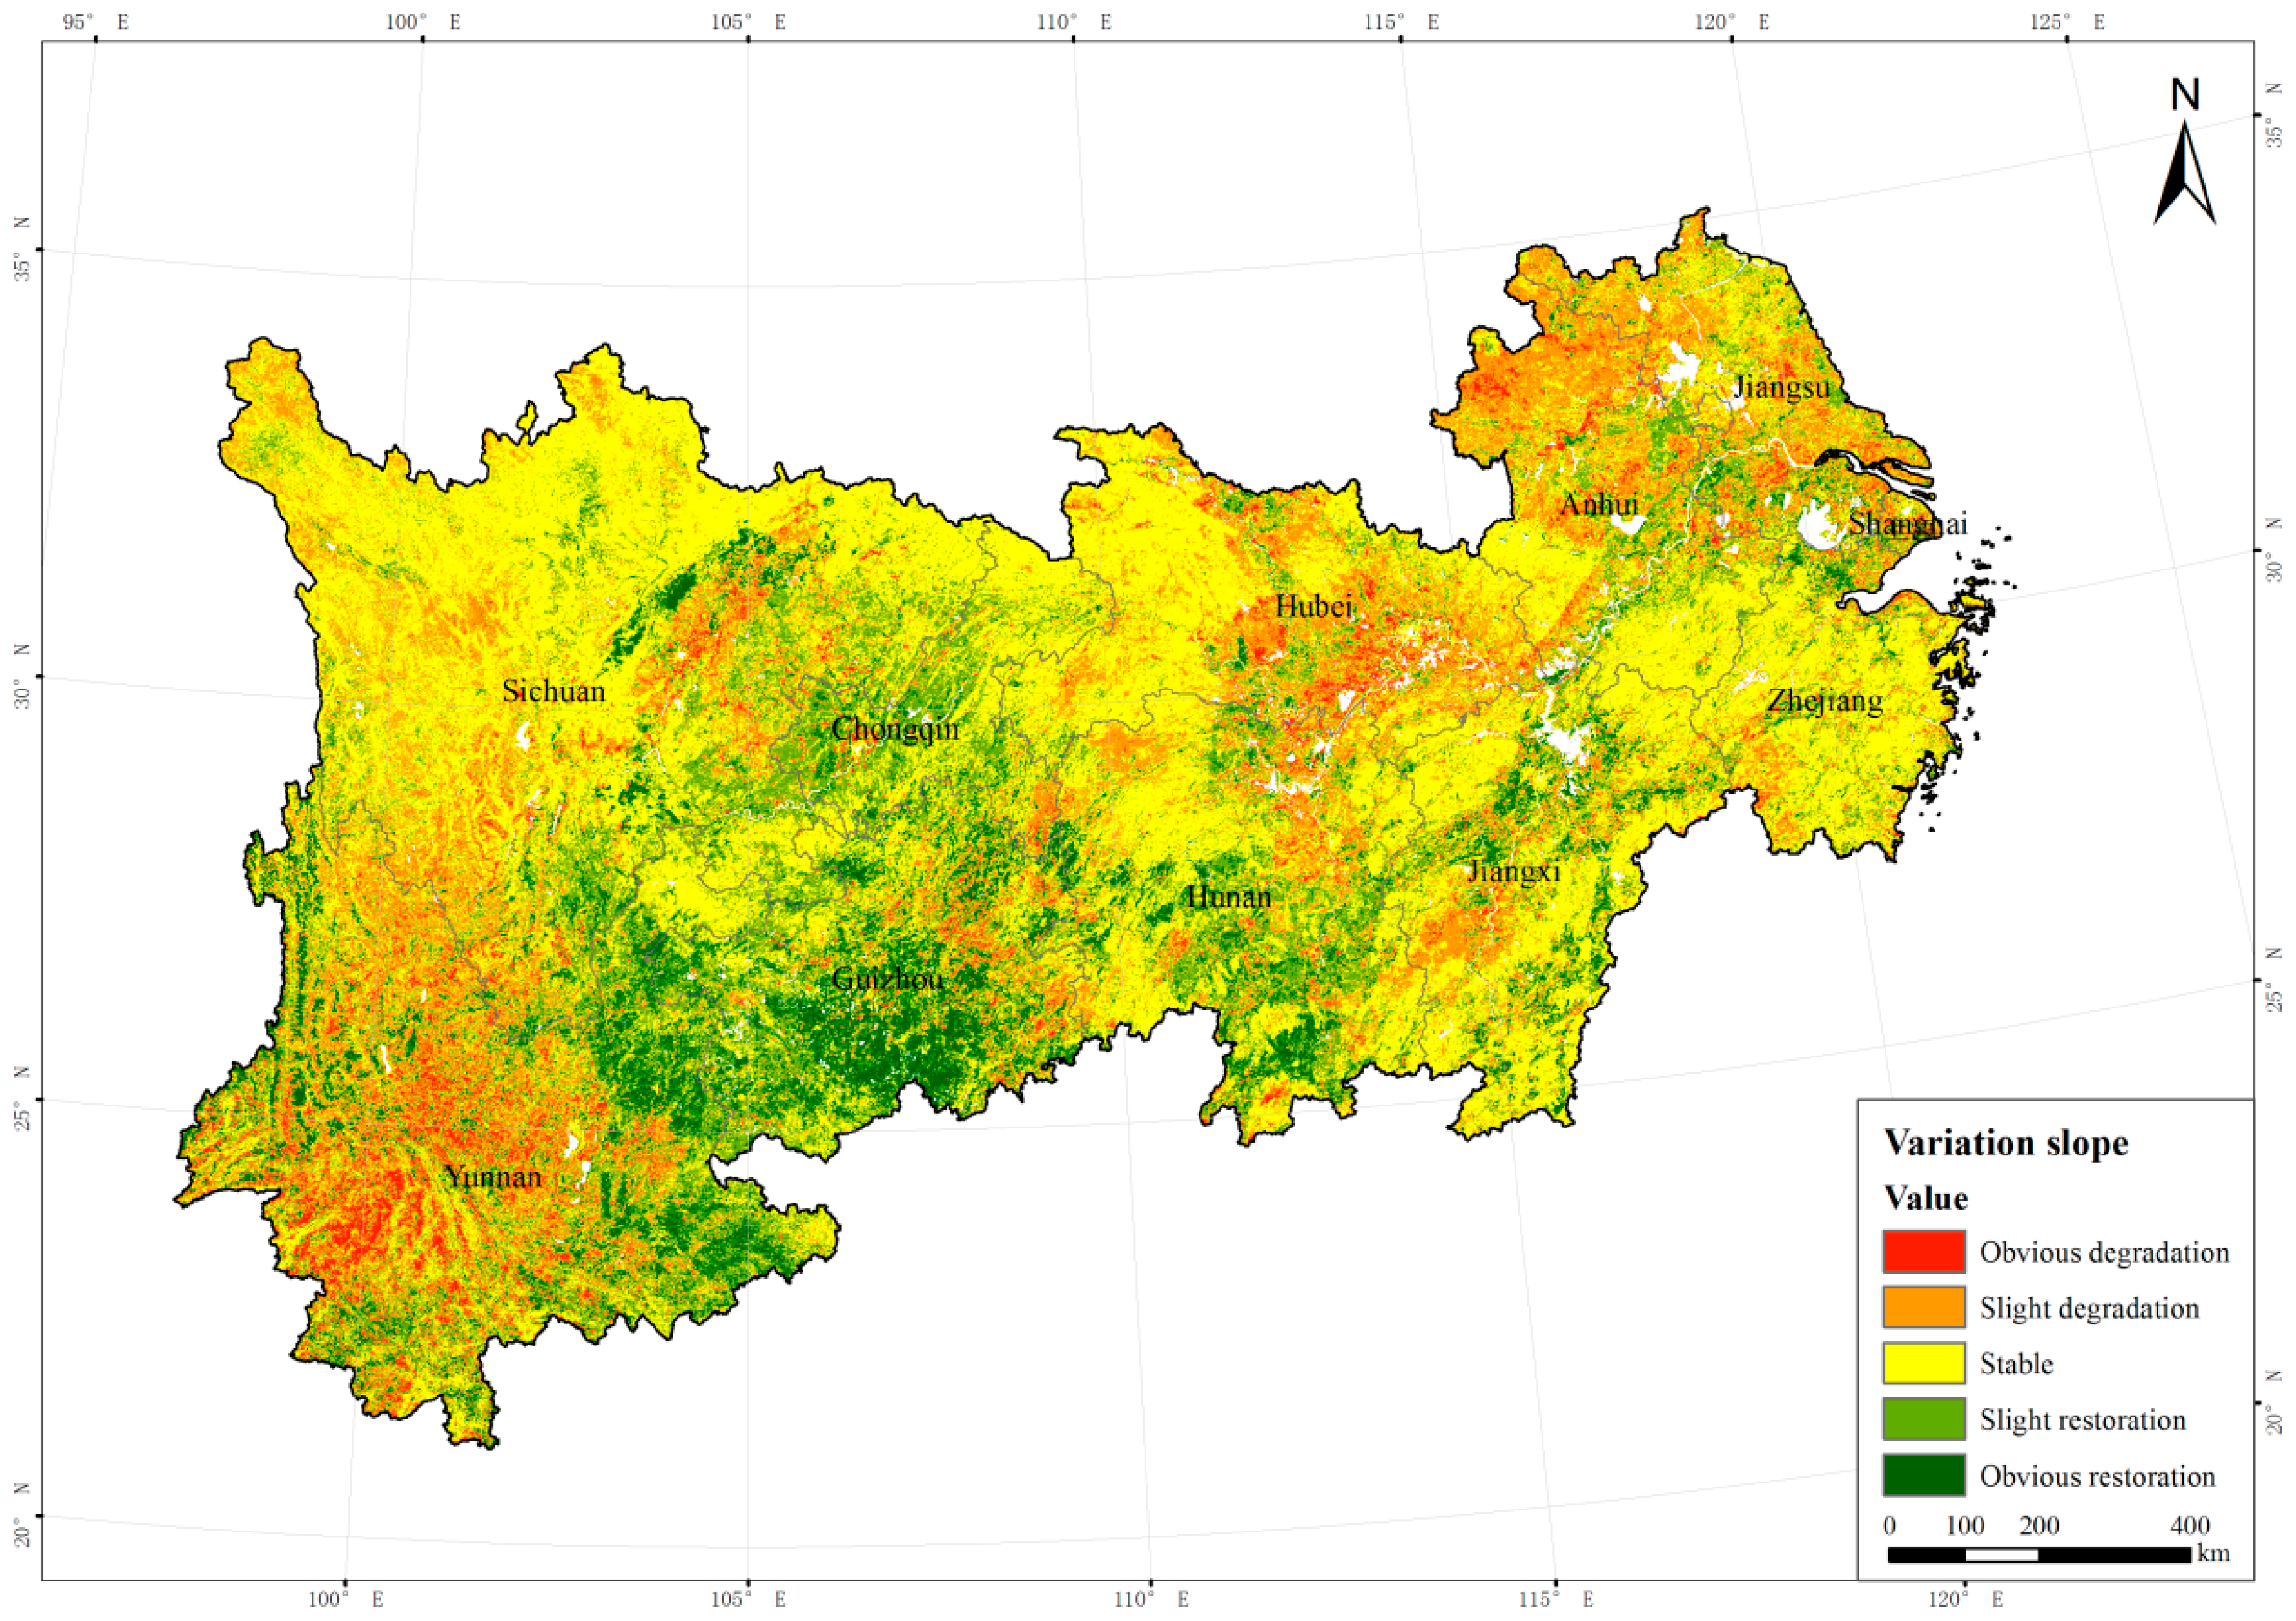
3.2.2. Spatial and Temporal Characteristics for the Soil Retention Rate

From 2010 to 2015, the average annual soil retention rate among woodland, grassland and cropland in the YREB decreased in turn: 88.82%, 80.50% and 74.21%, respectively. The variation slope for the soil retention rate between 2010 and 2015 among woodland, grassland and cropland was 0.33%/year, 0.52%/year and 0.34%/year, respectively. In the past five years, the soil retention rate in the YREB generally showed a stable or upward trend. The area where the soil retention rate remained stable accounted for 48.51% of the total area; 28.53% showed an increase; and 22.96% showed a decrease (Table 6). From the perspective of spatial distribution, the soil retention rate in Guizhou, Chongqing, eastern Yunnan, central and southern Hunan changed remarkably for the better, while the soil retention rate in central and western Yunnan, Jiangsu, Anhui, Shanghai and Hubei declined (Figure 7).
From the variation slope for the soil retention rate among different MFOZs in the YREB between 2010 and 2015, the KEFZs maintained the most stable area with the highest proportion (63.24%); the decreasing area ratio was also the smallest at 18.09%. The remained stable area ratio for the soil retention rate across the other three zones was all lower than the regional average. The degradation area ratio for the soil retention rate among the ODZs, KDZs and APZs was 26.75%, 25.42%, and 28.52%, respectively (Figure 8).

4. Discussion

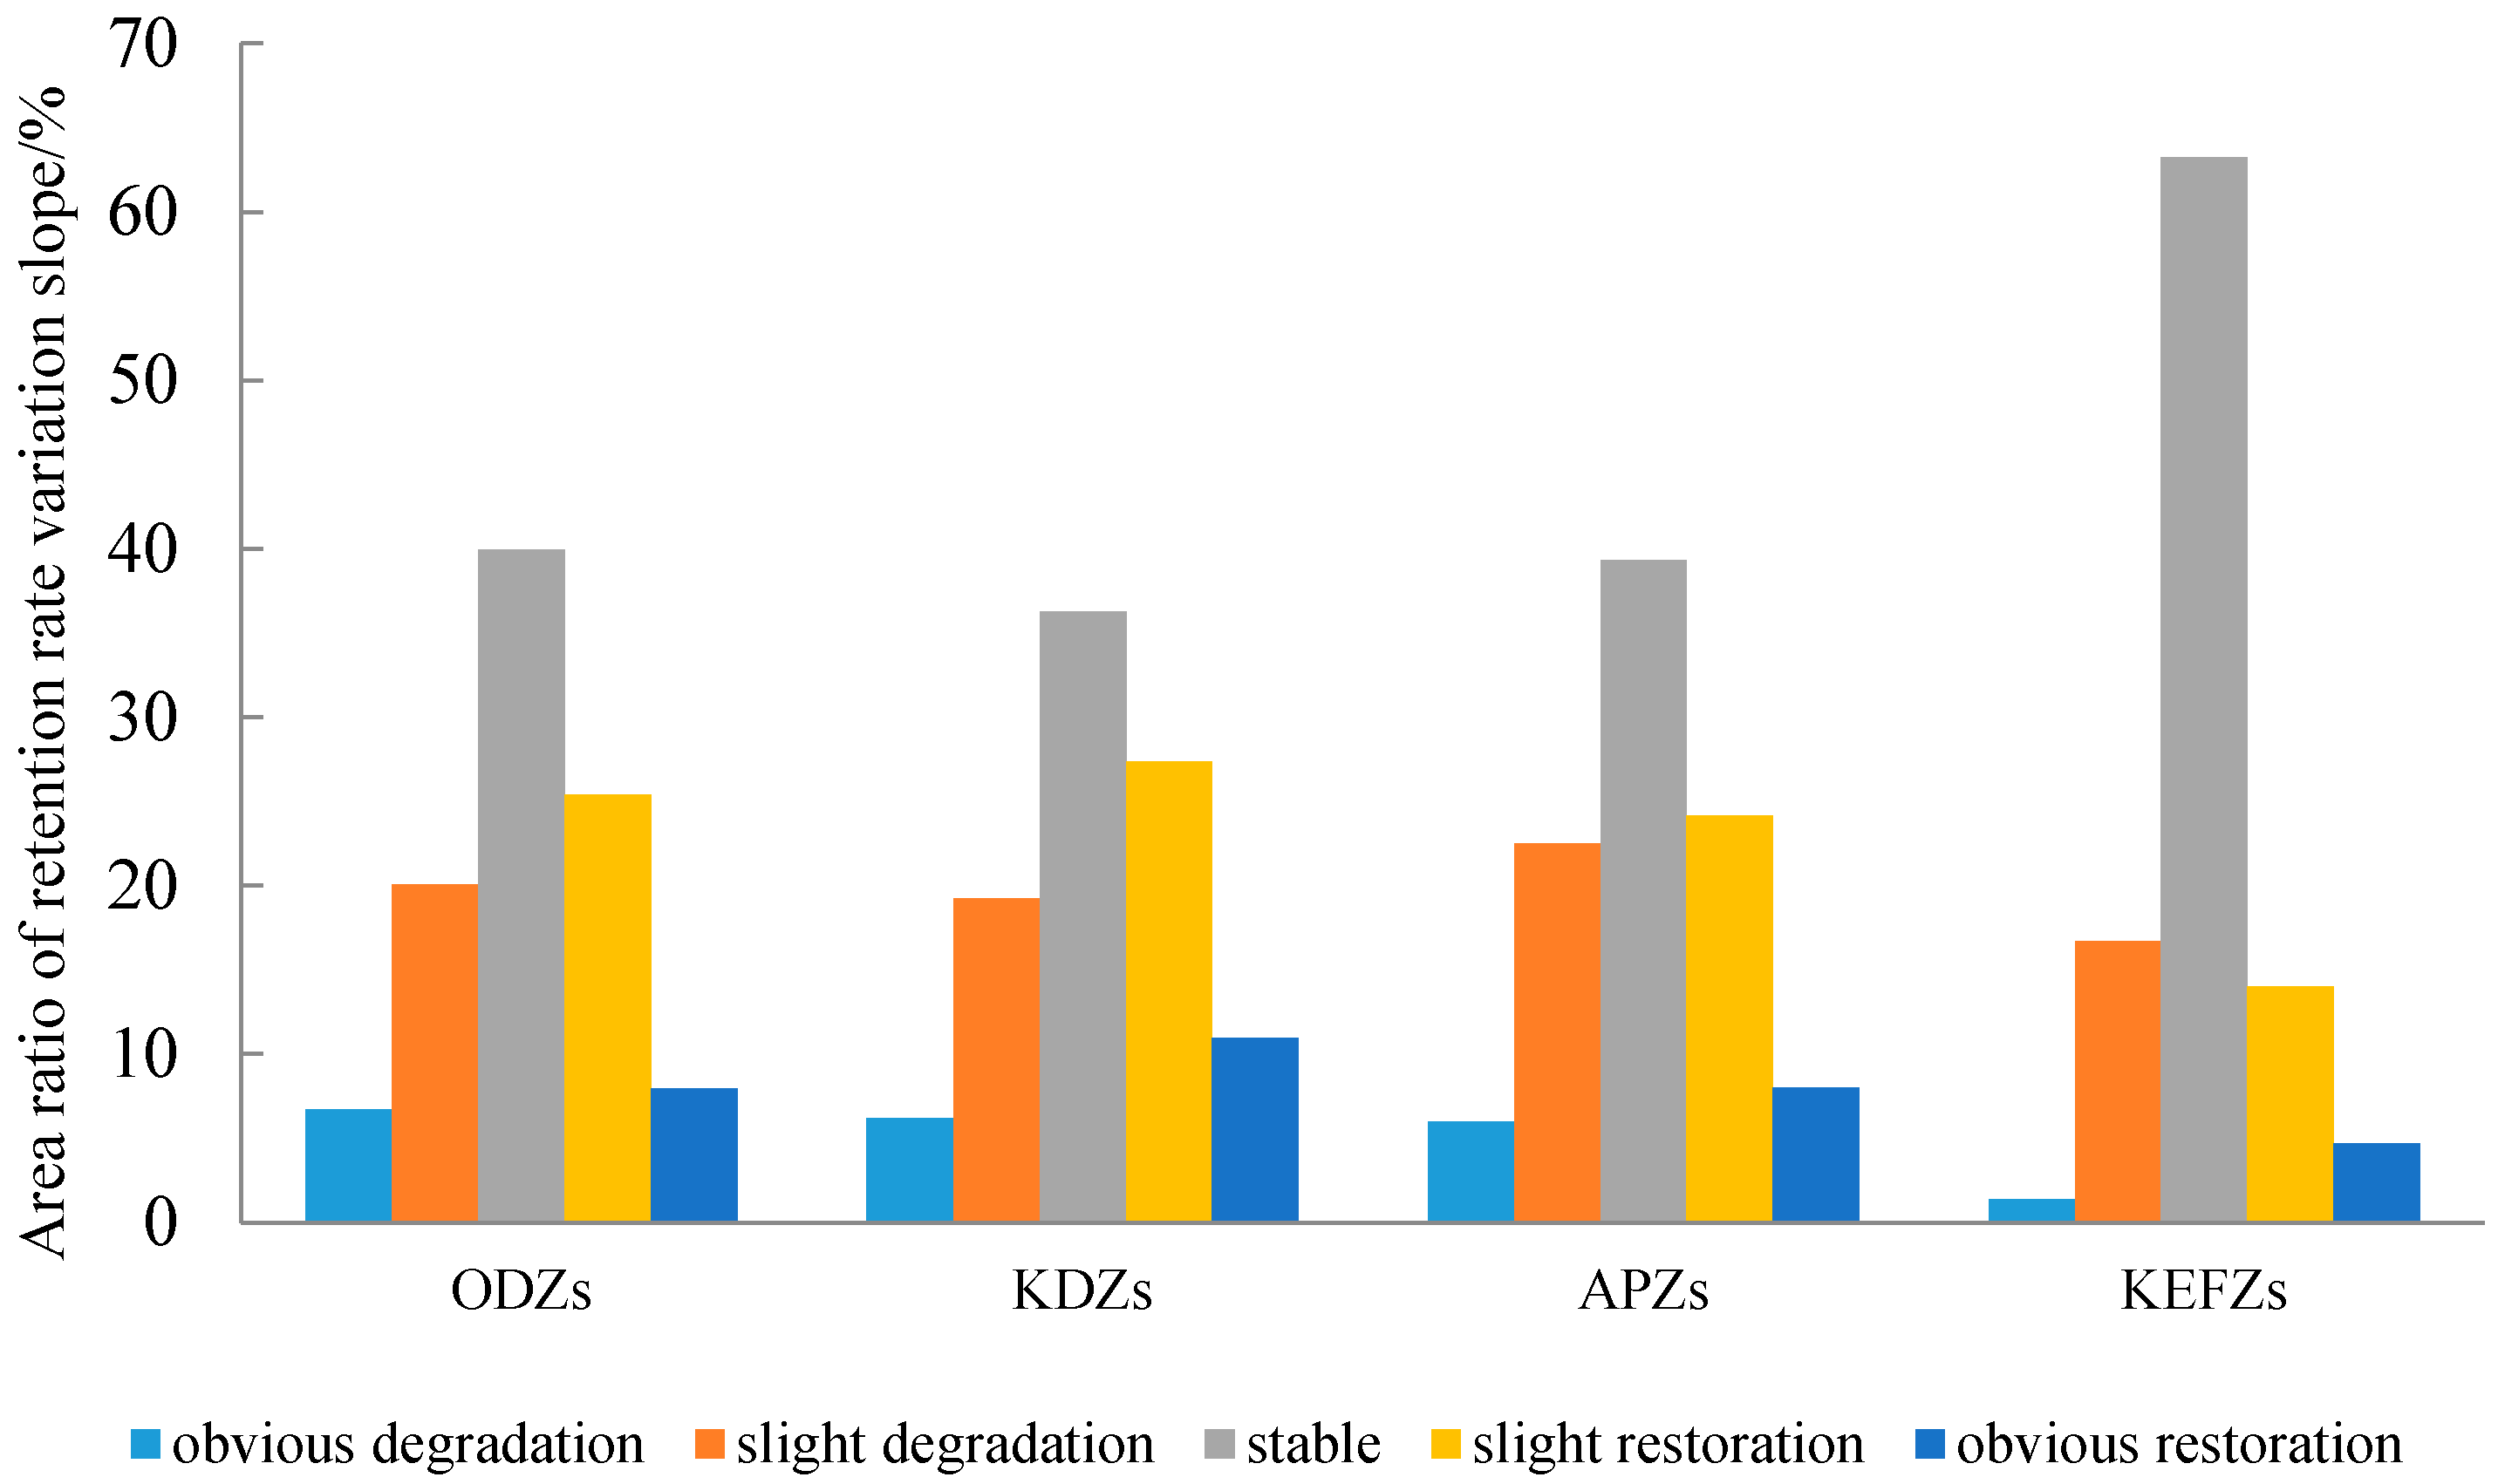
4.1. Matching or Not towards Functional Orientation of the MFOZs

The proportion of built-up land in the four MFOZs (ODZs, KDZs, APZs and KEFZs) in the YREB reflects the gradient of territorial development based on their functions. The lowest change rate was in the urban land in the ODZs during 2010 and 2015, indicating that their urbanization process was slowing down. The other construction land in the KDZs was expanding rapidly, which was consistent with the development policies of key areas in MFOZs. The change rate for built-up land in KEFZs was higher than that in ODZs and KDZs. Although the expansion area was relatively small, the growth rate was relatively fast. Additionally, the change rate of other construction land in KEFZs was the highest found, which does not match their functional orientation of “limited exploitation” [6,7]. The KEFZs generally had low resource and environmental carrying capacity, fragile ecosystems and important ecological functions. They did not have the conditions for large-scale, high-intensity industrialization and urbanization. It is necessary for KEFZs to enhance control over their space to improve the supply of ecological products, and to build a regional spatial pattern that coordinates ecological security with economic and social development.

4.2. Strengths, Weaknesses and Future Research of This Analysis

The quality of this study was the use of spatial planning in new considerations. The soil retention rate eliminated the impact of inter-annual precipitation fluctuations on the simulation results. As a result, the results only showed the changes due to ecosystem transformation [48]. The soil conservation function of the YREB showed an overall improvement from 2010 to 2015. The effects of the MFOZs were apparent. At the same time, implementation of soil conservation measures such as returning farmland to forests and grassland, closing hillsides and afforestation promoted the growth and restoration of regional vegetation, and improved the soil conservation function of ecosystems. Localization parameters could improve the simulation accuracy of soil conservation function. The corresponding estimates of soil erosion rates for river basins between simulations and observations could be used to validate its performance [20].
This study focused on the quantitative characteristics of land use changes in the YREB. There has been little research on the changes in spatial patterns and their effect on ecological services. Subsequent research would focus on analysis of changes in spatial patterns, the driving factors that cause these changes and the ecological effects, to better assess the intensity of land space development and ecological status in different regions. For areas with continuing soil erosion problems and serious degradation of ecological functions, it is necessary to further strengthen ecological protection and restoration and coordinate the management of mountains, water, forests, cropland, lakes and grassland, to effectively improve the ecological security of the YREB. In addition, we would focus on other ecosystem service changes (carbon sequestration, water regulation and biodiversity protection) before and after the implementation of the MFOZs. Tradeoff and synergies between ecosystem services would also be considered for spatial planning in the future.

5. Conclusions

This study analyzed the spatial-temporal pattern of development and changing characteristics of the soil conservation function based on the MFOZs from 2010 to 2015 across the YREB, China, with the combination of model simulation and GIS spatial analysis. The main conclusions are as follows. (1) The area ratio of built-up land in the ODZs, KDZs, APZs and KEFZs was 25.25%, 6.55%, 3.70% and 0.40%, respectively, which showed the gradient of territorial development based on their functions. However, the change rate of other construction land in KEFZs did not match their functional orientation of “limited exploitation”. (2) The soil conservation function of the YREB showed an overall improvement from 2010 to 2015. It weakened in descending order of KEFZs, APZs, KDZs and ODZs, which generally reflected the cascade characteristics of development in the main functional zones.
Overall, the implementation of the major function-oriented zoning strategy has played a positive role in improving the ecological security capability of the YREB. As land reclamation can impair soil conservation function and exacerbate soil erosion subsequently, long-term management to encourage sustainable development is necessary to maintain and consolidate the positive effects of the MFOZs.

Author Contributions

All authors significantly contributed to this study. W.C. and X.Z. proposed the idea. D.W. wrote the manuscript. D.W. and W.C. designed the experiments. L.L. processed the data.

Funding

This research was funded by National Key R&D Program of China (Grant No. 2017YFC0506605) and basic research funding for the central level scientific research institutes, Nanjing Institute of Environmental Sciences, Ministry of Environmental Protection, China (Grant No. GYZX170306).

Acknowledgments

The authors were grateful to the editor and anonymous reviewers of this paper. We thanked Dapeng Liu and Haibo Huang for supplying GIS data.

Conflicts of Interest

The authors declare no conflicts of interest.

References

  1. Mao, J.; Yan, X.; Wang, A.; Li, X.; Qian, Z. A review and prospect of studies on the intensified urban land use in China since 1990s. Geogr. Geo-Inf. Sci. 2005, 21, 48–52. [Google Scholar]
  2. Deng, X.; Huang, J.; Rozelle, S.; Uchida, E. Growth, population and industrialization, and urban land expansion of China. J. Urban Econ. 2008, 63, 96–115. [Google Scholar] [CrossRef]
  3. Liu, J.; Kuang, W.; Zhang, Z.; Xu, X.; Qin, Y.; Ning, J.; Zhou, W.; Zhang, S.; Li, R. Spatiotemporal characteristics, patterns and causes of land use changes in China since the late 1980s. J. Geogr. Sci. 2014, 69, 3–14. [Google Scholar] [CrossRef]
  4. Bo, W.; An, H.; Li, J. Construction of Major Functional Zones and Chinese regional coordinated development, promotive or aggressive. China Pop Res. Environ. 2011, 21, 121–128. [Google Scholar]
  5. Fan, J. Draft of major function oriented zoning of China. J. Geogr. Sci. 2015, 70, 186–201. [Google Scholar]
  6. Fan, J.; Sun, W.; Zhou, K.; Chen, D. Major Function Oriented Zone: New method of spatial regulation for reshaping regional development pattern in China. J. Geogr. Sci. 2012, 22, 196–209. [Google Scholar] [CrossRef]
  7. Fan, J. The strategy of Major Function Oriented Zoning and the optimization of territorial development patterns. Bull. CAS 2013, 28, 193–206. [Google Scholar]
  8. Wan, X.; Yu, R.; Yu, X.; Luo, J. Research of monitoring and assessment of major function oriented zoning plan implementing based on the geological condition survey. Res. Environ. Yangtze Basin 2015, 24, 358–363. [Google Scholar]
  9. Wu, Q.; Zhao, H. Basic laws of soil and water conservation by vegetation and its summation. J. Soil Water Conserv. 2001, 15, 13–15. [Google Scholar]
  10. Zhao, H.; Wu, Q.; Liu, G. Studies on soil and water conservation functions of litter in Chinese Pine Stand on Loess Plateau. For. Sci. 2003, 39, 168–172. [Google Scholar]
  11. Daily, G.C.; Polasky, S.; Goldstein, J.; Kareiva, P.M.; Mooney, H.A.; Pejchar, L.; Ricketts, T.H.; Salzman, J.; Shallenberger, R. Ecosystem services in decision making: Time to deliver. Front. Ecol. Environ. 2009, 7, 21–28. [Google Scholar] [CrossRef]
  12. Zheng, H.; Li, Y.; Ouyang, Z.; Luo, Y. Progress and perspectives of ecosystem services management. J. Ecol. Sci. 2013, 33, 702–710. [Google Scholar]
  13. Keesstra, S.; Nunes, J.P.; Novara, A.; Finger, D.; Avelar, D.; Kalantari, Z.; Cerdà, A. The superior effect of nature based solutions in land management for enhancing ecosystem services. Sci. Total Environ. 2018, 610, 997–1009. [Google Scholar] [CrossRef] [PubMed] [Green Version]
  14. Sun, W.; Shao, Q.; Liu, J. Assessment of soil conservation function of the ecosystem services on the Loess Plateau. J. Nat. Res. 2014, 29, 365–376. [Google Scholar]
  15. Liu, J.; Jin, T.; Liu, G.; Li, Z.; Y, J. Changes in land use and soil and water conservation of the upper and middle reaches of Heihe river basin during 2000–2010. J. Ecol. Sci. 2014, 34, 7013–7025. [Google Scholar]
  16. Wischmeier, W.H.; Smith, D.D. Predicting Rainfall Erosion Losses A Guide to Conservation Planning; U.S. Government Printing Office: Washington, DC, USA, 1978; Volume 537.
  17. Harden, C.P. Soil erosion and sustainable mountain development. Mt. Res. Dev. 2001, 34, 77–83. [Google Scholar] [CrossRef]
  18. Zhao, T.Q.; Yang, B.S.; Zheng, H. Assessment of the erosion control function of forest ecosystems based on GIS: A case study in Zhangjiajie National Forest Park, China. Int. J. Sustain. Dev. World Ecol. 2009, 16, 356–361. [Google Scholar] [CrossRef]
  19. Yang, D.; Kanae, S.; Oki, T.; Koike, T.; Musiake, K. Global potential soil erosion with reference to land use and climate changes. Hydrol. Process. 2010, 17, 2913–2928. [Google Scholar] [CrossRef]
  20. Rao, E.M.; Ouyang, Z.Y.; Yu, X.X.; Xiao, Y. Spatial patterns and impacts of soil conservation service in China. Geomorphology 2014, 207, 64–70. [Google Scholar] [CrossRef]
  21. Fu, B.J.; Wang, Y.F.; Lü, Y.H.; He, C.S.; Chen, L.D.; Song, C.J. The effects of land-use combinations on soil erosion: A case study in the Loess Plateau of China. Prog. Phys. Geogr. 2009, 33, 793–804. [Google Scholar] [CrossRef]
  22. Fu, B.J.; Wang, S.; Su, C.H.; Forsius, M. Linking ecosystem processes and ecosystem services. Curr. Opin. Environ. Sustain. 2013, 5, 4–10. [Google Scholar] [CrossRef]
  23. Xie, S.H.; Zeng, J.L.; Yang, J.; Yuan, F. Effects of different tillage measures on soil and water conservation in slope farmland of red soil in Southern China. Trans. Agric. Eng. 2010, 26, 81–86. [Google Scholar]
  24. Xu, X.H.; Sui, Y.Y.; Zhang, Y.; Wang, Y.F.; Liu, M.Y.; Liu, Y.J. Effects of different tillages on the soil and water conservation benefits in Northeast black soil area of China. Soil Water Conserv. 2013, 11, 12–16. [Google Scholar]
  25. Sultan, D.; Tsunekawa, A.; Haregeweyn, N.; Adgo, E.; Tsubo, M.; Meshesha, D.T. Impact of soil and water conservation interventions on watershed runoff response in a tropical humid highland of Ethiopia. Environ. Manag. 2018, 61, 1–15. [Google Scholar] [CrossRef] [PubMed]
  26. Lü, Y.H.; Fu, B.J.; Feng, X.M.; Zeng, Y.; Liu, Y.; Chang, R.Y.; Sun, G.; Wu, B.F. A policy-driven large scale ecological restoration: Quantifying ecosystem services changes in the Loess Plateau of China. PLoS ONE. 2012, 7, e31782. [Google Scholar] [CrossRef] [PubMed]
  27. Dodds, W.K.; Perkin, J.S.; Gerken, J.E. Human impact on freshwater ecosystem services: A global perspective. Environ. Sci. Technol. 2013, 47, 9061–9068. [Google Scholar] [CrossRef] [PubMed]
  28. Zhang, S.; Fan, W.; Li, Y.; Yi, Y. The influence of changes in land use and landscape patterns on soil erosion in a watershed. Sci. Total Environ. 2017, 574, 34–45. [Google Scholar] [CrossRef] [PubMed]
  29. Tang, C.; Sun, W. Comprehensive evaluation of land spatial development suitability of the Yangtze River Basin. J. Geogr. Sci. 2012, 67, 1587–1598. [Google Scholar]
  30. Cen, X.; Zhou, Y.; Shan, W.; Teng, Y.; Li, F. The resources and environment pattern and sustainable development of Yangtze River Economic Zone. China Dev. 2015, 15, 1–9. [Google Scholar]
  31. Yang, G.; Xu, X.; Li, P. Research on the construction of green ecological corridors in the Yangtze River Economic Belt. Prog. Geogr. 2015, 34, 1356–1367. [Google Scholar]
  32. Tang, Q.; He, C.S.; He, X.B.; Bao, Y.H.; Zhong, R.H.; Wen, A.B. Farmers’ Sustainable Strategies for Soil Conservation on, Sloping Arable Lands in the Upper Yangtze River Basin, China. Sustainability 2014, 6, 4795–4806. [Google Scholar] [CrossRef]
  33. Liu, Y.M.; Chen, Y.M.; Hu, Y.C. Spatial-temporal distribution characteristics of soil conservation ability in Yangtze Basin. Res. Environ. Yangtze Basin 2015, 24, 971–977. [Google Scholar]
  34. Kong, L.Q.; Zheng, H.; Rao, E.M.; Xiao, Y.; Ouyang, Z.Y.; Li, C. Evaluating indirect and direct effects of eco-restoration policy on soil conservation service in Yangtze River Basin. Sci. Total Environ. 2018, 631, 887–894. [Google Scholar] [CrossRef] [PubMed]
  35. Jiang, C.; Zhang, L. Ecosystem change assessment in the Three-river Headwater Region, China: Patterns, causes, and implications. Ecol. Eng. 2016, 93, 24–36. [Google Scholar] [CrossRef]
  36. Renard, K.G.; Foser, G.R.; Weesies, G.A.; Mccool, D.K.; Yoder, D.C. Predicting Soil Erosion by Water: A Guide to Conservation Planning with the Revised Universal Soil Loss Equation (RUSLE); United States Department of Agriculture: Washington, DC, USA, 1997; Volume 703.
  37. Zhang, W.; Xie, Y.; Liu, B. Rainfall Erosivity Estimation using daily rainfall amounts. Geogr. Sci. 2002, 22, 705–711. [Google Scholar]
  38. Fan, J.; He, H.; Guo, B. Temporal and spatial variations of rainfall erosivity in Yellow River from 1980 to 2015. J. Geo-Inf. Sci. 2018, 20, 196–204. [Google Scholar]
  39. Xie, Y.; Liu, B.; Zhang, W. Study on standard of erosive rainfall. J. Soil Water Conserv. 2000, 14, 6–11. [Google Scholar]
  40. Wischmeier, W.H.; Johnson, C.B.; Cross, B.V. Soil erodibility nomograph for farmland and construction sites. J. Soil Water Conserv. 1971, 26, 189–193. [Google Scholar]
  41. Williams, J.R.; Jones, C.A.; Dyke, P.T. A modeling approach to DetemliDiDg d1e relationship between erosion and soil productivity. Trans. ASABE 1984, 27, 129–144. [Google Scholar] [CrossRef]
  42. Lu, D.; Li, G.; Valladares, G.S.; Batistella, M. Mapping soil erosion risk in Rondônia, Brazilian Amazonia: Using RUSLE, remote sensing and GIS. Land Degrad. Dev. 2004, 15, 499–512. [Google Scholar] [CrossRef] [Green Version]
  43. Mccool, D.K.; Foster, G.R.; Mutchler, C.K.; Mutchler, C.K.; Meyer, L.D. Revised slope length factor for the universal soil loss equation. Trans. ASABE 1989, 30, 1387–1396. [Google Scholar] [CrossRef]
  44. Liu, B.; Nearing, M.; Shi, P.; Jia, Z. Slope length effects on soil loss for steep slopes. Soil Sci. Soc. Am. J. 1994, 64, 1759–1763. [Google Scholar] [CrossRef]
  45. Wang, H.; Liu, G. Analyses on vegetation structures and their controlling soil erosion. J. Arid Land Environ. 1999, 13, 62–68. [Google Scholar]
  46. Cai, C. Study of applying USLE and Geographical Information System IDRISI to predict soil erosion in small watershed. J. Soil Water Conserv. 2000, 14, 19–24. [Google Scholar]
  47. Li, Z.; Zhang, Y.; Zhu, Q.; Yao, W. Assessment of bank gully development and vegetation coverage on the Chinese Loess Plateau. Geomorphology 2015, 228, 462–469. [Google Scholar] [CrossRef]
  48. DB 63/T. Technical specification of effect assessment on ecological protection and construction in the Three-River Headwaters Region. 2014. Available online: http://www.wanfangdata.com.cn/details/detail.do?_type=techResult&id=1600440487 (accessed on 15 March 2015).
  49. Liu, J.H.; Gao, J.X.; Wang, W.J. Variations of vegetation coverage and its relations to global climate changes on the Tibetan Plateau during 1981–2005. J. Mt. Sci. Engl. 2013, 27, 113–120. [Google Scholar]
  50. Liu, J.; Liu, M.; Tian, H.; Zhuang, D.; Zhang, Z.; Zhang, W.; Tang, X.M.; Deng, X.Z. Spatial and temporal patterns of China’s cropland during 1990–2000: An analysis based on Landsat TM data. Remote Sens. Environ. 2005, 98, 442–456. [Google Scholar] [CrossRef]
Figure 1. Location of the Yangtze River Economic Belt, China.
Sustainability 10 03425 g001
Figure 2. Division of Major Function-Oriented Zones in the Yangtze River Economic Belt, China.
Sustainability 10 03425 g002
Figure 3. Land use distribution in the Yangtze River Economic Belt in 2015.
Sustainability 10 03425 g003
Figure 4. Change rate of secondary types of built-up land.
Sustainability 10 03425 g004
Figure 5. Statistics of the values of soil conservation function for different land use types.
Sustainability 10 03425 g005
Figure 6. The distribution of soil conservation capacity between 2010 and 2015 in the Yangtze River Economic Belt.
Sustainability 10 03425 g006
Figure 7. Variation slope for the soil retention rate between 2010 and 2015 across the Yangtze River Economic Belt.
Sustainability 10 03425 g007
Figure 8. Area ratio for the soil retention rate variation slope within the Major Function-Oriented zones.
Sustainability 10 03425 g008
Table 1. The tillage measures for the erosion control practice factor (P) value based on land uses.
Land UseWoodlandGrasslandCroplandOthers
FlatHillsMountainousSteep Slope (>25°)
p value110.200.350.650.801
Table 2. Classification system of land use types.
First-Level ClassesSecond-Level Classes
WoodlandForest, Shrub, Woods, Others
GrasslandDense grass, Moderate grass, Sparse grass
CroplandPaddy land, Dry land
Water bodyStream and rivers, Reservoir and ponds, Lakes, Permanent ice and snow, Bottomland, Beach and shore
Built-up landUrban land, Rural residential land, Other construction land
Unused landSandy land, Gobi, Salina, Swampland, Bare soil, Bare rock, Others
Table 3. Types of Major Function-Oriented Zones.
TypesMajor FunctionDescription
Optimal development zonesMassive urbanization and industrializationAreas with high development density and population density
Key development zonesAreas with great development potential for industrialization and urbanization
Restricted development zones Agricultural production zones Providing of agricultural productsMainly including the national major grain producing counties
Key ecological function zones Providing of ecological products and services Protecting crucial ecosystem functions and fragile ecological systems
Prohibited development zones Protection of natural and cultural heritageProtected areas, such as national nature reserves, national forest parks, national scenic spots and national geological parks
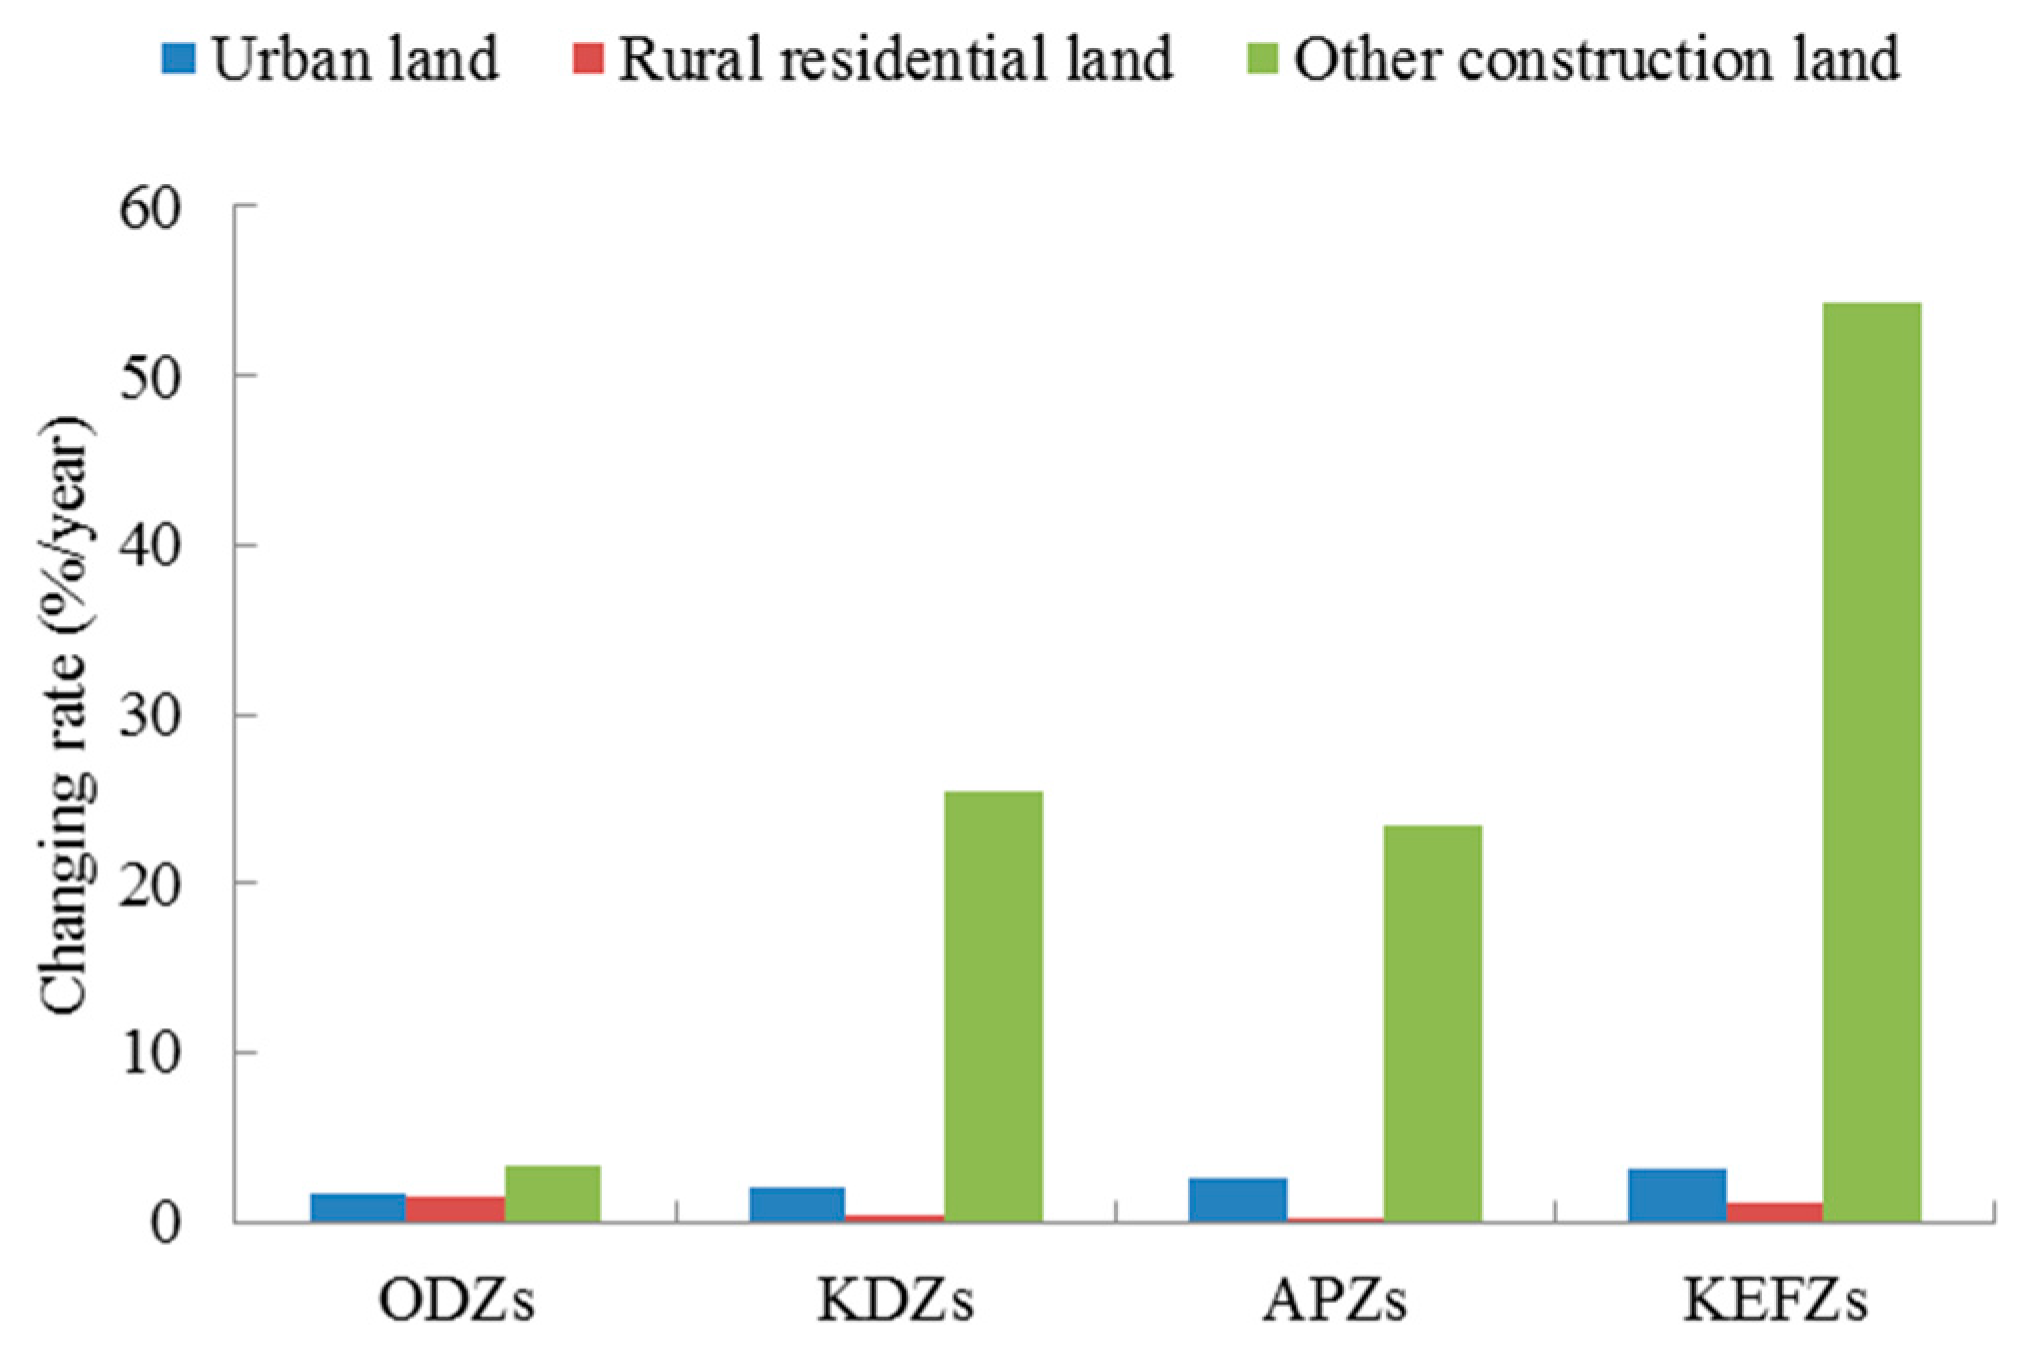
Table 4. The percentage of sub-classes for built-up areas in Major Function-Oriented Zones in 2015.
ZonesArea of Built-Up Area (×104 km2)Proportion of Urban Land (%)Proportion of Rural Residential Land (%)Proportion of Other Construction Land (%)
Optimal development zones1.0346.4042.8410.76
Key development zones 1.3232.0742.0125.92
Agricultural production zones2.3114.2473.7412.02
Key ecological function zones0.2317.2041.1241.68
Table 5. Change rate for land use types within Major Function-Oriented Zones of the Yangtze River Economic Belt from 2010–2015.
CroplandWoodlandGrasslandWater BodyBuilt-Up LandUnused Land
Optimal development zones (ODZs)−0.78−0.092.02−0.011.750
Key development zones (KDZs)−0.38−0.12−0.100.104.142.21
Agricultural production zones (APZs)−0.13−0.0600.321.890.41
Key ecological function zones (KEFZs)−0.14−0.02−0.010.429.850
Table 6. Area statistics for the soil retention rate changes between 2010 and 2015 in the Yangtze River Economic Belt.
ClassificationVariation of Soil Retention Rate during 2010 and 2015
Area (×104 km2)Ratio (%)
Obvious degradation8.654.22
Slight degradation38.4218.74
Stable99.4448.51
Slight restoration43.9521.44
Obvious restoration14.547.09
Comments: obvious degradation (slope ≤ −0.5%), slight degradation (−0.5 < slope ≤ −0.2%), stable (−0.2 < slope ≤ 0.2%), slight restoration (0.2 < slope ≤ 0.5%), and obvious restoration (slope > 0.5%).

