Abstract
Arable land in China is undergoing significant changes, with massive losses of arable land due to rapid urbanization and the reclamation of arable land from other lands to compensate for these losses. Many studies have analyzed arable land loss, but less attention has been paid to land reclamation, and the utilization of reclaimed land remains unclear. The goal of our study was to characterize the patterns and efficiency of the utilization of reclaimed land and to identify the factors influencing the land utilization process in Wenzhou using remote sensing, geographic information systems and logistic regression. Our results showed that only 37% of the total reclaimed land area was under cultivation, and other lands were still bare or had been covered by trees and grasses. The likelihood that reclaimed land was used for cultivation was highly correlated with the land use type of its neighboring or adjacent parcels. Reclaimed land utilization was also limited at high elevations in lands with poor soil fertility and in lands at a great distance from rural residential areas. In addition, parcels located in the ecological protection zone were less likely to be cultivated. Therefore, we suggest that the important determinants should be considered when identifying the most suitable land reclamation areas.
1. Introduction
The scarcity of arable land has become a vital issue in China. As the most populous country in the world, China has witnessed a dramatic decline in arable land due to large-scale urban expansion since the economic reform implemented in 1978 [1]. To halt the decline in arable land, the Chinese government proposed the “arable land requisition-compensation balance” (ALRB) policy in 1997. This policy stipulated that any losses of arable land to construction land must be replaced by reclaiming the same amount of new arable land [2]. The ALRB policy has now been implemented for nearly 20 years, however, many observations highlight that there is a trend of consuming the best arable land for urbanization while reclamation of less productive land [3,4]. In addition, a large part of reclaimed arable land has been observed to be in areas with a high elevation, poor soil quality, or an underdeveloped agricultural infrastructure; such lands are unsuitable for agricultural use, resulting in a large amount of idle land [5]. Indeed, the utilization of reclaimed land is one of the most direct reflections of the policy’s effectiveness. However, due to the lack of follow-up monitoring, the utilization status of reclaimed land remains unclear. In this regard, a precise depiction of the utilization status of reclaimed land and its mechanism should make a critical contribution to sustainable land use planning and policy decision making.
The ALRB policy focuses on the balance between arable land losses from construction occupation and arable land reclamation, which is one of the strictest arable land protection policies in China. In the cases of occupying arable land for construction, the local government is supposed to be responsible for reclaiming the same amount of arable land. This newly increased arable land, in the official Chinese definition, is called reclaimed arable land, and it is planned to be plowed and planted with crops in recent years [4]. Land exploitation, land rehabilitation, and land consolidation are usually the three methods of reclaiming arable land. Land exploitation means the conversion of natural areas such as grassland and forest land into arable land. Land rehabilitation refers to the conversion of construction land or previously damaged land into arable land. Land consolidation aims to increase the effective area of arable land by combining small farm plots into a larger plot, and it reduces the area of field paths and ditches to make the area allow agricultural mechanization [3]. Several studies have noted that land exploitation is the major approach for gaining arable land in China and that it has serious negative environmental and ecological consequences, such as soil erosion, flooding, and land degradation [4]. In China, whether a plot is reclaimed or not is decided by local governments, but the subsequent cultivation of reclaimed land depends on the will of farmers. In this context, two questions arise: (1) what is the degree of reclaimed lands used for farming; and (2) what determinants affect the utilization progress of reclaimed lands?
There has been substantial literature assessing arable land conversion in China from multidisciplinary perspectives, including arable land loss due to urbanization [6,7,8,9], arable land quality and agricultural productivity [10,11,12,13], agricultural land fragmentation and landscape change [14,15,16], and policy evaluation [3,17,18,19]. However, there are fewer studies on arable land reclamation, and these assessments mainly focus on the changes in quantity and quality induced by arable land occupation and reclamation [3,4,20]. No study has systematically examined the utilization of reclaimed arable lands. In essence, assessing the utilization of reclaimed lands is a direct way to measure the effectiveness of land reclamation projects under the ALRB policy. Therefore, it is necessary to understand the utilization status of reclaimed arable land in China.
In this paper, we aim to examine the spatial and temporal patterns of the utilization of reclaimed land and to identify its determinants. With the case of Wenzhou Region, a wealthy coastal city in China with limited land endowments, our specific objectives are as follows: (1) to characterize the utilization patterns of reclaimed land, which have been derived from GaoFen-2 high resolution satellite images and Google Earth images; (2) to quantify the factors promoting reclaimed land cultivation using logistic regression at the parcel scale; and (3) to discuss the implications for decision making with regard to land management and ecological protection.
2. Materials and Methods
2.1. Study Area
Located in the southeastern coast of China, Wenzhou Region covers a total area of 12,065 km2, of which 80% is occupied by hills and the rest by plains along the East China Sea (Figure 1). It has a humid subtropical monsoon climate, with plenty of rainfall and sunshine. The annual average temperature is 18.5 °C, annual rainfall is approximately 1818 mm, and the annual average amount of sunshine is 1728 h. Benefiting from the heat- and moisture-rich climate, the region is well suited for agriculture.
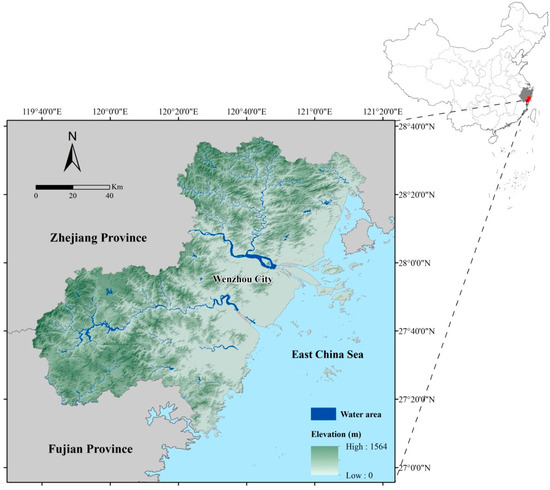
Figure 1.
Location of Wenzhou Region.
As an economically advanced region in Zhejiang Province, Wenzhou is faced with an increase in built-up lands and a decrease in arable lands, due to the prosperity of the secondary and tertiary industries since China’s reform and opening-up. With a population of 9.17 million in 2016, the area of arable land in this region is only 0.028 ha per capita, which is lower than the 0.08 ha per capita for China and 0.47 ha per capita for the United States. The protection of arable land in Wenzhou is facing severe challenges, and therefore, it is an ideal location for examining the performance of the arable land protection policy and the utilization of reclaimed arable land.
2.2. Reclaimed Arable Land Interpretation
At a scale of 1:10,000, digital land use data showing reclaimed arable land parcels were provided by the Bureau of Land and Resources of Wenzhou. The Bureau of Land and Resources records all land reclamation projects and updates the land use database every year. The utilization of reclaimed arable land was visually interpreted by using GaoFen-2 high resolution satellite images and Google Earth images based on the boundaries of reclaimed arable land polygons. The Gaofen-2 satellite is China’s first sub-meter resolution civil satellite. The images from this satellite contain four multi-spectral bands with a 3.24 m spatial resolution and a panchromatic band with a 0.81 m spatial resolution [21]. By observing historical images from Google Earth, we found that after reclamation, there were three kinds of land cover change trajectories. As demonstrated in Table 1 and Figure 2, the land after reclamation was only covered by soils without vegetation, one part of the newly reclaimed lands was used for cultivation, another part was still bare and left unused, and if the land was left uncultivated for several years it would be covered by non-managed grasses, shrubs, and trees. Since the cultivation of reclaimed land generally occurred within two years and few lands were abandoned after cultivation, therefore we used the GaoFen-2 high resolution satellite images and Google Earth images in 2016 to identify the utilization of the reclamation projects during 2008–2014. The utilization classes of reclaimed arable land were aggregated into two categories: managed arable land and uncultivated land. Managed arable land was defined as newly increased arable land used for cultivation in 2016 (Table 1). Uncultivated land was defined as newly increased arable land that remained bare or was covered by grasslands and trees in 2016.

Table 1.
Description of land cover changes after reclamation and the land use classification in the study.
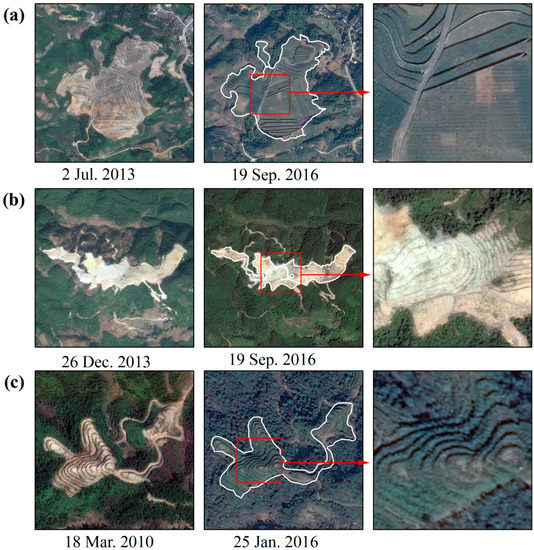
Figure 2.
Typical examples of the land cover transition process for parcels after reclamation using Google Earth images; (a–c) represent reclaimed land parcels transformed into arable land, bare land, and forest, respectively, in 2016.
2.3. Method
Land reclamation in China is an action by the government that includes site selection and project implementation. After reclamation, whether to cultivate the reclaimed arable land is the farmers’ decision and involves land use change. To understand land use change, it is necessary to understand the determinants that affect land use decision making [22]. The economic framework, based on economic models of human behavior, is now widely acknowledged as an essential approach to understanding the factors influencing land use decisions. The economic theory generally assumes that agricultural producers make their land use decision by comparing the costs and benefits of alternative land uses to maximize their net income [23,24]. In the case of reclaimed arable land utilization, farmers decide between cultivating the land for agricultural use or leaving it idle. Leaving land idle is assumed to occur if the net income of farming the reclaimed land is negative.
2.3.1. Explanatory Variables
The response variable used in the statistical models refers to the presence or absence of reclaimed land cultivation. Based on the economic framework, we selected explanatory variables that may affect the decision with regard to the utilization of reclaimed arable land from three types, geo-physical, proximity, and neighborhood variables (Table 2), which previous studies have demonstrated to be effective in guiding the selection of potential explanatory variables [25,26,27].
Table 2.
Explanatory variables used in the study.
Geo-physical determinants refer to the natural conditions of a plot of land and may directly affect the benefits of agricultural production. Therefore, we selected two topographic variables (elevation and slope), since Wenzhou is a mountainous region. To incorporate soil properties, we used the soil fertility variable obtained from the agricultural land classification and gradation database of Wenzhou [5]. The soil fertility was graded into five categories, with “5” representing the most fertile soils and “1” representing the worst.
Proximity determinants refer to the distance to transportation routes, rivers, and county, town, and rural residential areas. A high proximity to transportation routes can reduce the costs for human living and production activities. To estimate transportation convenience, we chose two variables, the distance to county road and the distance to rural road, since the impacts of different types of roads are different [28]. A greater proximity to rivers suggests a higher probability of agricultural irrigation. Thus, the distance to the nearest river was selected in this study. Two variables (the distance to the nearest county urban area and the distance to the nearest town) were selected to reflect the proximity to socioeconomic areas and the intensity of human activities, and these variables can also be used as indicators of socioeconomic conditions, according to previous studies [29,30], since census-based variables were not available at the parcel level. The distance to the nearest rural residential area reflects cultivation accessibility. All the distances noted above were the Euclidean distance of each reclaimed arable land parcel to the nearest road/river/county/town/village.
Neighborhood determinants reflect the relationship between the reclaimed arable land parcel and the surrounding land use types. Previous studies suggest that neighborhood conditions have great impacts on land use changes, especially for farmlands, since neighboring land parcels might have similar properties [31,32,33]. To estimate these regional land cover effects, we calculated the percentage of arable land area within a 500 m radius and the percentage of forest area within a 500 m radius in the land use map. The adjacency relationship between reclaimed land parcels and the surrounding land use types is also of great importance. We thus selected another two variables: the degree of adjacency of reclaimed land parcel to surrounding arable parcels and the degree of adjacency of reclaimed land parcel to surrounding forest parcels.
The degree of adjacency of reclaimed land parcel to surrounding arable parcels reflects the degree to which reclaimed land parcel connect to other surrounding arable parcels, as shown in Equation (1):
where represents the connected parameter between reclaimed land parcel i and the surrounding arable parcel and Li is the parameter of reclaimed land parcel i. ; higher values indicate a greater degree of adjacency to surrounding arable parcels.
The degree of adjacency of reclaimed land parcel to surrounding forest parcels reflects the degree to which reclaimed land parcel connect to other surrounding forest parcels, as shown in Equation (2):
where represents the connected parameter between reclaimed land parcel i and the surrounding forest parcel and Li is the parameter of reclaimed land parcel i. ; higher values indicate a greater degree of adjacency to surrounding forest parcels.
The ecological protection boundary, provided by the Bureau of Land and Resources of Wenzhou, is a zoning policy that protects areas of high ecological value from illegal occupation. Reclaimed land located in the ecological protection zone may increase the risk of vegetation recovery because these areas may play the role of seed bank for adjacent lands [34]. Whether zoning has an effect on the utilization of reclaimed land was examined in the regression. One dummy variable was defined for whether the parcel was located in the ecological protection zone (assigned a value of “1”) or not (assigned a value of “0”).
2.3.2. Logistic Regression Model
Land use change patterns and their drivers are usually quantitatively described by using regression analysis [35]. Compared with linear regression and log-linear regression, logistic regression is more appropriate for use with non-continuous and categorical variables [36]. In this study, a logistic regression model was employed to estimate the determinants of reclaimed land utilization. Therefore, we defined a value of “1” for a parcel as representing reclaimed arable land that was used for agriculture in 2016 and “0” as reclaimed arable land that was still bare or covered by forest in 2016. The general form of logistic regression is described as follows:
where and refers to the probability that reclaimed land will be used for agriculture at parcel i; k is the number of potential determinants; is the estimated constant; is the coefficient of determinant factor j; is the value of parcel i for the determinant factor j; and e is the error term.
To facilitate interpretation, all explanatory variables were processed by Z-score standardization before regression [37]. After variable standardization, the relative influence of each independent variable on the dependent variables may be reflected by the standardized coefficients [38]. The larger the absolute value of the coefficient is, the greater the influence of the variable on reclaimed land utilization will be.
To evaluate the goodness-of-fit of the logistic model, we calculated the percentage of observations predicted correctly (PC, Equation (5)) and the area under the curve (AUC) of the relative operating characteristic (ROC). The AUC statistic is used to measure the probability that the model will correctly allocate the cultivated and uncultivated lands. AUC values usually range between 0.5 (random performance) and 1 (perfect fit). In general, the logistic model can be defined as successful if the AUC value exceeds 0.7, which indicates that the interpretability of the independent variable based on the dependent variable is strong [38,39].
where PC is the percentage of observations predicted correctly; Nc is the number of correct predictions; and No is the total number of observations.
To avoid spatial autocorrelation that would interfere with the accuracy of the logistic model, we first calculated Moran’s I statistics for the patterns of reclaimed land utilization. The results showed that there existed a clustered tendency, with the Moran’s I = 0.44, which could not be simply disregarded. Therefore, we employed a systematic sampling and random sampling approach that was adopted in previous studies to reduce the spatial autocorrelation by expanding the distance interval between the sampled sites [40]. When the distance reached 500 m, Moran’s I index was significantly reduced to 0.02; in other words, the spatial distribution of the sample was more likely to be random. Then, we selected the equal number of points, where reclaimed land is used for agriculture (coded as 1) or not (coded as 0). Finally, the number of sampled points in the study area was 750.
3. Results
3.1. Spatio-Temporal Patterns of the Utilization of Reclaimed Land
Between 2008 and 2014, there were 8534.91 ha of land reclaimed as arable land in Wenzhou. Statistics show that only 37.04% (3161.72 ha) of the total area was utilized for agriculture and that other lands were still bare (3724.30 ha) or were covered by forest (1648.89 ha) in 2016 (Figure 3). The land utilization data by year of the reclamation projects implemented between 2008 and 2014 is illustrated in Figure 3. It is apparent that the total amount of reclaimed land showed large fluctuations during the period studied. In 2008, 422.29 ha of land was reclaimed from other lands. That value increased to 1760.70 ha in 2009. Then, in 2010, it decreased to 475.88 ha and remained low in 2011 and 2012. The amount then abruptly increased to 3475.69 ha in 2013 and 1602.23 ha in 2014, since the government needed to supply the same amount of arable land to meet the large loss of arable land occupied by construction in these two years. There were also large gaps in the amount of managed arable land and uncultivated land (bare land and forest). The proportion of managed arable land experienced an increasing and decreasing trend. With the passage of reclamation time, the proportion of forest rose and the proportion of bare land gradually decreased.
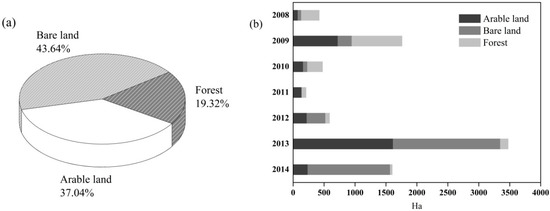
Figure 3.
Statistics of the area of different utilization types of reclaimed land in Wenzhou Region; (a) total reclamation projects during 2008 and 2014; (b) yearly reclamation projects.
The spatial distributions of the reclaimed land parcels from 2008 to 2014 are described in Figure 4. The reclaimed land parcels in the first few years were mainly concentrated in the northwest hilly areas, including Wencheng, Taishun, Pingyang and Cangnan Counties, where the economy was relatively undeveloped. Then, in 2013 and 2014, reclamation projects gradually began to be implemented in the northern region and were pushed to reclaim from shoals to explore more arable land reserves. Compared to the land use map in 2014, the reclaimed land parcels from 2008 to 2014 were mainly distributed in areas dominated by forest. Statistics show that forest land was the primary source of land reclamation during the period studied, followed by grassland, accounting for 74.27% and 28.45% of the total reclamation, respectively.
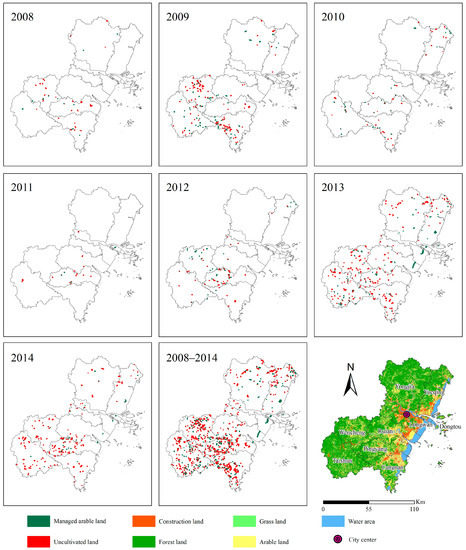
Figure 4.
Spatial distribution of reclaimed land parcels from 2008 to 2014.
3.2. Description of the Variables for the Logistic Regression
To eliminate the impact of multi-collinearity, we checked the correlation coefficients between the explanatory variables and found that the absolute coefficient values were small and acceptable (r 0.5). Thus, all explanatory variables were retained in the logistic regression. Figure 5 shows the probability density of the explanatory variables for all reclaimed land parcels, which indicates the frequency distribution of observations where the reclaimed parcel has been cultivated and where the parcel was unused. The elevation of both managed arable land and uncultivated land was relatively high; the highest frequency of managed arable lands was at altitudes between approximately 400 and 500 m, while uncultivated lands were primarily found in areas with an elevation higher than 500 m. Compared with uncultivated land, parcels where the reclaimed land has been used for agriculture were found to be more adjacent to surrounding arable parcels and less adjacent to surrounding forest parcels. Moreover, there was a higher percentage of arable land within a 500 m radius and a lower percentage of forest land within a 500 m radius of managed arable land. The frequency distribution of managed arable lands and uncultivated lands showed no great difference in other variables.
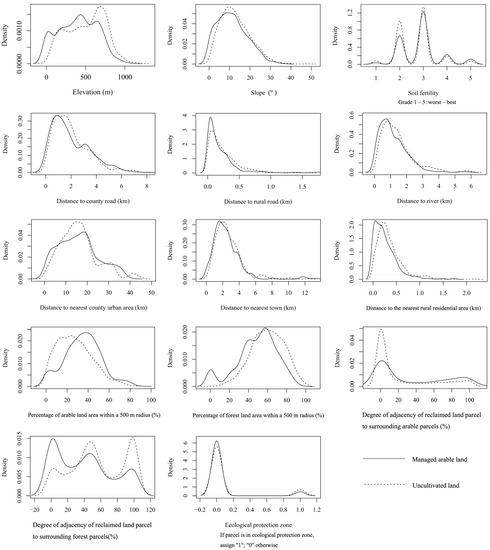
Figure 5.
Frequency distribution of explanatory variables for reclaimed arable lands.
3.3. Determinants of Reclaimed Land Utilization
The determinants of reclaimed land utilization identified by logistic regression are presented in Table 3. For model goodness-of-fit, an AUC value of 0.730 signified spatial agreement between the model predictions and the actual land utilization. The PC value of the logistic regression model was 0.671, indicating that the model can correctly distinguish in the total number of observations, with a probability of 67%. These statistics suggest that the established logistic regression was adequate to explain the dynamics of reclaimed land utilization.
Table 3.
Logistic regression results of reclaimed land utilization.
According to the model results, seven variables were significant at p < 0.05. The rank order of the relative influence of the significant variables on reclaimed land utilization from high to low is as follows: Pct_forest, Adj_forest, Adj_arable, Elevation, Dist_rural, Ecol_zone, and Soil, as reflected by the absolute value of the standardized coefficients. Pct_forest had the strongest negative and significant effect on reclaimed land utilization, followed by Adj_forest, demonstrating that the neighboring effects of forests played a critical role in the land utilization process. Adj_arable presented a positive relationship with reclaimed land utilization, implying that the cultivation probability of a parcel increased with the increased degree of adjacency of a parcel to surrounding arable parcels. The variable elevation was identified as a significant negative variable, suggesting that the cultivation of reclaimed land was likely to be observed in areas with a low elevation. The estimated coefficient of soil fertility was positive and significant, indicating that parcels with high soil fertility were prone to be used for cultivation. Dist_rural was significant with negative coefficient signs, which suggested that a high likelihood of reclaimed land utilization was observed in parcels with a high proximity to farmers’ residential areas. In addition, in the statistical model, Ecol_zone was negative and significant, showing that parcels in the ecological protection zone were likely to be left unused.
4. Discussion
4.1. Low Utilization Efficiency of Reclaimed Arable Lands
Our findings indicate a low utilization efficiency of reclaimed arable lands in Wenzhou, with less than 40% of the total reclaimed lands being used for cultivation. The reclamation projects mainly occurred in the southwest hilly areas, and most of the reclaimed arable lands were established in places previously used as grassland and forest. Similar findings with regard to the reclamation of pastureland and deforestation were also prevalent in the northwest arid and semiarid areas of China, especially in Inner Mongolia and Xinjiang Province [4]. The reason for this finding is that, compared to the conversion of construction land, the reclamation of forest and grassland for arable land is relatively low-cost and easy to conduct. However, this increase in arable land is made at the expense of the ecosystem.
More than 60% of the reclaimed lands in the study area were still bare or had been taken over by forest, leading to both financial and resource waste. From the perspective of maintaining a dynamic balance of the quantity of arable land, the actual area of total arable land had decreased because these lands were not cultivated and had no practical utility. Furthermore, the soil and water conservation ability of bare land is poor, which could pose the potential risk of soil erosion and land degradation [41]. In addition, part of the reclaimed lands had been covered by grasses and trees in 2016 due to the long period of time lying idle, and they may be re-developed as arable land again. This inappropriate use of land could lead to a vicious circle of “reclamation–lying idle–forest re-growth–reclamation”.
4.2. Relative Roles of Geo-Physical, Proximity, and Neighborhood Factors in Reclaimed Land Utilization
This study employed a logistic regression model to identify the determinants that best explain the utilization progress of reclaimed arable lands in Wenzhou by integrating a range of geo-physical, proximity, and neighborhood factors. The results showed positive effects of higher soil fertility and adjacency to arable lands and negative effects of higher altitudes, increased distances to rural residential areas, adjacency to forests, and location in the ecological protection zone. Among the three types of determinants, the neighborhood variables were the most important. These findings generally confirm the study hypothesis that the utilization of reclaimed land occurred where the cultivation costs were low and potential productivity was high.
The regression for reclaimed land utilization showed that cultivation occurred in areas that have better geo-physical conditions (e.g., a low elevation and high soil fertility). A negative association between elevation and the likelihood of land utilization was expected and consistent with previous findings [42,43]. This result should be attributed to the greater accessibility and fewer restrictions on cultivation [29]. The cultivation potential of reclaimed land was also constrained by soil fertility, as demonstrated in our study, in which cultivation activities were more likely to occur on fertile soils. Some researchers have indicated that soils of high fertility are usually the last to be abandoned [44,45,46]. It makes sense that fertile soils could provide sufficient nutrition and have high value for agriculture.
Dist_rural was a negative explanatory variable, suggesting that reclaimed lands far from rural residential areas would experience a lower probability of cultivation. This result coincided with previous studies showing that land cultivation was mainly found in areas close to villages [43,47]. A higher proximity to rural residential areas guarantees a farming labor supply. Farmers may value accessibility benefits because they reduce distance and the costs of tillage. Therefore, the distance to rural residential areas became a crucial determinant of farmers’ decision to cultivate reclaimed land.
Neighborhood variables exerted a decisive impact on the reclaimed arable land utilization process. Pct_forest had the greatest negative influence on the probability of reclaimed land utilization, followed by Adj_forest. In this study, we observed that many uncultivated arable lands were individual parcels within a forest matrix. Areas in the neighborhood exhibiting similar factors and, therefore, parcels isolated by forests showed a much higher propensity for lying idle than those in close proximity to other arable parcels. This finding indicates a tendency toward a homogenous arable land structure. Previous studies have also found that neighboring forests act as a source of seeds and have a heavy influence on nearby land parcels through seed dispersal, which can cause reforestation [48]. In addition to the neighboring forest cover, Adj_arable had beneficial effects on land utilization. The closeness to forests and isolated arable land parcels would decrease tillage accessibility and increase production costs, also demonstrating the significance of profit maximization for land use [23]. Furthermore, adjacency to arable lands would increase tillage accessibility and could provide a more complete agricultural infrastructure. A lower probability of land cultivation was found on parcels located in the ecological protection zone. This negative influence might be the result of the greater number of seed sources and the larger populations of animal dispersers in the ecological protection zone [49]. In addition, a reduced likelihood of human activities in these places decreased tillage accessibility.
In this study, although part of the crucial determinants of reclaimed land utilization was identified using logistic regression, the mechanisms of utilization progress could not be comprehensively presented. Indeed, socioeconomic factors based on household surveys, such as rural income, the agricultural labor intensity, the age and education of farmers, and industrial structure [50,51], also have impacts on land use changes. These variables were not considered in our study because individual-level data were not available. Further research is necessary to consider more potential determinants, including household individual characteristics and economic factors at the multilevel, and to employ more regression techniques to improve model performance.
4.3. Policy Implications
The low utilization efficiency of reclaimed land in the study area may reflect some problems during the execution of the ALRB policy in China. The hidden reason is the conflict between the central control and local interests. The purpose of China’s central government proposed the ALRB policy is to maintain the total amount of arable land and to ensure food security by reclaiming the same area of land to replenish arable land losses caused by urbanization. While local governments have limited incentives to preserve natural resources [52], they rely on the conversion of arable land to construction use to attract investment, fuel fiscal revenue, and achieve fast economic development [53]. Therefore, local governments continue to expropriate arable lands near cities for urbanization on a large scale, including many high-quality lands [8], and to seek replacements in border and less developed areas to meet the mandatory requirement, regardless of the location of reclaimed lands and regardless of whether they will be utilized. The undeveloped areas may even be willing to shoulder this burden because this reclamation involves financial compensation [4]. Consequently, as shown in the study area, land reclamation projects have resulted in a large number of marginal, degraded, and isolated reclaimed arable lands. These lands were generally characterized by low utilization efficiency because of their unfavorable growing conditions, high opportunity costs, and low production income, damaging farmers’ willingness to cultivate them. Reclaiming more of these marginal lands can only cause more useless lands and aggravate environmental degradation. In fact, this phenomenon not only was found in the study area but also is prevalent throughout China, as demonstrated in the study by Lichtenberg et al. [54].
The central government of China had realized the serious agricultural and environmental consequences of unqualified land reclamation under the ALRB policy, and proposed that the occupied paddy field must be supplemented by the same area of paddy field to emphasize the quality of reclaimed land. And we suggest that the central and provincial governments should strengthen the supervision of reclaimed land utilization. It is necessary to carry out scientific and reasonable land reclamation planning in consideration of the driving factors of land utilization. In this study, we found that neighborhood variables, especially Pct_forest and Adj_forest, had a crucial influence on land utilization in Wenzhou. Therefore, land reclamation projects should avoid agriculturally less favorable mountainous areas surrounded by forests and should be implemented in close proximity to other arable lands and rural residential areas. And land reclamation must be prohibited in ecological protection zones to ensure the natural restoration of vegetation in the region. In addition, compared to compensation for the arable land quantity, measures to improve arable land quality and productivity are better suited to promoting food security. Promoting land consolidation by reducing limitations such as those on building irrigation, cultivating soil fertility, and combining small farm plots to produce high-quality arable land, is a viable solution. Although this study was conducted only in Wenzhou, the methodological framework can be also applicable to other areas and countries when analyzing with the researches about land utilization and abandonment.
5. Conclusions
This study characterized the utilization patterns of reclaimed arable lands in Wenzhou, China. It was found that 8534.91 ha of arable land was reclaimed (from other land use types) between 2008 and 2014; however, until 2016, only 37.04% of the total area was under cultivation, and other lands were still bare or had been covered by grasses and trees. Therefore, knowledge about the drivers of reclaimed arable land cultivation is critical to understanding the utilization mechanism. In this study, we assessed the determinants of geo-physical, proximity, and neighborhood variables using logistic regression at the parcel level. The results revealed that reclaimed land cultivation was strongly correlated with the land use of adjacent or neighboring parcels. The degree of adjacency to surrounding arable parcels had a positive influence on land utilization, and the probability of being cultivated decreased with the increase in the degree of adjacency to forests and surrounding forest areas. In addition, elevation was a negative determinant, and soil fertility had a positive effect on land cultivation. Good accessibility to rural residential areas promoted the cultivation of reclaimed lands. Moreover, parcels located in an ecological protection zone had a lower probability of cultivation. These findings support the hypothesis that land utilization occurred where the cultivation costs were low and the potential productivity was high. We conclude that there has been a low degree of utilization of reclaimed land in Wenzhou, wasting resources and possibly having negative impacts on the environment. Land reclamation was more likely to be a mandatory task for local governments under the ALRB policy, decreasing the effectiveness of this policy. Thus, we suggest that reasonable land reclamation planning is needed that accounts for the driving factors of land utilization and the central and provincial governments should strengthen the supervision of reclaimed land utilization. Our study extends the understanding of the mechanism of reclaimed arable land utilization in China and is therefore a useful resource for land use planners to help them identify the most suitable land reclamation areas and to ensure agricultural and environmental safety.
Acknowledgments
This research was financially supported by the National Natural Science Foundation of China (No. 41401595), Natural Science Foundation of Zhejiang Province (No. LQ18D010005), Natural Science Foundation of Zhejiang province (No. LQ17D010003) and Basic Public Welfare Research Program of Zhejiang Province (No. LGN18D010001).
Author Contributions
Lin Lin, Ke Wang, and Zhoulu Yu had the original idea for the study and all coauthors conceived and designed the methodology. Lin Lin and Hongzhen Jia analyzed the data. Lin Lin wrote the paper, which was revised by Muye Gan, Yi Pan, Lefeng Qiu, Shenggao Lu and Jinsong Deng. All authors read and approved the final manuscript.
Conflicts of Interest
The authors declare no conflicts of interest.
References
- Ramankutty, N.; Foley, J.A.; Olejniczak, N.J. People on the Land: Changes in Global Population and Croplands during the 20th Century. AMBIO J. Hum. Environ. 2002, 31, 251–257. [Google Scholar] [CrossRef]
- Liu, Y.; Fang, F.; Li, Y. Key issues of land use in China and implications for policy making. Land Use Policy 2014, 40, 6–12. [Google Scholar] [CrossRef]
- Song, W.; Pijanowski, B.C. The effects of China’s cultivated land balance program on potential land productivity at a national scale. Appl. Geogr. 2014, 46, 158–170. [Google Scholar] [CrossRef]
- Yang, H.; Li, X. Cultivated land and food supply in China. Land Use Policy 2000, 17, 73–88. [Google Scholar] [CrossRef]
- Lin, L.; Ye, Z.; Gan, M.; Shahtahmassebi, A.; Weston, M.; Deng, J.; Lu, S.; Wang, K. Quality Perspective on the Dynamic Balance of Cultivated Land in Wenzhou, China. Sustainability 2017, 9, 95. [Google Scholar] [CrossRef]
- Liu, T.; Liu, H.; Qi, Y. Construction land expansion and cultivated land protection in urbanizing China: Insights from national land surveys, 1996–2006. Habitat Int. 2015, 46, 13–22. [Google Scholar] [CrossRef]
- Song, W.; Pijanowski, B.C.; Tayyebi, A. Urban expansion and its consumption of high-quality farmland in Beijing, China. Ecol. Indic. 2015, 54, 60–70. [Google Scholar] [CrossRef]
- Kong, X. China must protect high-quality arable land. Nature 2014, 506, 7. [Google Scholar] [CrossRef] [PubMed]
- Huang, D.; Jin, H.; Zhao, X.; Liu, S. Factors Influencing the Conversion of Arable Land to Urban Use and Policy Implications in Beijing, China. Sustainability 2015, 7, 180–194. [Google Scholar] [CrossRef]
- He, C.; Liu, Z.; Xu, M.; Ma, Q.; Dou, Y. Urban expansion brought stress to food security in China: Evidence from decreased cropland net primary productivity. Sci. Total Environ. 2017, 576, 660–670. [Google Scholar] [CrossRef] [PubMed]
- Jin, G.; Li, Z.; Wang, Z.; Chu, X.; Li, Z. Impact of land-use induced changes on agricultural productivity in the Huang-Huai-Hai River Basin. Phys. Chem. Earth 2015, 79–82, 86–92. [Google Scholar] [CrossRef]
- Zhang, J.; Zhang, F.; Zhang, D.; He, D.; Zhang, L.; Wu, C.; Kong, X. The grain potential of cultivated lands in Mainland China in 2004. Land Use Policy 2009, 26, 68–76. [Google Scholar] [CrossRef]
- Yan, H.; Liu, J.; Huang, H.Q.; Tao, B.; Cao, M. Assessing the consequence of land use change on agricultural productivity in China. Glob. Planet. Chang. 2009, 67, 13–19. [Google Scholar] [CrossRef]
- Su, S.; Jiang, Z.; Zhang, Q.; Zhang, Y. Transformation of agricultural landscapes under rapid urbanization: A threat to sustainability in Hang-Jia-Hu region, China. Appl. Geogr. 2011, 31, 439–449. [Google Scholar] [CrossRef]
- Yucer, A.A.; Kan, M.; Demirtas, M.; Kalanlar, S. The importance of creating new inheritance policies and laws that reduce agricultural land fragmentation and its negative impacts in Turkey. Land Use Policy 2016, 56, 1–7. [Google Scholar] [CrossRef]
- Su, S.; Ma, X.; Xiao, R. Agricultural landscape pattern changes in response to urbanization at ecoregional scale. Ecol. Indic. 2014, 40, 10–18. [Google Scholar] [CrossRef]
- Zhang, W.; Wang, W.; Li, X.; Ye, F. Economic development and farmland protection: An assessment of rewarded land conversion quotas trading in Zhejiang, China. Land Use Policy 2014, 38, 467–476. [Google Scholar] [CrossRef]
- Liu, X.; Zhao, C.; Song, W. Review of the evolution of cultivated land protection policies in the period following China’s reform and liberalization. Land Use Policy 2017, 67, 660–669. [Google Scholar] [CrossRef]
- Skinner, M.W.; Kuhn, R.G.; Joseph, A.E. Agricultural land protection in China: A case study of local governance in Zhejiang Province. Land Use Policy 2001, 18, 329–340. [Google Scholar] [CrossRef]
- Liu, J.; Liu, M.; Tian, H.; Zhuang, D.; Zhang, Z.; Zhang, W.; Tang, X.; Deng, X. Spatial and temporal patterns of China’s cropland during 1990–2000: An analysis based on Landsat TM data. Remote Sens. Environ. 2005, 98, 442–456. [Google Scholar] [CrossRef]
- Wang, H.; Wang, C.; Wu, H. Using GF-2 Imagery and the Conditional Random Field Model for Urban Forest Cover Mapping. Remote Sens. Lett. 2016, 7, 378–387. [Google Scholar] [CrossRef]
- Irwin, E.G.; Geoghegan, J. Theory, data, methods: Developing spatially explicit economic models of land use change. Agric. Ecosyst. Environ. 2001, 85, 7–24. [Google Scholar] [CrossRef]
- Gellrich, M.; Baur, P.; Koch, B.; Zimmermann, N.E. Agricultural land abandonment and natural forest re-growth in the Swiss mountains: A spatially explicit economic analysis. Agric. Ecosyst. Environ. 2007, 118, 93–108. [Google Scholar] [CrossRef]
- Xie, H.; Wang, P.; Yao, G. Exploring the Dynamic Mechanisms of Farmland Abandonment Based on a Spatially Explicit Economic Model for Environmental Sustainability: A Case Study in Jiangxi Province, China. Sustainability 2014, 6, 1260–1282. [Google Scholar] [CrossRef]
- Su, S.; Xiao, R. Spatially Varying Determinants of Farmland Conversion across Qiantang Watershed, China. Environ. Manag. 2013, 52, 907–916. [Google Scholar] [CrossRef] [PubMed]
- Wehner, S.; Herrmann, S.; Berkhoff, K. CLUENaban A land use change model combining social factors with physical landscape factors for a mountainous area in Southwest China. Ecol. Indic. 2014, 36, 757. [Google Scholar] [CrossRef]
- Dubovyk, O.; Sliuzas, R.; Flacke, J. Spatio-temporal modelling of informal settlement development in Sancaktepe district, Istanbul, Turkey. Isprs J. Photogramm. 2011, 66, 235–246. [Google Scholar] [CrossRef]
- Su, S.; Xiao, R.; Li, D.; Hu, Y. Impacts of Transportation Routes on Landscape Diversity: A Comparison of Different Route Types and Their Combined Effects. Environ. Manag. 2014, 53, 636–647. [Google Scholar] [CrossRef] [PubMed]
- Su, S.; Yang, C.; Hu, Y.; Luo, F.; Wang, Y. Progressive landscape fragmentation in relation to cash crop cultivation. Appl. Geogr. 2014, 53, 20–31. [Google Scholar] [CrossRef]
- Miyamoto, M. Forest conversion to rubber around Sumatran villages in Indonesia: Comparing the impacts of road construction, transmigration projects and population. For. Policy Econ. 2006, 9, 1–12. [Google Scholar] [CrossRef]
- Verburg, P.H.; de Nijs, T.C.M.; Ritsema Van Eck, J.; Visser, H.; de Jong, K. A method to analyse neighbourhood characteristics of land use patterns. Comput. Environ. Urban 2004, 28, 667–690. [Google Scholar] [CrossRef]
- Tepe, E.; Guldmann, J. Spatial and temporal modeling of parcel-level land dynamics. Comput. Environ. Urban 2017, 64, 204–214. [Google Scholar] [CrossRef]
- Su, S.; Zhou, X.; Wan, C.; Li, Y.; Kong, W. Land use changes to cash crop plantations: Crop types, multilevel determinants and policy implications. Land Use Policy 2016, 50, 379–389. [Google Scholar] [CrossRef]
- Helmer, E.H. Forest conservation and land development in Puerto Rico. Landsc. Ecol. 2004, 19, 29–40. [Google Scholar] [CrossRef]
- Overmars, K.P.; de Koning, G.H.J.; Veldkamp, A. Spatial autocorrelation in multi-scale land use models. Ecol. Model. 2003, 164, 257–270. [Google Scholar] [CrossRef]
- Overmars, K.P.; Verburg, P.H. Analysis of land use drivers at the watershed and household level: Linking two paradigms at the Philippine forest fringe. Int. J. Geogr. Inf. Sci. 2005, 19, 125–152. [Google Scholar] [CrossRef]
- Shu, B.; Zhang, H.; Li, Y.; Qu, Y.; Chen, L. Spatiotemporal variation analysis of driving forces of urban land spatial expansion using logistic regression: A case study of port towns in Taicang City, China. Habitat Int. 2014, 43, 181–190. [Google Scholar] [CrossRef]
- Menard, S. Six Approaches to Calculating Standardized Logistic Regression Coefficients. Am. Stat. 2004, 58, 218–223. [Google Scholar] [CrossRef]
- Pontius, R.G.; Schneider, L.C. Land-cover change model validation by an ROC method for the Ipswich watershed, Massachusetts, USA. Agric. Ecosyst. Environ. 2001, 85, 239–248. [Google Scholar] [CrossRef]
- Cheng, J.; Masser, I. Urban growth pattern modeling: A case study of Wuhan city, PR China. Landsc. Urban Plan. 2003, 62, 199–217. [Google Scholar] [CrossRef]
- Huading, S.; Jiyuan, L.; Dafang, Z.; Yunfeng, H. Using the RBFN model and GIS technique to assess wind erosion hazard of Inner Mongolia, China. Land Degrad. Dev. 2007, 18, 413–422. [Google Scholar] [CrossRef]
- Lakes, T.; Müller, D.; Krüger, C. Cropland change in southern Romania: A comparison of logistic regressions and artificial neural networks. Landsc. Ecol. 2009, 24, 1195–1206. [Google Scholar] [CrossRef]
- Mottet, A.; Ladet, S.; Coqué, N.; Gibon, A. Agricultural land-use change and its drivers in mountain landscapes: A case study in the Pyrenees. Agric. Ecosyst. Environ. 2006, 114, 296–310. [Google Scholar] [CrossRef]
- Soler, L.D.S.; Escada, M.I.S.; Verburg, P.H. Quantifying deforestation and secondary forest determinants for different spatial extents in an Amazonian colonization frontier (Rondonia). Appl. Geogr. 2009, 29, 182–193. [Google Scholar] [CrossRef]
- Arroyo-Mora, J.P.; Sánchez-Azofeifa, G.A.; Rivard, B.; Calvo, J.C.; Janzen, D.H. Dynamics in landscape structure and composition for the Chorotega region, Costa Rica from 1960 to 2000. Agric. Ecosyst. Environ. 2005, 106, 27–39. [Google Scholar] [CrossRef]
- Zhang, C.; Liu, G.; Xue, S.; Wang, G. Changes in rhizospheric microbial community structure and function during the natural recovery of abandoned cropland on the Loess Plateau, China. Ecol. Eng. 2015, 75, 161–171. [Google Scholar] [CrossRef]
- Thenail, C.; Baudry, J. Variation of farm spatial land use pattern according to the structure of the hedgerow network (bocage) landscape: A case study in northeast Brittany. Agric. Ecosyst. Environ. 2004, 101, 53–72. [Google Scholar] [CrossRef]
- Chazdon, R.L. Tropical forest recovery: Legacies of human impact and natural disturbances. Perspect. Plant Ecol. 2003, 6, 51–71. [Google Scholar] [CrossRef]
- Crk, T.; Uriarte, M.; Corsi, F.; Flynn, D. Forest recovery in a tropical landscape: What is the relative importance of biophysical, socioeconomic, and landscape variables? Landsc. Ecol. 2009, 24, 629–642. [Google Scholar] [CrossRef]
- Zhang, Q.; Gao, W.; Su, S.; Weng, M.; Cai, Z. Biophysical and socioeconomic determinants of tea expansion: Apportioning their relative importance for sustainable land use policy. Land Use Policy 2017, 68, 438–447. [Google Scholar] [CrossRef]
- Liu, G.; Wang, H.; Cheng, Y.; Zheng, B.; Lu, Z. The impact of rural out-migration on arable land use intensity: Evidence from mountain areas in Guangdong, China. Land Use Policy 2016, 59, 569–579. [Google Scholar] [CrossRef]
- Lyles, W.; Berke, P.; Smith, G. Local plan implementation: Assessing conformance and influence of local plans in the United States. Environ. Plan. B 2016, 43, 1916–1922. [Google Scholar] [CrossRef]
- Shen, X.; Wang, L.; Wu, C.; Lv, T.; Lu, Z.; Luo, W.; Li, G. Local interests or centralized targets? How China’s local government implements the farmland policy of Requisition–Compensation Balance. Land Use Policy 2017, 67, 716–724. [Google Scholar] [CrossRef]
- Lichtenberg, E.; Ding, C. Assessing farmland protection policy in China. Land Use Policy 2008, 25, 59–68. [Google Scholar] [CrossRef]
© 2017 by the authors. Licensee MDPI, Basel, Switzerland. This article is an open access article distributed under the terms and conditions of the Creative Commons Attribution (CC BY) license (http://creativecommons.org/licenses/by/4.0/).