Article

Pharmacodynamics, Pharmacokinetics, and Kidney Distribution of Raw and Wine-Steamed Ligustri Lucidi Fructus Extracts in Diabetic Nephropathy Rats

1
Innovative Institute of Chinese Medicine and Pharmacy, Shandong University of Traditional Chinese Medicine, Jinan 250355, China
2
School of Pharmacy, Shandong University of Traditional Chinese Medicine, Jinan 250355, China
3
Shandong Provincial Collaborative Innovation Center for Quality Control and Construction of the Whole Industrial Chain of Traditional Chinese Medicine, Jinan 250355, China
4
School of Pharmacy, Shanxi University of Chinese Medicine, Jinzhong 030619, China
*
Author to whom correspondence should be addressed.
Molecules 2023, 28(2), 791; https://doi.org/10.3390/molecules28020791
Submission received: 6 November 2022 / Revised: 9 December 2022 / Accepted: 14 December 2022 / Published: 12 January 2023
(This article belongs to the Section Chemical Biology)

Abstract

:
The purpose of this study was to investigate differences in the pharmacodynamic, pharmacokinetic, and kidney distribution between Ligustri Lucidi Fructus (LLF) and wine-steamed Ligustri Lucidi Fructus (WLL) extracts in diabetic nephropathy (DN) rats. The DN rats were induced by high-fat-sugar diet (HFSD)/streptozotocin (STZ) regimen. For pharmacodynamics, the DN rats were treated with LLF and WLL extracts to assess the anti-diabetic nephropathy effects. For pharmacokinetics and kidney distribution, the concentrations of drugs (hydroxytyrosol, salidroside, nuezhenidic acid, oleoside-11-methyl ester, specnuezhenide, 1‴-O-β-d-glucosylformoside, G13, and oleonuezhenide) were determined. Regarding the pharmacodynamics, LLF and WLL extracts decreased the levels of blood glucose, serum creatinine (SCr), blood urea nitrogen (BUN), and 24-h urinary protein (24-h Upro) in DN rats. Furthermore, LLF and WLL extracts increased the level of high-density lipoprotein cholesterol (HDL-C); decreased the levels of total cholesterol (TC), triglycerides (TG), low-density lipoprotein cholesterol (LDL-C); and reduced levels of pro-inflammatory cytokines (IL-1β, TNF-α, and IL-6) in DN rats. The anti-diabetic nephropathy effect of the WLL extract was better than that of the LLF extract. Regarding the pharmacokinetic and kidney tissue distribution, there were obvious differences in the eight ingredients between LLF and WLL extracts in DN rats. LLF and WLL extracts had protective effects on DN rats, while the WLL extract was better than the LLF extract regarding anti-diabetic nephropathy effects. The pharmacokinetic parameters and kidney distribution showed that wine-steaming could affect the absorption and distribution of the eight ingredients. The results provided a reasonable basis for the study of the clinical application and processing mechanism of LLF.

Graphical Abstract

1. Introduction

Diabetic nephropathy (DN), the main cause of chronic kidney disease and end-stage kidney disease, is a microvascular complication caused by diabetes with a prevalence of 30–40% [1,2]. Traditional Chinese Medicine (TCM) contains a variety of effective components, which can produce comprehensive therapeutic effects through multiple channels and multiple targets, and has obvious advantages and characteristics in the prevention and treatment of chronic metabolic diseases. Moreover, TCM has shown a good effect in the treatment of DN [3,4,5].
Ligustri Lucidi Fructus (LLF) is the dried ripe fruit of Ligubtrum lucidum W.T. Aiton [Oleaceae]; it is often used to nourish the liver and kidney, improve eyesight, and blacken hair in clinical practice [6]. Among the clinical prescriptions, LLF is a core drug for the treatment of DN [7]. In the treatment of DN, LLF is often mixed with other TCMs, which can improve the therapeutic effect of TCMs [8,9]. Several pharmacological studies have shown that LLF has anti-inflammatory, antioxidant, antitumor, hepatoprotective, and immune-regulative effects [10,11,12,13,14]. In addition, research has suggested that LLF can also reduce hypercholesterolemia [15]. In terms of the chemical composition, LLF includes phenylethanols, iridoids, triterpenoids, flavonoids, etc [16], of which phenylethanols and iridoids are the main bioactive components. Phenylethanoid components (including salidroside, tyrosinol, hydroxyltyrosinol, acteoside, and echinacoside) have anti-inflammatory, anti-cancer, hypoglycemic, and lipid effects [17,18,19,20]. The iridoid glycosides, which mainly include specnuezhenide, ligustroside G13 (G13), oleonuezhenide, nuezhenidic acid, neonuezhenide, 1‴-O-β-d-glucosylformoside, and oleuropein, were reported for have the effect of lowering blood lipids, anti-oxidation action, and immuno-enhancing activity [21,22,23].
Most TCMs are used clinically after processing to reduce toxicity or enhance the curative effect. According to the Chinese Pharmacopoeia, the processing method of LLF is to soak in rice wine [
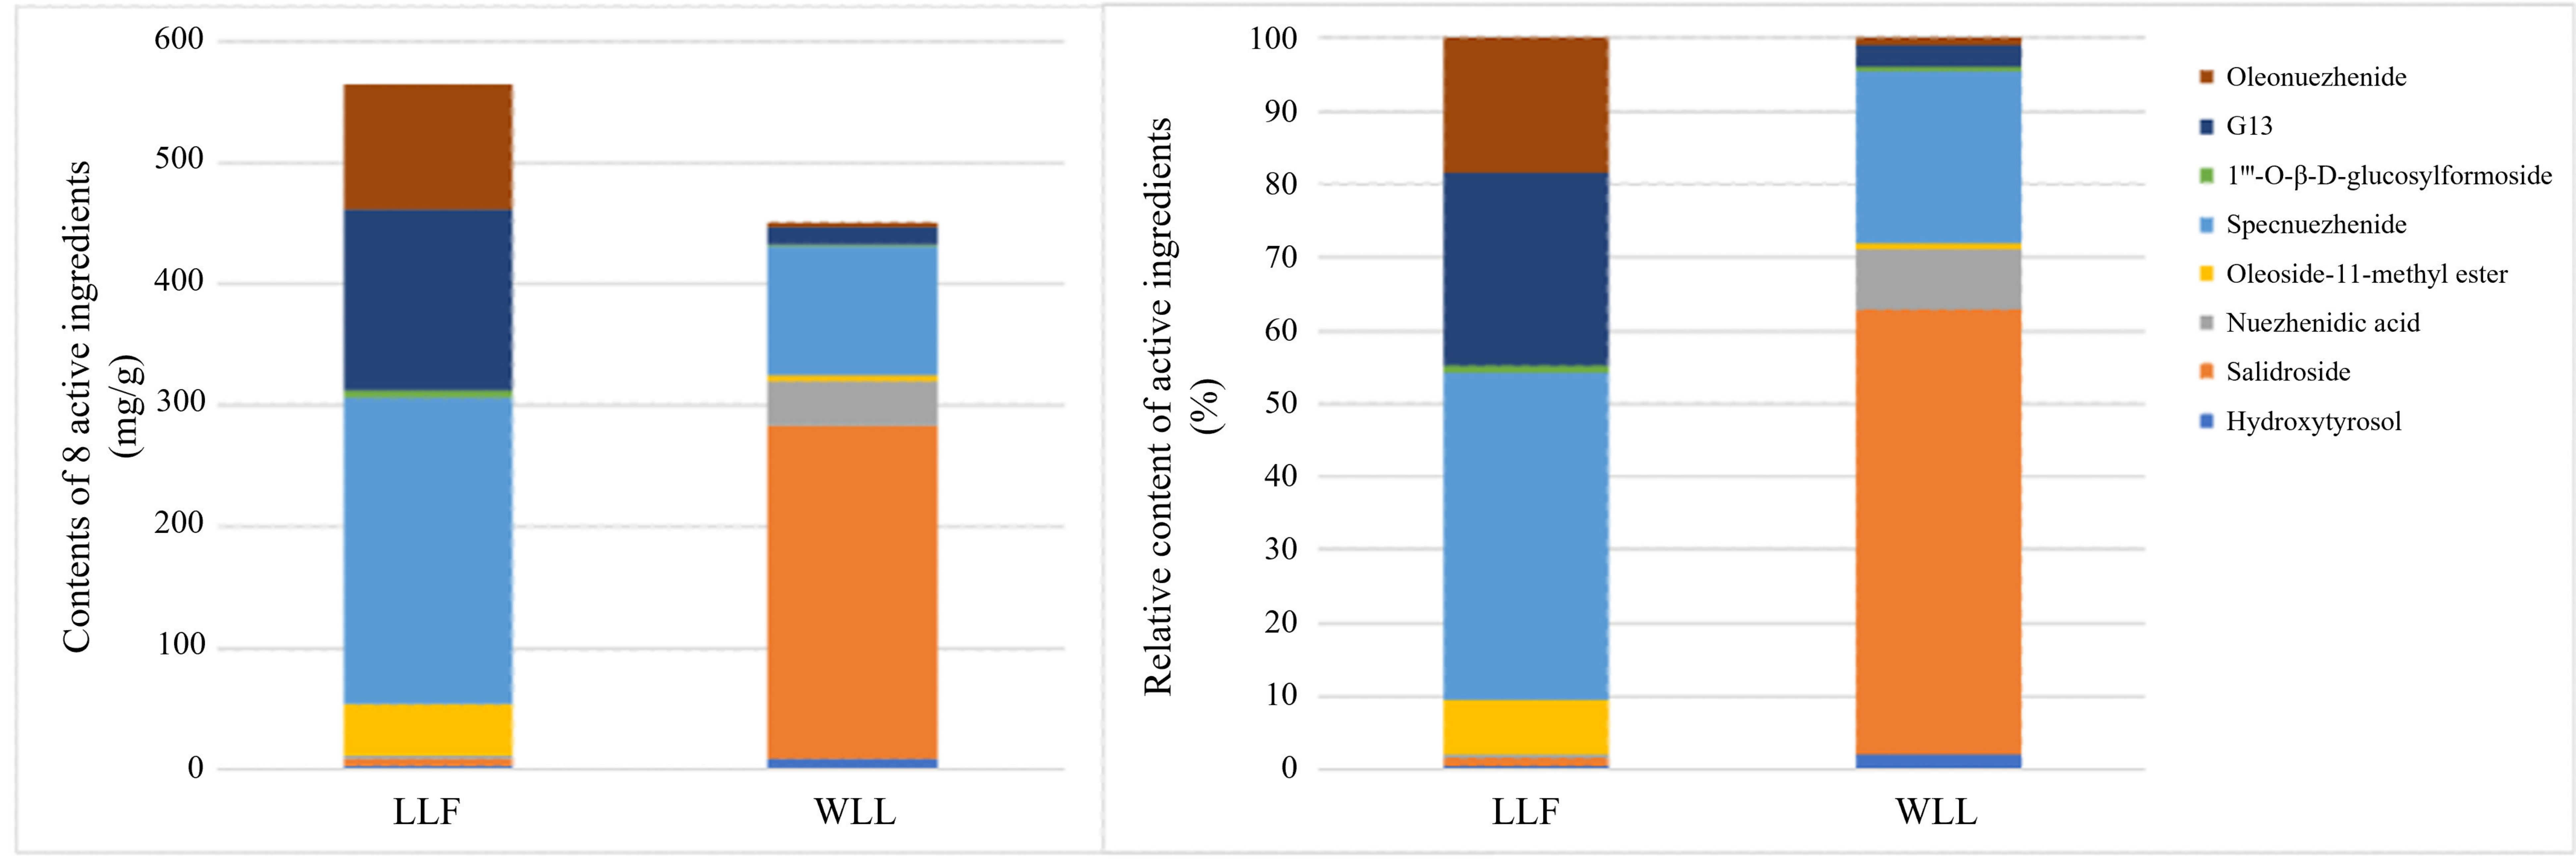
6]. According to the TCM theory, LLF can strengthen the function of nourishing the liver and kidney after wine-steaming; thus, wine-steamed Ligustri Lucidi Fructus (WLL) is usually used in the clinic. The results showed that the contents of specnuezhenide, G13, oleonuezhenide, neonuezhenide, oleuropein, and nuezhenoside decreased after wine-steaming, while the content of salidroside, tyrosol, and hydroxytyrosol increased [24,25]. According to the pharmacology research, LLF steamed with wine can enhance the protective effects on the oxidative stress damage to the testis of rats with kidney-yin deficiency [26]. It has been reported that the protective effect of WLL on liver injury induced by carbon tetrachloride (CCl4) in mice was stronger than LLF [27]. WLL could improve oxidative stress, inhibit the release of inflammatory factors, and regulate endocrine disorders, which can improve and regulate liver and kidney yin deficiency syndrome caused by anger in rats [28]. The studies have indicated that LLF could effectively recover metabolic disorder of blood glucose and blood lipids in DN rats and has excellent prevention and curing effects for DN [29]. However, up to now, the differences in the pharmacodynamics in DN between LLF and WLL extracts have not been researched.
Several studies have investigated the pharmacokinetics and distribution of active components of LLF in rats [30,31,32,33]. The pharmacokinetic properties of LLF indicated that LLF compounds can be better absorbed by the blood and maintained for a long period of time [30]. Additionally, the UPLC-MS method was used to study the pharmacokinetics of salidroside in control and ovariectomized rats; the results demonstrated that the t1/2, MRT0–∞, and apparent volume of distribution for salidroside increased in ovariectomized rats compared with control rats [31]. Recently, our research team established a UPLC-MS/MS method, which revealed differences in the pharmacokinetic characteristics of nine active components in LLF and WLL in the plasma of normal rats [32]. Zhang et al. studied the distribution of seven active compounds of LLF before and after wine-steaming in the main organs and tissues of rats. The results showed that wine-steaming has an improved effect on the tissue distribution of the active components of LLF in rats [33]. However, a comparison of the pharmacokinetics and distribution of the main active components among raw and wine-processed products of LLF in diseased rats (DN rats) have not been reported.
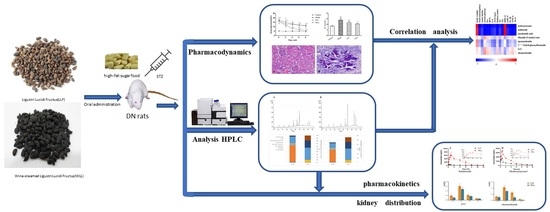
In this study, a rat model of DN induced by a high-fat-sugar diet (HFSD)/streptozotocin (STZ) was established. Using this animal model, the differences in the protective effects of LLF and WLL on the kidneys of DN rats were tested. Subsequently, the UPLC-MS/MS method was used to determine the eight components in the plasma and kidney of the DN rats. The differences in the pharmacokinetic properties of LLF and WLL in the plasma and the distribution in the kidney were compared in DN rats. This study will provide a basis for clarifying the mechanism of WLL and further study of the clinical efficacy.

2. Results

2.1. HPLC Method Validation

The HPLC method was validated in terms of calibration curve, precision, stability, repetition, and recovery. This method was selective with no obvious interferences. The calibration curves showed good linearity; the typical equations of the calibration curves and linearity ranges for the eight analytes containing hydroxytyrosol, salidroside, nuezhenidic acid, oleoside-11-methylester, specnuezhenide, 1‴-O-β-d-glucosylformoside, G13, and oleonuezhenide are shown in Table 1. The results showed that there was excellent correlation between the ratio of the peak area and concentration for each component within the linearity ranges. The precision of the eight standard solutions within was lower than 3% RSD. The RSD of the recovery was between 0.41 and 1.44%, the RSD of the repetition test of hydroxytyrosol, salidroside, nuezhenidic acid, oleoside-11-methylester, specnuezhenide, 1‴-O-β-d-glucosylformoside, G13, and oleonuezhenide was 2.46%, 1.36%, 1.74%, 1.73%, 1.65%, 1.28%, 1.79%, and 2.08%, respectively, and RSD of the stability test was 2.46%, 1.14%, 1.28%, 1.68%, 1.94%, 1.85%, 2.38%, and 1.15%, respectively. The eight analytes were stable during the whole experiment. The results showed that this method can be used in the determinations of LLF and WLL.

2.2. Detection of Active Ingredients in LLF and WLL Extracts by HPLC

As shown in Figure 1 and Figure 2, and in Table 2, the analytical results showed the contents of hydroxytyrosol, salidroside, nuezhenidic acid, oleoside-11-methylester, specnuezhenide, 1‴-O-β-d-glucosylformoside, G13, and oleonuezhenide in LLF and WLL extracts.

2.3. Pharmacodynamic Studies in DN Rats

2.3.1. The Effects of LLF and WLL Extracts on Body Weight, Food Consumption, and Water Intake in DN Rats

Compared with the Control group, the body weight decreased (p < 0.01), and food consumption and water intake increased in the Model group (p < 0.01), which also indicated that the DN model was made successfully. Compared with the Model group, body weight increased in the LLF, WLL, and MET groups, with significant differences in the WLL and MET groups (p < 0.01). Food consumption and water intake in the LLF, WLL, and MET groups decreased significantly (p < 0.01 or p < 0.05) when compared to the Model group, and degree of decline in the WLL group was more than in the LLF group. The results are shown in Table 3.

2.3.2. The Effects of LLF and WLL Extracts on Blood Glucose Levels in DN Rats

Compared with the Control group, the blood glucose of the Model group increased significantly (p < 0.01), which also indicated that the DN model was made successfully. Compared with the Model group, the level of blood glucose decreased in the WLL, LLF, and MET groups. The observed effect was comparable to the results obtained from the MET group. The WLL group had better hypoglycemic ability than the LLF group. The results are shown in Figure 3.

2.3.3. The Effects of LLF and WLL Extracts on SCr, BUN, 24 h urine volume, 24 h Upro, and Kidney Index in DN Rats

Figure 4A–E showed that the SCr, BUN, 24-h urine volume, 24-h Upro levels, and kidney index were significantly higher in the Model group than those in the Control group (p < 0.01). This result indicated that the DN model was established successfully. Compared with the Model group, the BUN, 24-h urine volume, 24-h Upro, and kidney index levels decreased significantly in LLF group (p < 0.05 or p < 0.01), while SCr showed no significant difference. In comparison with the Model group, the SCr, BUN, 24-h urine volume, 24-h Upro, and kidney index levels in the WLL group decreased significantly (p < 0.01), and the degree of decline in WLL group was more than LLF group. These results indicated that WLL and LLF extracts had a protective effect on the kidneys of DN rats, and the protective effect of the WLL extract was more significant.

2.3.4. The Effects of LLF and WLL Extracts on Lipid Profiles in DN Rats

The results from the lipid profiles in the serum sre shown in Figure 5. In comparison with the Control group, the levels of TC, TG, and LDL-C significantly increased, and HDL-C was decreased, in the Model group (p < 0.01). In the LLF and WLL groups, the levels of TG, TC, and LDL-C were lower when compared with the Model group, whereas the level of HDL-C was higher when compared with the Model group. Moreover, the regulation effect of LLF group was inferior to that of WLL group.

2.3.5. The Effects of LLF and WLL Extracts on Inflammatory Cytokines in DN Rats

As shown in Figure 6, the serum concentrations of IL-1β, TNF-α, and IL-6 were significantly higher in the Model group when compared to the Control group (p < 0.01). Whereas treatment with LLF and WLL extracts significantly restored the levels of the IL-1β, TNF-α, and IL-6 in DN rats. Moreover, the WLL group showed a better anti-inflammatory effect than the LLF group regarding the level of IL-1β, TNF-α, and IL-6.

2.3.6. The Effects of LLF and WLL Extracts on Histopathological Changes

Under light microscope observation, the kidney tissue structure of the rats in the Control group was normal and showed no abnormal features (Figure 7A). Rats in the Model group showed obvious kidney damage, such as glomerular atrophy, localized fibrosis, inflammatory cell infiltration, partial degeneration of the renal tubular epithelium, and interstitial congestion (Figure 7B), which also indicated that the DN model was successfully made. The kidney injury of rats in the LLF, WLL, and MET groups recovered to varying degrees (Figure 7C–E). Pathological sections of the kidney showed a small portion of atrophic glomeruli, normal renal tubular epithelium, and interstitial small focal inflammation. This indicated that both the LLF group and the WLL group had restored renal histopathological damage, with the WLL group showing a better effect.

2.4. Correlation Analysis

Pearson correlation analysis was used to explore the potential relationship between eight active ingredients and the physicochemical parameters after oral administration of LLF and WLL extracts in DN rats (Figure 8). The results shown that all the active components were positively associated with body weight and negatively correlated with water intake, 24-h urine volume, 24-h Upro, TC, and LDL-C. Except for oleoside-11-methylester, G13, and oleonuezhenide, all active ingredients were negatively correlated with food consumption, SCr, BUN, kidney index, TG, IL-1β, TNF-α, and IL-6. In addition, active components such as hydroxytyrosol, salidroside, and nuezhenidic acid were negatively correlated with serum glucose, while other active components were positively correlated with serum glucose. Furthermore, some active components (e.g., hydroxytyrosol, salidroside, nuezhenidic acid, and specnuezhenide) also had a positive correlation with HDL-C. Moreover, it can be clearly seen that hydroxytyrosol, salidroside, and nuezhenidic acid were strongly correlated with the physicochemical parameters (R > 0.85 or R < −0.75), indicating that these components have kidney protective effects.

2.5. Plasma Pharmacokinetics in DN Rats

2.5.1. LC-MS/MS Method Validation

The plasma drug determination method has been verified in terms of specificity, calibration curve, sensitivity, accuracy, precision, and stability. This method was selective, has no obvious interference, and has no matrix effect. The calibration curve equations of the eight components are shown in Table 4. The calibration curves showed good linearity and all of the correlation coefficients were higher than 0.9991. The results showed that the ratio of the peak area to the concentration of each compound has a good correlation within the linear range. The RSD expressing the intra-day and the inter-day accuracy of salidroside, hydroxytyrosol, nuezhenidic acid, oleoside-11-methyl ester, 1‴-O-β-d-glucosylformoside, specnuezhenide, G13, and oleonuezhenide in rat plasma at high, middle, and low concentrations were 0.47–10.28% and 0.37–10.08%. The RE expressing the intra-day and the inter-day precision of salidroside, hydroxytyrosol, nuezhenidic acid, oleoside-11-methyl ester, 1‴-O-β-d-glucosylformoside, specnuezhenide, G13, and oleonuezhenide in rat plasma at high, middle, and low concentrations were −3.65–3.52% and −3.39–6.02%.

2.5.2. Plasma Pharmacokinetic Studies in DN Rats

The pharmacokinetic parameters and the mean pharmacokinetic profiles of the eight ingredients of LLF and WLL in DN rats are displayed in Table 5 and Figure 9. Most of the eight ingredients reached the maximum of drug concentration within 1 h after oral administration, indicating that these ingredients exhibited rapid absorption in DN rats. In comparison to LLF, the AUC0–12 h and Cmax values of salidroside (2527.81 ± 489.80 ng/mL·h, 697.01 ± 131.21 ng/mL), hydroxytyrosol (10,902.26 ± 338.71 ng/mL·h, 3462.78 ± 108.62 ng/mL), and nuezhenidic acid (1615.14 ± 53.47 ng/mL·h, 766.20 ± 62.39 ng/mL) were increased significantly (p < 0.05) from the WLL, indicating that the bioavailability of hydroxytyrosol, salidroside, and nuezhenidic acid in WLL was higher than that in LLF. The main reason may be the increase in the content of salidroside, hydroxytyrosol, and nuezhenidic acid after wine-processing.
WLL is the product of LLF after wine-steaming. Wine had the function of promoting blood circulation in the TCM theory [34,35]. After intragastric administration of LLF, the AUC0–12 h and Cmax values were as follows: specnuezhenide (774.79 ± 38.60 ng/mL·h, 698.99 ± 94.38 ng/mL), oleoside-11-methyl ester (2537.42 ± 67.83 ng/mL·h, 744.81 ± 9.29 ng/mL), 1‴-O-β-d-glucosylformoside (901.37 ± 92.32 ng/mL·h, 655.39 ± 42.24 ng/mL), G13 (1025.82 ± 77.41 ng/mL·h, 500.50 ± 20.10 ng/mL), and oleonuezhenide (605.12 ± 26.46 ng/mL·h, 300.54 ± 27.04 ng/mL). After rats were given WLL by gavage, the AUC0–12 h and Cmax values were decreased as follows: specnuezhenide (348.81 ± 7.3 ng/mL·h, 195.09 ± 6.81 ng/mL), oleoside-11-methyl ester (2021.07 ± 99.67 ng/mL·h, 605.62 ± 14.86 ng/mL), 1‴-O-β-d-glucosylformoside (531.78 ± 54.16 ng/mL·h, 384.75 ± 38.68 ng/mL), G13 (881.95 ± 39.80 ng/mL·h, 377.69 ± 16.56 ng /mL), and oleonuezhenide (437.77 ± 9.87 ng/mL·h, 223.92 ± 37.50 ng/mL). The contents of specnuezhenide, 1‴-O-β-d-glucosylformoside, oleoside-11-methyl ester, G13, and oleonuezhenide in LLF were 2.36 times, 2.69 times, 10.88 times, 10.77 times, and 23.74 times higher than those in WLL, respectively. The decreasing trend in their content is inconsistent with the decreasing trend in the AUC0–12h and Cmax. Compared with the decreasing trend in their content, the decreasing trend in the AUC0–12h and Cmax was reduced in WLL, which shows that wine-steaming can promote the bioavailability of specnuezhenide, 1‴-O-β-d-glucosylformoside, oleoside-11-methyl ester, G13, and oleonuezhenide in DN rats.
Based on the above data analysis, it can be shown that wine-steaming can promote the absorption of phenylethanol and other small molecular substances in LLF and promote the absorption of substances to quickly reach the peak blood drug concentration. According to the previous experimental results, specnuezhenide, 1‴-O-β-d-glucosylformoside, G13, and oleonuezhenide can be transformed into salidroside, hydroxytyrosol, and nuezhenidic acid during wine-steaming, which shows that the transformation of LLF components during wine-steaming can lead to the increase in the salidroside, hydroxytyrosol, and nuezhenidic acid content and plasma concentration. The increase of AUC0–12h and Cmax of these three components also indicates that the bioavailability increased after wine-steaming, and that macromolecular substances are more easily absorbed after conversion to small molecular substances.

2.6. Tissue Distribution in DN Rats

2.6.1. Method Validation

The method of determination of kidney drug distribution was validated in terms of specificity, calibration curve, sensitivity, accuracy, precision, and stability. The calibration curve equations and linear ranges of the eight analytes are shown in the Table 6. The standard curve showed a good linear relationship. The RSD expressing intra-day and the inter-day accuracy of salidroside, hydroxytyrosol, nuezhenidic acid, oleoside-11-methyl ester, 1‴-O-β-d-glucosylformoside, specnuezhenide, G13, and oleonuezhenide in rat plasma at high, middle, and low concentrations were 0.72–12.79% and 1.19–12.23%. The RE expressing the intra-day and the inter-day precision of salidroside, hydroxytyrosol, nuezhenidic acid, oleoside-11-methyl ester, 1‴-O-β-d-glucosylformoside, specnuezhenide, G13, and oleonuezhenide in rat plasma at high, middle, and low concentrations were −10.04–13.34% and −11.11–11.68%. The above results show that this method was selective, without obvious interference, and without matrix effect, which can be used for the determination of LLF and WLL in rat kidney tissue.

2.6.2. Tissue Distribution

The mean content of the eight components in the kidney tissue are illustrated in Figure 10. In addition, the content of the eight components in the kidney tissue were calculated and presented in Table 7. After the extracts of LLF and WLL were administered to rats by intragastric administration, the eight components were rapidly distributed in rats. A higher concentration of the drug could be detected in vivo 30 min after administration, and the concentration of the components in kidney decreased significantly 4 h after administration. After wine-steaming, the concentrations of salidroside, hydroxytyrosol, and nuezhenidic acid in the kidney tissues of DN rats increased, while oleoside-11-methyl ester, 1‴-O-β-d-glucosylformoside, specnuezhenide, G13, and oleonuezhenide showed a decreasing trend in concentration in the rat kidney tissue.

3. Discussion

DN is a chronic kidney disease, which is mainly characterized by renal capillary rupture, and glomerular capillary and renal tubular interstitial damage [36]. The combination of a HFSD diet combined with STZ injection can induce insulin resistance and significantly increase the levels of blood glucose, which in turn triggers DN [37,38]. This model is very similar to type 2 diabetes in human [39]. Here, insulin resistance was induced by administration of HFSD in rats for 4 weeks, followed by STZ peritoneal injection to establish a successful DN rat model, which is similar to that reported in a previous study. High blood glucose can cause damage to some important tissues and organs in the body [40], producing loss of renal function associated with the elevation of TC, TG, LDL-C, Scr, BUN, and microalbumin levels [41,
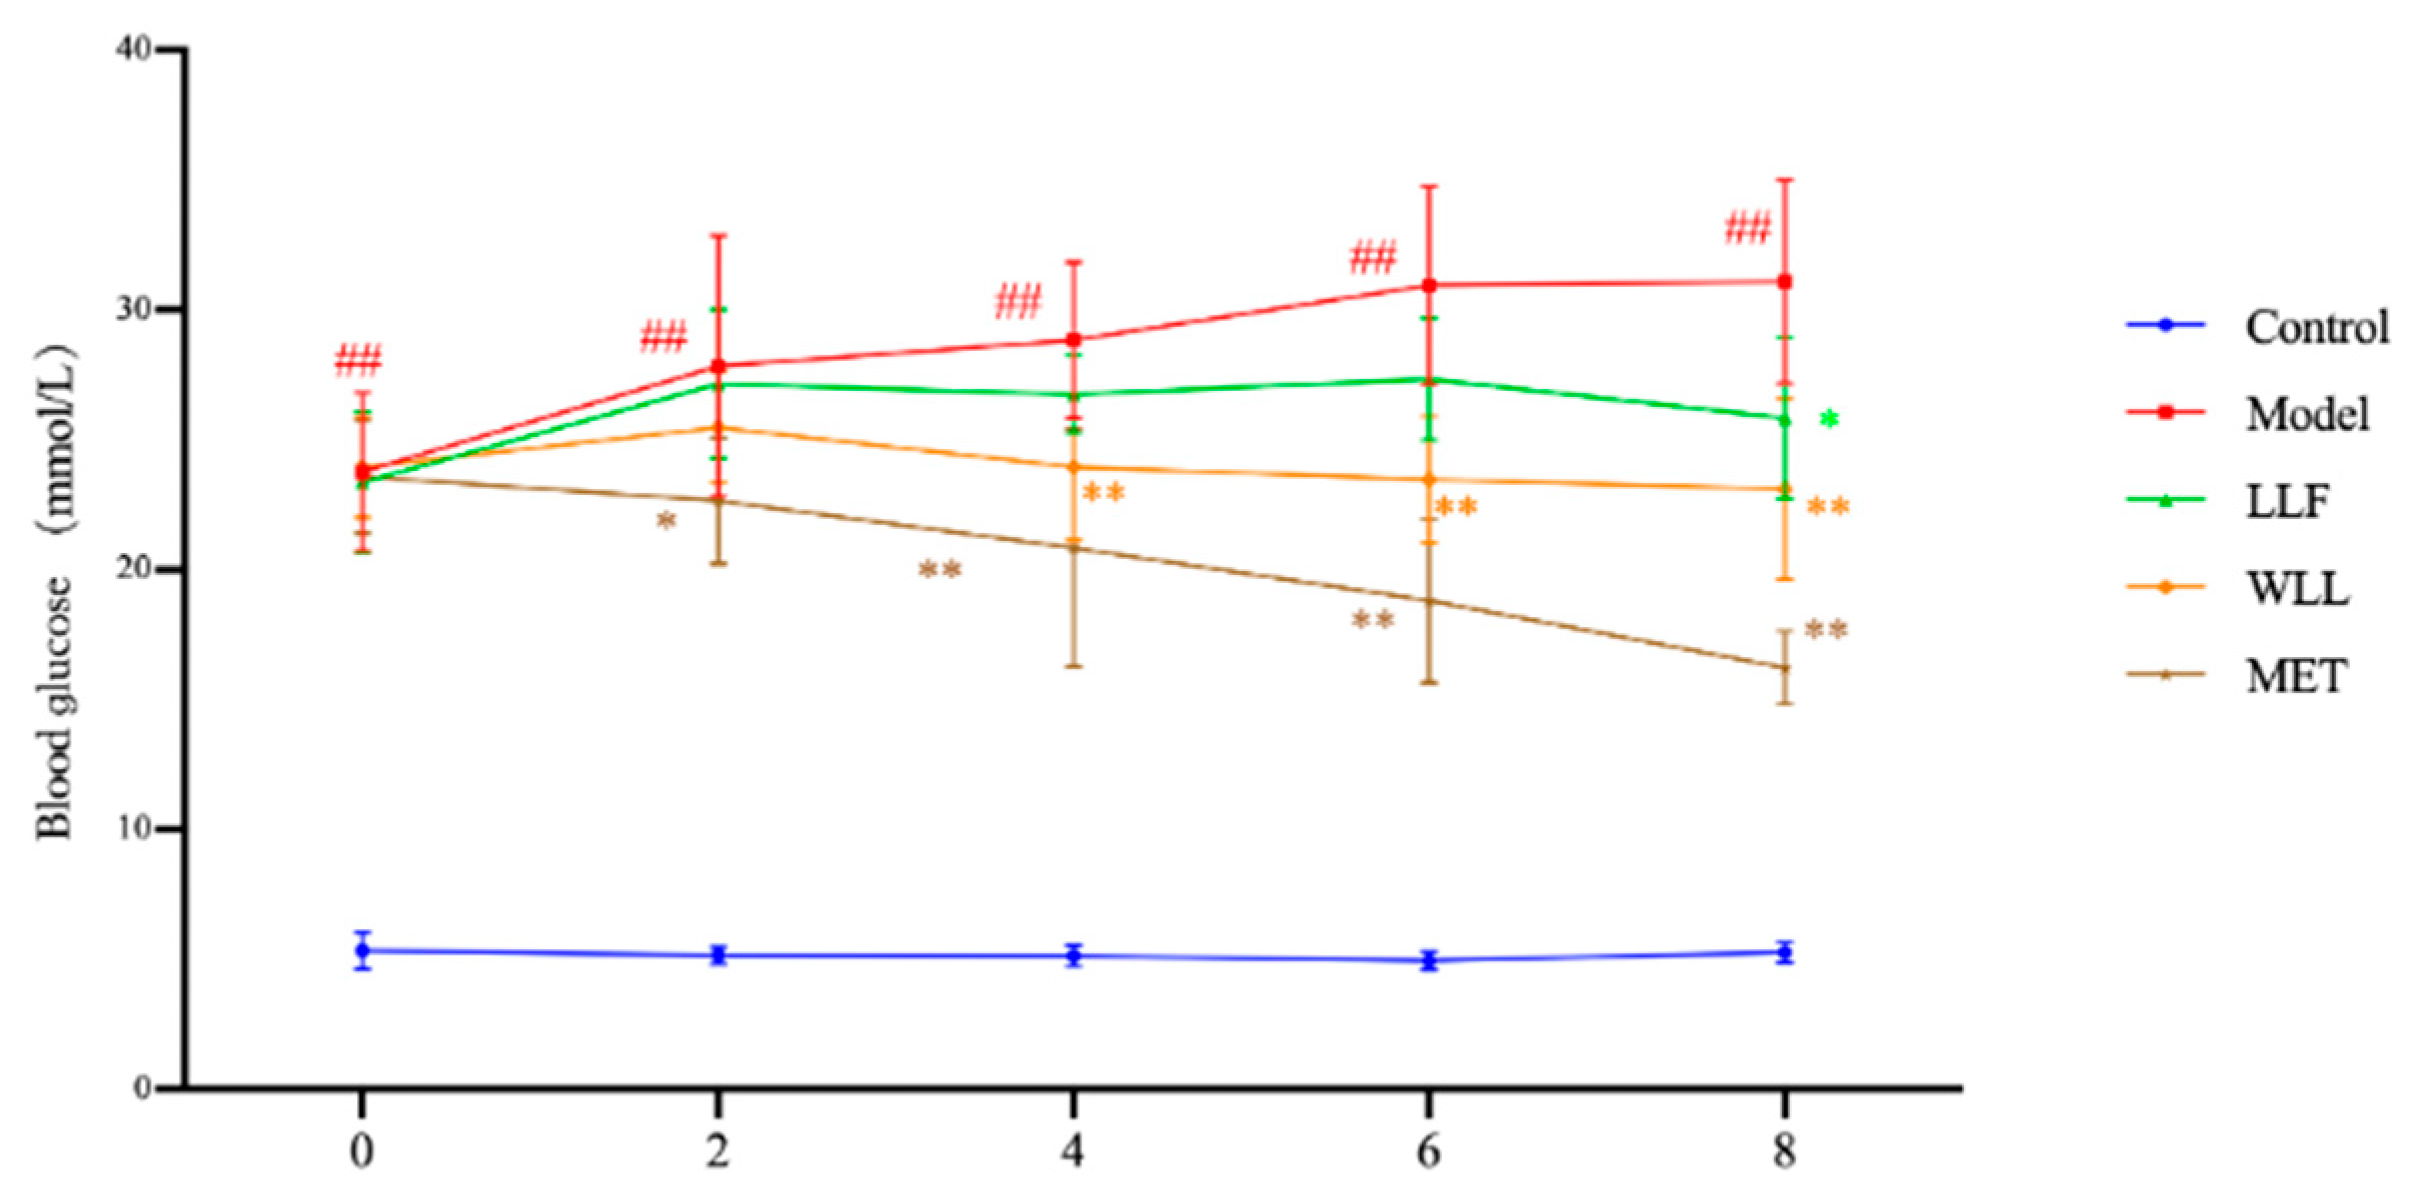
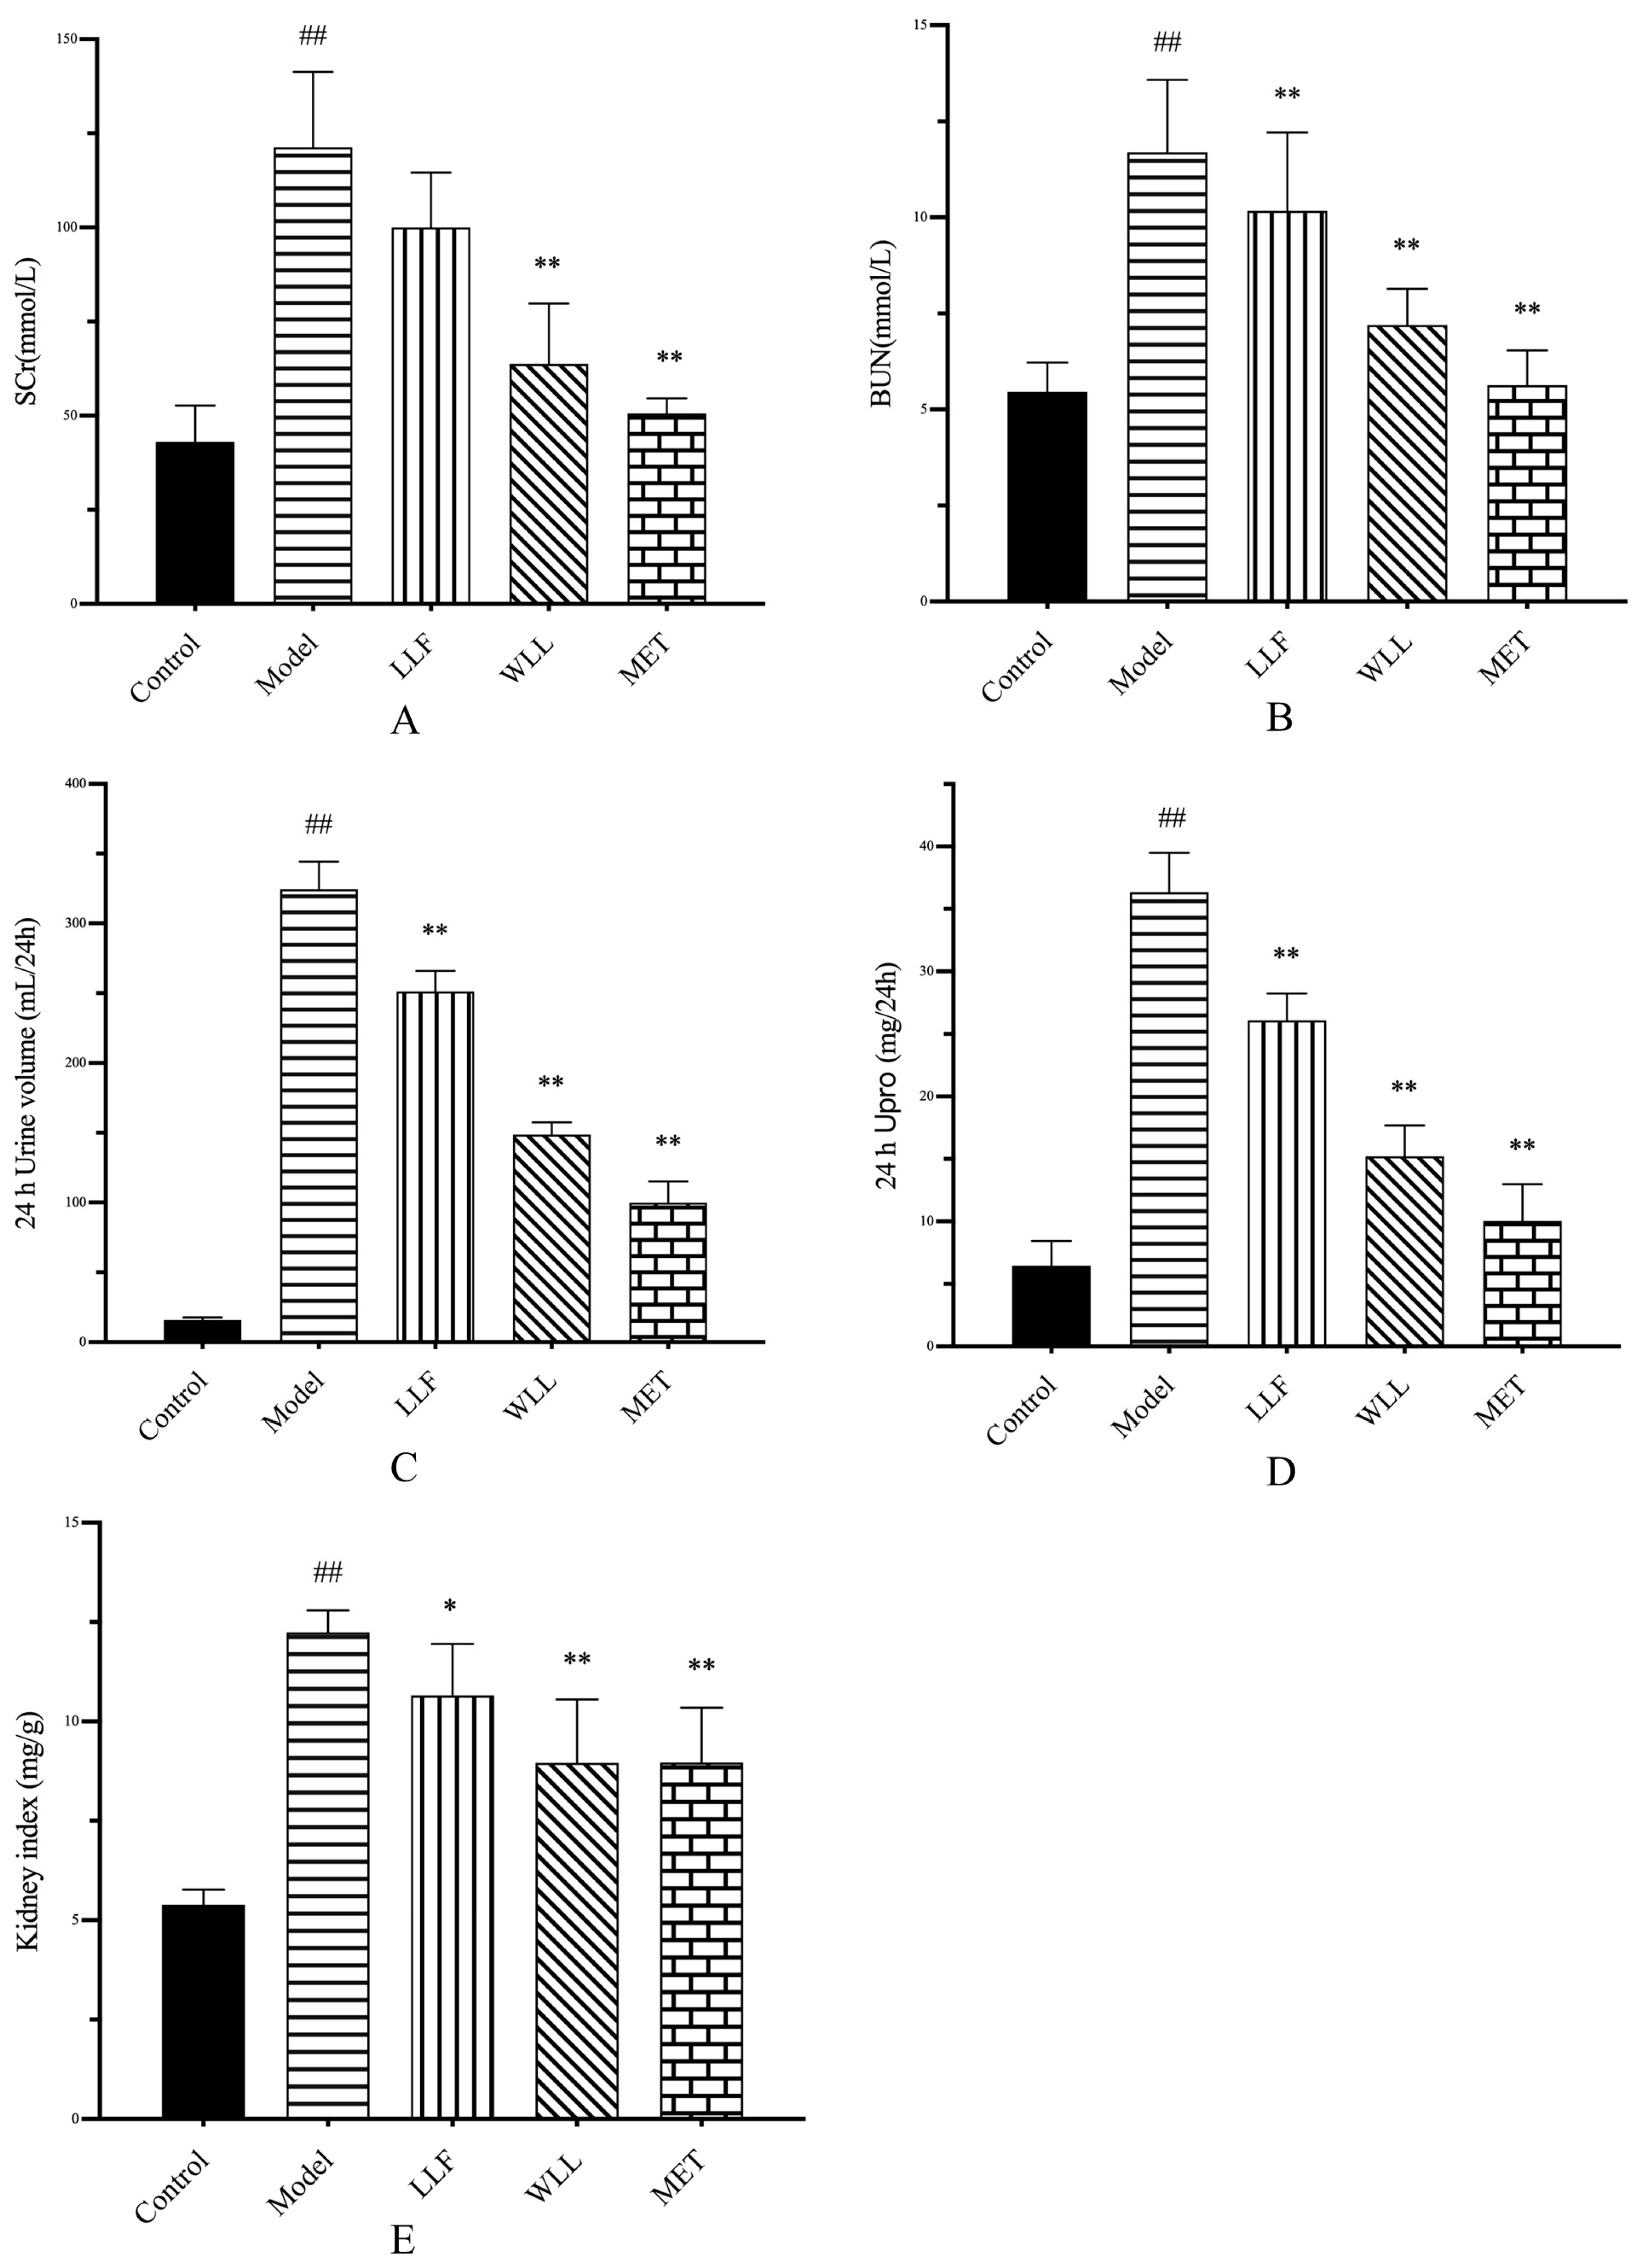
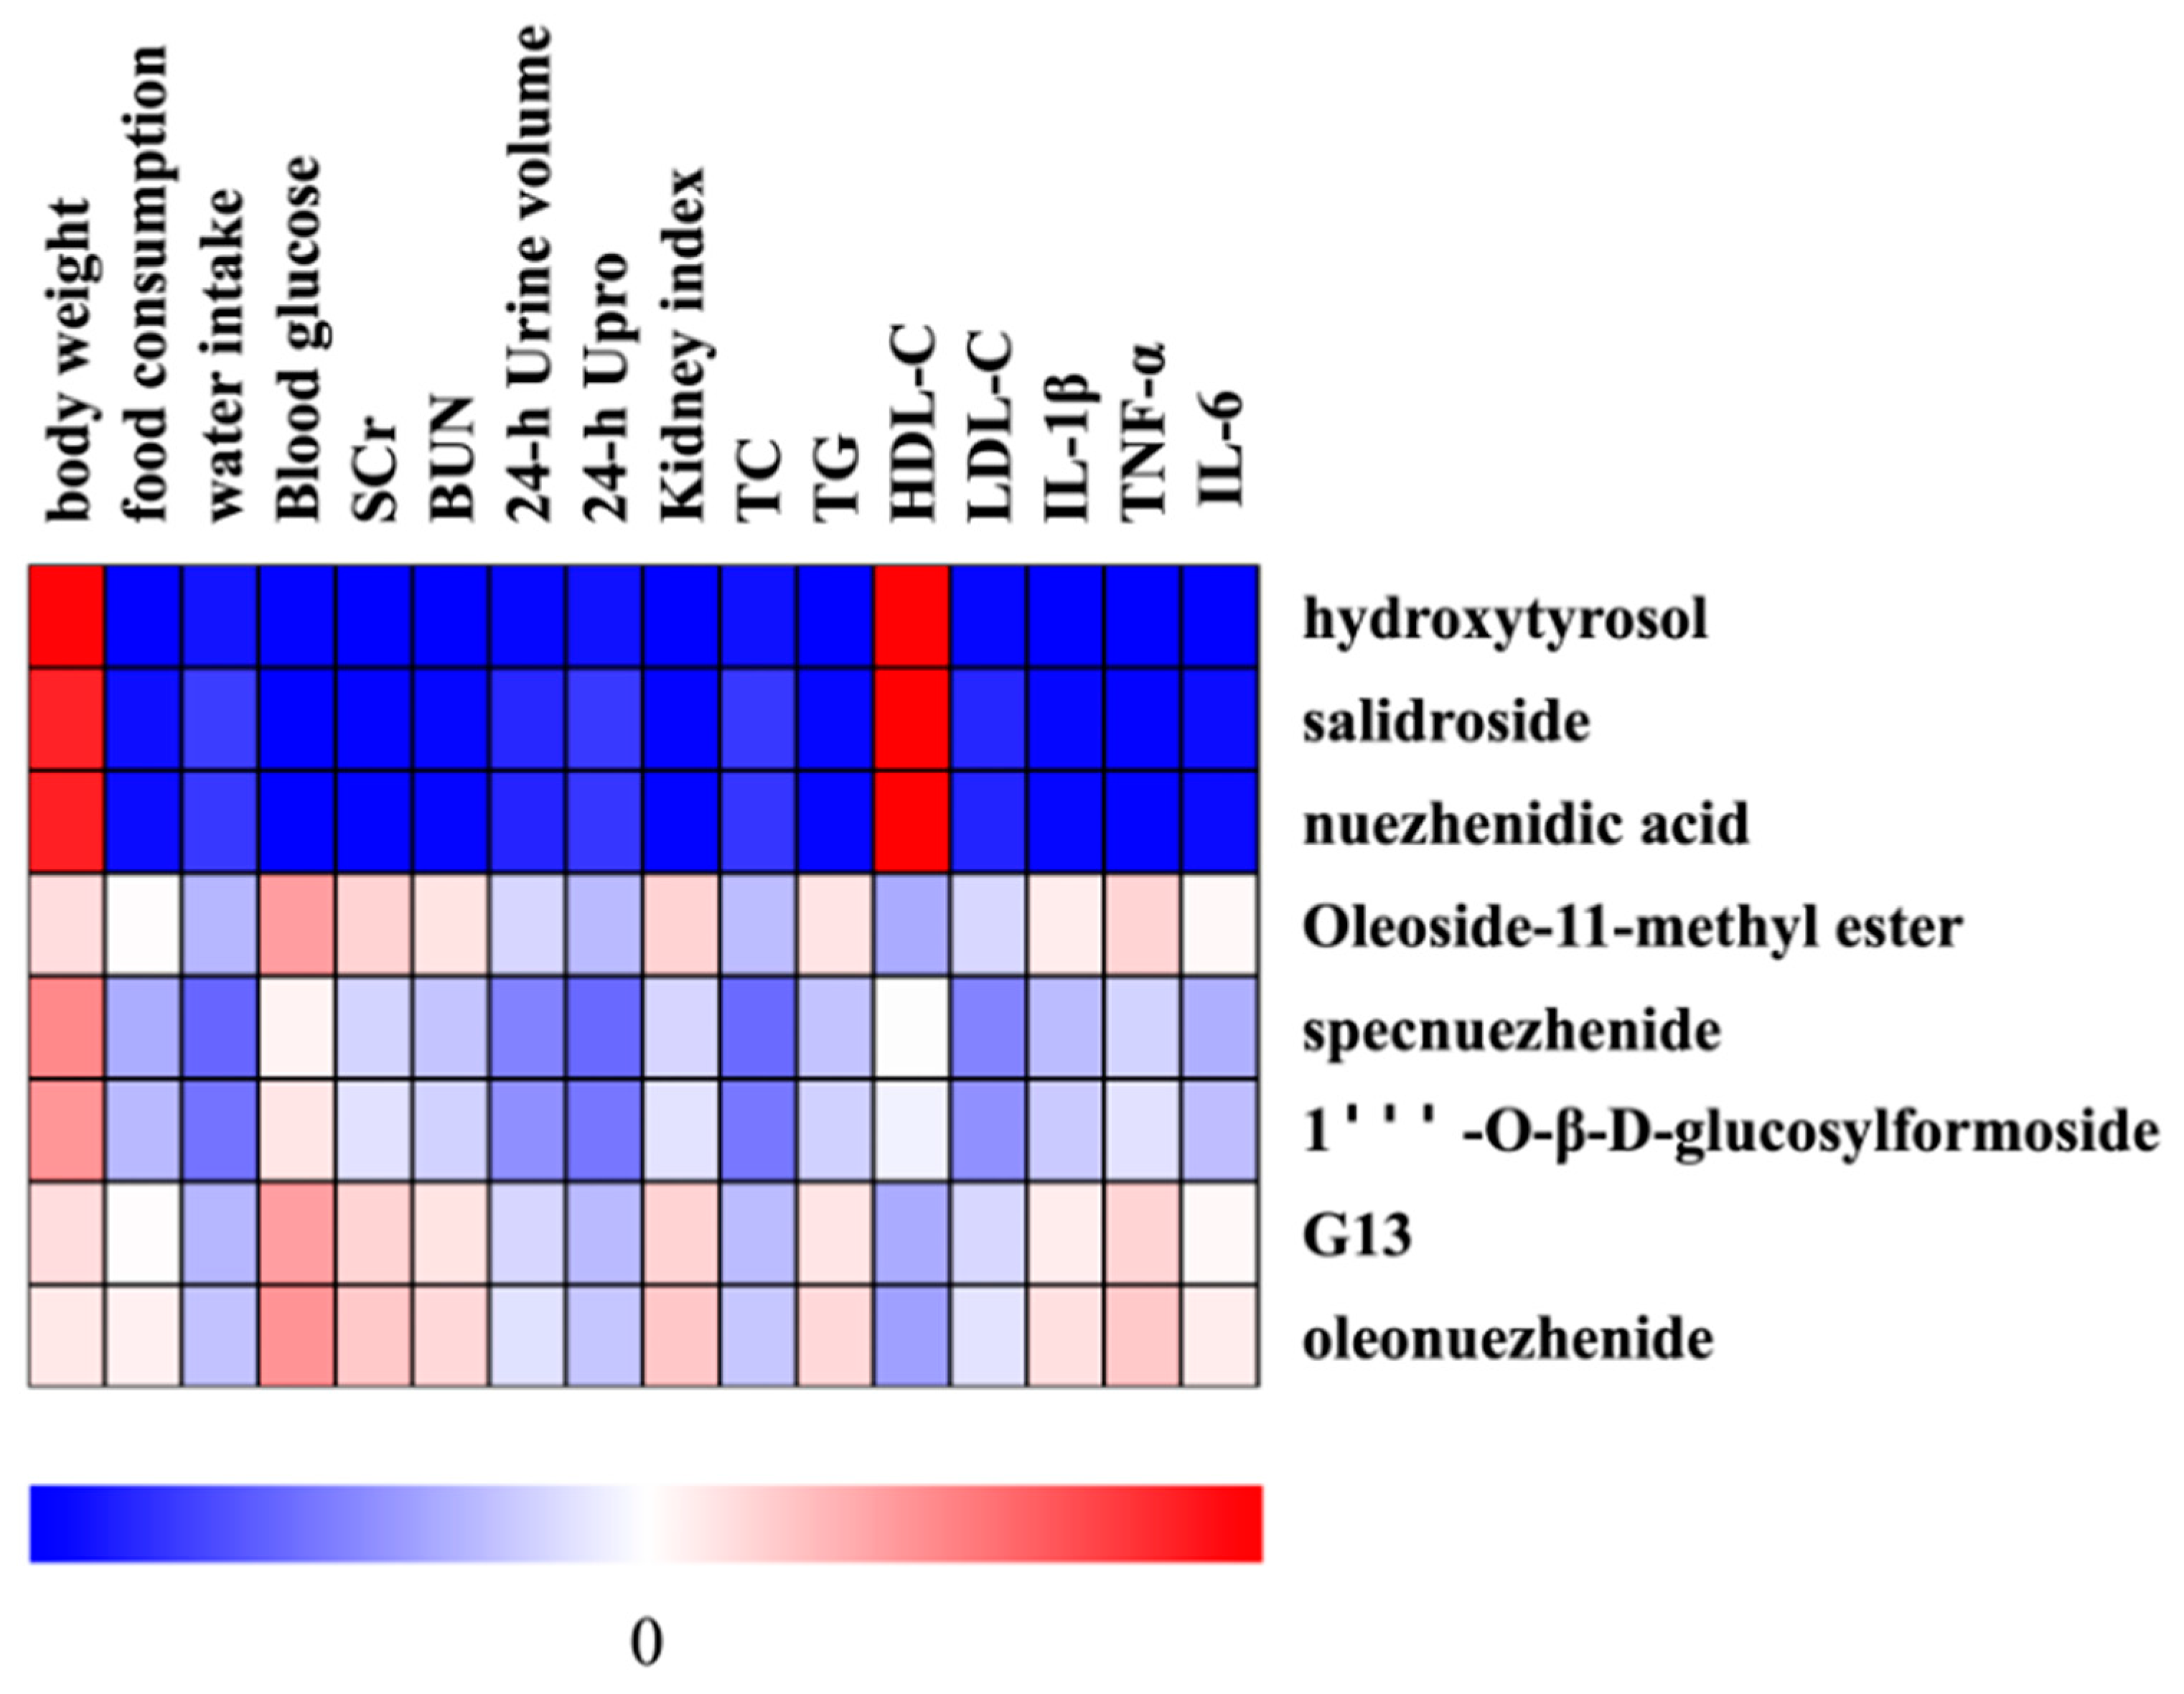
42]. We observed a significant increase in blood glucose levels in the DN rats. However, 8 weeks of treatment with LLF and WLL extracts gradually reduced the level of blood glucose, with the WLL extract showing a better effect than the LLF extract. In addition, DN rats experienced an increase in water intake and food consumption, and a decrease in body weight due to prolonged hyperglycemia. Surprisingly, treatment with LLF and WLL extracts produced body weight gain, and water intake and food consumption decreased. Furthermore, the kidney index of DN rats has increased due to kidney hypertrophy. Significant changes in parameters related to kidney structure and function were observed after administration, revealing the protective effect of WLL and LLF extracts on kidney damage caused by DN. All structural and functional abnormalities were restored following administration of LLF and WLL extracts; the effect of the WLL extract was better than that of the LLF extract.
SCr and BUN are considered as clinical indicators of DN [43]. High levels of SCr and BUN were found in DN rats, while LLF and WLL extracts reduced these levels. Thus, LLF and WLL extracts exhibited a dramatic protective effect against DN; the effect of the WLL extract was better than that of the LLF extract. Tubular and glomerular injury are often accompanied by high levels of urinary protein [44]. The 24-h Upro of DN rats increased significantly. After treatment with LLF and WLL extracts, the urine excretion of these proteins was significantly reduced; the effect of the WLL extract was better than that of the LLF extract.
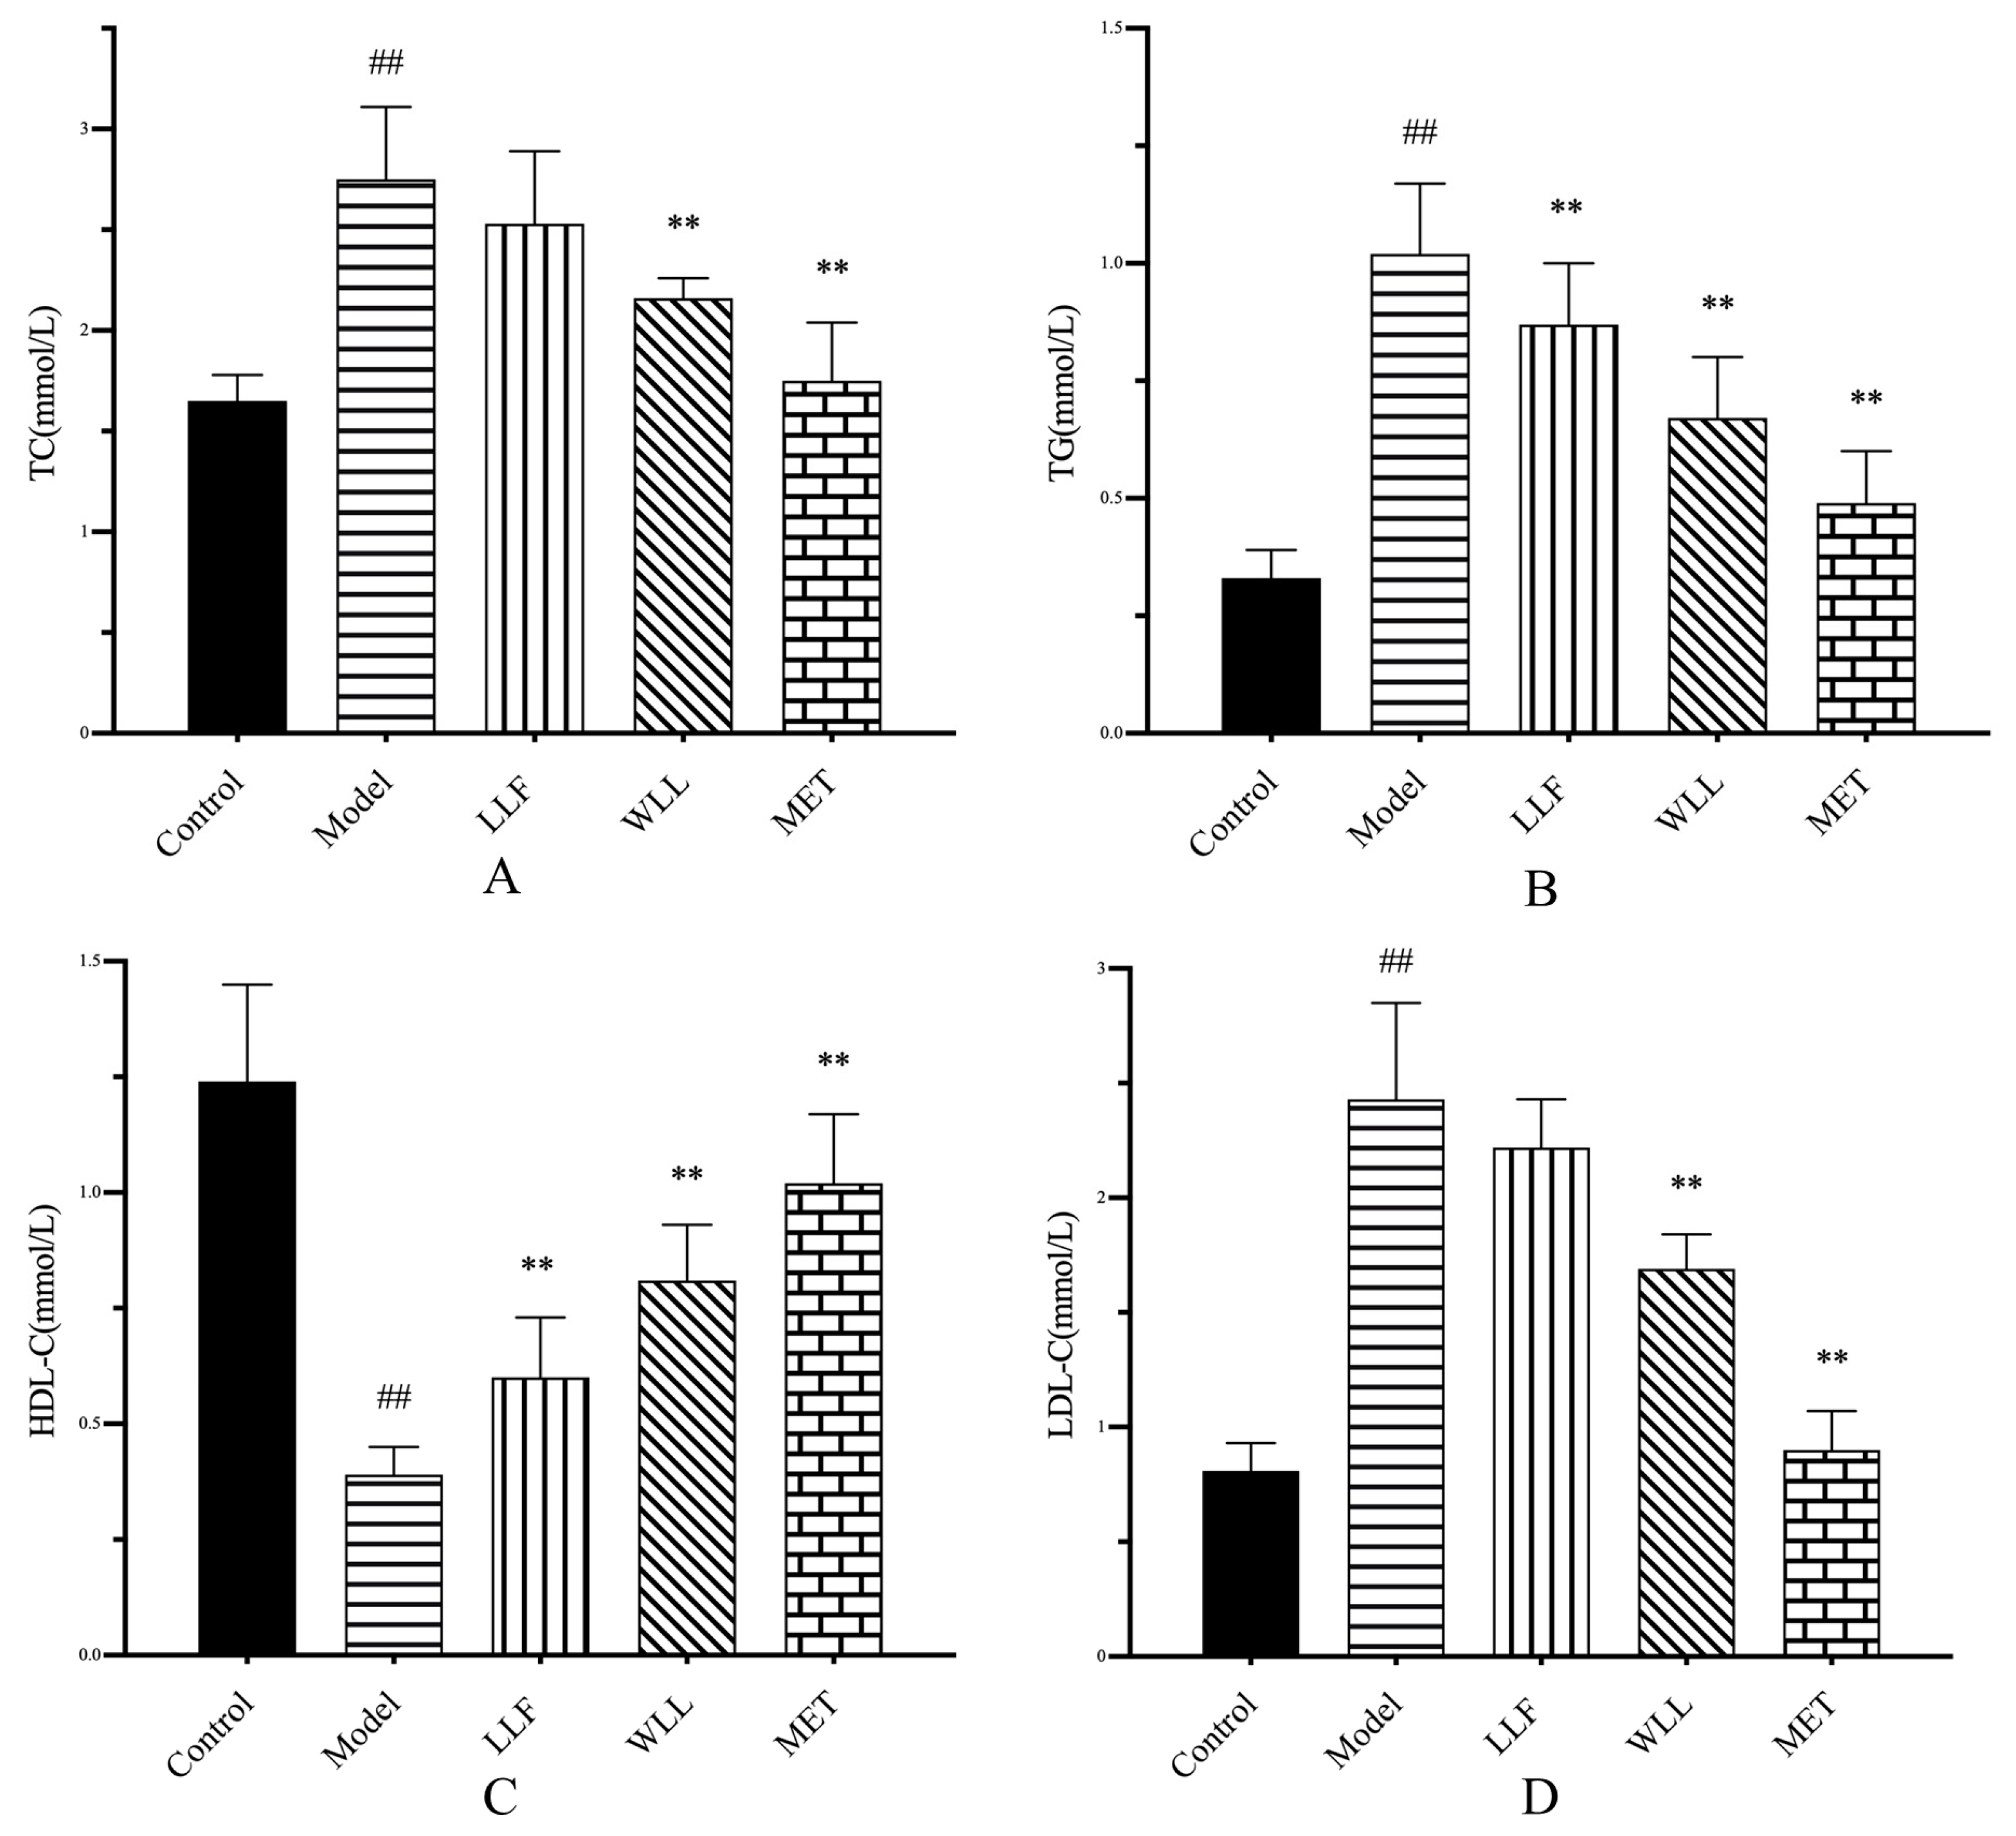
Hyperlipidemia is an important cause of kidney damage. Kidney disease is closely related to high levels of TG, TC, and LDL-C, and a low level of HDL-C [41]. In this study, we found that LLF and WLL extracts could restore high LDL-C and low TG, TC, and HDL-C levels to different degrees, indicating that the protective role against DN of WLL was better than that of LLF.
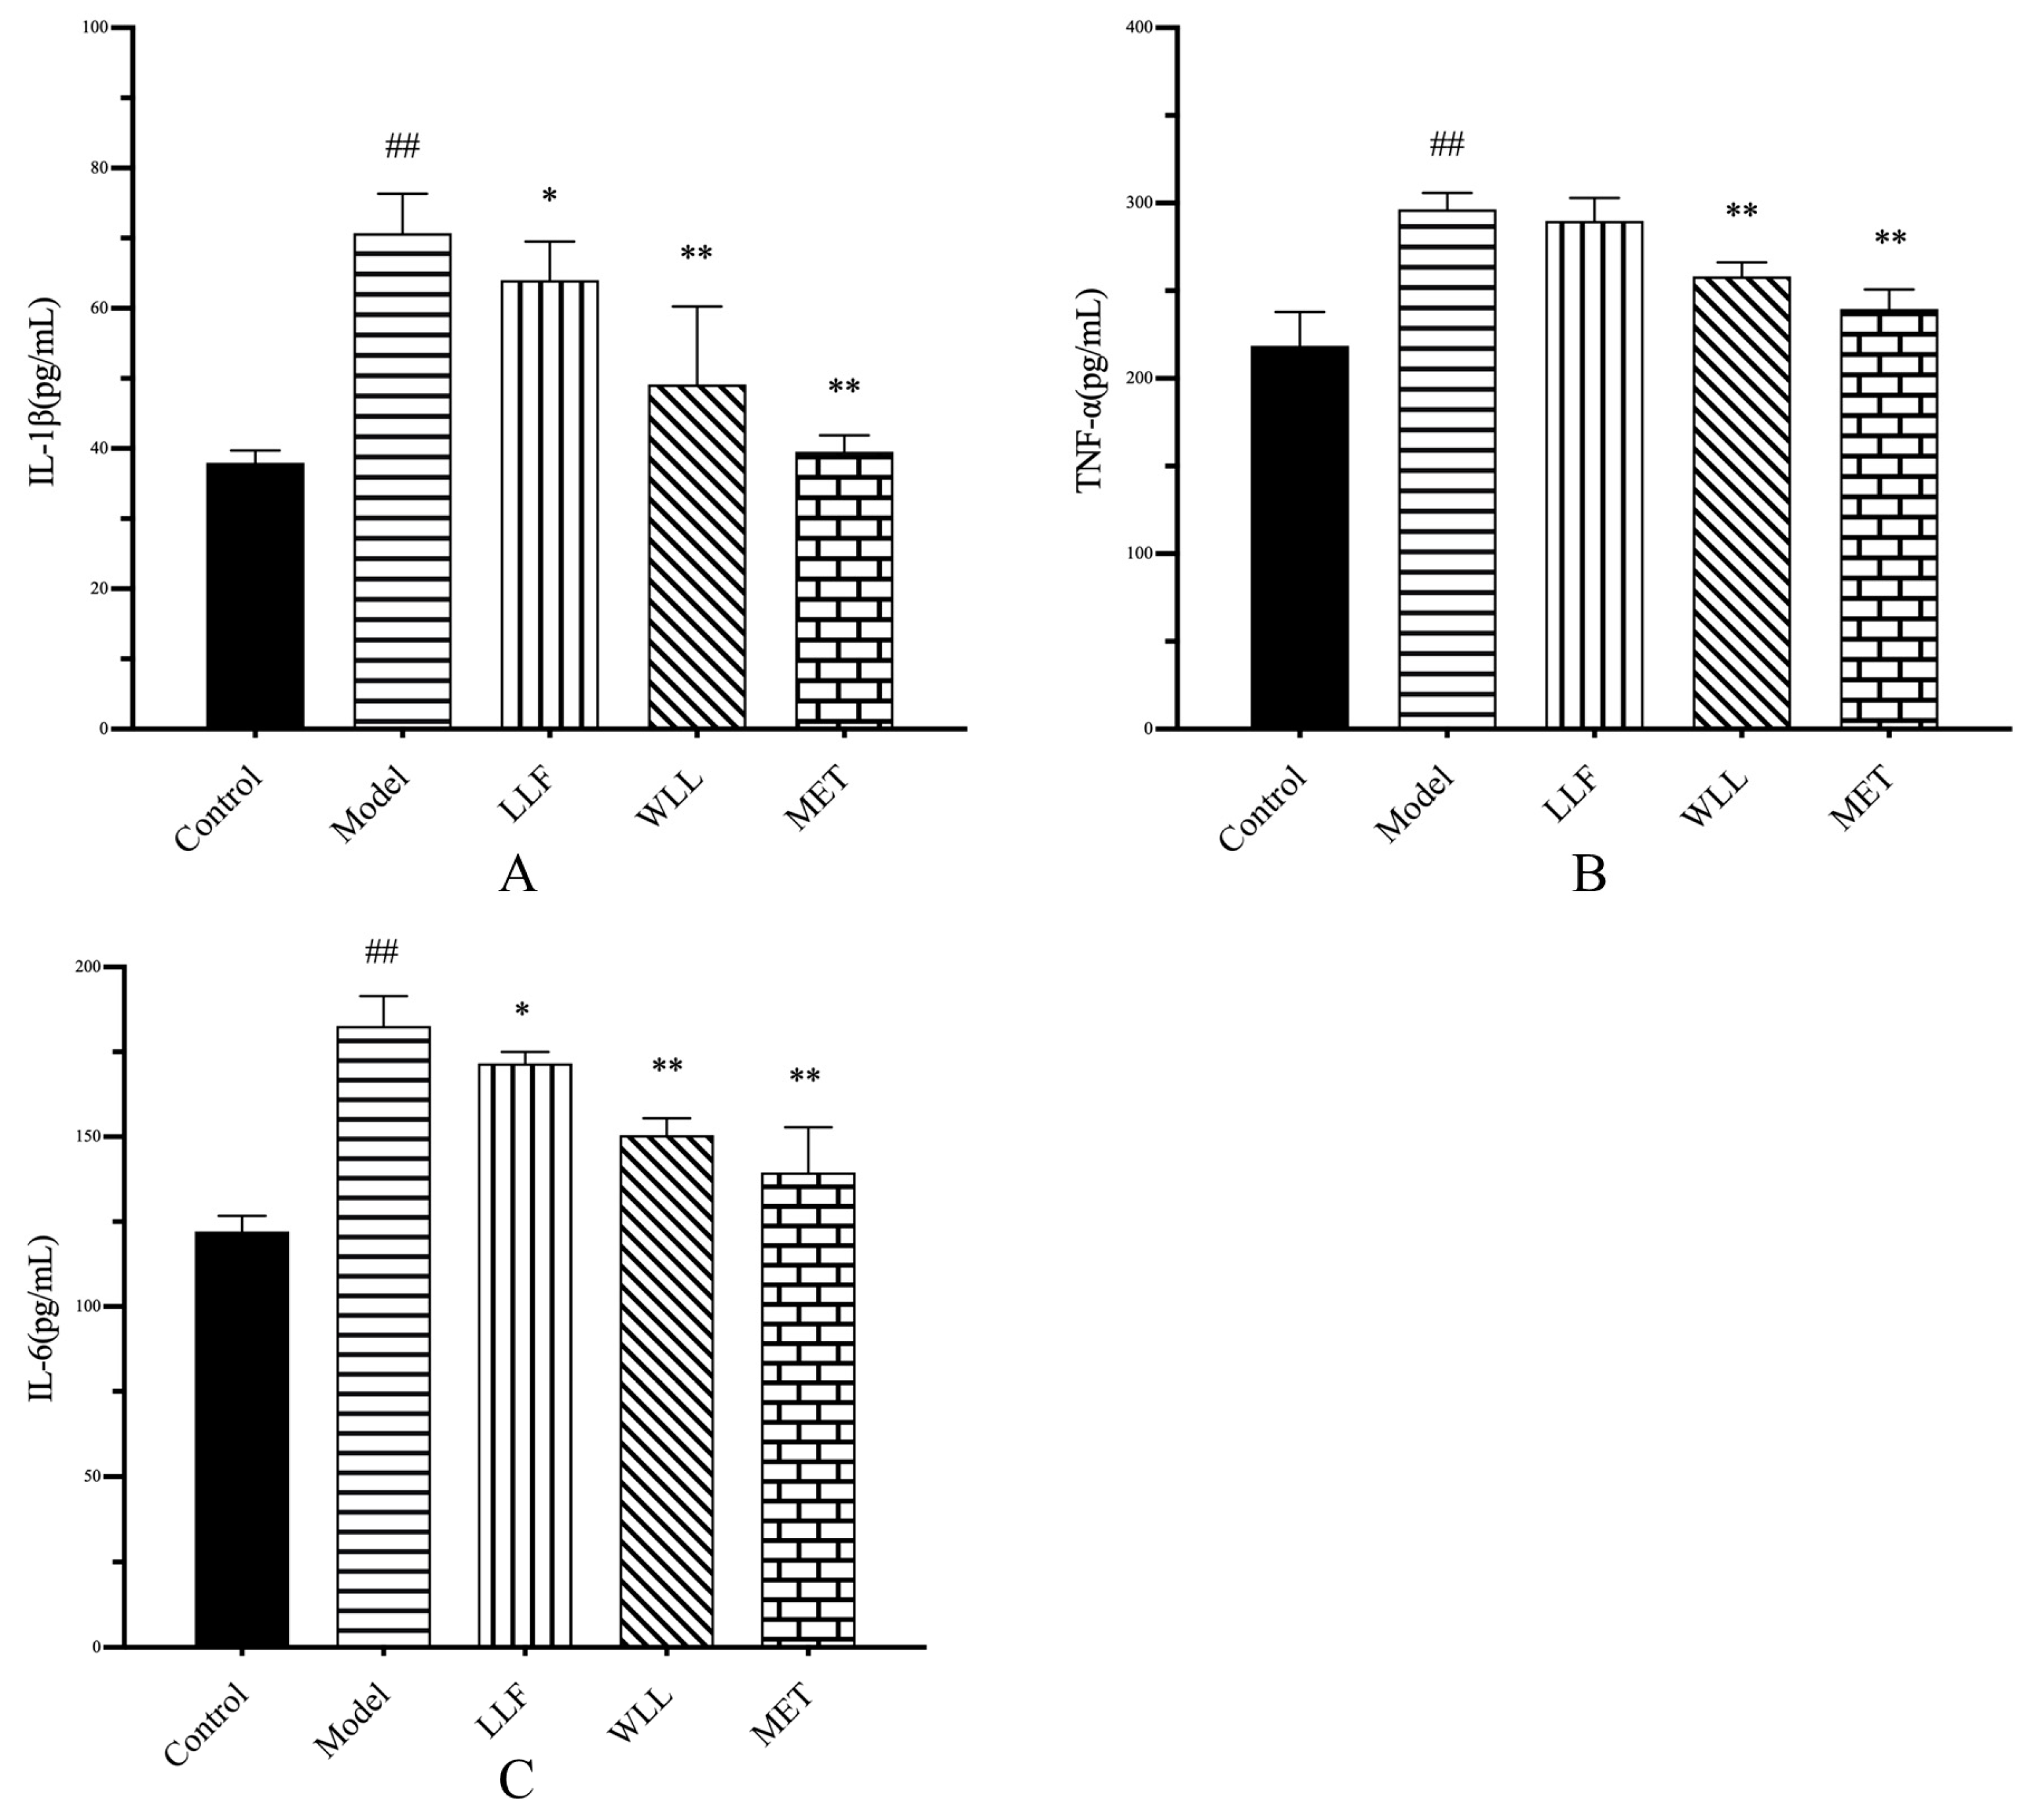
Cytokines are important parameters to identify kidney injury, and several proinflammatory mediators such as TNF-α, IL-6, and IL-1β are closely related to the progression of DN [45]. Oral administration of LLF and WLL extracts can significantly inhibit the release of pro-inflammatory mediators (TNFα, IL-6, and IL-1β) in the serum of DN rats, indicating that the anti-inflammatory effects of LLF and WLL extracts may be related to kidney protection in DN; meanwhile, the anti-inflammatory effect of the WLL extract was better than that of the LLF extract.
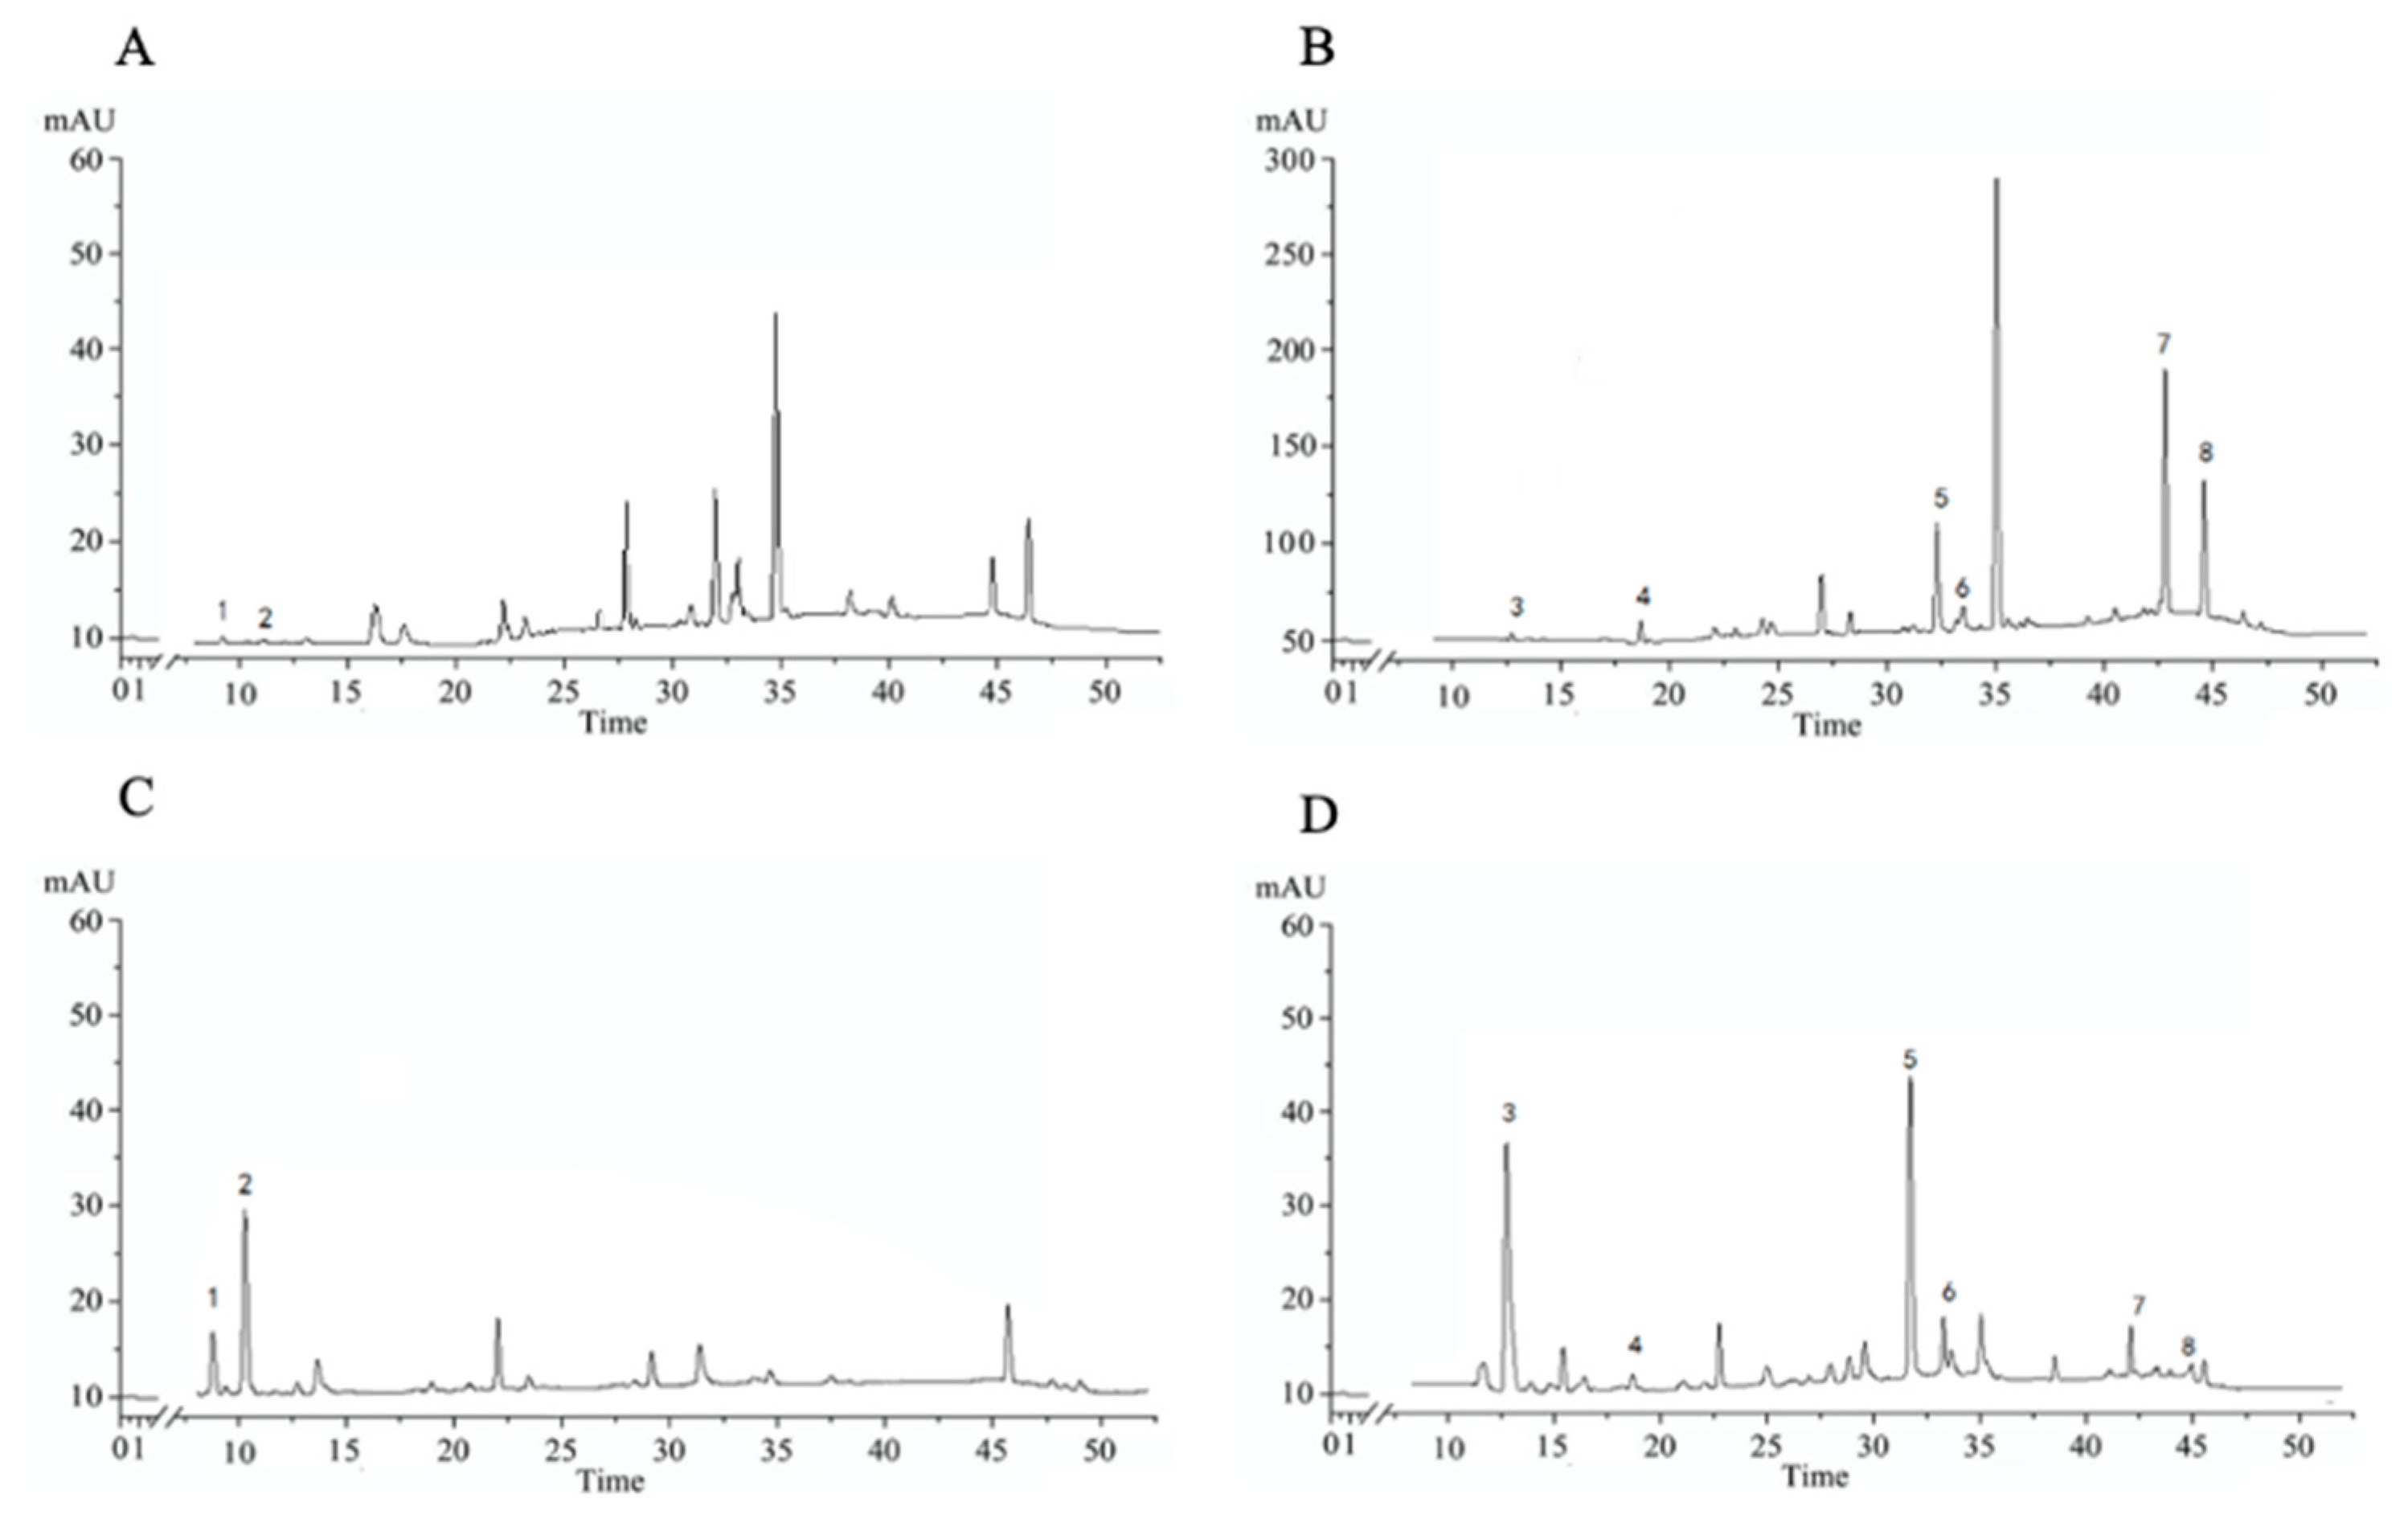
LLF mainly contains iridoids and phenylethanoids, which have good pharmacodynamic activity. Our previous experiments showed that the ethyl acetate and n-butanol components of LLF had protective effects in DN rats. The results of the HPLC demonstrated the effectiveness of hydroxytyrosol, salidroside, nuezhenidic acid, oleoside-11-methylester, specnuezhenide, 1‴-O-β-D-glucosylformoside, G13, and oleonuezhenide, which have a high content [46]. We speculated that these components might be the effective material basis in the treatment of DN. It has been reported that salidroside has a protective effect on the kidney of DN rats. Salidroside, tyrosol, and hydroxytyrosol have hypoglycemic, anti-inflammatory, and hypolipidemic effects [47,48]. Specnuezhenide and salidroside are characteristic components of WLL, which have been used as content determination indexes for quality control of Pharmacopoeia 2020 [
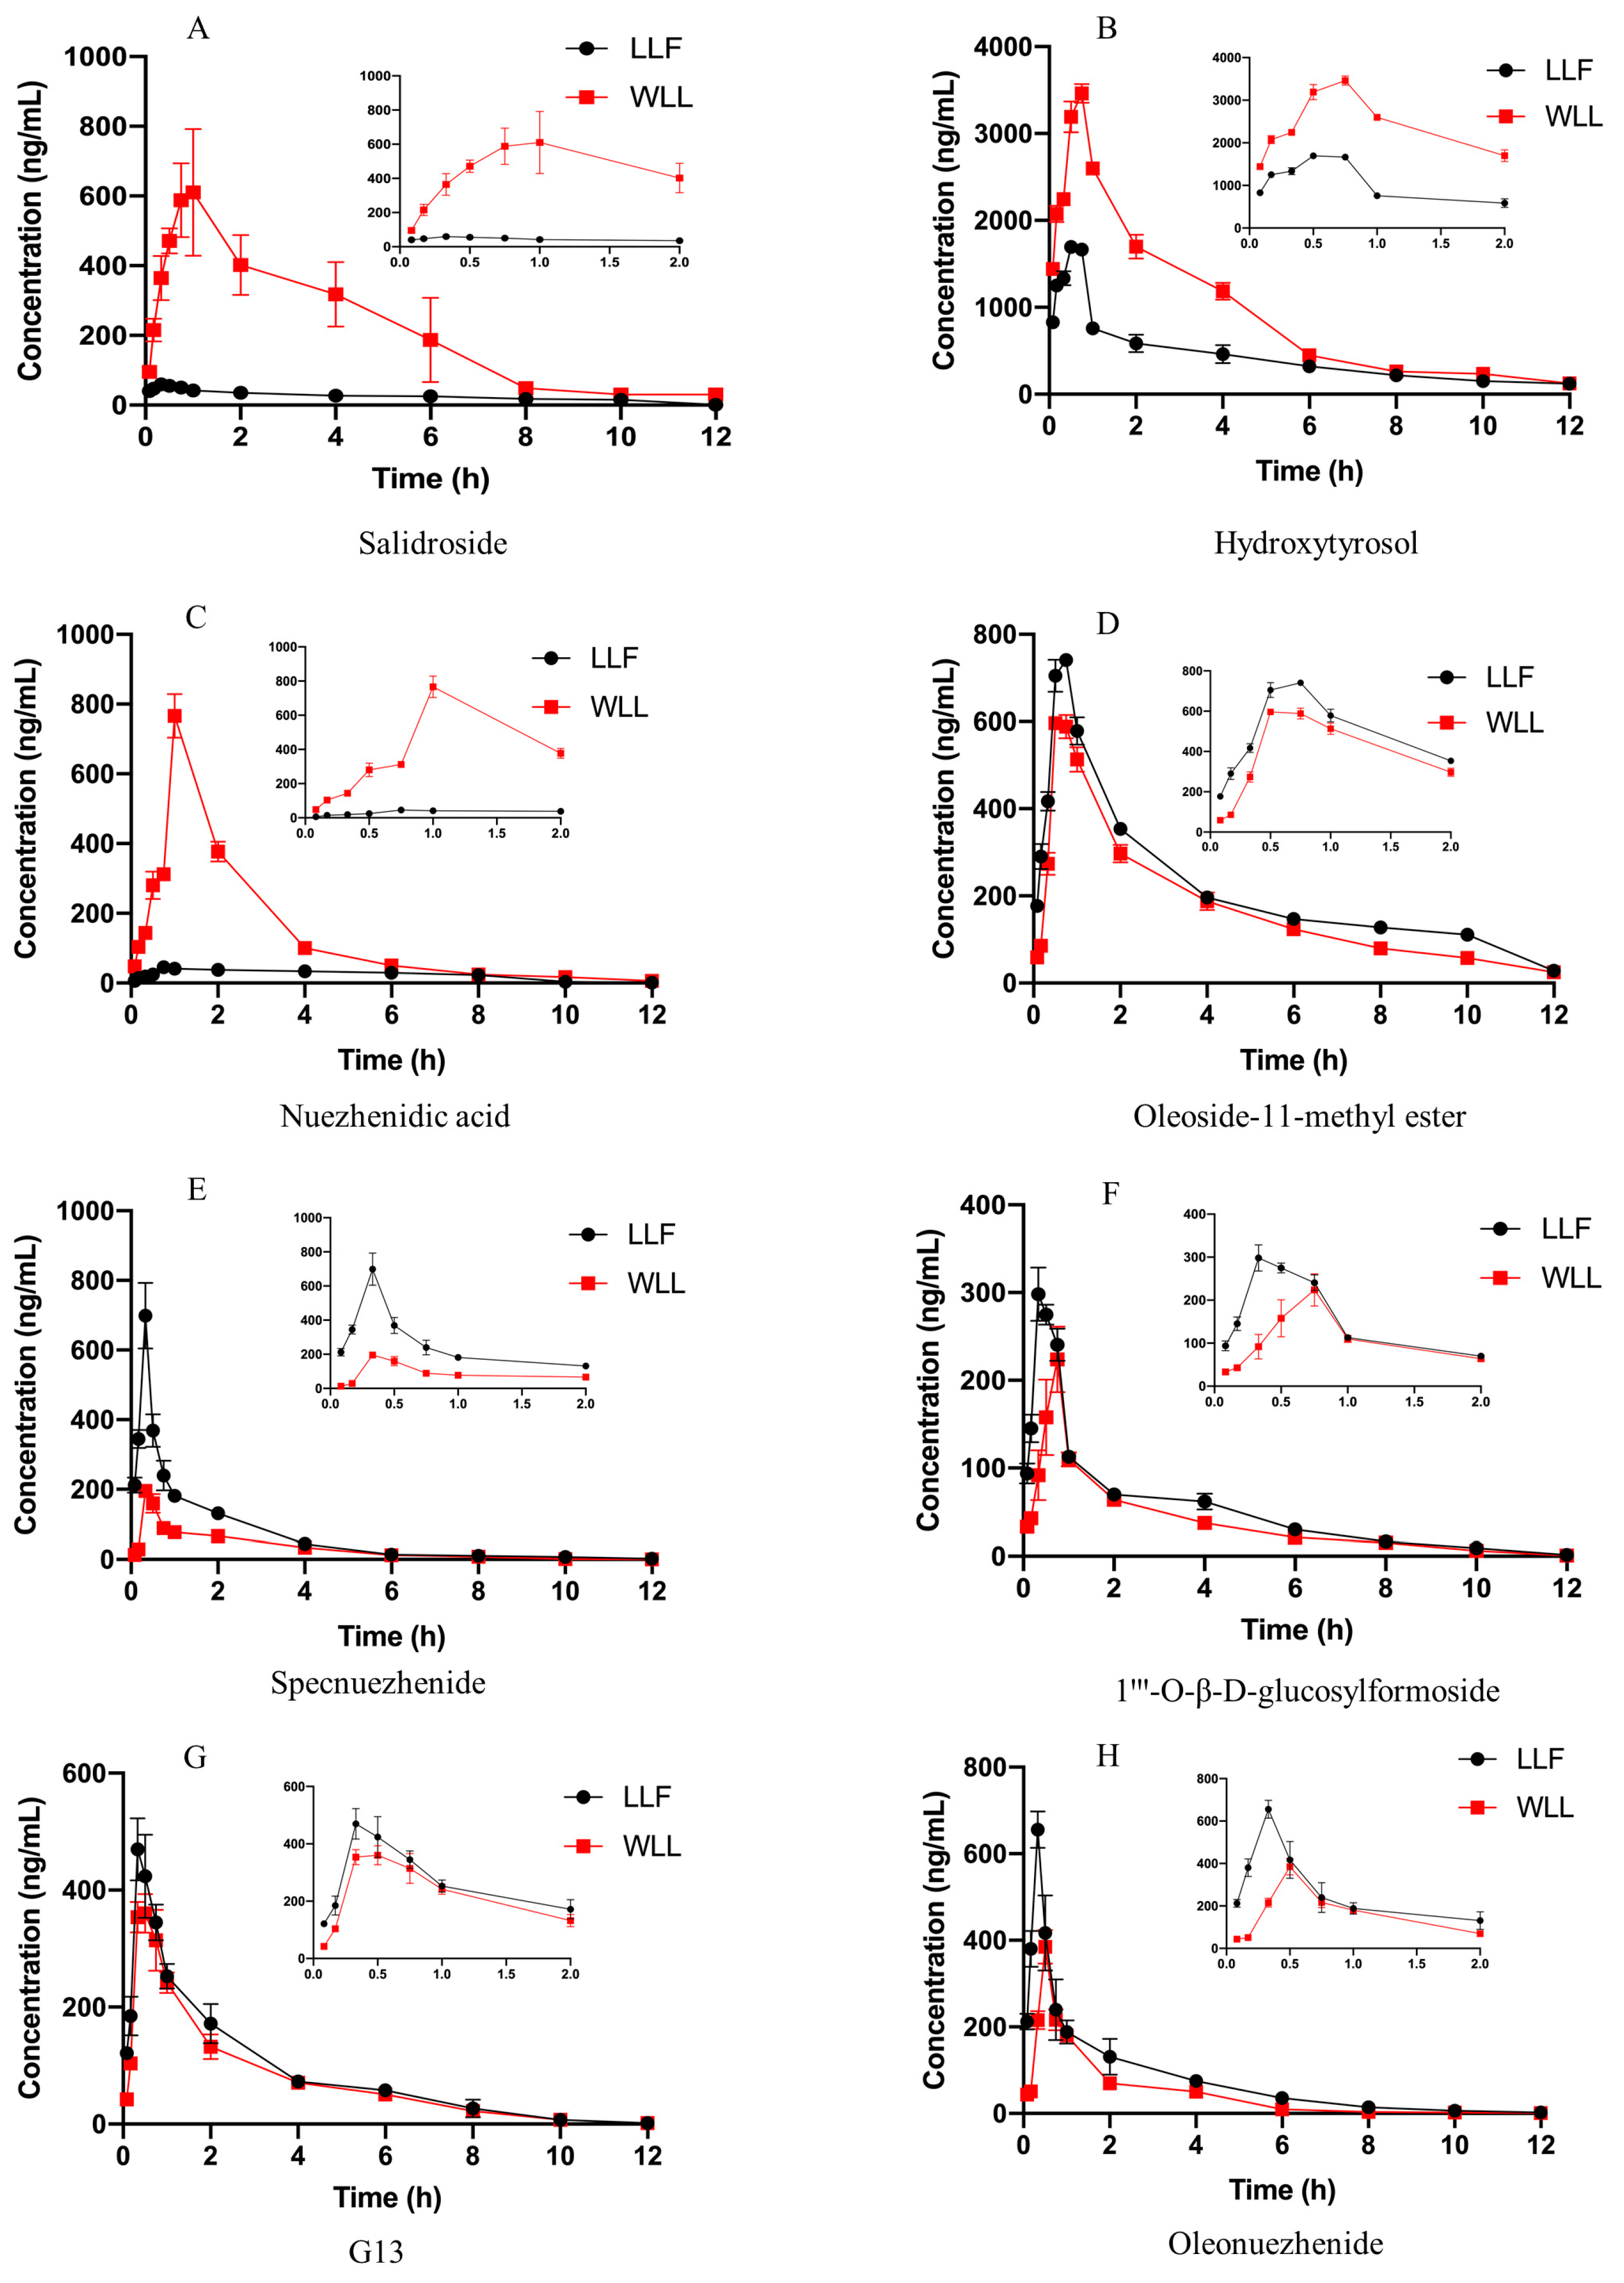
6]. Therefore, we studied the pharmacokinetics and kidney distribution of these eight components in LLF and WLL extracts in DN rats. Firstly, a UPLC-MS/MS method was used for rapid and accurate quantification of the eight major bioactive components in the plasma of DN rats. Then, the main pharmacokinetic parameters and kidney distribution of the eight main active components in LLF and WLL extracts were analyzed. Compared with LLF, the AUC0–12 h and Cmax values of salidroside, hydroxytyrosol and nuezhenidic acid increased, while oleoside-11-methyl ester, 1‴-O-β-
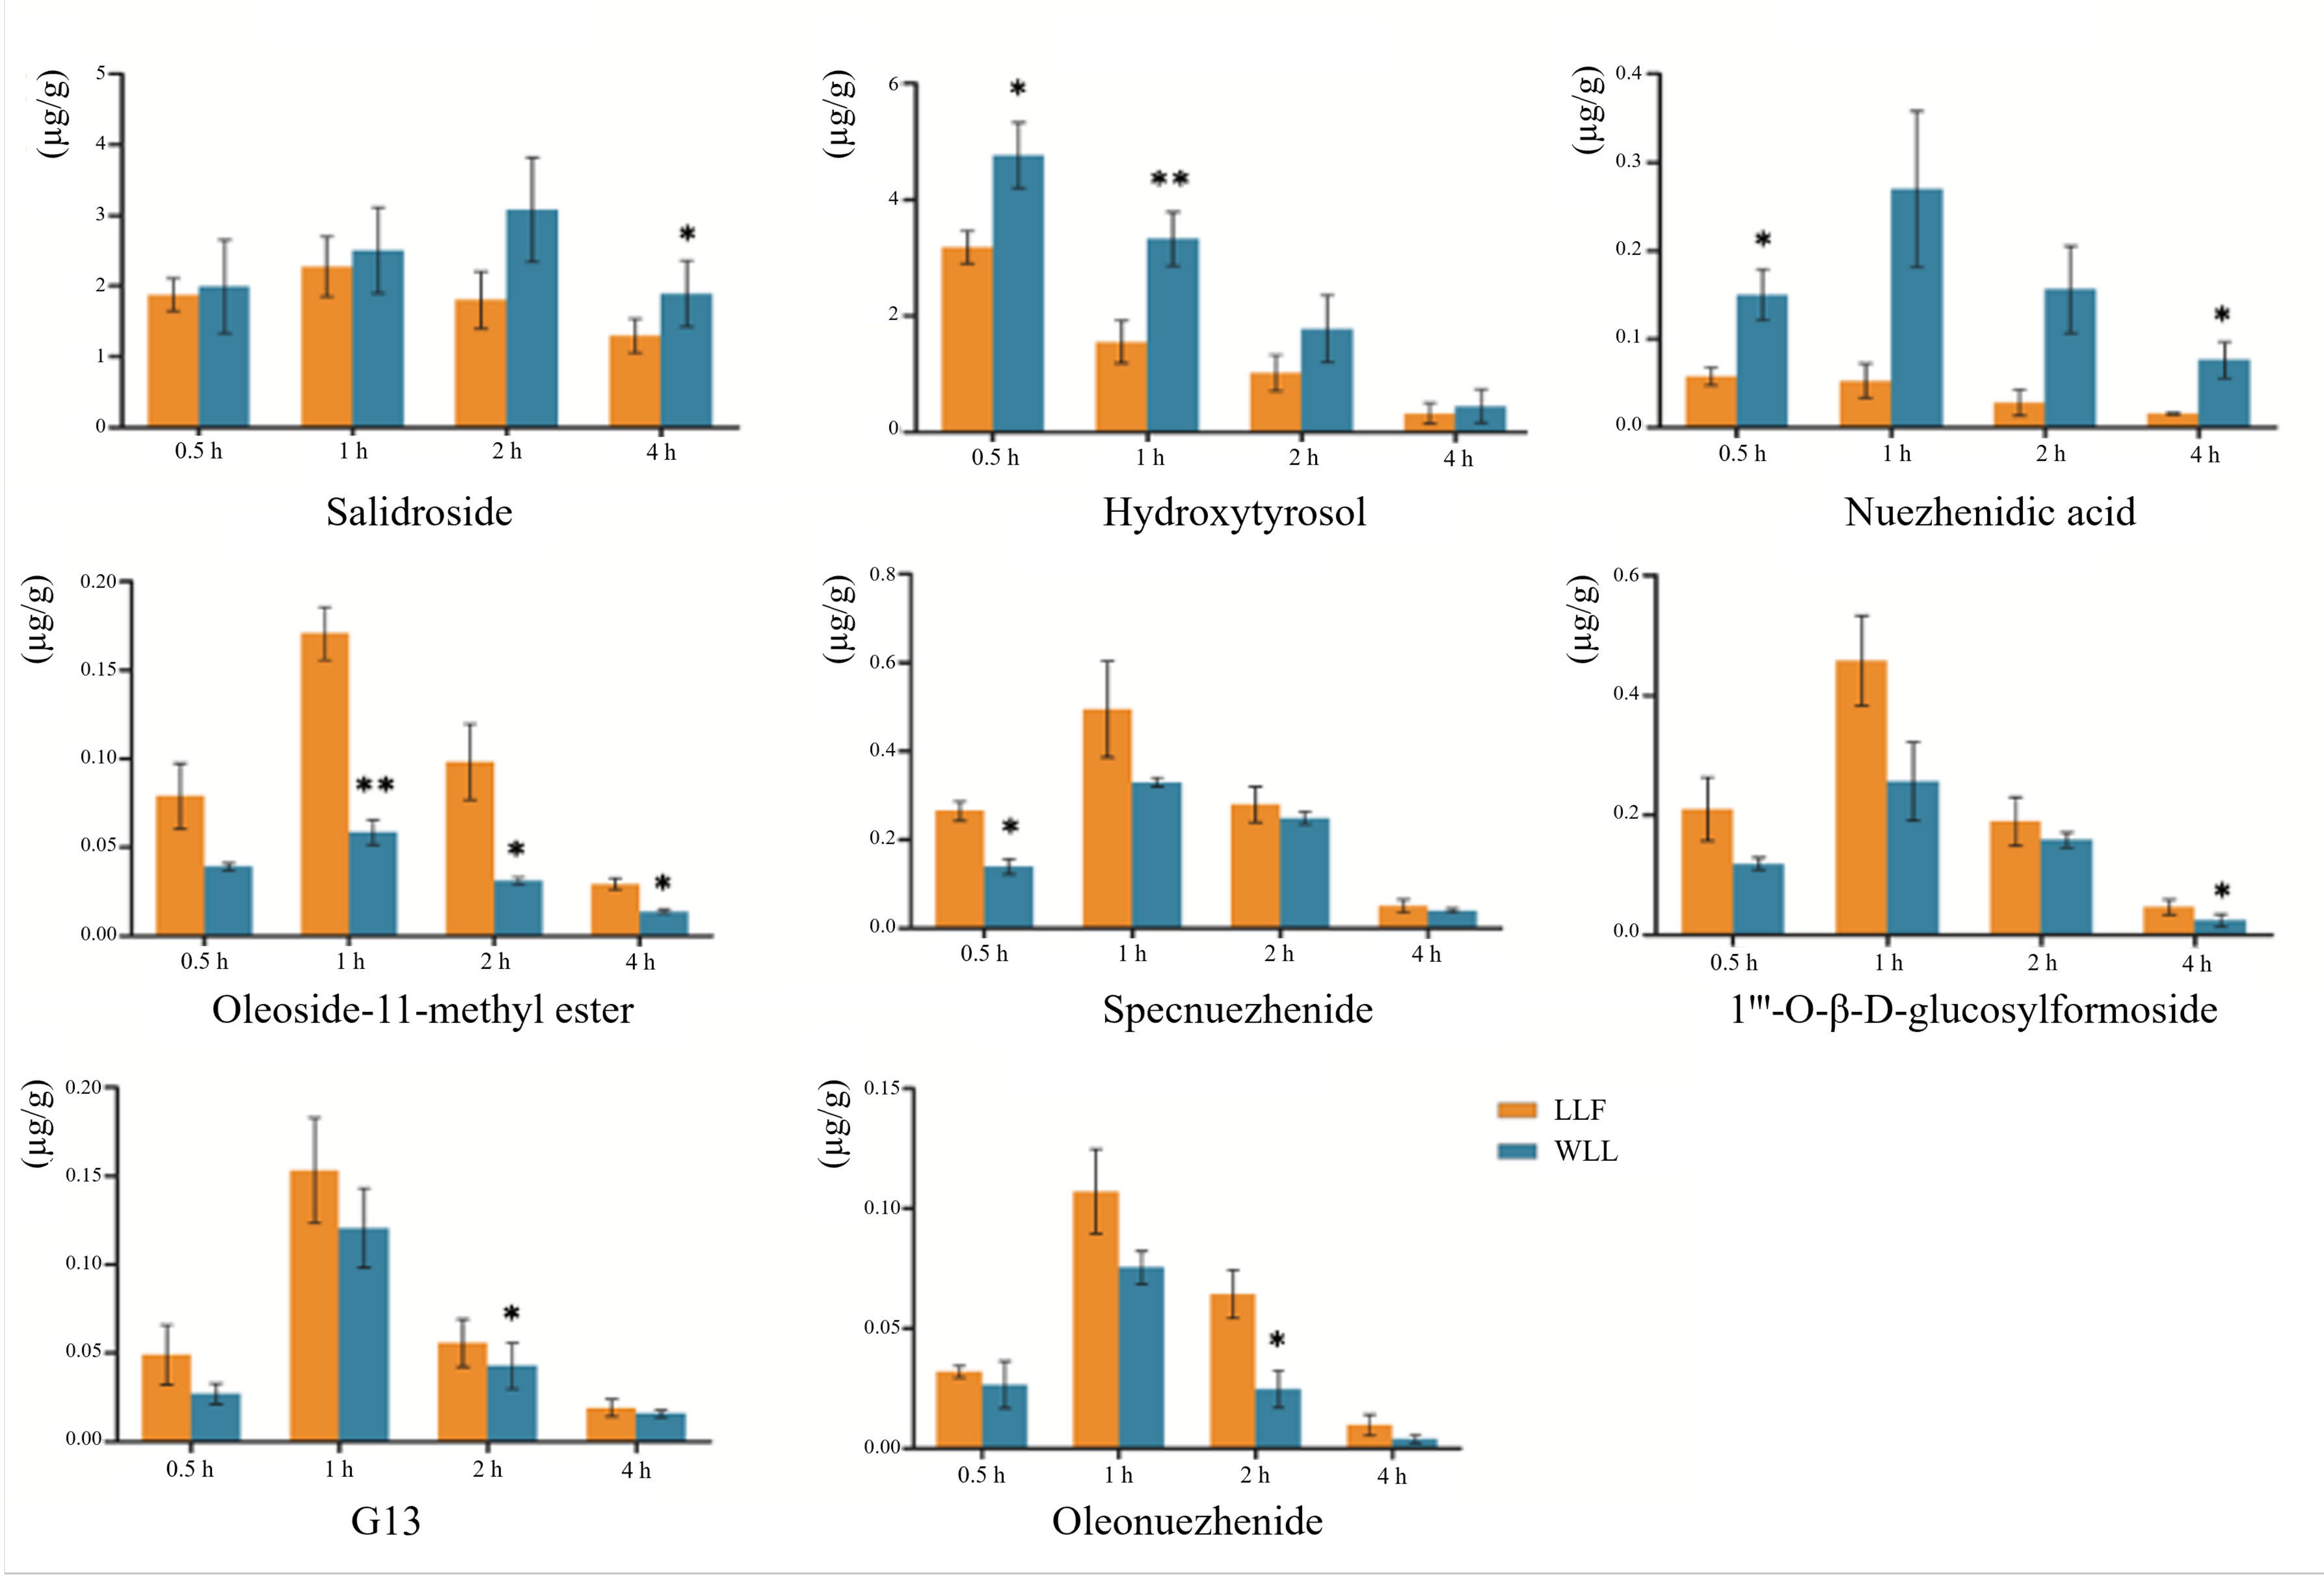
d-glucosylformoside, specnuezhenide, G13, and oleonuezhenide were decreased in WLL. In kidney tissue, the concentration of salidroside, hydroxytyrosol, and nuezhenidic acid increased in WLL compared with LLF, while oleoside-11-methyl ester, 1‴-O-β-d-glucosylformoside, specnuezhenide, G13, and oleonuezhenide decreased in WLL compared with LLF. The pharmacokinetic characteristic parameters of the AUC0–12h and Cmax of LLF were significantly different from those of WLL, indicating that steaming with wine could improve the bioavailability of LLF. Our previous research showed that the macromolecule iridoid glycosides are transformed into small molecule phenylethanol components, which are more easily absorbed by the body [49]. The pharmacokinetic study also showed that salidroside had a higher bioavailability and was more conducive to body absorption than specnuezhenide and G13 [50]. In our experiment, the WLL had an enhanced kidney protective effect in DN. It is speculated that the enhancement of kidney efficacy of LLF after wine-steaming may be related to the conversion of macromolecule iridoid glycosides into small molecular phenylethanol components, which is more conducive to absorption.
In addition, it was found that after wine-steaming, the contents of oleoside-11-methyl ester, 1‴-O-β-d-glucosylformoside, specnuezhenide, G13, and oleonuezhenide decreased, but the decrease in the AUC0–12h and Cmax in DN rats was much less than the contents in DN rats. The same trend was seen in the distribution of kidney tissue. It is speculated that wine-steaming promoted the absorption of these components and increased the bioavailability of these components in DN rats. The results showed that the effect of WLL was enhanced not only because the macromolecular substances were transformed into easily absorbed small molecules, but also because the wine-steaming promoted the absorption of substances, which further proves the theory of the effect of LLF wine-steaming.

4. Materials and Methods

4.1. Chemicals and Reagents

Crude products of LLF were purchased from Jianlian Shengjia TCM Co. Ltd. (Shandong Province, Jinan, China), which were identified by Professor Li Feng of TCM identification at Shandong University of TCM. Voucher specimen Nos. SDCM-YZ2019040601 were stored in the School of Chinese Materia, Shandong University of TCM (Jinan, China). The specimens were deposited at the laboratory of the author. Acetonitrile, methanol, and formic acid were provided by Fisher Scientific (Waltham, MA, USA). Purified water was purchased from watsons (Jinan, China). Other reagents were of analytical grade. Serum creatinine (SCr), blood urea nitrogen (BUN), 24-h urinary albumin, high-density lipoprotein cholesterol (HDL-C), low-density lipoprotein cholesterin (LDL-C), triglyceride (TG), and total serum cholesterol (TC) assay kits were purchased from Nanjing Jiancheng Bioengineering Institute. ELISA kits for TNF-α, IL-6, and IL-1β were purchased from Wuhan Genmei Biotechnology Co, Ltd. Streptozocin (STZ) was purchased from Sigma Chemicals Co. (St. Louis, MO, USA). Metformin (MET) was purchased from Shanghai Squibb Pharmaceutical Co. Ltd. (Shanghai, China). Metformin was ground into a powder with a mortar before dissolution.
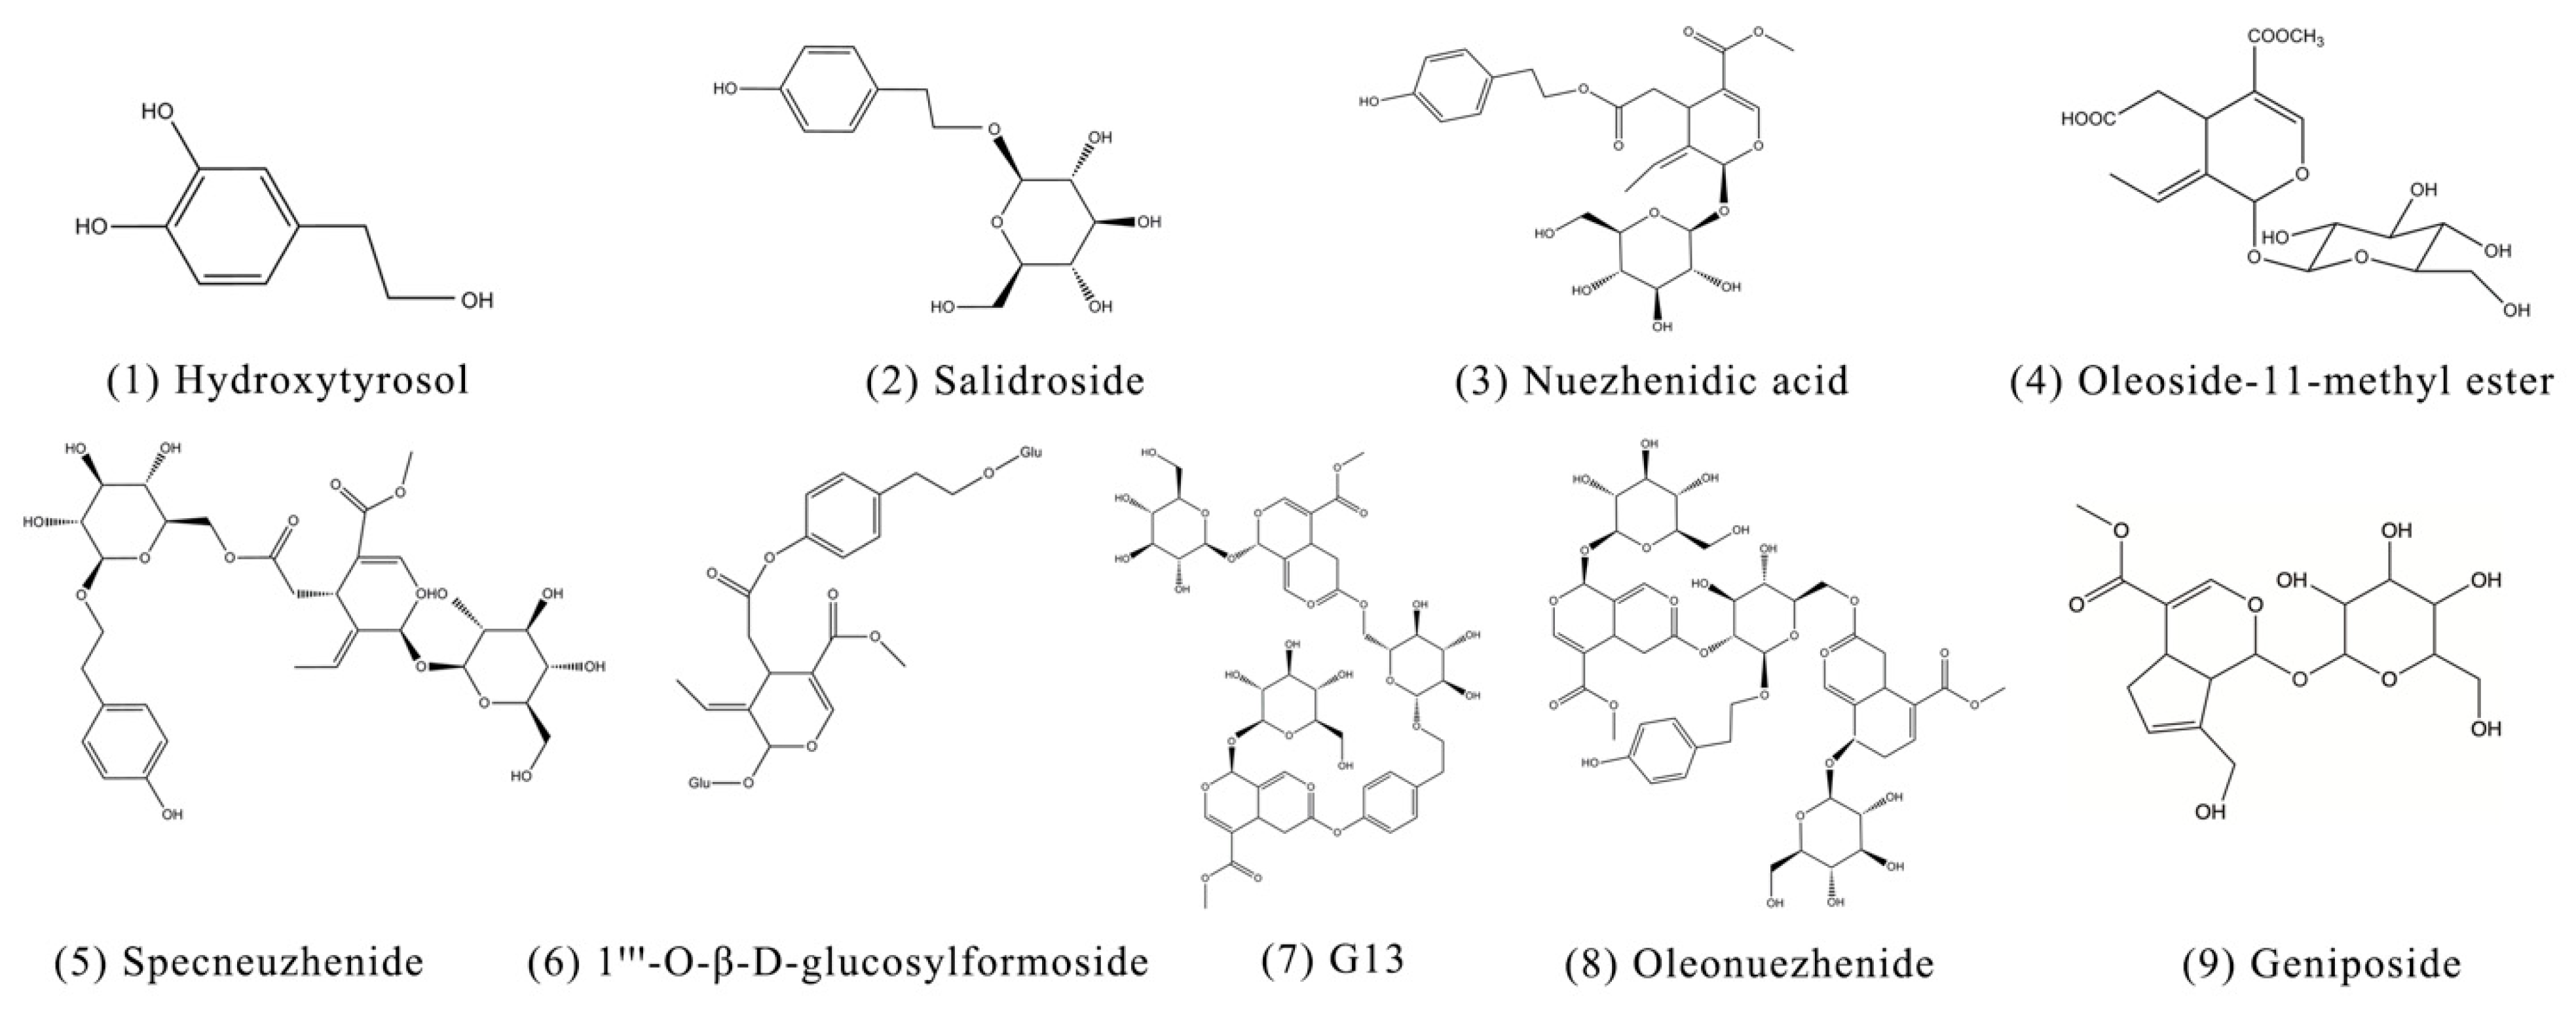
The standards for G13, oleonuezhenide, nuezhenidic acid, and oleoside-11-methyl ester were purchased from Shanghai Yilin Biotechnology Co., Ltd. (Shanghai, China), specnuezhenide was purchased from Chengdu Biopunify Phytochemicals Co., Ltd. (Chengdu, China), hydroxytyrosol and geniposide were provided by Chengdu Must Biotechnology Co., Ltd. (Chengdu, China), and 1‴-O-β-D-glucosylformoside and salidroside were obtained from Shanghai Yuanye Biotechnology Co., Ltd. (Shanghai, China). The purity of these standards was greater than 98%. The chemical structures are presented in Figure 11.

4.2. Instruments

The HPLC system consisted of a 1430 diode array detector, 1110 pumps with a high-pressure mixer, a 1310 column oven, and 1210 autosampler (Hitachi, Tokyo, Japan). The chromatographic separation of the analyte was achieved by a Kromasil C18 column (5 μm, 250 mm × 4.6 mm, Akzo Nobel N.V, Amsterdam, The Netherlands).
The UPLC system (Agilent 1260 series; Santa Clara, CA, USA) was equipped with a solvent degasser, G1311B quaternary pump, and G1329B automated injector. A Halo® C18 column (2.1 × 100 mm, 2.1 μm) was used for elution. An Agilent 6470 triple quadrupole mass spectrometer (Santa Clara, CA, USA) equipped with ESI source was used for mass detection.

4.3. Preparation of WLL

WLL was prepared in the laboratory. LLF was added with appropriate amount of rice wine and water, soaked for 4 h until soft, placed in a closed container, steamed for 24 h until the surface turned black, and then dried in a 50 °C drying oven.

4.4. Preparation of LLF and WLL Extracts

LLF was powdered by pulverizer, accurately weighed to 1.0 kg, and underwent ultrasonic extraction with 50% ethanol three times for 1 h each time; the ratios of plant/ethanol used were 1/10 (w/w). The filtrate was combined and ethanol was recovered. The total crude extract of LLF was purified by macroporous resin to obtain the LLF extract, which was accurately weighed. The preparation of WLL extract was the same as the above procedure. The two samples obtained were used in subsequent experiments.

4.5. Quantitative Analysis of LLF and WLL Extracts by HPLC

Quantitative determination of the eight ingredients in LLF and WLL extracts were performed. Before analysis, the LLF and WLL extracts (0.10 g) were dissolved in 50 mL of 50% methanol and filtered through a 0.22 μm membrane.
The chromatographic conditions were established by our team in the early stage [51]. The Kromasil C18 column (250 mm × 4.6 mm i.d., 5 μm particle size) was used, the mobile phase was acetonitrile (solution A) and 0.1% formic acid aqueous solution (solution B). The flow rate was 1 mL/min, the column temperature was 20 °C, and the injection volume was set to 10 μL. The sequence of gradient elution was as follows: 0–10 min with 7–12% A; 10–35 min with 12–25% A; 35–52 min with 25–41% A. The wavelength of the UV detector was fixed at 280 nm (hydroxytyrosol and salidroside) and 240 nm (nuezhenidic acid, oleoside-11-methyl ester, specnuezhenide, 1‴-O-β-d-glucosylformoside, G13, and oleonuezhenide) for determination.

4.6. Experimental Animals

Five-week-old male Sprague-Dawley (SD) rats, weighing 150 ± 20 g, were purchased from the Jinan Pengyue experimental animal breeding co. Ltd. (Shangdong, Jinan, China). Rats were reared in a 12 h light/dark cycle at 25–30 °C with free access to drinking water and food. Before the experiment, the animals were bred adaptively for 1 week. All animal experiments were performed in accordance with the guidelines established by the Institutional Animal Protection and Use Committee of Shandong University of TCM.

4.7. Establishments of DN Rat Models

A high-fat-sugar diet (HFSD)/streptozotocin (STZ) regimen was used to experimentally induce DN in rats. Before the experiment, the rats were adaptively reared for 1 week. The rats in the control group were maintained on a standard diet, and the model rats were fed a HFSD for 4 weeks. The HFSD was composed of 18% fat, 20% sucrose, 3% cholesterol, and 59% basic food. After 4 weeks, the rats were fasted for 12 h. Then, the rats in the Model groups were intraperitoneally injected STZ at 50 mg/kg dissolved in 0.05 mol/L citrate buffer (pH = 4.5). The rats in the Control group received the same volume of citrate buffer as the body weight standard. The blood glucose level of the rats was measured 3 days after STZ injection. Rats with blood glucose levels over 16.6 mmol/L were used as the follow-up experimental model rats.

4.8. Pharmacodynamic Study of LLF and WLL Extracts in DN Rats

4.8.1. Experimental Procedure

DN rats were randomly divided into the Model group, LLF group, WLL group, and MET group, with 10 rats in each group. Each group was treated as follows: Control group and Model group were treated with an equal volume of distilled water. The LLF group was given 2.12 g/kg extract of LLF and the WLL group was given 1.89 g/kg extract of WLL, both of which were equivalent to 15 g/kg raw LLF. The MET group was treated with 200 mg/kg metformin. All rats were orally administered once every morning. Blood was collected from the tail vein every 2 weeks to measure blood glucose levels. After the last treatment, the food consumption, water consumption, and body weight of the rats were measured. The rats were placed in a metabolic cage to collect urine samples for 24 h. The collected urine samples were centrifuged at 3000 rpm for 5 min, and the supernatant was taken and stored at −20 °C until use. Blood samples were collected through the abdominal aorta after the rats were anesthetized with isoflurane; samples were centrifuged at 3000 rpm for 10 min to separate the serum and stored at −80 °C for biochemical analysis of kidney function. Finally, the two kidneys of each rat were collected and weighed to calculate the kidney/body mass index. A kidney was taken for histopathological evaluation.

4.8.2. Urine Analysis and Measurement of Biochemical Parameters

24-h urinary protein was measured using the auto spectrophotometer (Shimadzu, Kyoto, Japan). The levels of SCr and BUN were measured using the Spectra Max M 5 automatic microplate reader (Molecular Devices, Inc., San Jose, CA, USA).

4.8.3. Analysis of Lipid Profiles

The effect of LLF and WLL extracts on the lipid profiles was measured in serum using automatic biochemical analyzer, according to the manufacturer’s instructions.

4.8.4. Assessment of Inflammatory Cytokines

We investigated the inflammatory cytokines responsible for DN, including TNF-α, interleukin 1 β (IL-1β), and interleukin 6 (IL-6). The concentrations of inflammatory cytokines were measured using ELISA assay kits, according to the manufacturer’s instructions.

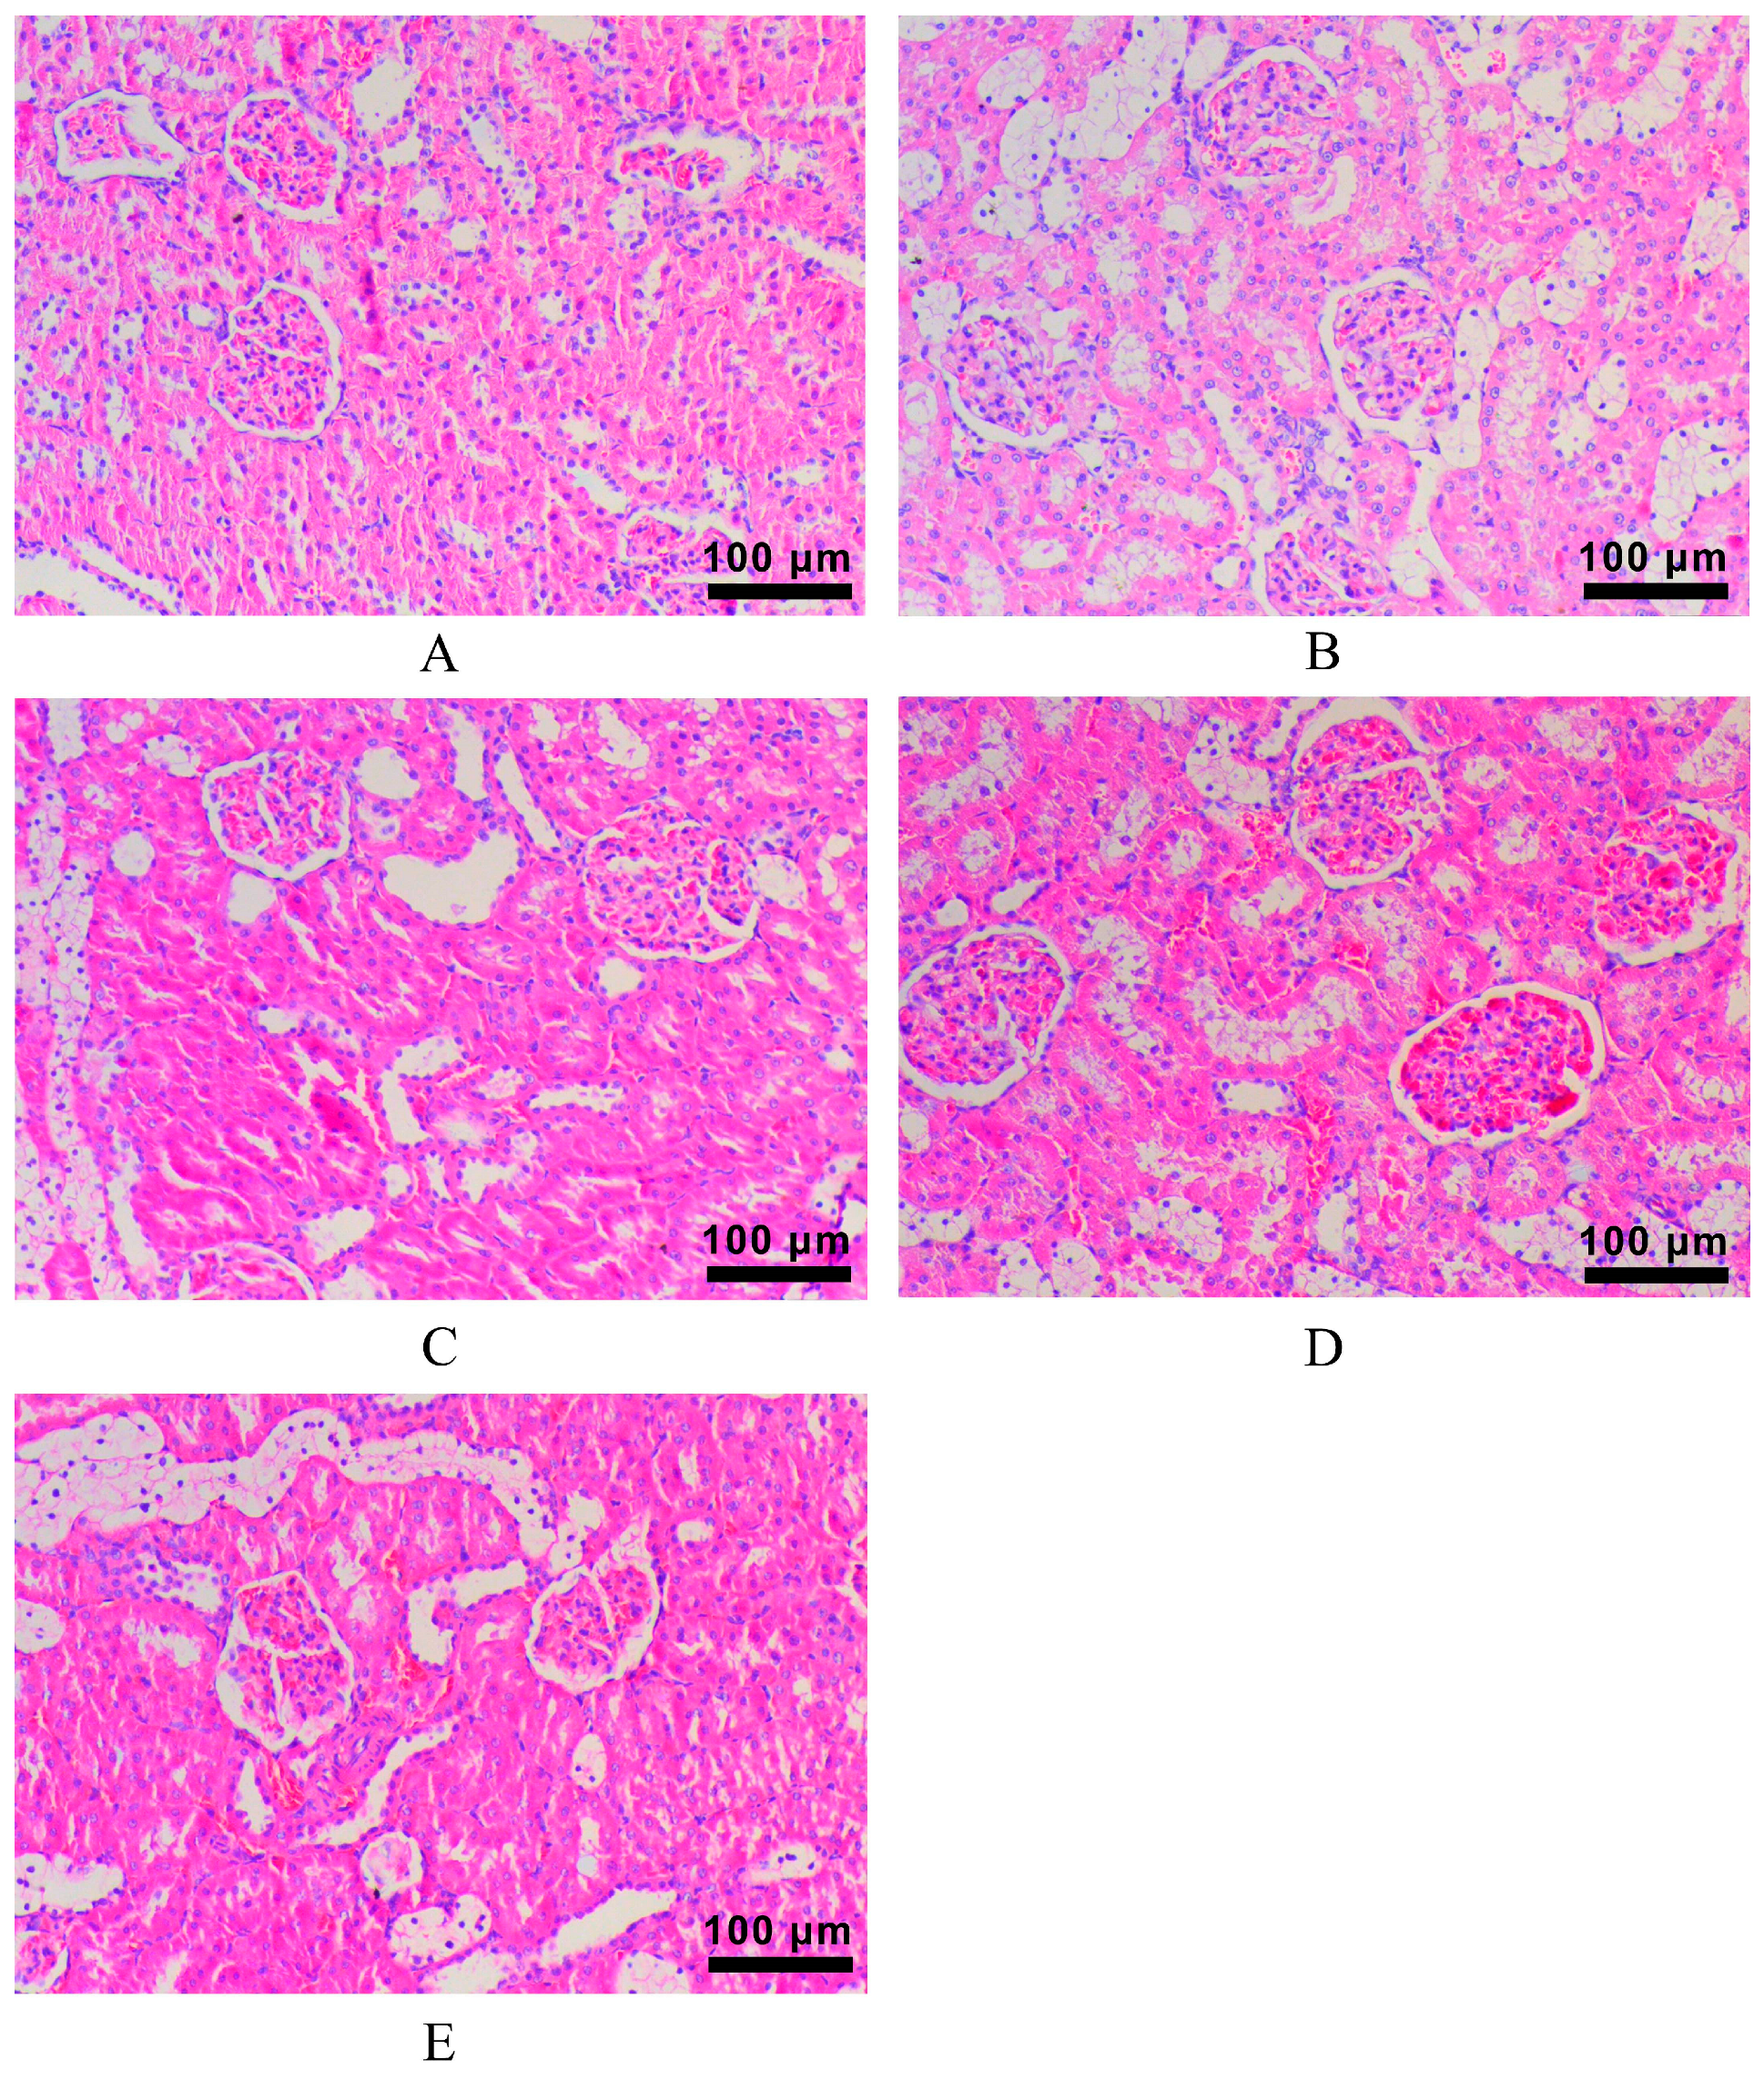
4.8.5. Histopathological Examination

Kidney tissue was collected and stored in 10% paraformaldehyde immediately. Paraffin sections of the kidney were used for hematoxylin and eosin (H&E) staining to observe pathological changes of the kidney tissue.

4.9. Plasma Pharmacokinetics in Rats

4.9.1. UPLC-MS/MS Conditions

The mobile phase consisted of 0.1% (v/v) formic acid-water (solvent A) and acetonitrile (solvent B). Gradient elution was carried out according to the following program: 15–25% B (0–3 min), 25–75% B (3–4 min), 75% B (4–6 min), 75–15% B (6–7 min), and 15% B (7–9 min). The column temperature was set at 35 °C, the flow rate was 0.3 mL/min, and the injection volume was 5 μL. The mass spectrometer was set at negative ionization mode. The multiple reaction monitoring (MRM) mass scan mode was implemented. The optimized parameters were programmed as follows: nebulizer gas pressure, 50 psi; capillary voltage, 3500 V; cell acceleration voltage, 4 V; gas temperature, 350 °C; dwell time, 30 ms, and flow rate, 11 L/min. The precursor ion/product ion were m/z 229.1/199.2 for salidroside, 153.1/123.1 for hydroxytyrosol, 433.2/209.1 for nuezhenidic acid, 403.1/223.1 for oleoside-11-methyl ester, 685.2/299.0 for 1‴-O-β-D-glucosylformoside, 685.5/453.3 for specnuezhenide, 1071.3/771.5 for G13, 1071.4/909.3 for oleonuezhenide, and 411.1/217.0 for the internal standard (IS, geniposide).

4.9.2. Preparation of Standard Solutions, Calibration Samples, and Quality Control Samples

An appropriate amount of each standard solution was dissolved in methanol to prepare a mixture containing salidroside, hydroxytyrosol, nuezhenidic acid, oleoside-11-methyl ester, 1‴-O-β-d-glucosylformoside, specnuezhenide, G13, and oleonuezhenide stock standard solutions. The mixed stock solution was serially diluted with methanol to obtain a series of working standard solutions. The internal standard stock standard solution of geniposide in methanol was similarly diluted to produce a working solution of 600 ng/mL. The diluted stock solution was added to blank rat plasma to prepare the calibration curve working solution. Quality control samples of the eight markers were prepared from blank plasma with high, medium, and low concentrations.

4.9.3. Plasma Sample Treatments

One-hundred microliters of plasma sample was placed in a 1.5 mL EP tube and 10 μL of internal standard working solution (600 ng/mL geniposide) and 300 μL of methanol were added.
The mixture was vortexed for 3 min, centrifuged for 10 min, and the supernatant was taken and dried with nitrogen; the residue was reconstituted by adding 100 µL of the initial mobile phase. Sixty microliters of the prepared sample was transferred to a liquid phase vial, and 5 μL of the prepared sample underwent UHPLC-MS/MS analysis.

4.9.4. Plasma Sample Analysis

Before the pharmacokinetic study, the DN rats were fasted for 12 h, during which time they had free access to drinking water. Twelve rats were randomly divided into two groups, with six rats in each group. Rats were orally administered LLF and WLL extracts with a dose equivalent to 15 g/kg raw LLF. At 0, 0.083, 0.167, 0.333, 0.50, 0.75, 1, 2, 4, 6, 8, 10, and 12 h after administration, blood samples (500 μL) were collected from the rat orbit and placed in a 1.5 mL heparin sodium anticoagulant centrifuge tube. The sample was immediately centrifuged at 4000 rpm for 10 min and the plasma was stored at −20 °C for subsequent analysis. Data analysis was performed using the DAS 2.0 pharmacokinetic software (Shanghai, China).

4.10. Kidney Distribution in Rats

4.10.1. Kidney Tissue Collection

DN rats were randomly divided into two groups: the LLF extract group and WLL extract group. The two groups were orally given the same dose of extracts equivalent to raw LLF. Tissues of kidneys were taken at 0.5, 1, 2, and 4 h after oral administration. The blood and contents on the tissue surface were washed with 0.9% saline solution, dried, and stored at −20 °C before analysis. Six batches were determined in parallel.

4.10.2. Kidney Sample Pretreatment

Four-hundred micrograms of kidney tissue was weighed, cut into small pieces, and normal saline was added at a ratio of 1:2 (w/v). Tissue homogenate was prepared under ice bath conditions, centrifuged at 12,000 rpm for 5 min, and 100 µL supernatant was taken; 10 µL internal standard solution and 10 µL methanol solution were added, rotated, and mixed for 3 min. Next, 300 µL of methanol solution was added, vortexed for 3 min, centrifuged at 10,000 rpm for 10 min, followed by removal of the supernatant and drying with nitrogen. Then, 100 µL of the initial mobile phase was added to the residue, vortexed and mixed for 3 min, and 5 µL of sample was taken for analysis.

4.11. Statistical Analyses

All data were expressed as mean ± standard deviation (SD). Analysis was performed with SPSS software 21.0 (IBM, New York, NY, USA). The statistical significance of the pharmacodynamics, pharmacokinetics, and tissue distribution parameters obtained from each group were evaluated. The data were evaluated using one-way analysis of variance (ANOVA). p < 0.05 was considered statistically significant, and p < 0.01 was considered very significant.

5. Conclusions

In conclusion, both LLF and WLL extracts had protective effects in HFSD/STZ induced DN rats. The renal protective effect of the WLL was better than that of the LLF. Regarding the pharmacokinetics and kidney distribution, wine-steaming could affect the absorption and distribution of salidroside, hydroxytyrosol, nuezhenidic acid, oleoside-11-methyl ester, 1‴-O-β-d-glucosylformoside, specnuezhenide, G13 and oleonuezhenide to different degrees and promoted the absorption of salidroside, hydroxytyrosol, and nuezhenidic acid, which may be the reason for the increased effect of LLF after wine-steaming. In addition, this is the first time that the mechanism of efficacy enhancement after wine-steaming has been revealed from the perspective of the overall pharmacokinetics and kidney distribution. This study provides an important basis for the pharmacological research and clinical application of LLF.

Author Contributions

X.Z. developed the experimental design and concept of the study, obtained funding, and revised the manuscript. R.L. performed experiments and wrote the manuscript. P.Z. assisted in the experimental design and gave conceptual advice. Q.L., X.C. and L.W. performed parts of the in vivo experiments and analyzed the data. All authors have read and agreed to the published version of the manuscript.

Funding

This research was funded by the National Key Research and Development Program of China (Grant No. 2018YFC1707204), the National Natural Science Foundation of China (No. 81973486, 82173974, and 81373968), and the Shandong Provincial Collaborative Innovation Center Project for Quality Control and Construction of the Whole Industrial Chain of Traditional Chinese Medicine (CYLXTCX2021-12).

Institutional Review Board Statement

The study was conducted in accordance with the Declaration of Helsinki and was approved by the Shandong University of Traditional Chinese Medicine Laboratory Animal Welfare Ethical Review Committee (Protocol code: SDUTCM 20200520001, Approval date: 20 May 2020).

Informed Consent Statement

Not applicable.

Data Availability Statement

The data used to support the findings of this study are available from the corresponding author upon request.

Conflicts of Interest

The authors declare no conflict of interest.

Sample Availability

Samples of the compounds G13, oleonuezhenide, nuezhenidic acid, oleoside-11-methyl ester, specnuezhenide, hydroxytyrosol, geniposide, 1‴-O-β-d-glucosylformoside, and salidroside are available from the authors.

References

  1. Yue, T.; Xu, H.L.; Chen, P.P.; Zheng, L.; Huang, Q.; Sheng, W.S.; Zhuang, Y.D.; Jiao, L.Z.; Chi, T.T.; ZhuGe, D.L.; et al. Combination of coenzyme Q10 loaded liposomes with ultrasound targeted microbubbles destruction (UTMD) for early theranostics of diabetic nephropathy. Int. J. Pharm. 2017, 528, 664–674. [Google Scholar] [CrossRef]
  2. Kumar, A.; Mittal, R. Mapping txnip: Key connexions in progression of diabetic nephropathy. Pharmacol. Rep. 2017, 70, 614–622. [Google Scholar] [CrossRef]
  3. Kundu, A.; Dey, P.; Sarkar, P.; Karmakar, S.; Tae, I.H.; Kim, K.S.; Park, J.H.; Lee, S.H.; Lee, B.M.; Renthlei, L.; et al. Protective effects of Croton hookeri on streptozotocin-induced diabetic nephropathy. Food Chem. Toxicol. 2020, 135, 110873. [Google Scholar] [CrossRef]
  4. Li, W.Z.; Wang, X.H.; Zhang, H.X.; Mao, S.M.; Zhao, C.Z. Protective effect of the n-butanol Toona sinensis seed extract on diabetic nephropathy rat kidneys. Genet. Mol. Res. 2016, 15. [Google Scholar] [CrossRef]
  5. Zhang, W.; Zhang, Q.; Xuan, Z.; Liang, J.; Yang, D.; Ding, M.; Zhu, H.; Su, B.; Dai, X.; Jia, X. The protective effect of different polar solvent extracts of Er Miao San on rats with adjuvant arthritis. Evid. Based. Complement. Altern. Med. 2020, 2020, 5305278. [Google Scholar] [CrossRef]
  6. Chinese Pharmacopoeia Commission. Pharmacopoeia of the People’s Republic of China; China Medical Science and Technology Press: Beijing, China, 2020; Volume IV, pp. 47–48. [Google Scholar]
  7. Li, C.L. Clinical research progress of Traditional Chinese Medicine treatment of diabetic nephropathy. Hebei J. Tradit. Chin. Med. 2017, 39, 926–931. [Google Scholar]
  8. Zhao, Y.; Zhang, M.Z. TCM master ZHANG Da-ning’s experience of couplet medicines in treating diabetic nephropathy. China J. Tradit. Chin. Med. Pharm. 2021, 36, 7120–7122. [Google Scholar]
  9. Zhang, D.N. Study on the law of traditional Chinese medicine prescription in type 2 diabetic nephropathy stage III based on literature. Liaoning Univ. Tradit. Chin. Med. Master Dissertation. 2021. [Google Scholar]
  10. Jeong, S.C.; Tulasi, R.; Koyyalamudi, S.R. Antioxidant capacities of hot water extracts and endopolysaccharides of selected Chinese medicinal fruits. Cancers 2016, 8, 33. [Google Scholar] [CrossRef] [Green Version]
  11. Jin, Z.J.; Jin, J.; Xiao, Z.G.; Wu, F.H. Advances in research on pharmacological effects and clinical application of Ligustri Lucidi Fructus. Pharm. Care Res. 2011, 11, 189–192. [Google Scholar] [CrossRef]
  12. Zhang, J.F.; He, M.L.; Dong, Q. Aqueous extracts of Fructus Ligustri Lucidi enhance the sensitivity of human colorectal carcinoma DLD-1 Cells to doxorubicin-induced apoptosis via Tbx3 suppression. Integr. Cancer Ther. 2011, 10, 85–91. [Google Scholar] [CrossRef]
  13. Pang, Z.T.; Zhou, Z.Y.; Wang, W.; Ma, Y.N.; Niu, F.J.; Zhang, X.L.; Han, C.C. The advances in research on the pharmacological effects of Fructus Ligustri Lucidi. BioMed Res. Int. 2015, 2015, 281873. [Google Scholar] [CrossRef] [Green Version]
  14. Wang, J.L.; Shan, A.S.; Liu, T.Y.; Zhang, C.; Zhang, Z.W. In vitro immunomodulatory effects of an oleanolic acid-enriched extract of Ligustrum lucidum fruit (Ligustrum lucidum supercritical CO2 extract) on piglet immunocytes. Int. Immunopharmacol. 2012, 14, 758–763. [Google Scholar] [CrossRef]
  15. Peng, X.Y.; Li, Q.Y.; Rao, F.; Mao, L.Z.; Zhang, Y.Q. Experimental study on hypoglycemic effect of Compound Fructus ligustri lucidi. Shanghai Lab. Anim. Sci. 2001, 21, 103–105. [Google Scholar]
  16. Gao, L.L.; Li, C.; Wang, Z.M.; Liu, X.Q.; You, Y.; Wei, H.; Guo, T. Ligustri Lucidi Fructus as a traditional chinese medicine: A review of its phytochemistry and pharmacology. Nat. Prod. Res. 2015, 29, 493–510. [Google Scholar] [CrossRef]
  17. Zhang, Y.; Liu, L.; Gao, J.; Wu, C.; Han, L.; Liu, E.; Shi, P.; Gao, X.; Wang, T. New secoiridoids from the fruits of Ligustrum lucidum Ait with triglyceride accumulation inhibitory effects. Fitoterapia 2013, 91, 107–112. [Google Scholar] [CrossRef]
  18. Huang, G.J.; Huang, M.H.; Chi, C.S.; Huang, S.S.; Shie, P.H.; Yen, M.T. Analgesic and anti-inflammatory activities of aqueous extracts of Fructus Ligustri Lucidi. Food Drug Anal. 2012, 20, 617–627. [Google Scholar]
  19. Jeong, J.C. Fructus ligustri lucidi extracts induce HumanGlioma cell death through regulation of Akt/mTOR pathway in vitro and reduce glioma tumor growth in U87MG xenograft mouse model. Phytother. Res. 2011, 25, 429–434. [Google Scholar]
  20. Xu, Y. Hypoglycemic and Hypolipidemic Activities and Oleanolic Acid Derivatization of Fructus Ligustri Lucidi. Master’s Thesis, Jilin Agricultural University, Jilin, China, 2016. [Google Scholar]
  21. Chen, Q.; Yang, L.; Zhang, G.; Wang, F. Bioactivity-guided Isolation of antiosteoporotic compounds from Ligustrum lucidum. Phytotherapy research 2013, 27, 973–979. [Google Scholar] [CrossRef]
  22. Li, Y.; Zuo, Y.; Sun, W.J. Study on Antiox idant Activity of Two Major Secoiridoid Glucosides in the Fruits of Ligustrum lucidum Ait. J. Chin. Med. Mater. 2007, 30, 543–546. [Google Scholar]
  23. Cai, Z.; Shi, L.F.; Hu, J.H.; Shen, Q. Effects of specnuezhenide on the proliferation ability of lymphocytes and cytotoxicity of natural killer cells in murine splenocytes in vitro. Acad. J. Nav. Med. Univ. 1998, 19, 77–79. [Google Scholar]
  24. Jiang, Q.; Jiang, H.Q.; Li, H.F.; Zhang, X.L. Contents dynamic changes of four secoiridoid glycosides under steaming time spans with wine in Ligubtrum Lucidum Ait. Chin. Tradit. Pat. Med. 2014, 36, 2561–2564. [Google Scholar]
  25. Jiang, Q.; Jiang, H.Q.; Li, H.F.; Zhang, X.L. Contents changes of five phenylethanols under steaming time spans with wine in Ligustri Lucidi Fructus. Chin. J. Exp. Tradit. Med. Formulae 2014, 20, 60–63. [Google Scholar]
  26. Li, H.F.; Zhang, X.L.; Zhao, Z.T. Protective effects of Ligustri lucidi Fructus steamed with wine on oxidative damage to testis of rats with kidney-yin deficiency. Chin. Tradit. Pat. Med. 2014, 36, 2144–2147. [Google Scholar]
  27. Liu, Y.H. Otective effects of different processed products of Ligustrum lucidum on liver injury in mice. Heilongjiang Sci. Technol. Inf. 2014, 32, 124. [Google Scholar]
  28. Xia, W.; Shi, A.; Shen, T.; Wang, L.; Zhang, F.; Wei, Y. Hepatorenal protective effect of wine steaming of Ligustri lucidi Fructus on rats with liver—kidney Yin deficiency induced by anger. Chin. J. Clin. Pharmacol. 2022, 38, 1491–1495. [Google Scholar]
  29. Wang, C.; Wang, L.P.; Huo, J.X.; Zhang, X.H.; Wang, Q.S.; Chen, Y.S. Study on the effect of glossy privet fruit extract on blood glucose and Lipid metabolism and oxidative stress in diabetic nephropathy rats. Acta Chin. Med. 2017, 32, 1430–1433. [Google Scholar]
  30. Wang, Y.; Feng, K.; Li, M.; Han, L.; Wang, W.; Si, D.; Chen, X.; Yang, W.; Gao, X.; Liu, E. Identification of prototypes from Ligustri Lucidi Fructus in rat plasma based on a data-dependent acquisition and multicomponent pharmacokinetic study. Biomed. Chromatogr. 2020, 34, e4833. [Google Scholar] [CrossRef]
  31. Chen, B.B.; Tang, J.F.; Niu, M. Comparative study of the pharmacokinetic parameters for salidroside in normal and estrogen-deficient female rats after oral administration of an aqueous extract of Fructus Ligustri Lucidi using a validated ultra-performance liquid chromatography mass. Pharmacogn. Mag. 2020, 16, 471–478. [Google Scholar]
  32. Zhang, D.J.; Sun, L.; Li, H.; Cui, Y.L.; Liu, S.; Wu, P.; Zhao, D.; Zhao, P.; Zhang, X.L. Pharmacokinetic comparison of nine bioactive components in rat plasma following oral administration of raw and wine-processed Ligustri Lucidi Fructus by ultra-high-performance liquid chromatography coupled with triple quadrupole mass spectrometry. J. Sep. Sci. 2020, 43, 3995–4005. [Google Scholar] [CrossRef]
  33. Zhang, D.J.; Zhao, P.; Luan, R.Q.; Wang, Y.; Zhou, Q.; Zhang, Z.H.; Zhang, X.L. Effect of Wine Steaming on the Distribution in Vivo of Active Compounds in Ligustri Lucidi Fructus. J. Chin. Med. Mater. 2021, 7, 1605–1610. [Google Scholar]
  34. Wu, G.X.; Zhang, Z.L. Comparative Study on Effect of Liquor -processed Achyranthe Products on In-vitro Thrombosi in Rats. Henan Tradit. Chin. Med. 2009, 29, 753–755. [Google Scholar]
  35. Qiu, F.; Jin, Z.; Yan, S.X.; Jiang, H.Y.; Liang, T.J. Study on activating blood circulation to dissipate blood stasis of five water extracts from Polyonum cuspidatum wine-prepared pieces. Lishizhen Med. Mater. Med. Res. 2013, 24, 2903–2904. [Google Scholar]
  36. Sagoo, M.K.; Gnudi, L. Diabetic nephropathy: Is there a role for oxidative stress? Free. Radic. Biol. Med. 2018, 116, 50–63. [Google Scholar] [CrossRef] [Green Version]
  37. Srinivasan, K.; Viswanad, B.; Asrat, L.; Kaul, C.L.; Ramarao, P. Combination of high fat diet-fed and low-dose streptozotocin-treated rat: A model for type 2 diabetes and pharmacological screening. Pharmacol. Res. 2005, 52, 313–320. [Google Scholar] [CrossRef]
  38. Asrafuzzaman, M.; Cao, Y.; Afroz, R.; Kamato, D.; Gray, S.; Little, P.J. Animal models for assessing the impact of natural products on the aetiology and metabolic pathophysiology of Type 2 diabetes. Biomed. Pharmacother. 2017, 89, 1242–1251. [Google Scholar] [CrossRef]
  39. Skovso, S. Modeling type 2 diabetes in rats using high fat diet and streptozotocin. J. Diabetes Investig. 2014, 5, 349–358. [Google Scholar] [CrossRef]
  40. Brownlee, M. The pathobiology of diabetic complications—A unifying mechanism. Diabetes 2005, 54, 1615–1625. [Google Scholar] [CrossRef]
  41. Achi, N.K.; Ohaeri, O.C.; Ijeh, I.I.; Eleazu, C. Modulation of the lipid profile and insulin levels of streptozotocin induced diabetic rats by ethanol extract of Cnidoscolus aconitifolius leaves and some fractions: Effect on the oral glucose tolerance of normoglycemic rats. Biomed. Pharmacother. 2017, 86, 562–569. [Google Scholar] [CrossRef]
  42. Zhang, H.J.; Zhao, T.T.; Gong, Y.W.; Dong, X.; Zhang, W.K.; Sun, S.F.; Wang, H.; Gu, Y.T.; Lu, X.G.; Yan, M.H.; et al. Attenuation of diabetic nephropathy by Chaihuang-Yishen granule through anti-inflammatory mechanism in streptozotocin-induced rat model of diabetics. J. Ethnopharmacol 2014, 151, 556–564. [Google Scholar] [CrossRef]
  43. Lei, Z.X.; Luo, R.; Dong, X.L.; Zhong, X.Y. Establishment of STZ-induced diabetic nephropathic rat model. Acta Lab. Anim. Sci. Sin. 2005, 13, 163–165. [Google Scholar]
  44. Kim, K.S.; Yang, H.Y.; Song, H.; Kang, Y.R.; Kwon, J.; An, J.; Son, J.Y.; Kwack, S.J.; Kim, Y.M.; Bae, O.N.; et al. Identification of a sensitive urinary biomarker, selenium-binding protein 1, for early detection of acute kidney injury. J. Toxicol. Environ. Health 2017, 80, 453–464. [Google Scholar] [CrossRef] [PubMed]
  45. Jha, J.C.; Ho, F.; Dan, C.; Jandeleit-Dahm, K. A causal link between oxidative stress and inflammation in cardiovascular and renal complications of diabetes. Clin. Sci. 2018, 132, 1811–1836. [Google Scholar] [CrossRef]
  46. Luan, R.Q.; Sun, L.; Zhang, X.L.; Zhao, P.; Zhou, Q.; Zhang, Z.H. The Protective Effect of Ethyl Acetate and n-Butanol Fractions of Wine-Steamed Ligustri Lucidi Fructus on Diabetic Nephropathy in Rats. Evid.-Based Complement. Altern. Med. 2021, 2021, 6512242. [Google Scholar] [CrossRef] [PubMed]
  47. Konstantinidou, V.; Covas, M.I.; Muñoz-Aguayo, D.; Khymenets, O.; de la Torre, R.; Saez, G.; del Carmen Tormos, M.; Toledo, E.; Marti, A.; Ruiz-Gutiérrez, V.; et al. In vivo nutrigenomic effects of virgin olive oil polyphenols within the frame of the mediterranean diet: A randomized controlled trial. FASEB J. Off. Publ. Fed. Am. Soc. Exp. Biol. 2010, 24, 2546–2557. [Google Scholar]
  48. Tian, X.Y.; Li, M.X.; Lin, T. A review on the structure and pharmacological activity of phenylethanoid glycosides. Eur. J. Med. Chem. 2010, 209, 112563. [Google Scholar] [CrossRef]
  49. Zhang, X.L.; Song, M.H.; Jiang, Q.; Li, H.F.; Xu, B.X.; Luan, R.Q.; Diao, J.W. Research on transformation mechanism of secoiridoid glycosides components in Ligubtrum lucidum before and after processing. Liaoning J. Tradit. Chin. Med. 2017, 12, 2602–2604. [Google Scholar]
  50. Xi, Y.Y.; Diao, J.W.; Zhang, X.L.; Li, Z.M.; Guo, C.C.; Li, H.F.; Xu, B.X.; Luan, R.Q. Pharmacokinetic behaviors of four constituents in Ligustrum lucidum in rat plasma. Chin. Tradit. Pat. Med. 2018, 40, 1721–1726. [Google Scholar]
  51. Liang, X.; Wu, P.; Zhang, X.L. Identification and Comparison of Constituents of Different Processed Products of Ligubtrum lucidum Fruit by HPLC Fingerprint. J. Chin. Med. Mater. 2015, 38, 2288–2292. [Google Scholar]
Figure 1. HPLC chromatograms of (A) LLF in 280 nm; (B) LLF in 240 nm; (C) WLL in 280 nm; (D) WLL in 240 nm. 1: hydroxytyrosol; 2: salidroside; 3: nuezhenidic acid; 4: oleoside-11-methyl ester; 5: specnuezhenide; 6: 1‴-O-β-d-glucosylformoside; 7: G13; 8: oleonuezhenide.
Molecules 28 00791 g001
Figure 2. The contents and proportion of the eight active ingredients in LLF and WLL extracts.
Molecules 28 00791 g002
Figure 3. Effects of LLF and WLL extracts on blood glucose levels in DN rats. Significant differences with the Control group were designated as ## p < 0.01. Significant differences with the Model group were designated as * p < 0.05, ** p < 0.01.
Molecules 28 00791 g003
Figure 4. Effects of LLF and WLL extracts on SCr (A), BUN (B), 24-h urine volume (C), 24-h Upro (D), and kidney index (E) in DN rats. Significant differences with the Control group were designated as ## p < 0.01. Significant differences with the Model group were designated as * p < 0.05, ** p < 0.01.
Molecules 28 00791 g004
Figure 5. Effects of LLF and WLL extracts on (A) TC, (B) TG, (C) HDL-C, and (D) LDL-C in DN rats. Significant differences with the Control group were designated as ## p < 0.01. Significant differences with the Model group were designated as ** p < 0.01.
Molecules 28 00791 g005
Figure 6. Effects of LLF and WLL extracts on (A) IL-1β, (B) TNF-α, (C) IL-6 in DN rats. Significant differences with the Control group were designated as ## p < 0.01. Significant differences with the Model group were designated as * p < 0.05, ** p < 0.01.
Molecules 28 00791 g006
Figure 7. The effect of LLF and WLL extracts on kidney histopathological changes in DN rats (×200), stained with HE. (A) Control group kidney tissue; (B) Model group kidney tissue; (C) LLF group kidney tissue; (D) WLL group kidney tissue; (E) MET group kidney tissue.
Molecules 28 00791 g007
Figure 8. Heatmap of the correlations between the active components of LLF and WLL extracts and physicochemical parameters of kidney protective effects in rats.
Molecules 28 00791 g008
Figure 9. Mean plasma concentration-time curves of salidroside (A), hydroxytyrosol (B), nuezhenidic acid (C), oleoside-11-methyl ester (D), specnuezhenide (E), 1‴-O-β-d-glucosylformoside (F), G13 (G), and oleonuezhenide (H) in DN rats after oral administration of LLF and WLL extracts.
Molecules 28 00791 g009
Figure 10. Kidney distribution profiles of the eight components in rats after oral administration of LLF and WLL extracts. Values are presented as the mean ± SD, n = 6. Significant differences with LLF group were designated as * p < 0.05, ** p < 0.01.
Molecules 28 00791 g010
Figure 11. Chemical structures of (1) hydroxytyrosol, (2) salidroside, (3) nuezhenidic acid, (4) oleoside-11-methyl ester, (5) specnuezhenide, (6) 1‴-O-β-d-glucosylformoside, (7) G13, (8) oleonuezhenide, and (9) geniposide.
Molecules 28 00791 g011
Table 1. Calibration curve, r, and linear range for the eight components (n = 5).
ComponentsCalibration CurvesrLinear Range (µg)
HydroxytyrosolY = 970,807X − 3559.80.99990.001–0.2
SalidrosideY = 113,443X + 685.480.99970.009–1.8
Nuezhenidic acidY = 649,376X − 6312.80.99980.01–2.0
Oleoside-11-methyl esterY = 490,125X + 2120.99970.001–0.2
SpecnuezhenideY = 549,540X − 12,0820.99980.019–3.8
1‴-O-β-d-glucosylformosideY = 489,602X + 2275.40.99970.001–0.2
G13Y = 617,621X – 37,4940.99940.01–2.0
OleonuezhenideY = 498,752X − 158.750.99990.008–1.6
Table 2. Contents of the eight active ingredients in extracts of LLF and WLL (mean ± SD, n = 5, mg/g).
IngredientsLLF ExtractWLL Extract
Hydroxytyrosol2.70 ± 0.359.23 ± 0.54
Salidroside6.93 ± 0.52274.35 ± 0.57
Nuezhenidic acid1.75 ± 0.6336.56 ± 0.58
Oleoside-11-methyl ester42.66 ± 0.533.92 ± 0.87
Specnuezhenide252.01 ± 0.61106.48 ± 0.48
1‴-O-β-d-glucosylformoside6.23 ± 0.352.32 ± 0.42
G13148.84 ± 0.6813.82 ± 0.58
Oleonuezhenide103.28 ± 0.364.35 ± 0.478
Table 3. The body weight, food consumption, and water intake (g) (n = 10).
GroupBody Weight (g)Food Consumption (g/24 h)Water Intake (mL/24 h)
Control542.18 ± 39.2724.82 ± 0.8449.55 ± 6.64
Model275.35 ± 49.32 ##48.26 ± 1.86 ##340.00 ± 15.12 ##
LLF297.64 ± 48.4745.54 ± 1.95 *228.00 ± 17.50 **
WLL377.91 ± 51.10 **43.28 ± 3.33 **170.00 ± 11.64 **
MET385.34 ± 42.77 **39.46 ± 2.51 **200.00 ± 12.12 **
Significant differences with control group were designated as ## p < 0.01. Significant differences with Model group were designated as * p < 0.05, ** p < 0.01.
Table 4. Calibration curve, r, linear range, and LLOQ for the eight analytes in the plasma (n = 6).
ComponentsCalibration CurvesrLinear Range (ng/mL)LLOQ (ng/mL)
SalidrosideY = 0.4667X − 0.69660.99950.5–10000.5
HydroxytyrosolY = 0.773X + 0.60440.99991.8–36001.8
Nuezhenidic acidY = 2.224X + 8.4820.99950.5–10000.5
Oleoside-11-methyl esterY = 0.7759X − 0.8970.99910.5–10000.5
1‴-O-β-D-glucosylformosideY = 3.254X + 26.3630.99950.5–10000.5
SpecnuezhenideY = 10.039X + 96.8650.99940.5–10000.5
G13Y = 0.152X + 5.25720.99990.3–6000.3
OleonuezhenideY = 0.4438X + 2.62250.99940.3–6000.3
Table 5. Pharmacokinetic parameters of the eight ingredients after oral administration of LLF and WLL extracts (n = 6, mean ± SD).
ComponentsParametersLLFWLL
SalidrosideAUC0–12h (ng/mL·h)297.03 ± 40.542527.81 ± 489.80 **
AUC0–∞ (ng/mL·h)423.82 ± 142.22570.35 ± 492.79 **
MRT0–12 (h)4.27 ± 0.383.24 ± 0.41 **
MRT0–∞ (h)3.81 ± 0.173.70 ± 0.39
t1/2z (h)6.57 ± 2.792.06 ± 0.61 **
Tmax (h)0.39 ± 0.100.90 ± 0.14 **
CLz/F (L/h/kg)0.04 ± 0.030.01 ± 0.00 **
Vz/F (L/kg)0.37 ± 0.280.02 ± 0.01 **
Cmax (mg/L)60.06 ± 1.24697.01 ± 131.21 **
HydroxytyrosolAUC0–12h (ng/mL·h)5021.97 ± 474.7510,902.26 ± 338.71 **
AUC0–∞ (ng/mL·h)5580.80 ± 387.8811,473.66 ± 426.50 **
MRT0–12 (h)3.64 ± 0.073.04 ± 0.02 **
MRT0–∞ (h)5.29 ± 0.153.70 ± 0.23 **
t1/2z (h)3.75 ± 0.573.06 ± 0.72
Tmax (h)0.50 ± 0.000.75 ± 0.00
CLz/F (L/h/kg)3.60 ± 0.261.31 ± 0.05 **
Vz/F (L/kg)19.59 ± 4.485.75 ± 1.21
Cmax (mg/L)1694.35 ± 5.233462.78 ± 108.62 **
Nuezhenidic acidAUC0–12h (ng/mL·h)286.53 ± 21.711615.14 ± 53.47 **
AUC0–∞ (ng/mL·h)288.48 ± 22.031639.94 ± 64.38 **
MRT0–12 (h)4.30 ± 0.022.43 ± 0.06 **
MRT0–∞ (h)4.37 ± 0.022.58 ± 0.05 **
t1/2z (h)1.17 ± 0.412.24 ± 0. 60 *
Tmax (h)0.75 ± 0.001.00 ± 0.00
CLz/F (L/h/kg)0.05 ± 0.000.01 ± 0.00
Vz/F (L/kg)0.09 ± 0.030.03 ± 0.01 **
Cmax (mg/L)45.50 ± 3.00766.20 ± 62.39 **
Oleoside-11-methyl esterAUC0–12h (ng/mL·h)2537.42 ± 67.832021.07 ± 99.67 *
AUC0–∞ (ng/mL·h)4201.31 ± 1029.352157.23 ± 179.31 **
MRT0–12 (h)3.78 ± 0.023.51 ± 0.09
MRT0–∞ (h)5.71 ± 1.634.16 ± 0.41
t1/2z (h)11.51 ± 5.782.98 ± 0.83
Tmax (h)0.67 ± 0.140.58 ± 0.14
CLz/F (L/h/kg)3.71 ± 0.876.99 ± 0.56
Vz/F (L/kg)56.90 ± 14.5629.67 ± 6.61 **
Cmax (mg/L)744.81 ± 9.29605.62 ± 14.86 **
SpecnuezhenideAUC0–12h (ng/mL·h)774.79 ± 38.60348.81 ± 7.30 **
AUC0–∞ (ng/mL·h)779.95 ± 43.36349.12 ± 7.50 **
MRT0–12 (h)1.91 ± 0.102.43 ± 0.05 **
MRT0–∞ (h)2.00 ± 0.202.44 ± 0.04 *
t1/2z (h)1.71 ± 0.470.95 ± 0.26
Tmax (h)0.33 ± 0.000.33 ± 0.00
CLz/F (L/h/kg)25.70 ± 1.5057.30 ± 1.23 **
Vz/F (L/kg)62.88 ± 13.7778.34 ± 20.06
Cmax (mg/L)698.99 ± 94.38195.09 ± 6.81 *
1‴-O-β-d-glucosylformosideAUC0–12h (ng/mL·h)901.37 ± 92.32531.78 ± 54.16 *
AUC0–∞ (ng/mL·h)908.80 ± 85.36534.65 ± 53.68 *
MRT0–12 (h)2.30 ± 0.052.00 ± 0.05 *
MRT0–∞ (h)2.40 ± 0.172.07 ± 0.07
t1/2z (h)1.66 ± 0.601.74 ± 0.26
Tmax (h)0.33 ± 0.000.50 ± 0.00
CLz/F (L/h/kg)22.14 ± 2.1837.65 ± 3.62 *
Vz/F (L/kg)54.45 ± 25.3994.25 ± 17.23
Cmax (mg/L)655.39 ± 42.24384.75 ± 38.68 **
G13AUC0–12h (ng/mL·h)1025.82 ± 77.41881.95 ± 39.80 *
AUC0–∞ (ng/mL·h)1072.76 ± 115.48894.63 ± 38.36 *
MRT0–12 (h)2.54 ± 0.262.69 ± 0.16
MRT0–∞ (h)2.73 ± 0.382.85 ± 0.20
t1/2z (h)1.96 ± 1.081.80 ± 0.25
Tmax (h)0.39 ± 0.100.44 ± 0.10
CLz/F (L/h/kg)14.094 ± 1.5616.79 ± 0.71
Vz/F (L/kg)38.91 ± 18.3843.69 ± 7.59
Cmax (mg/L)500.50 ± 20.10377.69 ± 16.56 *
OleonuezhenideAUC0–12h (ng/mL·h)605.12 ± 26.46437.77 ± 9.87 *
AUC0–∞ (ng/mL·h)620.13 ± 27.33446.85 ± 16.81 *
MRT0–12 (h)2.80 ± 0.062.86 ± 0.10
MRT0–∞ (h)2.84 ± 0.122.89 ± 0.08
t1/2z (h)2.11 ± 0.572.05 ± 0.56
Tmax (h)0.39 ± 0.100.75 ± 0.00
CLz/F (L/h/kg)24.22 ± 1.0533.60 ± 1.25 *
Vz/F (L/kg)73.57 ± 19.7698.52 ± 23.73
Cmax (mg/L)300.54 ± 27.04223.92 ± 37.50
Note: * p < 0.05, ** p < 0.01.
Table 6. Calibration curve, r, linear range, and LLOQ for eight analytes in kidney tissue (n = 6).
ComponentsCalibration CurvesrLinear Range (ng/mL)LLOQ (ng/mL)
SalidrosideY = 0.0018X + 0.00119.00–18,0000.99989.00
HydroxytyrosolY= 0.4253X − 49.740012.50–25,0000.99981.50
Nuezhenidic acidY = 0.5417X − 15.0422.75–55000.99962.75
Oleoside-11-methyl esterY = 0.1266X + 0.00191.50–30000.99981.50
1‴-O-β-d-glucosylformosideY= 0.4822X + 24.48003.50–70000.99913.50
SpecnuezhenideY = 1.4842X + 30.09412.50–25,0000.999312.50
G13Y = 0.2276X − 4.52690.50–10000.99980.50
OleonuezhenideY = 0.2761X + 3.58030.50–10000.99930.50
Table 7. Kidney distribution profiles of the eight ingredients after oral administration of LLF and WLL extracts (n = 6, mean ± SD).
ComponentsExtractsConcentration (Mean ± SD, µg/g)
30 min60 min120 min240 min
SalidrosideLLF1.876 ± 0.2342.280 ± 0.4321.805 ± 0.4021.299 ± 0.237
WLL1.995 ± 0.6652.506 ± 0.6023.080 ± 0.7381.894 ± 0.469 *
HydroxytyrosolLLF3.191 ± 0.282 1.551 ± 0.375 1.016 ± 0.314 0.321 ± 0.177
WLL4.763 ± 0.568 *3.334 ± 0.464 ** 1.777 ±0.584 0.442 ± 0.288
Nuezhenidic acidLLF0.057 ± 0.0100.053 ± 0.0190.028 ± 0.0150.016 ± 0.001
WLL0.150 ± 0.028 *0.270 ± 0.0880.157 ± 0.0500.076 ± 0.020 *
Oleoside-11-methyl esterLLF0.079 ± 0.0190.171 ± 0.0150.099 ± 0.0210.029 ± 0.003
WLL0.039 ± 0.0020.059 ± 0.007 **0.031 ± 0.002 *0.014 ± 0.001 *
1‴-O-β-d-glucosylformosideLLF0.210 ± 0.0530.458 ± 0.0750.190 ± 0.0400.047 ± 0.013
WLL0.119 ± 0.0110.256 ± 0.0660.159 ± 0.0130.024 ± 0.011 *
SpecnuezhenideLLF0.266 ± 0.0220.494 ± 0.1090.280 ± 0.0400.050 ± 0.016
WLL0.139 ± 0.017 *0.330 ± 0.0100.250 ± 0.0140.040 ± 0.005
G13LLF0.049 ± 0.0170.153 ± 0.0300.056 ± 0.0130.019 ± 0.005
WLL0.027 ± 0.0060.121 ± 0.0220.043 ± 0.013 *0.016 ± 0.002
OleLLF0.032 ± 0.0020.107 ± 0.0180.064 ± 0.0100.010 ± 0.004
WLL0.026 ± 0.0100.075 ± 0.0070.025 ± 0.008 *0.004 ± 0.001
Note: Significant differences with LLF group were designated as * p < 0.05, ** p < 0.01.
Disclaimer/Publisher’s Note: The statements, opinions and data contained in all publications are solely those of the individual author(s) and contributor(s) and not of MDPI and/or the editor(s). MDPI and/or the editor(s) disclaim responsibility for any injury to people or property resulting from any ideas, methods, instructions or products referred to in the content.

