
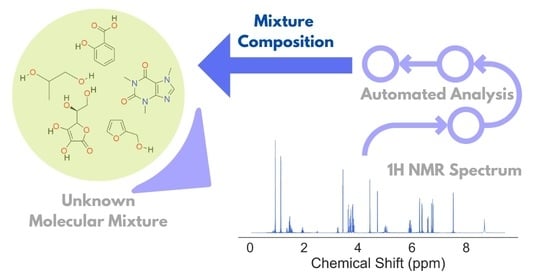
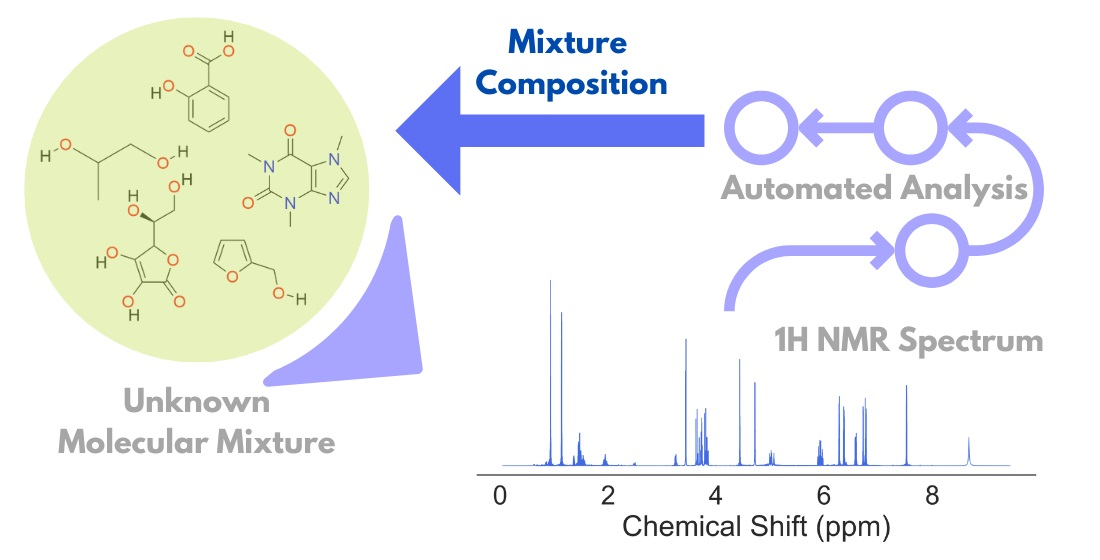
Unsupervised Analysis of Small Molecule Mixtures by Wavelet-Based Super-Resolved NMR


Abstract
1. Introduction
2. Results and Discussion
3. Materials and Methods
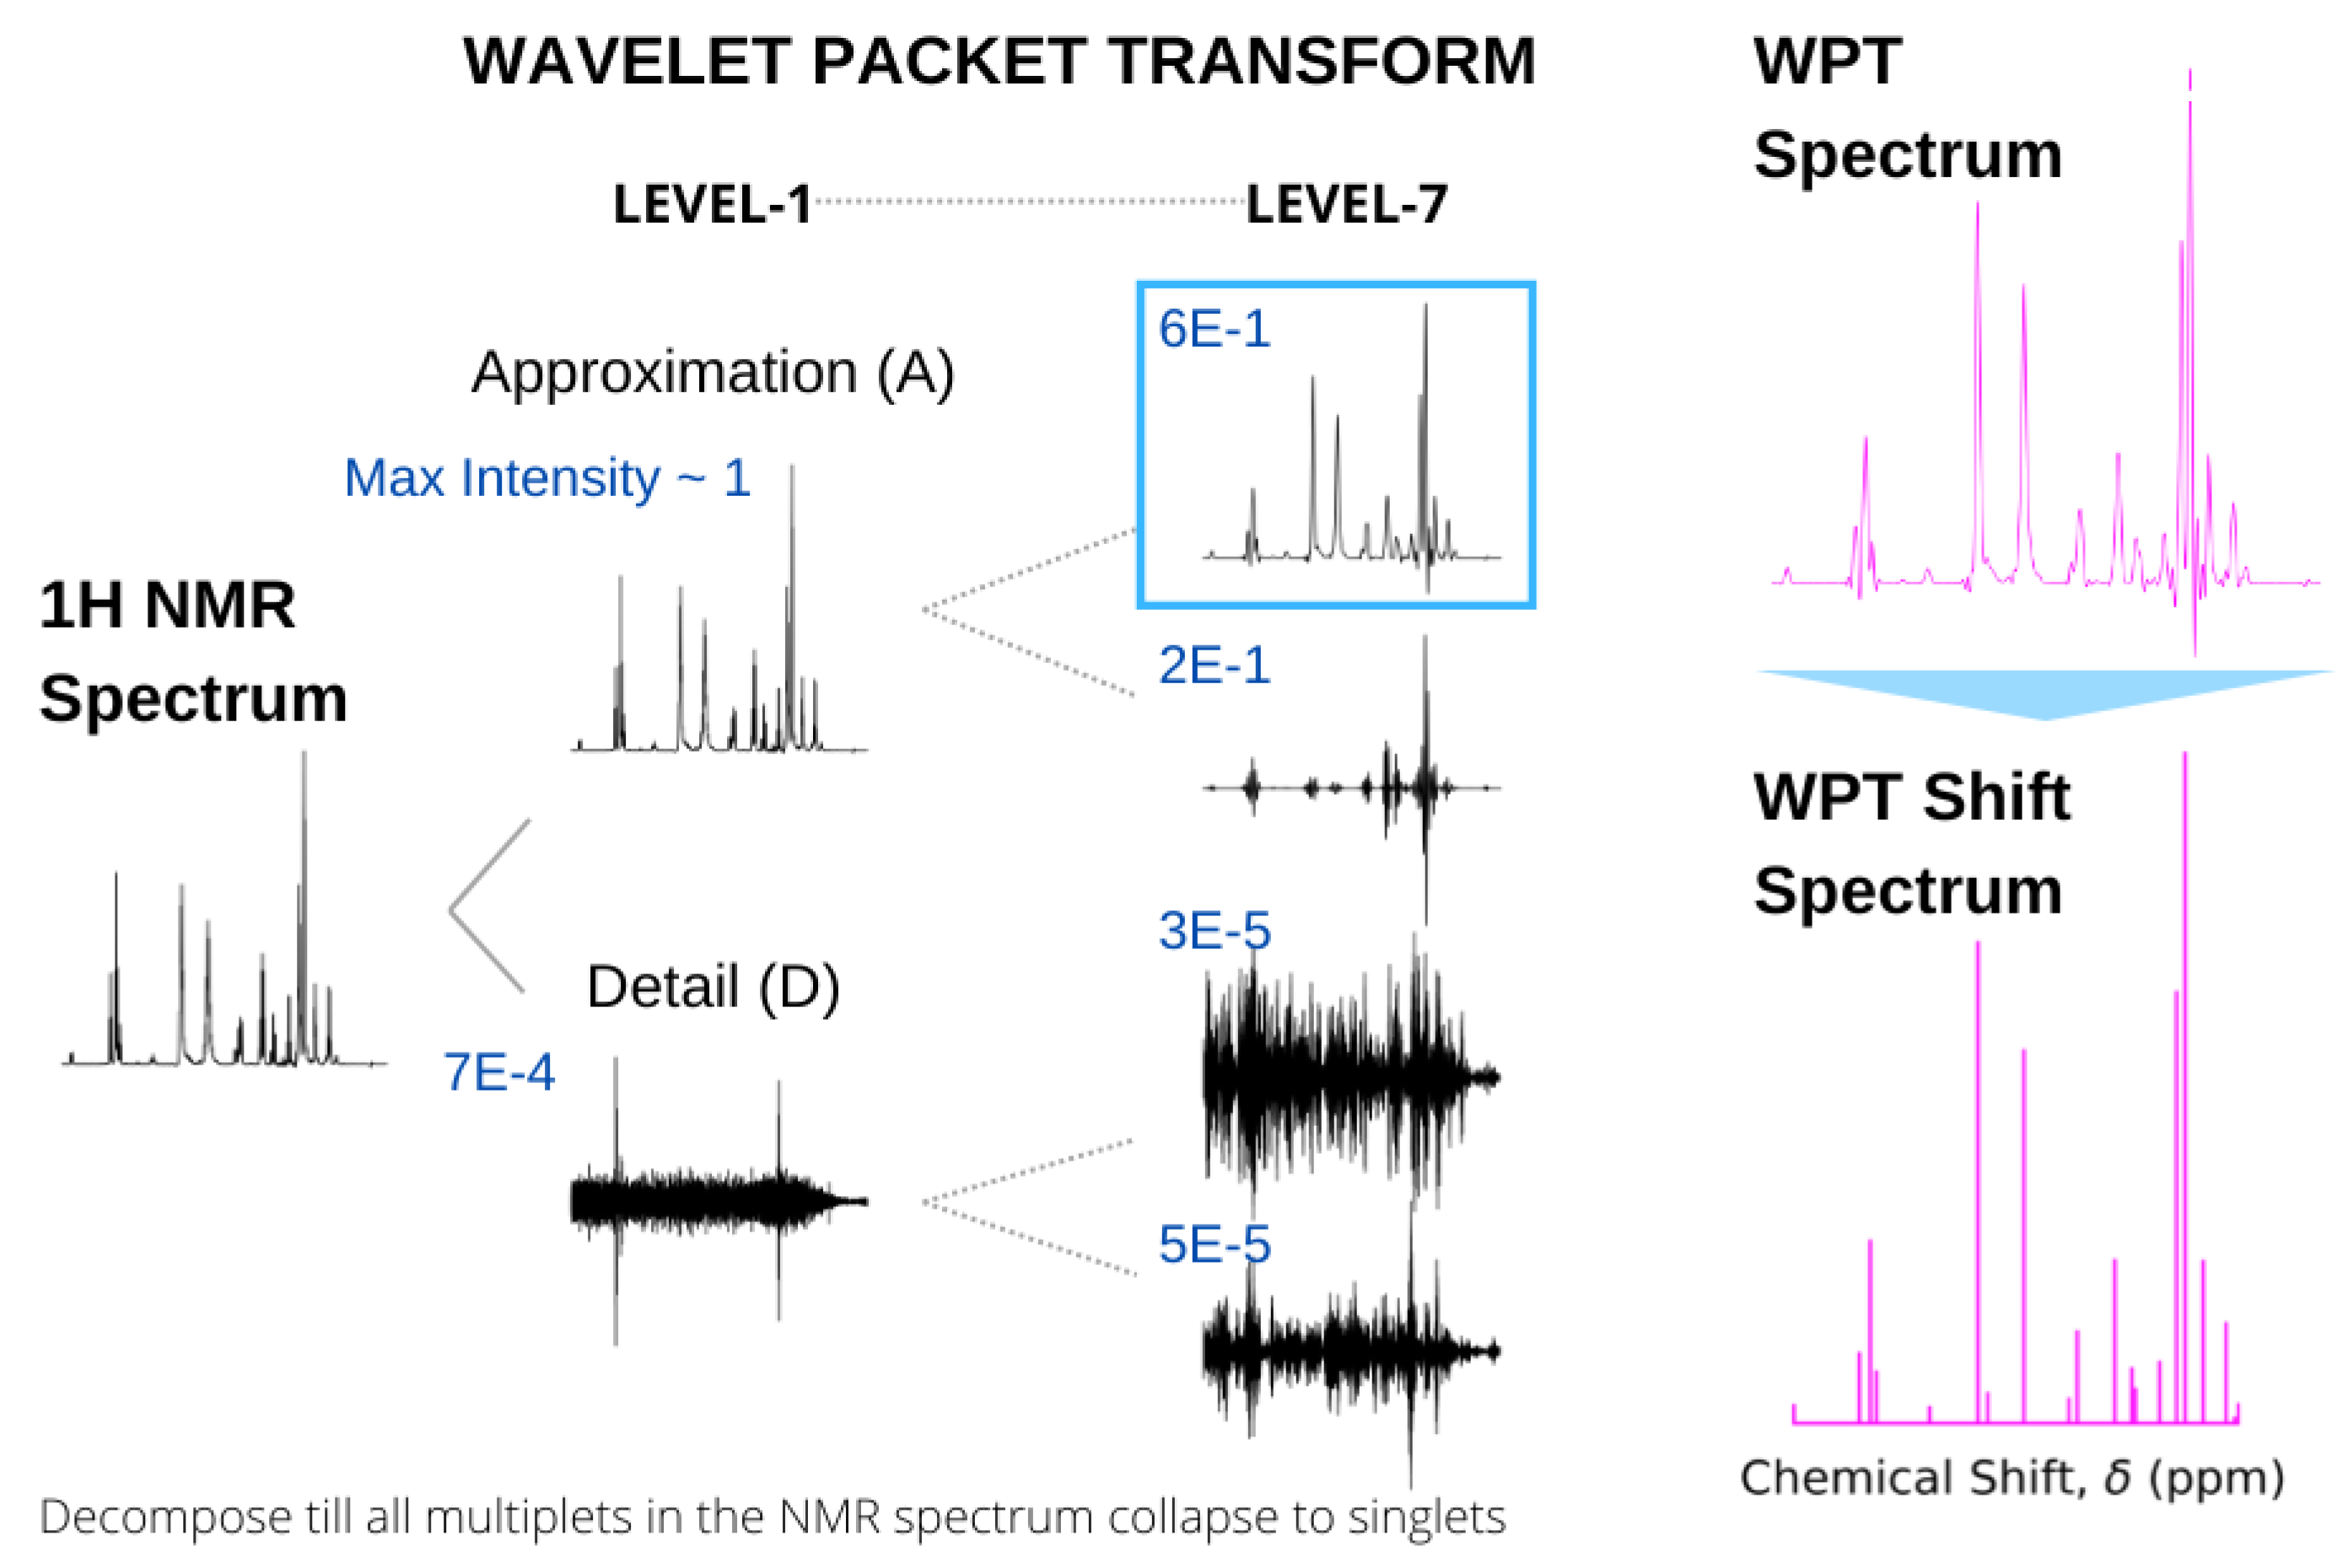
3.1. NMR to WPT Spectral Conversion
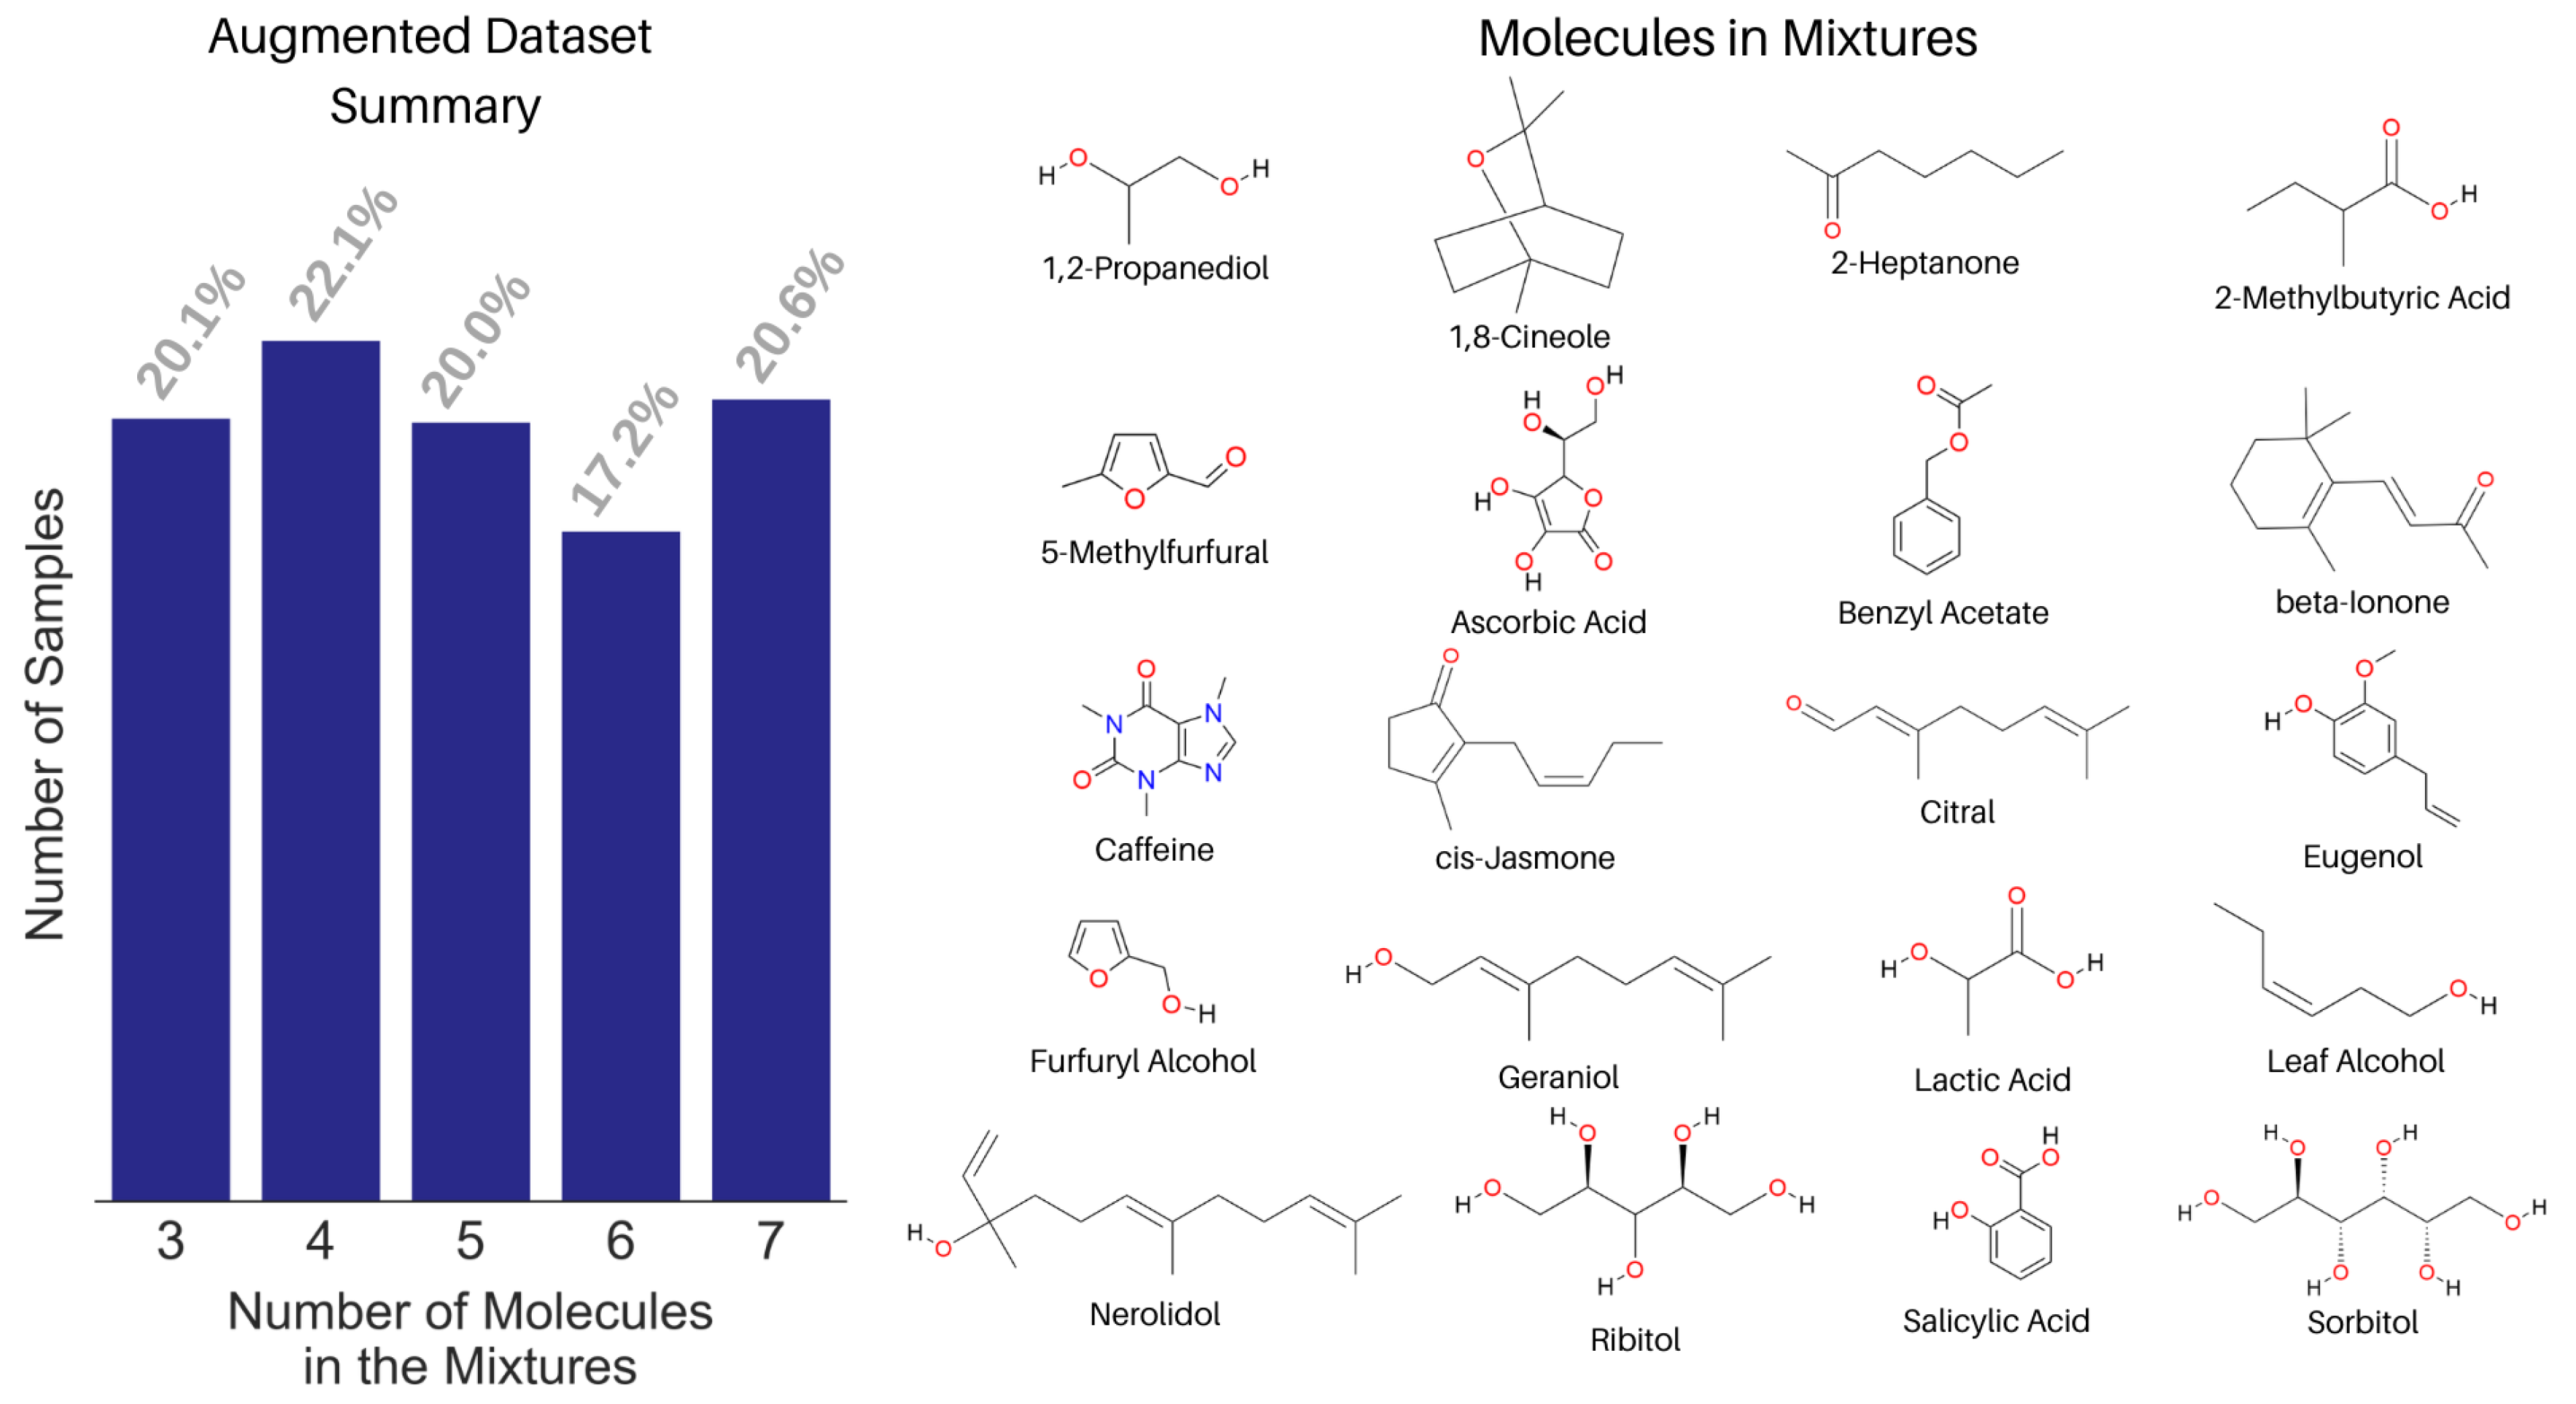
3.2. Spectral Library and Augmented Dataset Creation
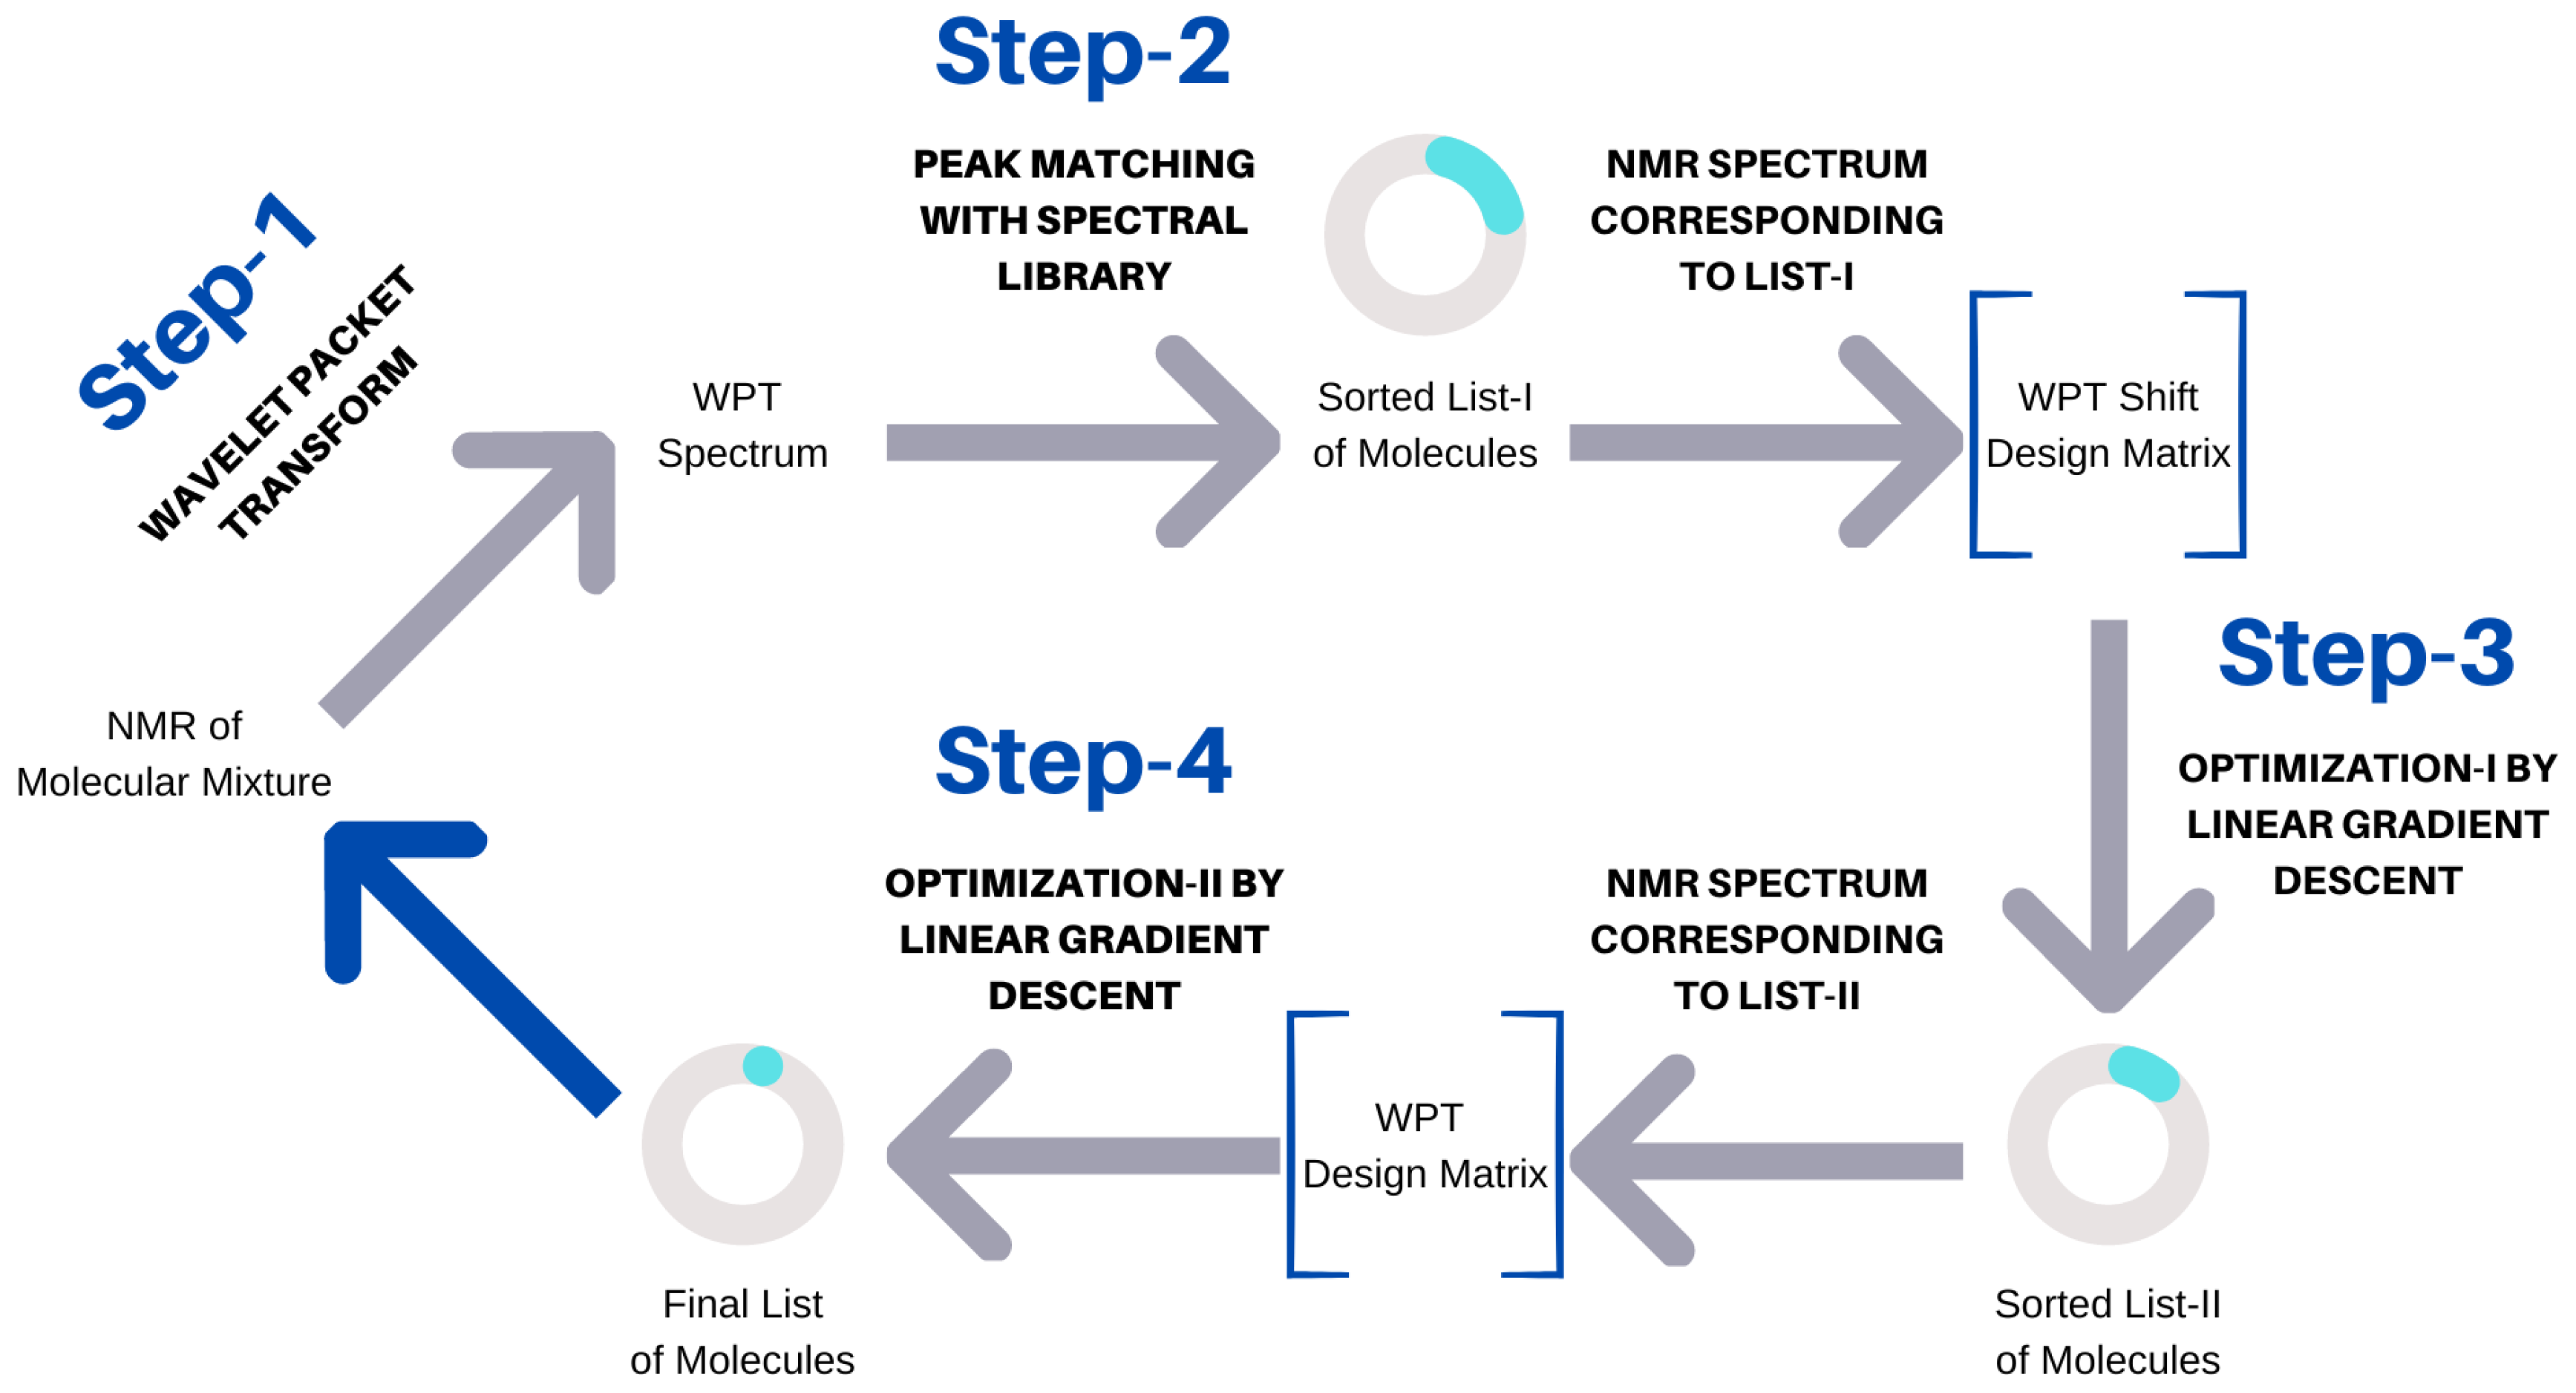
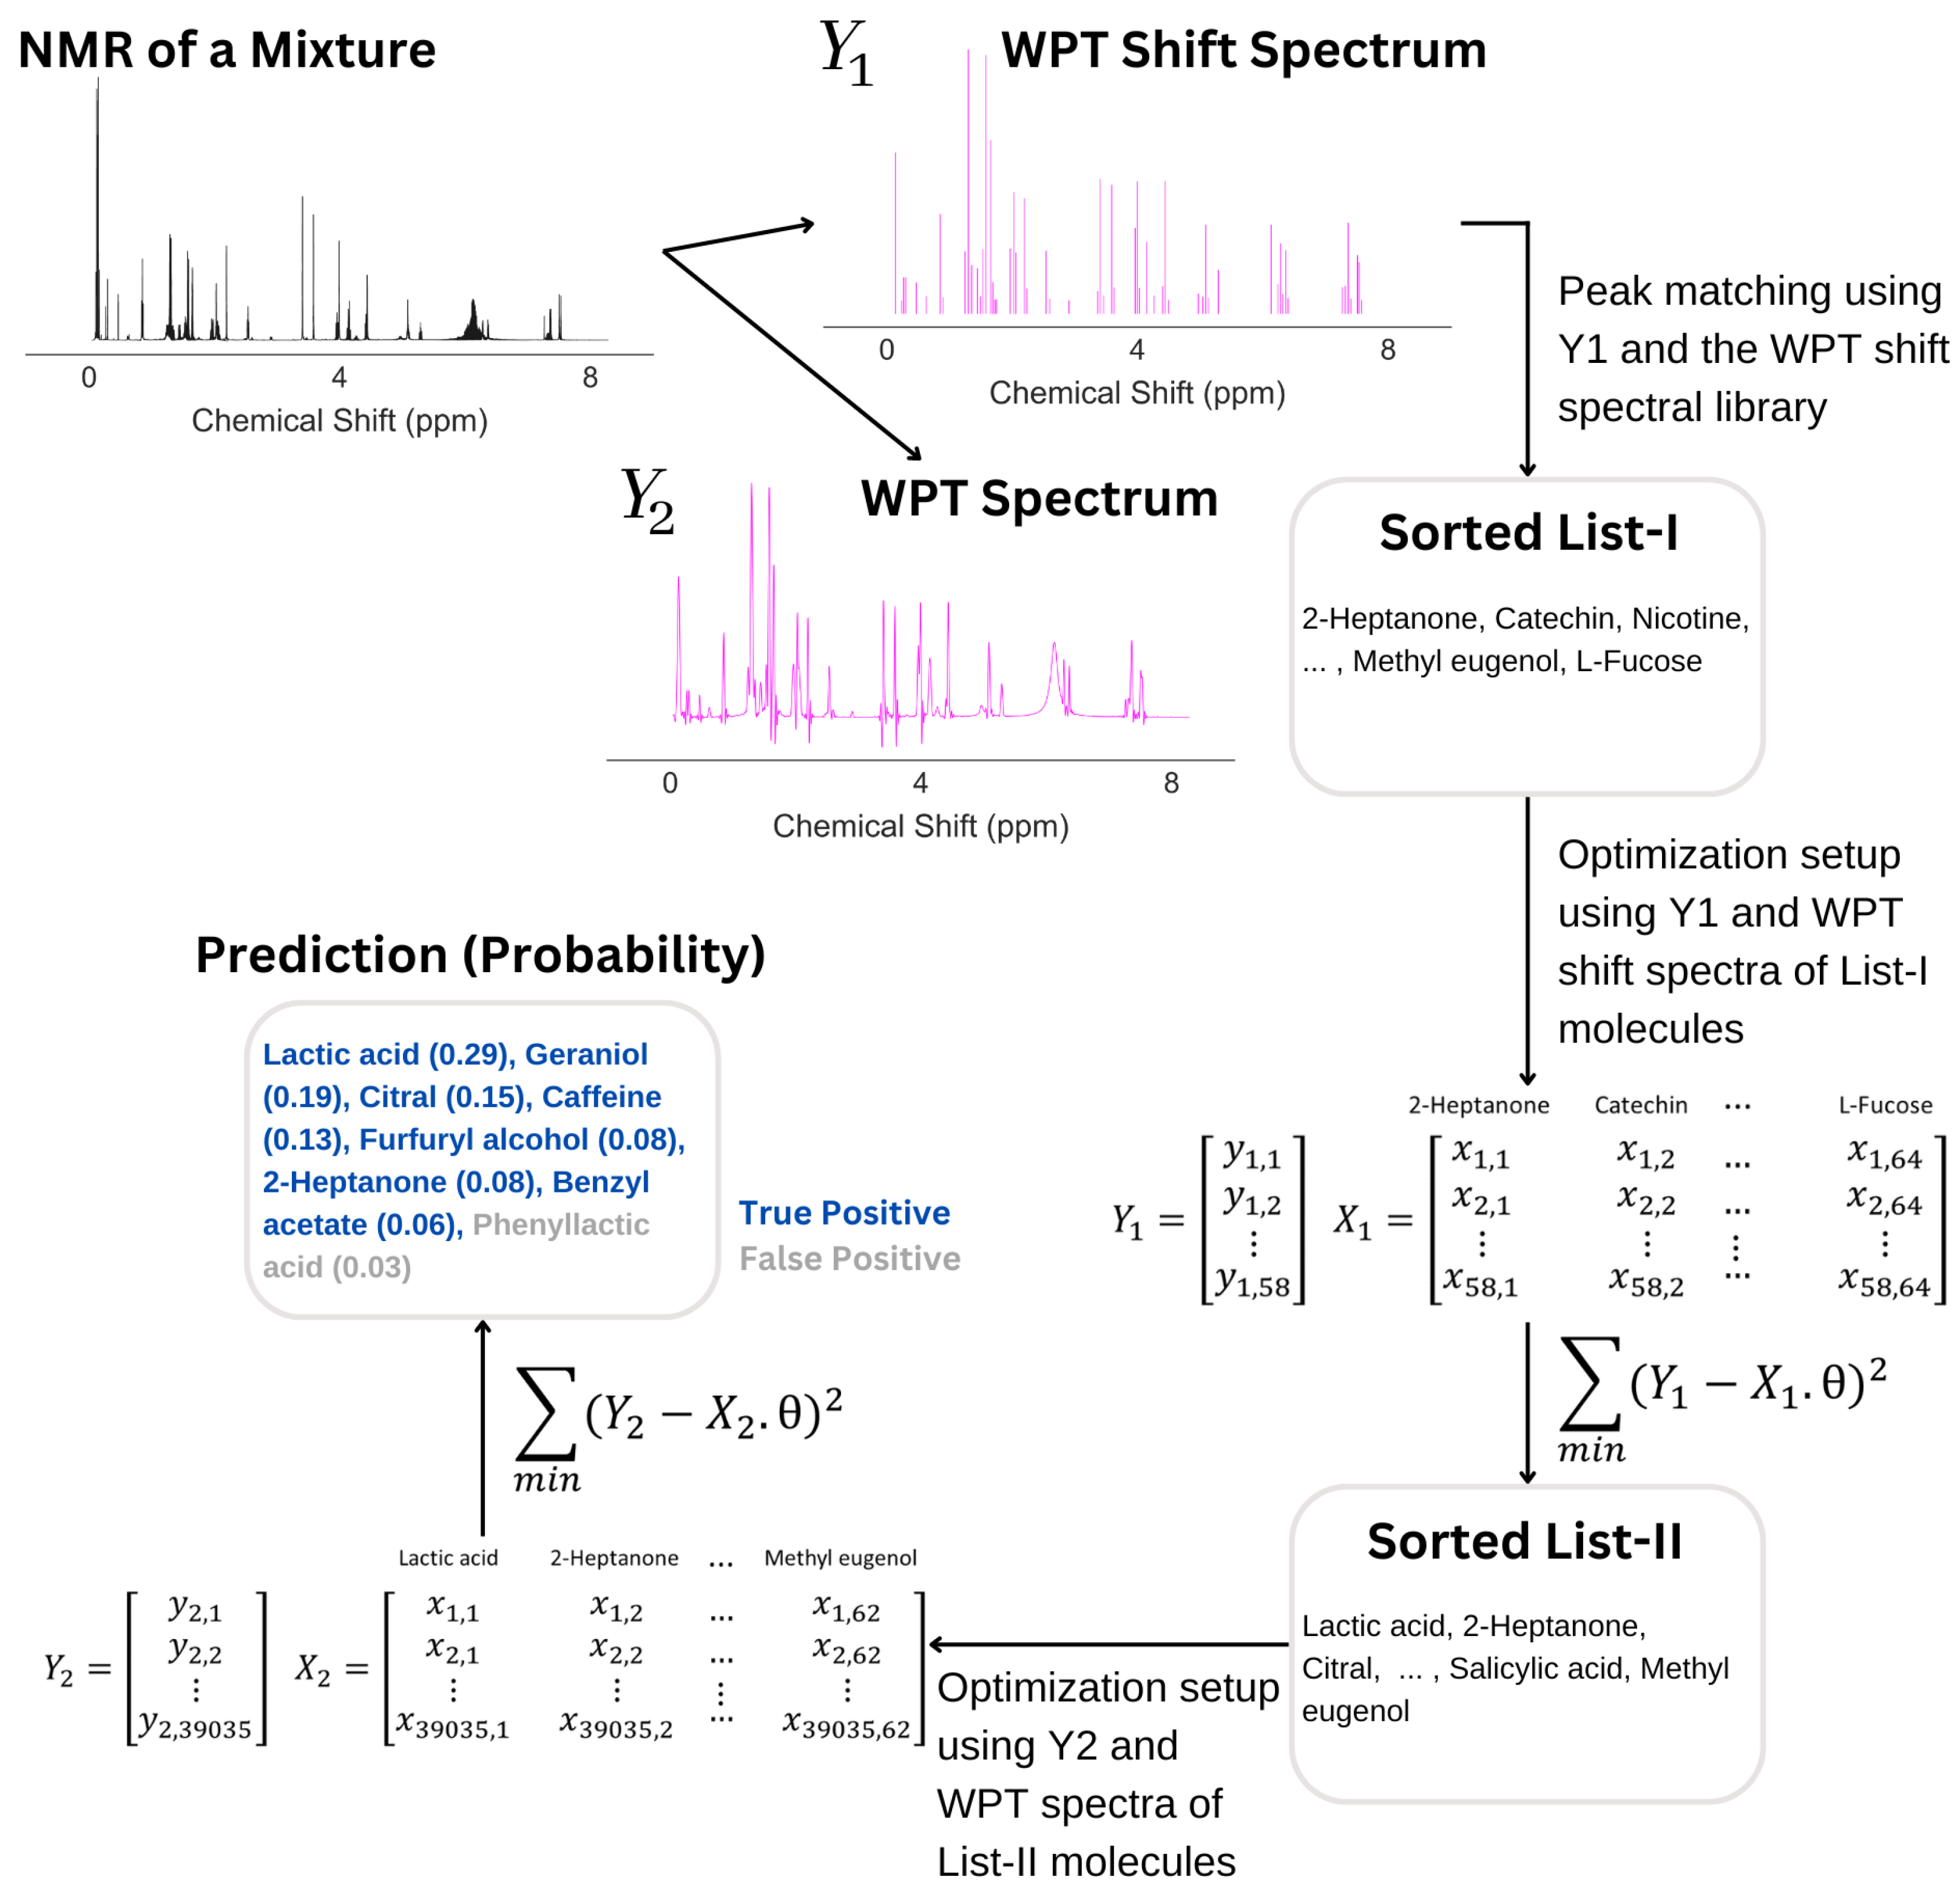
3.3. Automated Spectral Analysis Algorithm
- Calculate WPT and WPT shift spectrum from an NMR spectrum;
- Match the WPT shift spectrum with the WPT shift spectral library:
- (a)
- p = count the number of matches for each molecule in the library;
- (b)
- The probability for a molecule to be in the mixture = p/the number of peaks in the WPT shift spectrum of the molecule;
- (c)
- Continue for all the molecules in the library, and short-list the ones with non-zero probabilities into the list, L I.
- Optimize the short-listed molecules by a gradient descent method:
- (a)
- Define the WPT shift NMR spectrum of a molecular mixture as the target variable, ;
- (b)
- Create a design matrix, , from the intersection of the chemical shift values from and the intensities of the spectra for the molecules in L I;
- (c)
- Minimize , where is the dimension of and is the probabilities associated with the molecules in L I, using a gradient descent method with a learning rate, = 0.1;
- (d)
- An optimized list of molecules, L II, associated with non-zero probabilities is obtained.
- The top 15 entries from L II are used as the input to another optimization step:
- (a)
- Define the WPT NMR spectrum of a molecular mixture as the target variable, ;
- (b)
- Create a design matrix, , from the intersection of the chemical shift values from and the intensities of the spectra for the molecules in L II;
- (c)
- Minimize using a gradient descent method with the learning rate chosen randomly from a uniform distribution between 0.01 and 0.1;
- (d)
- An optimized list of molecules associated with probabilities greater than 0.1 is obtained.
3.4. An Example of How the Scheme Works
4. Conclusions
Author Contributions
Funding
Institutional Review Board Statement
Informed Consent Statement
Data Availability Statement
Conflicts of Interest
Abbreviations
| WPT | Wavelet packet transform |
| DWT | Discrete wavelet transform |
| NMR | Nuclear magnetic resonance |
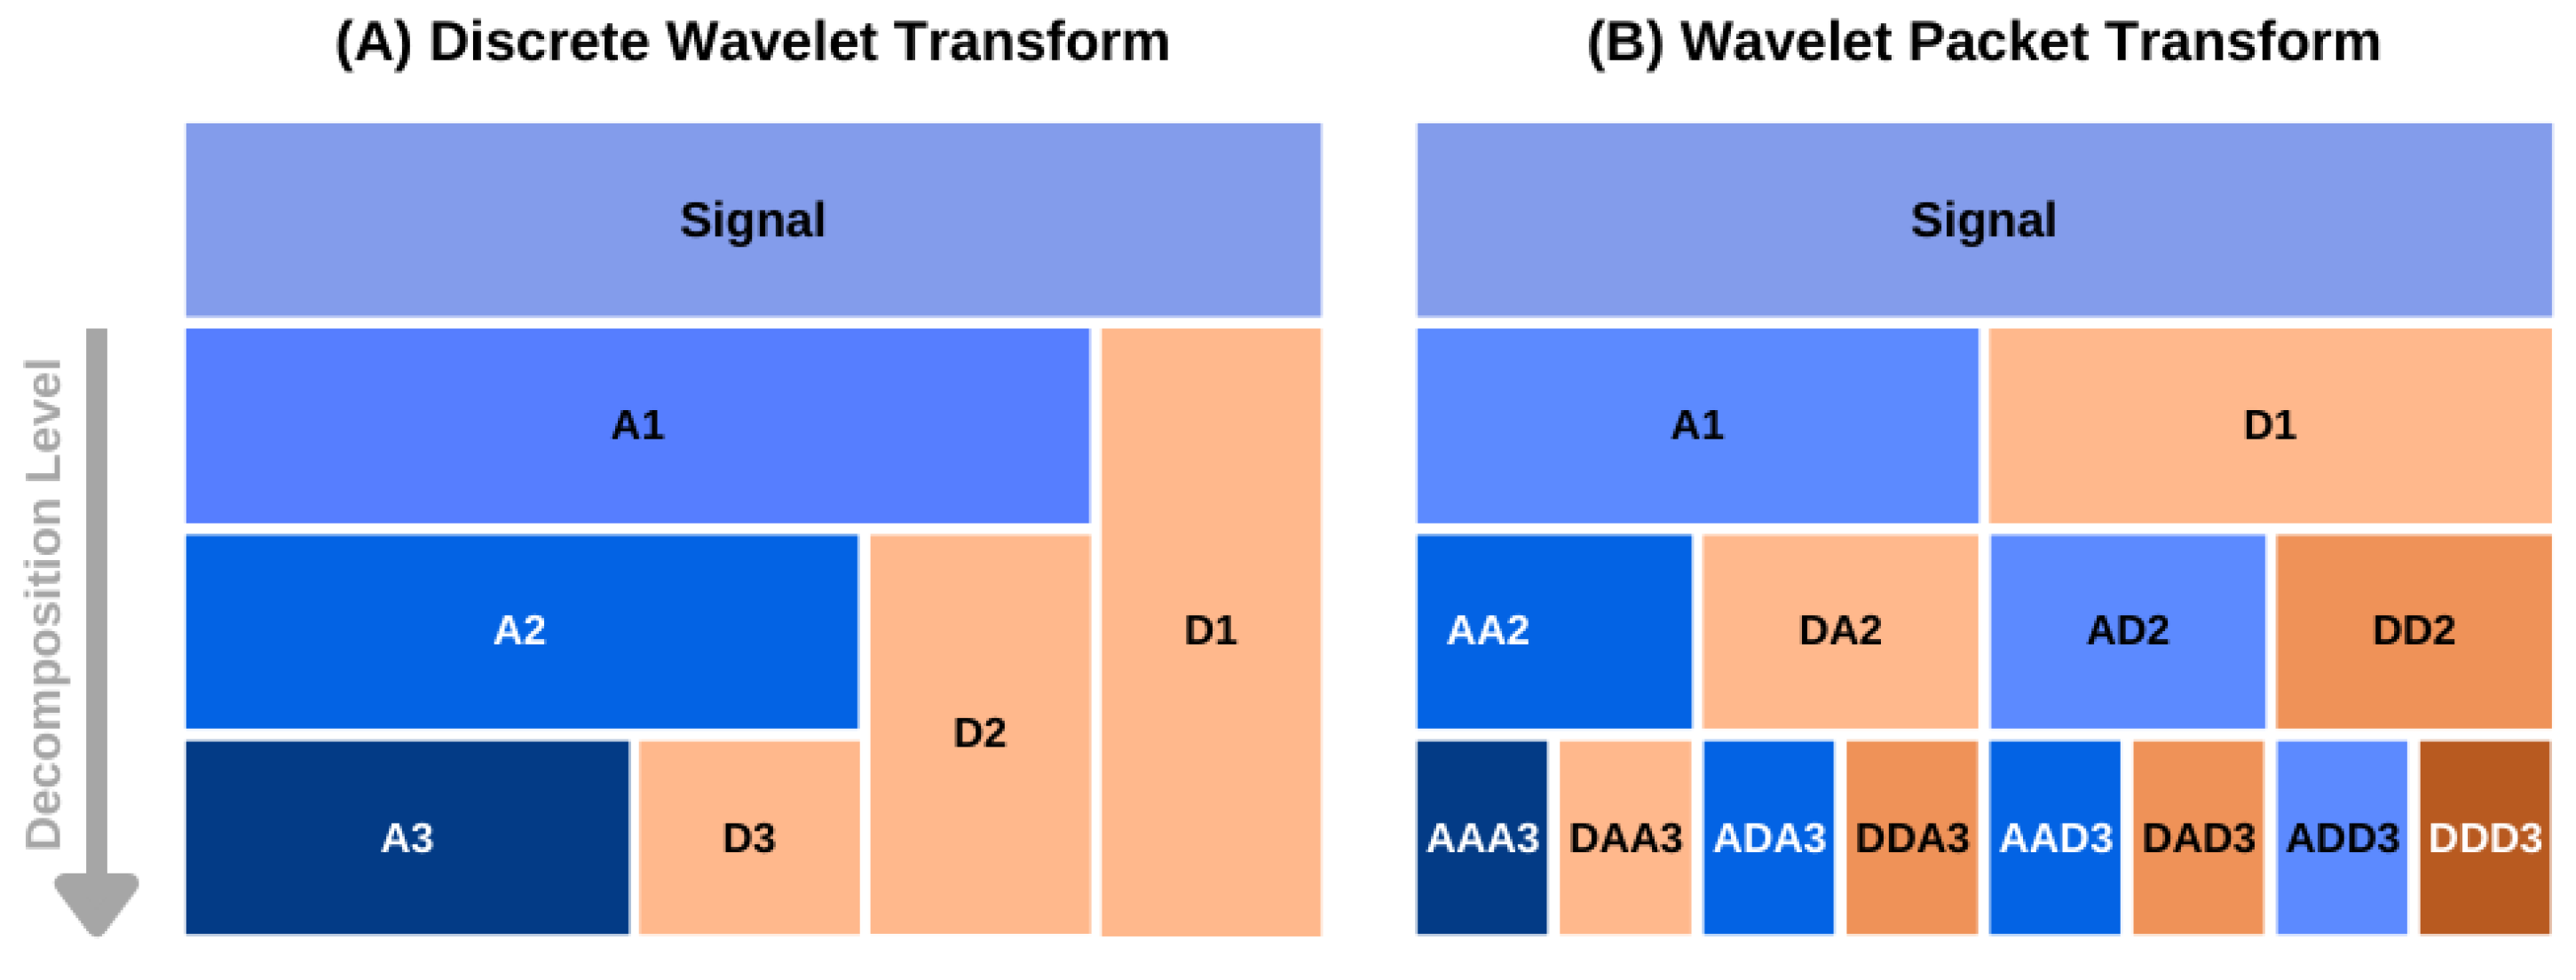
Appendix A. Overview of Wavelet Transform

References
- Pellecchia, M.; Sem, D.S.; Wüthrich, K. NMR in drug discovery. Nat. Rev. Drug Discov. 2002, 1, 211–219. [Google Scholar] [CrossRef] [PubMed]
- Shi, L.; Zhang, N. Applications of solution NMR in drug discovery. Molecules 2021, 26, 576. [Google Scholar] [CrossRef] [PubMed]
- Softley, C.A.; Bostock, M.J.; Popowicz, G.M.; Sattler, M. Paramagnetic NMR in drug discovery. J. Biomol. NMR 2020, 74, 287–309. [Google Scholar] [CrossRef]
- Emwas, A.H.; Roy, R.; McKay, R.T.; Tenori, L.; Saccenti, E.; Gowda, G.N.; Raftery, D.; Alahmari, F.; Jaremko, L.; Jaremko, M.; et al. NMR spectroscopy for metabolomics research. Metabolites 2019, 9, 123. [Google Scholar] [CrossRef] [PubMed]
- Markley, J.L.; Brüschweiler, R.; Edison, A.S.; Eghbalnia, H.R.; Powers, R.; Raftery, D.; Wishart, D.S. The future of NMR-based metabolomics. Curr. Opin. Biotechnol. 2017, 43, 34–40. [Google Scholar] [CrossRef]
- Wishart, D.S. NMR metabolomics: A look ahead. J. Magn. Reson. 2019, 306, 155–161. [Google Scholar] [CrossRef]
- Pauli, G.F.; Jaki, B.U.; Lankin, D.C. Quantitative 1H NMR: Development and potential of a method for natural products analysis. J. Nat. Prod. 2005, 68, 133–149. [Google Scholar] [CrossRef] [PubMed]
- Breton, R.C.; Reynolds, W.F. Using NMR to identify and characterize natural products. Nat. Prod. Rep. 2013, 30, 501–524. [Google Scholar] [CrossRef]
- Robinette, S.L.; Brüschweiler, R.; Schroeder, F.C.; Edison, A.S. NMR in metabolomics and natural products research: Two sides of the same coin. Acc. Chem. Res. 2012, 45, 288–297. [Google Scholar] [CrossRef]
- Capitani, D.; Sobolev, A.P.; Di Tullio, V.; Mannina, L.; Proietti, N. Portable NMR in food analysis. Chem. Biol. Technol. Agric. 2017, 4, 1–14. [Google Scholar] [CrossRef]
- Martínez-Yusta, A.; Goicoechea, E.; Guillén, M.D. A review of thermo-oxidative degradation of food lipids studied by 1H NMR spectroscopy: Influence of degradative conditions and food lipid nature. Compr. Rev. Food Sci. Food Saf. 2014, 13, 838–859. [Google Scholar] [CrossRef]
- Whitfield Åslund, M.L.; McShane, H.; Simpson, M.J.; Simpson, A.J.; Whalen, J.K.; Hendershot, W.H.; Sunahara, G.I. Earthworm sublethal responses to titanium dioxide nanomaterial in soil detected by 1H NMR metabolomics. Environ. Sci. Technol. 2012, 46, 1111–1118. [Google Scholar] [CrossRef] [PubMed]
- Cardoza, L.; Korir, A.; Otto, W.; Wurrey, C.; Larive, C. Applications of NMR spectroscopy in environmental science. Prog. Nucl. Magn. Reson. Spectrosc. 2004, 45, 209–238. [Google Scholar] [CrossRef]
- Pauli, G.F.; Godecke, T.; Jaki, B.U.; Lankin, D.C. Quantitative 1H NMR. Development and potential of an analytical method: An update. J. Nat. Prod. 2012, 75, 834–851. [Google Scholar] [CrossRef] [PubMed]
- Caligiani, A.; Acquotti, D.; Palla, G.; Bocchi, V. Identification and quantification of the main organic components of vinegars by high resolution 1H NMR spectroscopy. Anal. Chim. Acta 2007, 585, 110–119. [Google Scholar] [CrossRef] [PubMed]
- Barison, A.; Pereira da Silva, C.W.; Campos, F.R.; Simonelli, F.; Lenz, C.A.; Ferreira, A.G. A simple methodology for the determination of fatty acid composition in edible oils through 1H NMR spectroscopy. Magn. Reson. Chem. 2010, 48, 642–650. [Google Scholar] [CrossRef] [PubMed]
- Lee, J.H.; Okuno, Y.; Cavagnero, S. Sensitivity enhancement in solution NMR: Emerging ideas and new frontiers. J. Magn. Reson. 2014, 241, 18–31. [Google Scholar] [CrossRef] [PubMed]
- Mompeán, M.; Sánchez-Donoso, R.M.; De La Hoz, A.; Saggiomo, V.; Velders, A.H.; Gomez, M. Pushing nuclear magnetic resonance sensitivity limits with microfluidics and photo-chemically induced dynamic nuclear polarization. Nat. Commun. 2018, 9, 1–8. [Google Scholar] [CrossRef]
- Kovacs, H.; Moskau, D.; Spraul, M. Cryogenically cooled probes—A leap in NMR technology. Prog. Nucl. Magn. Reson. Spectrosc. 2005, 46, 131–155. [Google Scholar] [CrossRef]
- Zangger, K. Pure shift NMR. Prog. Nucl. Magn. Reson. Spectrosc. 2015, 86, 1–20. [Google Scholar] [CrossRef]
- Foroozandeh, M.; Morris, G.A.; Nilsson, M. PSYCHE pure shift NMR spectroscopy. Chem.-Eur. J. 2018, 24, 13988–14000. [Google Scholar] [CrossRef]
- Aguilar, J.A.; Nilsson, M.; Morris, G.A. Simple proton spectra from complex spin systems: Pure shift NMR spectroscopy using BIRD. Angew. Chem. 2011, 123, 9890–9891. [Google Scholar] [CrossRef]
- Lupulescu, A.; Olsen, G.L.; Frydman, L. Toward single-shot pure shift solution 1H NMR by trains of BIRD-based homonuclear decoupling. J. Magn. Reson. 2012, 218, 141–146. [Google Scholar] [CrossRef]
- Casta nar, L.; Parella, T. Broadband 1H homodecoupled NMR experiments: Recent developments, methods and applications. Magn. Reson. Chem. 2015, 53, 399–426. [Google Scholar] [CrossRef]
- Giraudeau, P. Challenges and perspectives in quantitative NMR. Magn. Reson. Chem. 2017, 55, 61–69. [Google Scholar] [CrossRef]
- Yuan, B.; Zhou, Z.; Jiang, B.; Kamal, G.M.; Zhang, X.; Li, C.; Zhou, X.; Liu, M. NMR for mixture analysis: Concentration-ordered spectroscopy. Anal. Chem. 2021, 93, 9697–9703. [Google Scholar] [CrossRef] [PubMed]
- Rogerson, A.K.; Aguilar, J.A.; Nilsson, M.; Morris, G.A. Simultaneous enhancement of chemical shift dispersion and diffusion resolution in mixture analysis by diffusion-ordered NMR spectroscopy. Chem. Commun. 2011, 47, 7063–7064. [Google Scholar] [CrossRef]
- Dal Poggetto, G.; Casta nar, L.; Adams, R.W.; Morris, G.A.; Nilsson, M. Relaxation-encoded NMR experiments for mixture analysis: REST and beer. Chem. Commun. 2017, 53, 7461–7464. [Google Scholar] [CrossRef]
- Novoa-Carballal, R.; Fernandez-Megia, E.; Jimenez, C.; Riguera, R. NMR methods for unravelling the spectra of complex mixtures. Nat. Prod. Rep. 2011, 28, 78–98. [Google Scholar] [CrossRef] [PubMed]
- Bernstein, M.A.; Sýkora, S.; Peng, C.; Barba, A.; Cobas, C. Optimization and automation of quantitative NMR data extraction. Anal. Chem. 2013, 85, 5778–5786. [Google Scholar] [PubMed]
- Delsuc, M.A.; Levy, G.C. The application of maximum entropy processing to the deconvolution of coupling patterns in NMR. J. Magn. Reson. (1969) 1988, 76, 306–315. [Google Scholar] [CrossRef]
- Shimba, N.; Stern, A.S.; Craik, C.S.; Hoch, J.C.; Dötsch, V. Elimination of 13Cα splitting in protein NMR spectra by deconvolution with maximum entropy reconstruction. J. Am. Chem. Soc. 2003, 125, 2382–2383. [Google Scholar] [CrossRef]
- Cui, Q.; Lewis, I.A.; Hegeman, A.D.; Anderson, M.E.; Li, J.; Schulte, C.F.; Westler, W.M.; Eghbalnia, H.R.; Sussman, M.R.; Markley, J.L. Metabolite identification via the madison metabolomics consortium database. Nat. Biotechnol. 2008, 26, 162–164. [Google Scholar] [CrossRef] [PubMed]
- Steinbeck, C.; Krause, S.; Kuhn, S. NMRShiftDB–Constructing a free chemical information system with open-source components. J. Chem. Inf. Comput. Sci. 2003, 43, 1733–1739. [Google Scholar] [CrossRef]
- Tulpan, D.; Léger, S.; Belliveau, L.; Culf, A.; Čuperlović-Culf, M. MetaboHunter: An automatic approach for identification of metabolites from 1H-NMR spectra of complex mixtures. BMC Bioinform. 2011, 12, 1–22. [Google Scholar] [CrossRef] [PubMed]
- Vu, T.N.; Laukens, K. Getting your peaks in line: A review of alignment methods for NMR spectral data. Metabolites 2013, 3, 259–276. [Google Scholar] [CrossRef]
- Lepre, C.A. Library design for NMR-based screening. Drug Discov. Today 2001, 6, 133–140. [Google Scholar] [CrossRef]
- dos Santos Ribeiro, H.S.; Dagnino, D.; Schripsema, J. Rapid and accurate verification of drug identity, purity and quality by 1H-NMR using similarity calculations and differential NMR. J. Pharm. Biomed. Anal. 2021, 199, 114040. [Google Scholar] [CrossRef]
- Wei, S.; Zhang, J.; Liu, L.; Ye, T.; Gowda, G.N.; Tayyari, F.; Raftery, D. Ratio analysis nuclear magnetic resonance spectroscopy for selective metabolite identification in complex samples. Anal. Chem. 2011, 83, 7616–7623. [Google Scholar] [CrossRef]
- Wei, W.; Liao, Y.; Wang, Y.; Wang, S.; Du, W.; Lu, H.; Kong, B.; Yang, H.; Zhang, Z. Deep Learning-Based Method for Compound Identification in NMR Spectra of Mixtures. Molecules 2022, 27, 3653. [Google Scholar] [CrossRef]
- Pomyen, Y.; Wanichthanarak, K.; Poungsombat, P.; Fahrmann, J.; Grapov, D.; Khoomrung, S. Deep metabolome: Applications of deep learning in metabolomics. Comput. Struct. Biotechnol. J. 2020, 18, 2818–2825. [Google Scholar] [CrossRef]
- Corsaro, C.; Vasi, S.; Neri, F.; Mezzasalma, A.M.; Neri, G.; Fazio, E. NMR in Metabolomics: From Conventional Statistics to Machine Learning and Neural Network Approaches. Appl. Sci. 2022, 12, 2824. [Google Scholar] [CrossRef]
- Sinha Roy, A.; Srivastava, M. Analysis of Small-Molecule Mixtures by Super-Resolved 1H NMR Spectroscopy. J. Phys. Chem. A 2022, 126, 9108–9113. [Google Scholar] [CrossRef]
- Judge, M.T.; Ebbels, T. Problems, principles and progress in computational annotation of NMR metabolomics data. Metabolomics 2022, 18, 1–15. [Google Scholar] [CrossRef]
- Monge, M.E.; Dodds, J.N.; Baker, E.S.; Edison, A.S.; Fernández, F.M. Challenges in identifying the dark molecules of life. Annu. Rev. Anal. Chem. (Palo Alto Calif.) 2019, 12, 177. [Google Scholar] [PubMed]
- Beniddir, M.A.; Kang, K.B.; Genta-Jouve, G.; Huber, F.; Rogers, S.; Van Der Hooft, J.J. Advances in decomposing complex metabolite mixtures using substructure and network-based computational metabolomics approaches. Nat. Prod. Rep. 2021, 38, 1967–1993. [Google Scholar]
- Weljie, A.M.; Newton, J.; Mercier, P.; Carlson, E.; Slupsky, C.M. Targeted profiling: Quantitative analysis of 1H NMR metabolomics data. Anal. Chem. 2006, 78, 4430–4442. [Google Scholar]
- Ravanbakhsh, S.; Liu, P.; Bjordahl, T.C.; Mandal, R.; Grant, J.R.; Wilson, M.; Eisner, R.; Sinelnikov, I.; Hu, X.; Luchinat, C.; et al. Accurate, fully-automated NMR spectral profiling for metabolomics. PLoS ONE 2015, 10, e0124219. [Google Scholar]
- Roy, A.S.; Srivastava, M. Hyperfine decoupling of ESR spectra using wavelet transform. Magnetochemistry 2022, 8, 32. [Google Scholar] [CrossRef]
- Srivastava, M. Improving Signal Resolution and Reducing Experiment Time in Electron Spin Resonance Spectroscopy via Data Processing Methods. Ph.D. Thesis, Cornell University, Ithaca, NY, USA, 2018. [Google Scholar]
- Wishart, D.S.; Knox, C.; Guo, A.C.; Eisner, R.; Young, N.; Gautam, B.; Hau, D.D.; Psychogios, N.; Dong, E.; Bouatra, S.; et al. HMDB: A knowledgebase for the human metabolome. Nucleic Acids Res. 2009, 37, D603–D610. [Google Scholar] [CrossRef]
- Ray, S. A quick review of machine learning algorithms. In Proceedings of the 2019 International Conference on Machine Learning, Big Data, Cloud and Parallel Computing (COMITCon), Faridabad, India, 14–16 February 2019; pp. 35–39. [Google Scholar]
- Addison, P. The Illustrated Wavelet Transform Handbook: Introductory Theory and Applications in Science, Engineering, Medicine and Finance, 2nd ed.; CRC Press: London, UK, 2016. [Google Scholar]


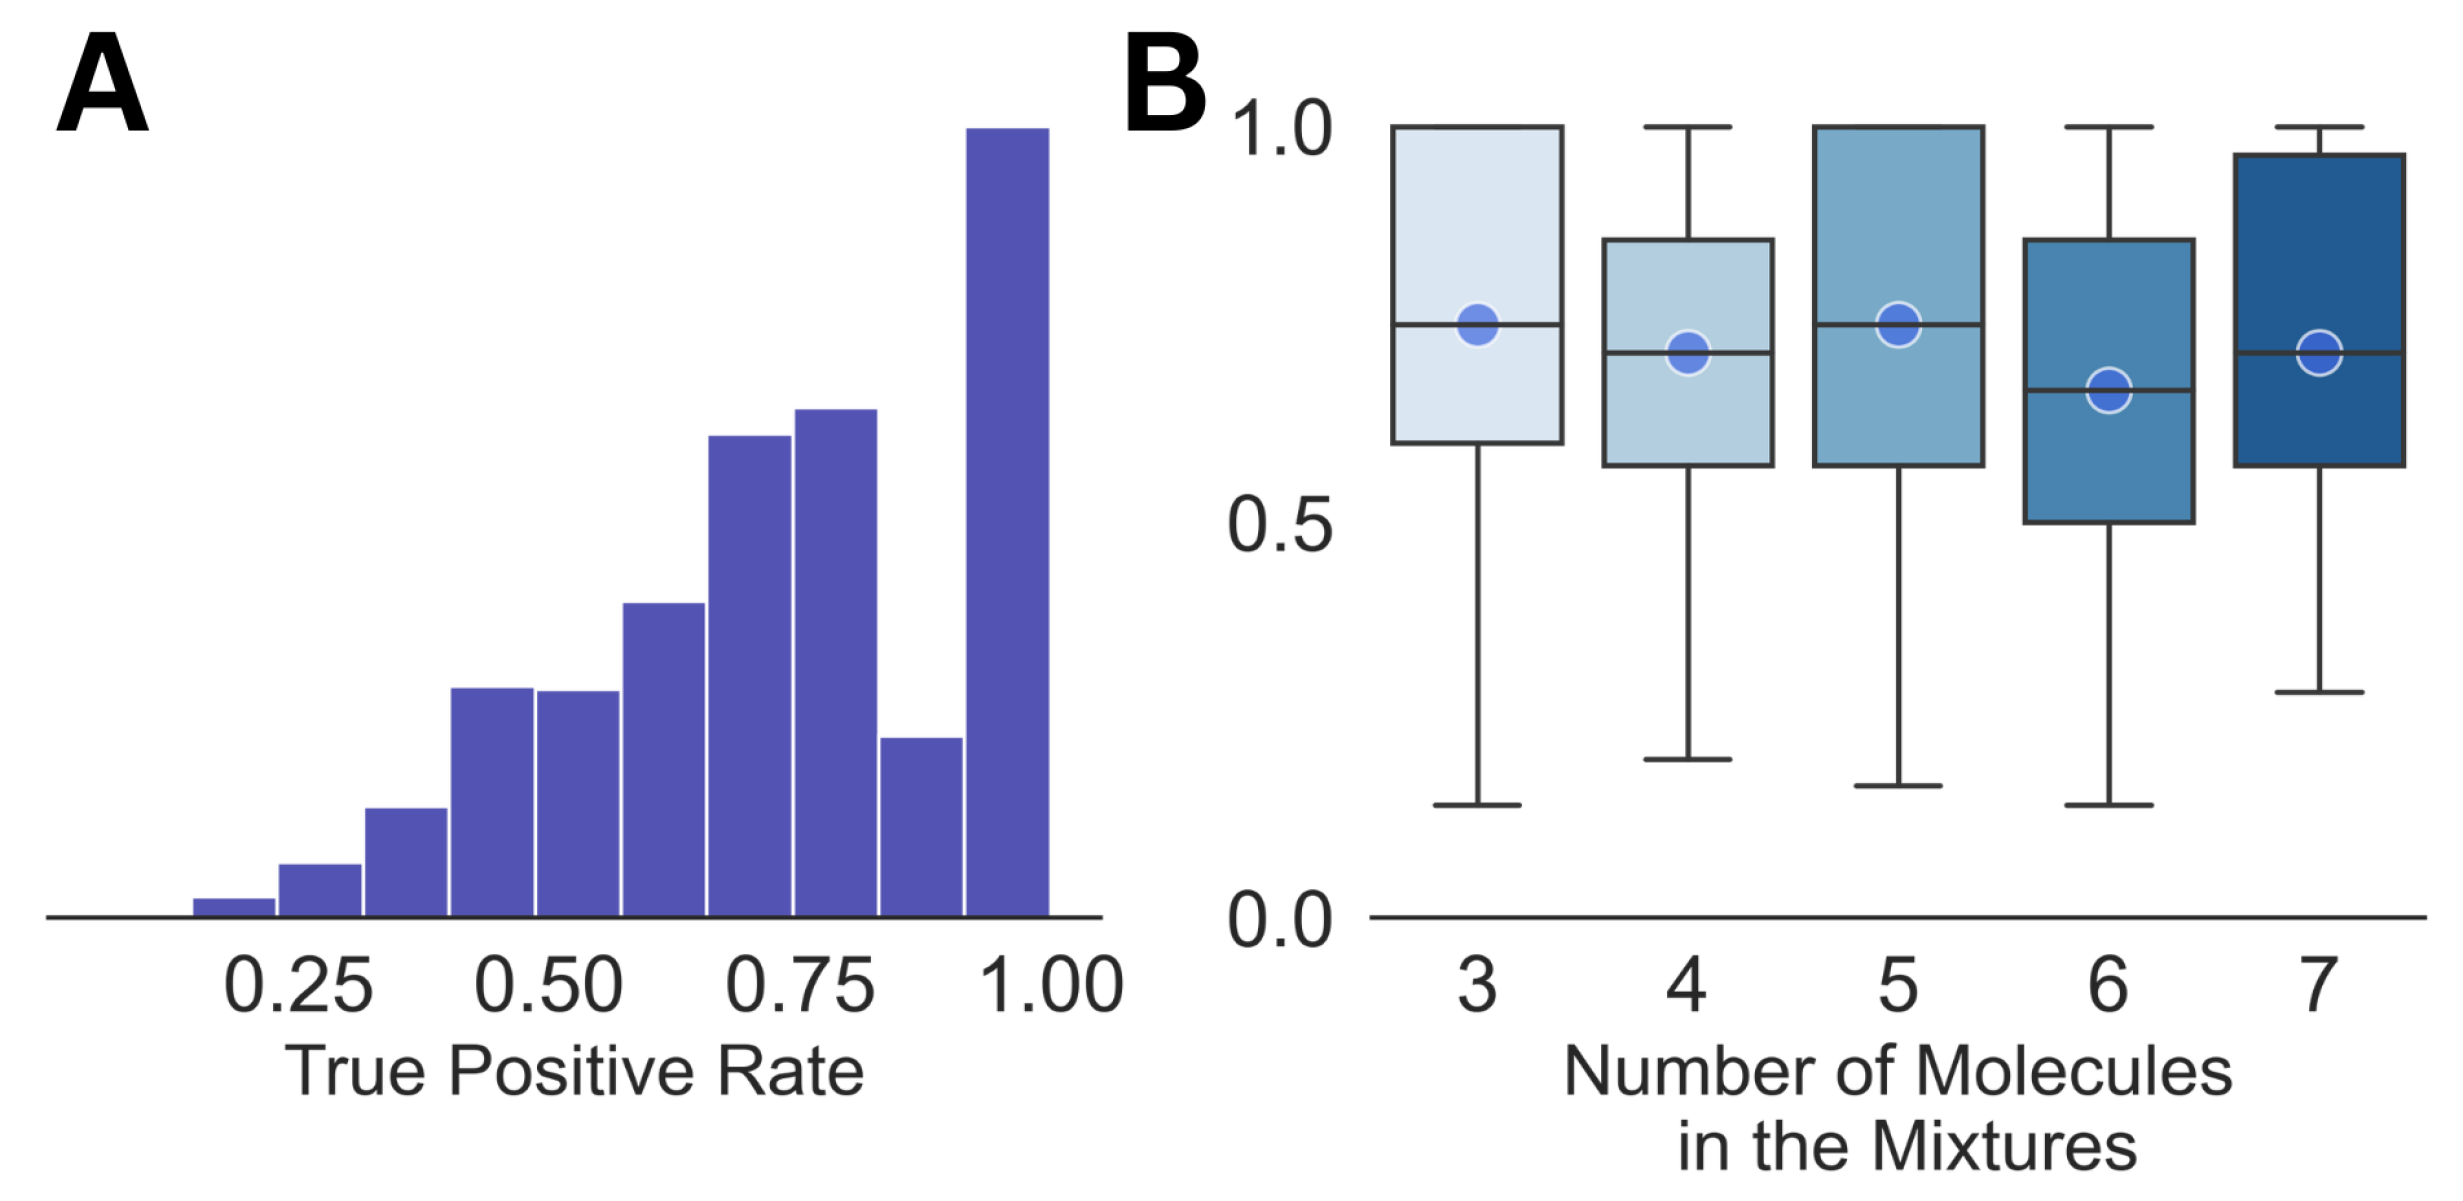
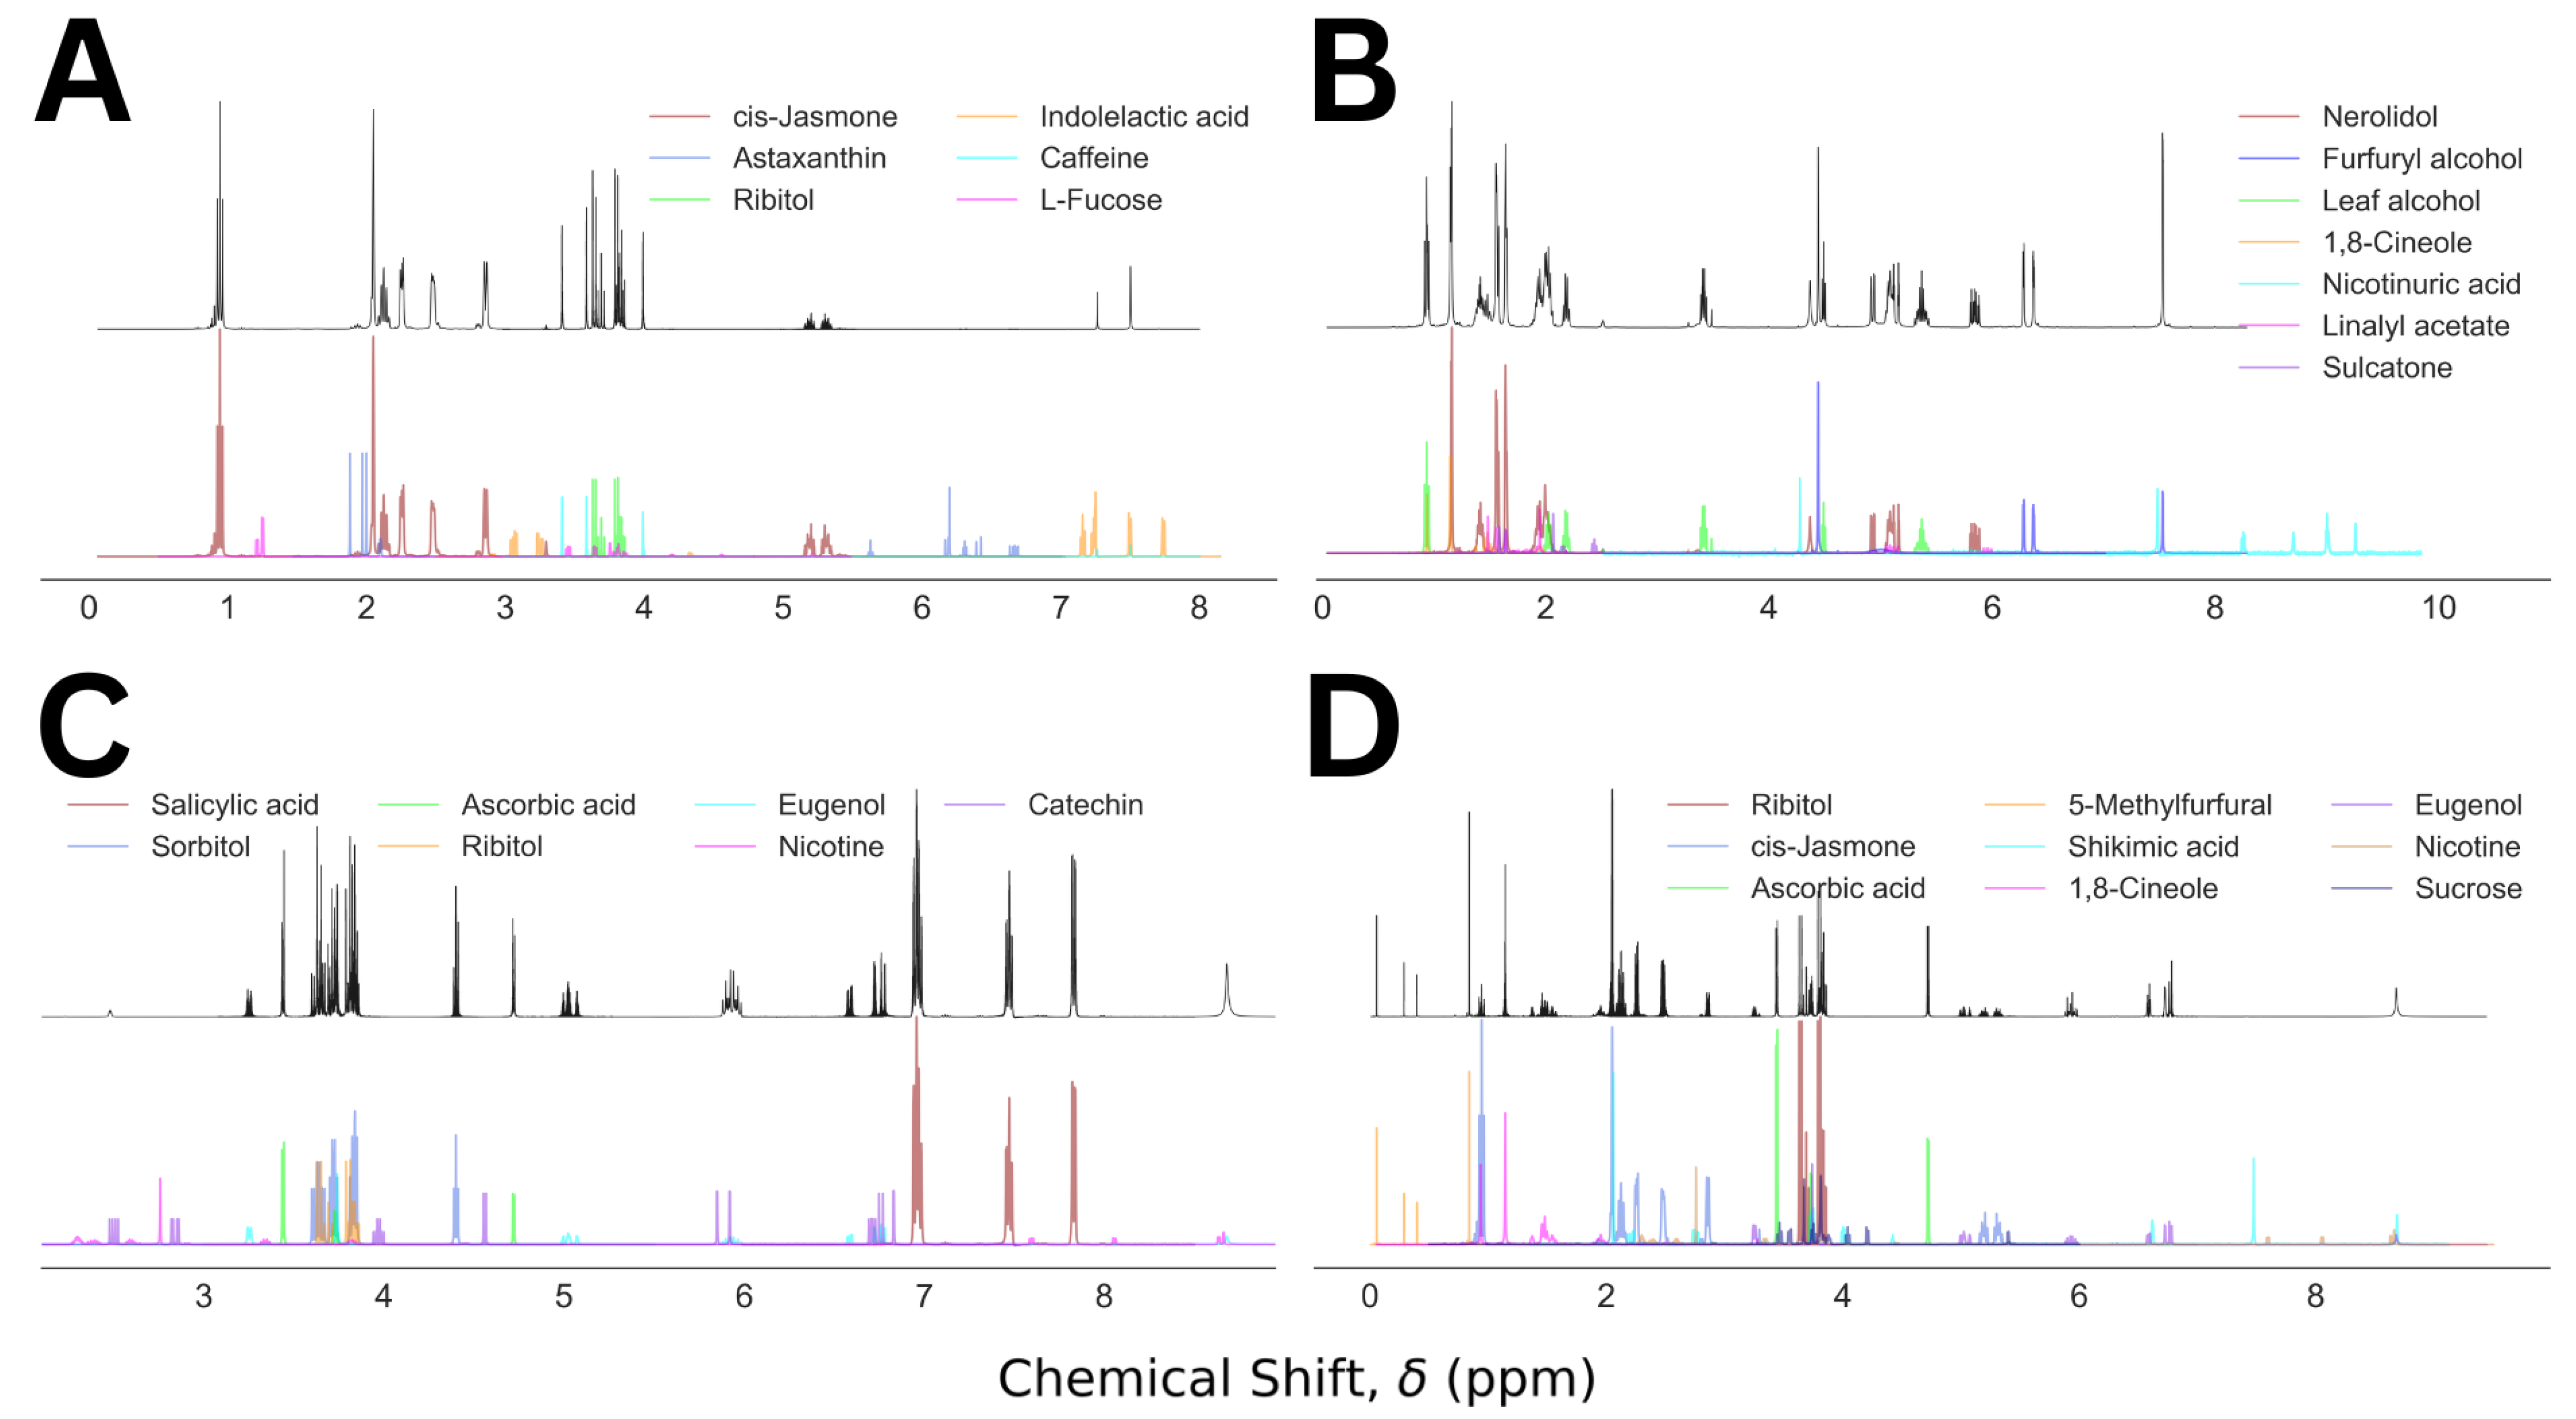
| Mixture No. | Number of Molecules | Molecules (Proportions %) | True Positive Rate | False Positive Rate |
|---|---|---|---|---|
| 5 | 3 | Caffeine (39), ribitol (33), cis-jasmone (28) | 1.0 | 0.04 |
| 23 | 4 | Nerolidol (35), 1,8-cineole (22), leaf alcohol (22), furfuryl alcohol (21) | 1.0 | 0.04 |
| 35 | 5 | Sorbitol (28), eugenol (26), ribitol (18), ascorbic acid (15), salicylic acid (13) | 1.0 | 0.03 |
| 20 | 6 | Ribitol (20), eugenol (19), cis-jasmone (18), 5-methylfurfural (17), ascorbic acid (15), 1,8-cineole (12) | 1.0 | 0.04 |
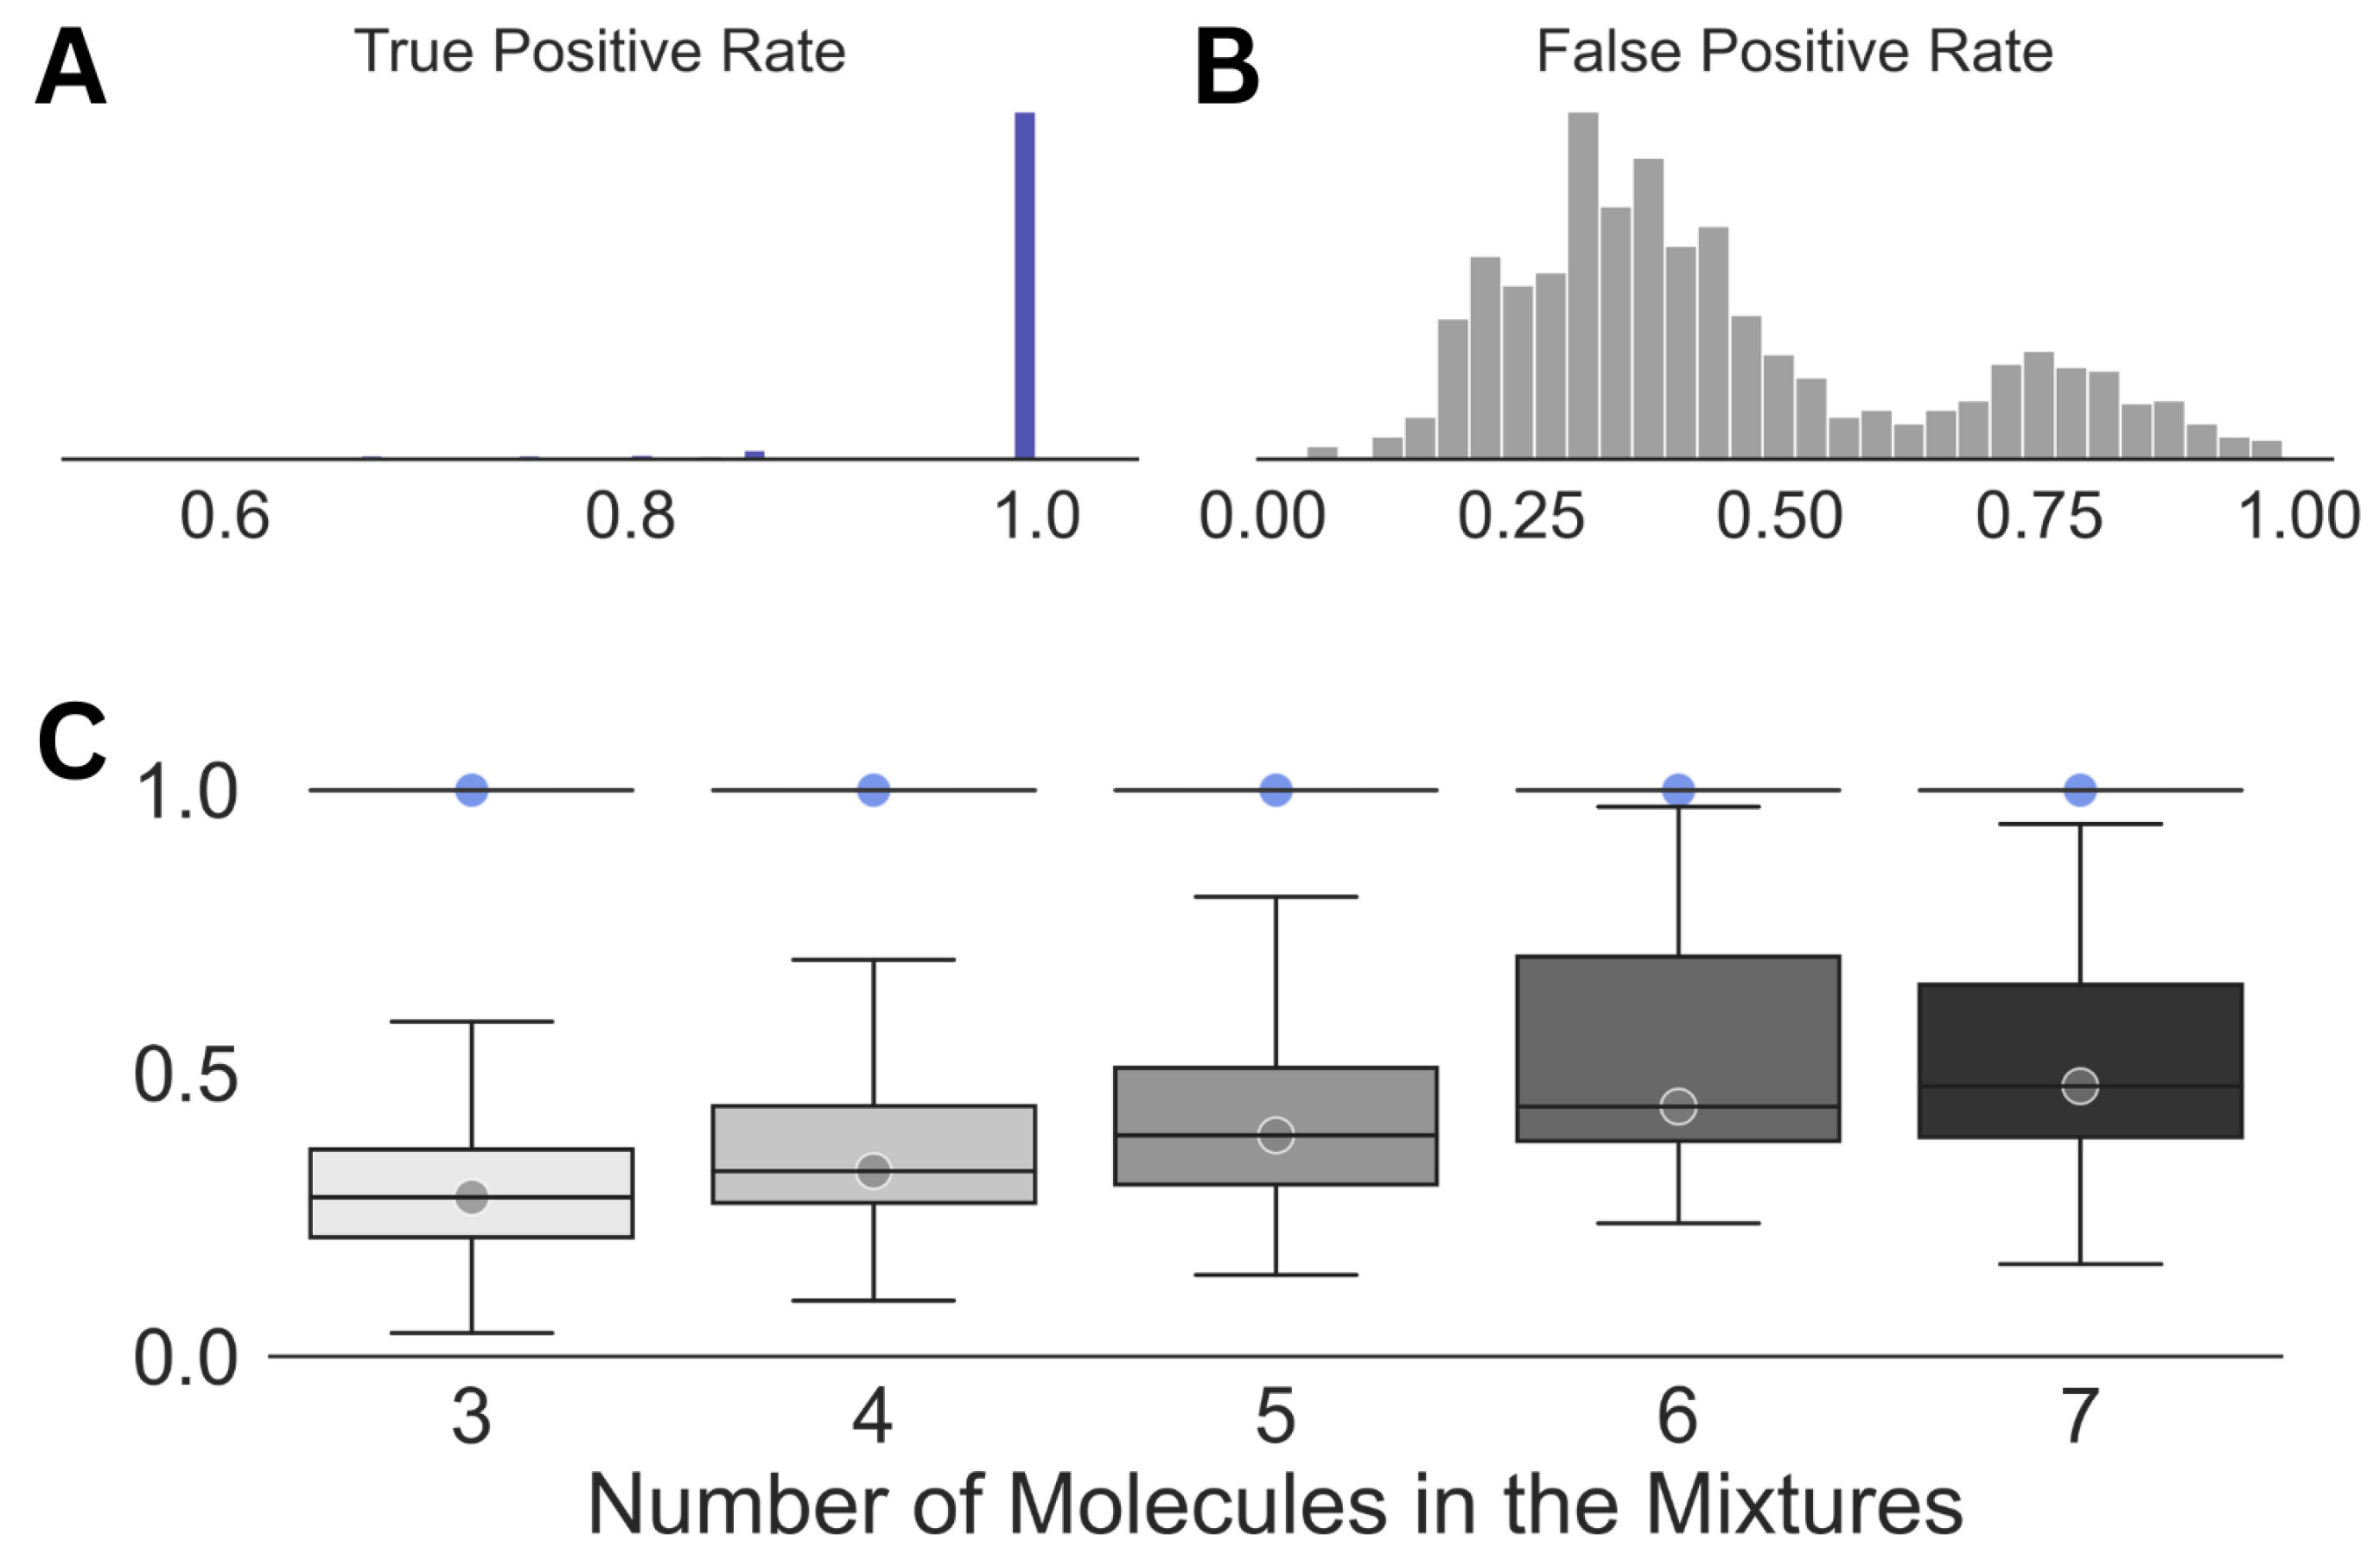
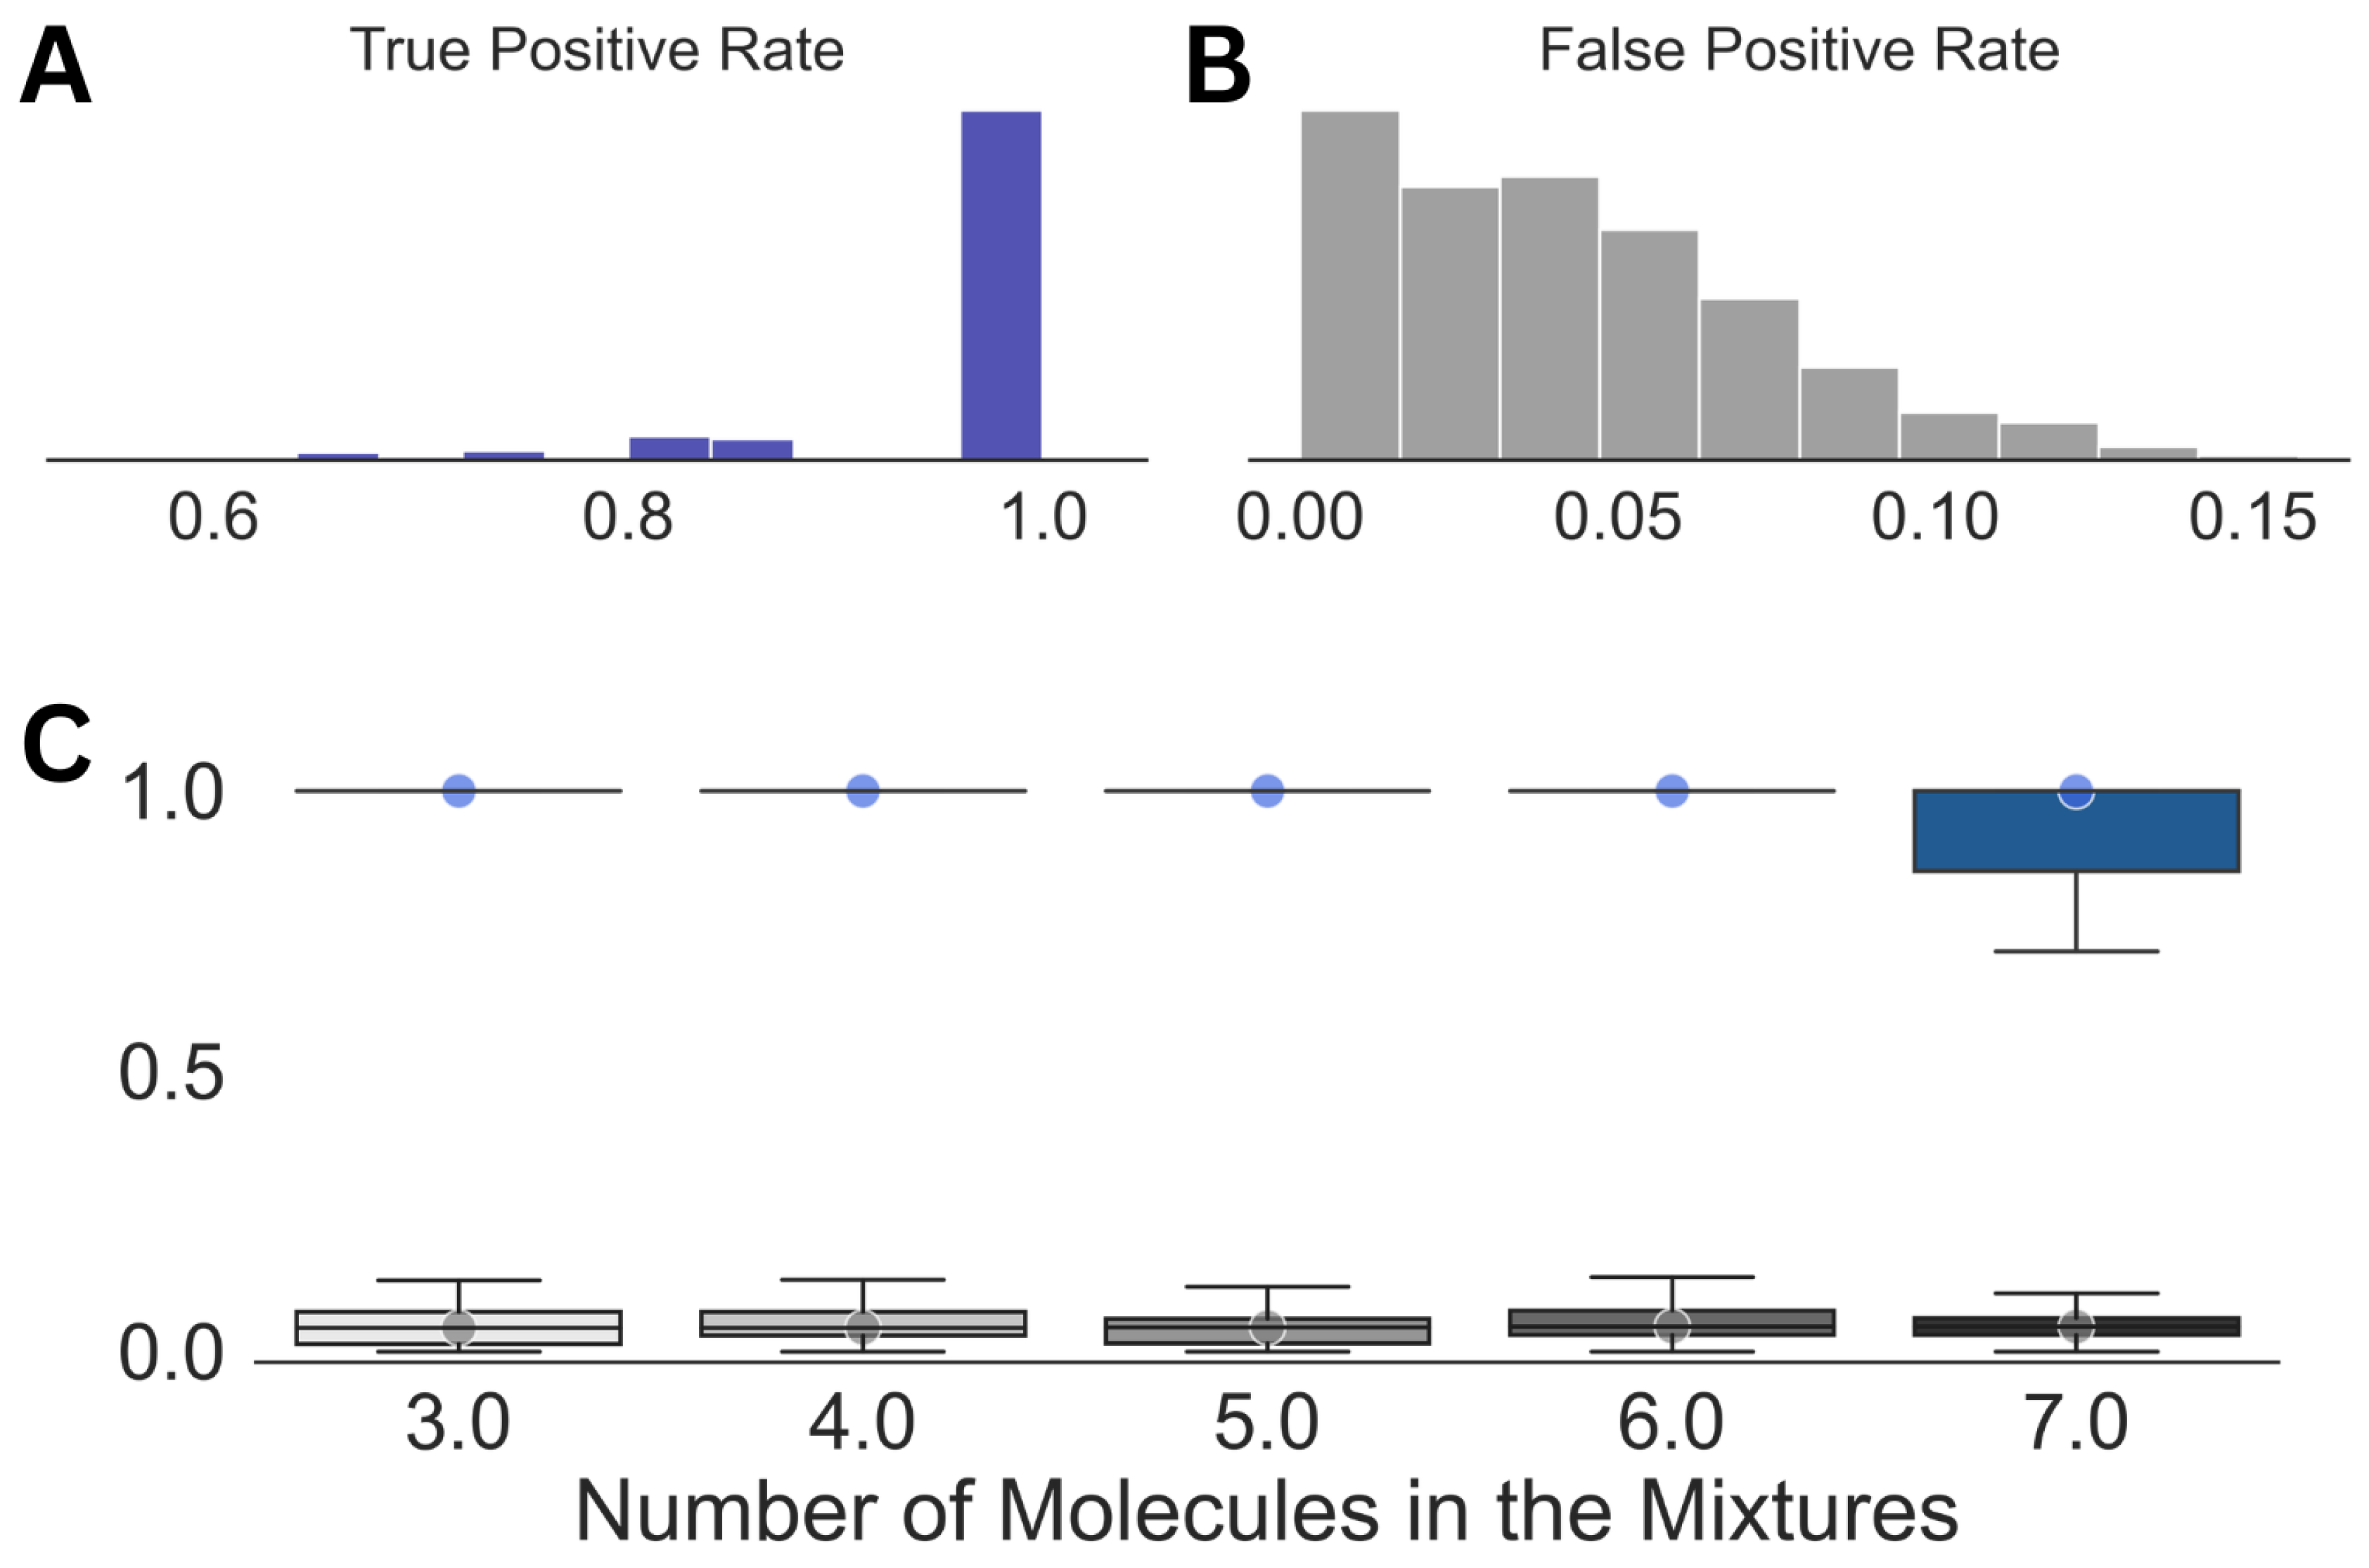
| Parameters | True Positive Rate | False Positive Rate |
|---|---|---|
| Mean | 0.97 | 0.05 |
| Median | 1.0 | 0.04 |
| Standard Deviation | 0.09 | 0.03 |
| Chemical Shift | Target, Y | Design Matrix, X | |||
|---|---|---|---|---|---|
| … | |||||
| … | |||||
| … | |||||
| ⋮ | ⋮ | ⋮ | ⋮ | … | ⋮ |
| … | |||||
Disclaimer/Publisher’s Note: The statements, opinions and data contained in all publications are solely those of the individual author(s) and contributor(s) and not of MDPI and/or the editor(s). MDPI and/or the editor(s) disclaim responsibility for any injury to people or property resulting from any ideas, methods, instructions or products referred to in the content. |
© 2023 by the authors. Licensee MDPI, Basel, Switzerland. This article is an open access article distributed under the terms and conditions of the Creative Commons Attribution (CC BY) license (https://creativecommons.org/licenses/by/4.0/).
Share and Cite
Sinha Roy, A.; Srivastava, M. Unsupervised Analysis of Small Molecule Mixtures by Wavelet-Based Super-Resolved NMR. Molecules 2023, 28, 792. https://doi.org/10.3390/molecules28020792
Sinha Roy A, Srivastava M. Unsupervised Analysis of Small Molecule Mixtures by Wavelet-Based Super-Resolved NMR. Molecules. 2023; 28(2):792. https://doi.org/10.3390/molecules28020792
Chicago/Turabian StyleSinha Roy, Aritro, and Madhur Srivastava. 2023. "Unsupervised Analysis of Small Molecule Mixtures by Wavelet-Based Super-Resolved NMR" Molecules 28, no. 2: 792. https://doi.org/10.3390/molecules28020792
APA StyleSinha Roy, A., & Srivastava, M. (2023). Unsupervised Analysis of Small Molecule Mixtures by Wavelet-Based Super-Resolved NMR. Molecules, 28(2), 792. https://doi.org/10.3390/molecules28020792