Article

Sensitivity of Typhoon Forecast to Prescribed Sea Surface Temperature Data

1
Department of Urban and Environmental Engineering, Ulsan National Institute of Science and Technology, Ulsan 44919, Republic of Korea
2
National Typhoon Center, Korea Meteorological Administration, Jeju City 63614, Republic of Korea
*
Author to whom correspondence should be addressed.
Atmosphere 2023, 14(1), 72; https://doi.org/10.3390/atmos14010072
Submission received: 23 November 2022 / Revised: 27 December 2022 / Accepted: 28 December 2022 / Published: 30 December 2022
(This article belongs to the Special Issue Tropical Cyclone Forecasting - Analysis and Methods)

Abstract

:
This study investigates the impact of the sea surface temperature (SST) on the forecast of two typhoons, which consecutively hit South Korea in 2020. SST data were obtained from the Daily Optimum Interpolation Sea Surface Temperature (OISST) version 2 and HYbrid Coordinate Ocean Model/Navy Coupled Ocean Data Assimilation (HYCOM/NCODA; GLBy0.08/expt_93.0). When verified using in situ observational data, the OISST data did not accurately estimate the changes in SST during each typhoon’s landfall period compared to the HYCOM data since it has a relatively low temporal resolution. To investigate the impact of these two SST data on typhoon forecasts, we conducted sensitivity experiments using the Weather Research and Forecasting (WRF) model. The results showed that simulated typhoon intensities were significantly improved in the simulations with HYCOM data (HY runs), while typhoon track forecast performances were similar in both runs. In addition, the forecast performances of the maximum wind speed at 10 m during the typhoon landfall period were improved in the HY runs. Therefore, this study showed that the overall typhoon intensity and forecast performances during the landfall period could be improved when the higher temporal-resolution SST data were prescribed in the model boundary conditions for a better representation of typhoon-induced SST changes.

1. Introduction

Typhoons are one of the most dangerous natural disasters to coastal regions. Strong winds, heavy rainfall, and storm surges, which are characteristic of strong typhoons, can cause huge socio-economic losses whether they occur separately or together [1,2,3]. Many previous studies have expected that sea surface temperature (SST), ocean heat content (OHC), atmospheric temperature, and water vapor, all of which affect typhoon activities, could be changed to favorable conditions for typhoon development or intensification under global warming [4,5,6]. In addition, even some recent studies projected that the possibilities of typhoon development and intensification at higher latitudes than in the past and moving northward to mid-latitudes would also increase [7,8,9]. Thus, there is an increasing need for research to reduce the damage caused by stronger and more active typhoons in the future.
In autumn 2020, consecutive typhoons, Maysak and Haishen, made landfall in the southern part of the Korean Peninsula. Haishen moved slowly and intensified rapidly at low latitudes with higher SSTs, moving westward first, then turning sharply northward, and making landfall at a similar location to Maysak, but four days later. It reached Category 4 status on 3 September, but prior to landfall, it rapidly weakened to Category 2. Thus, the two consecutive typhoons could cause more powerful damage in South Korea because there was not enough time to restore the damage perfectly from the prior typhoon Maysak, and another strong typhoon immediately hit Republic of Korea. If consecutive typhoons directly hit city areas with skyscrapers or facilities such as nuclear power plants, which are vulnerable to typhoon-caused wind damage, at their lifetime maximum intensities (LMI), the damage could be enormously larger. Since such strong typhoons are likely to approach and affect the Korean Peninsula in succession in the future, it is necessary to forecast typhoons exactly and prepare for the damage from the typhoon in advance. However, even short-term typhoon forecast performances, particularly intensity and track for the landfall period, are still insufficient [10,11]. In addition, the track forecast performances were notably improved in recent decades, while the intensity forecast performances were not significantly improved during the same period [12].
One possible reason for poor intensity forecast performance is that most studies of short-term typhoon forecasts do not update the SST or use fixed SST with time [13,14,15]. Thus, changes in SST followed by the typhoon trajectory and typhoon-induced SST changes were not realistically reflected during the simulations. However, SST is one of the most important factors for typhoon intensification processes since it provides energy in the form of latent and sensible heat. In addition, many previous studies [16,17] revealed that according to diverse properties (i.e., size, intensity, and translation speed) of the typhoons, typhoons could cool the SSTs around them generally 5–6 °C, even up to 11 °C [18] by causing vertical mixing and upwelling, and this cooler upper ocean environment suppresses the typhoon development [19,20,21]. Thus, capturing the variations in SST realistically in the presence of typhoons might have a significant role in typhoon intensity forecasting. Therefore, two types of SST data were selected in this study, and the performances of two SST data were verified for the typhoon landfall period. In addition, we prescribed each SST data for the boundary condition of the Weather Research and Forecasting (WRF) model to investigate the sensitivity of the SST update on the typhoon simulation.
The remainder of this study is organized as follows. Section 2 briefly describes the model configuration and selected SST data. Section 3 evaluates the performances of the two SST data and shows the simulation results. Finally, summary and conclusions are presented in Section 4.

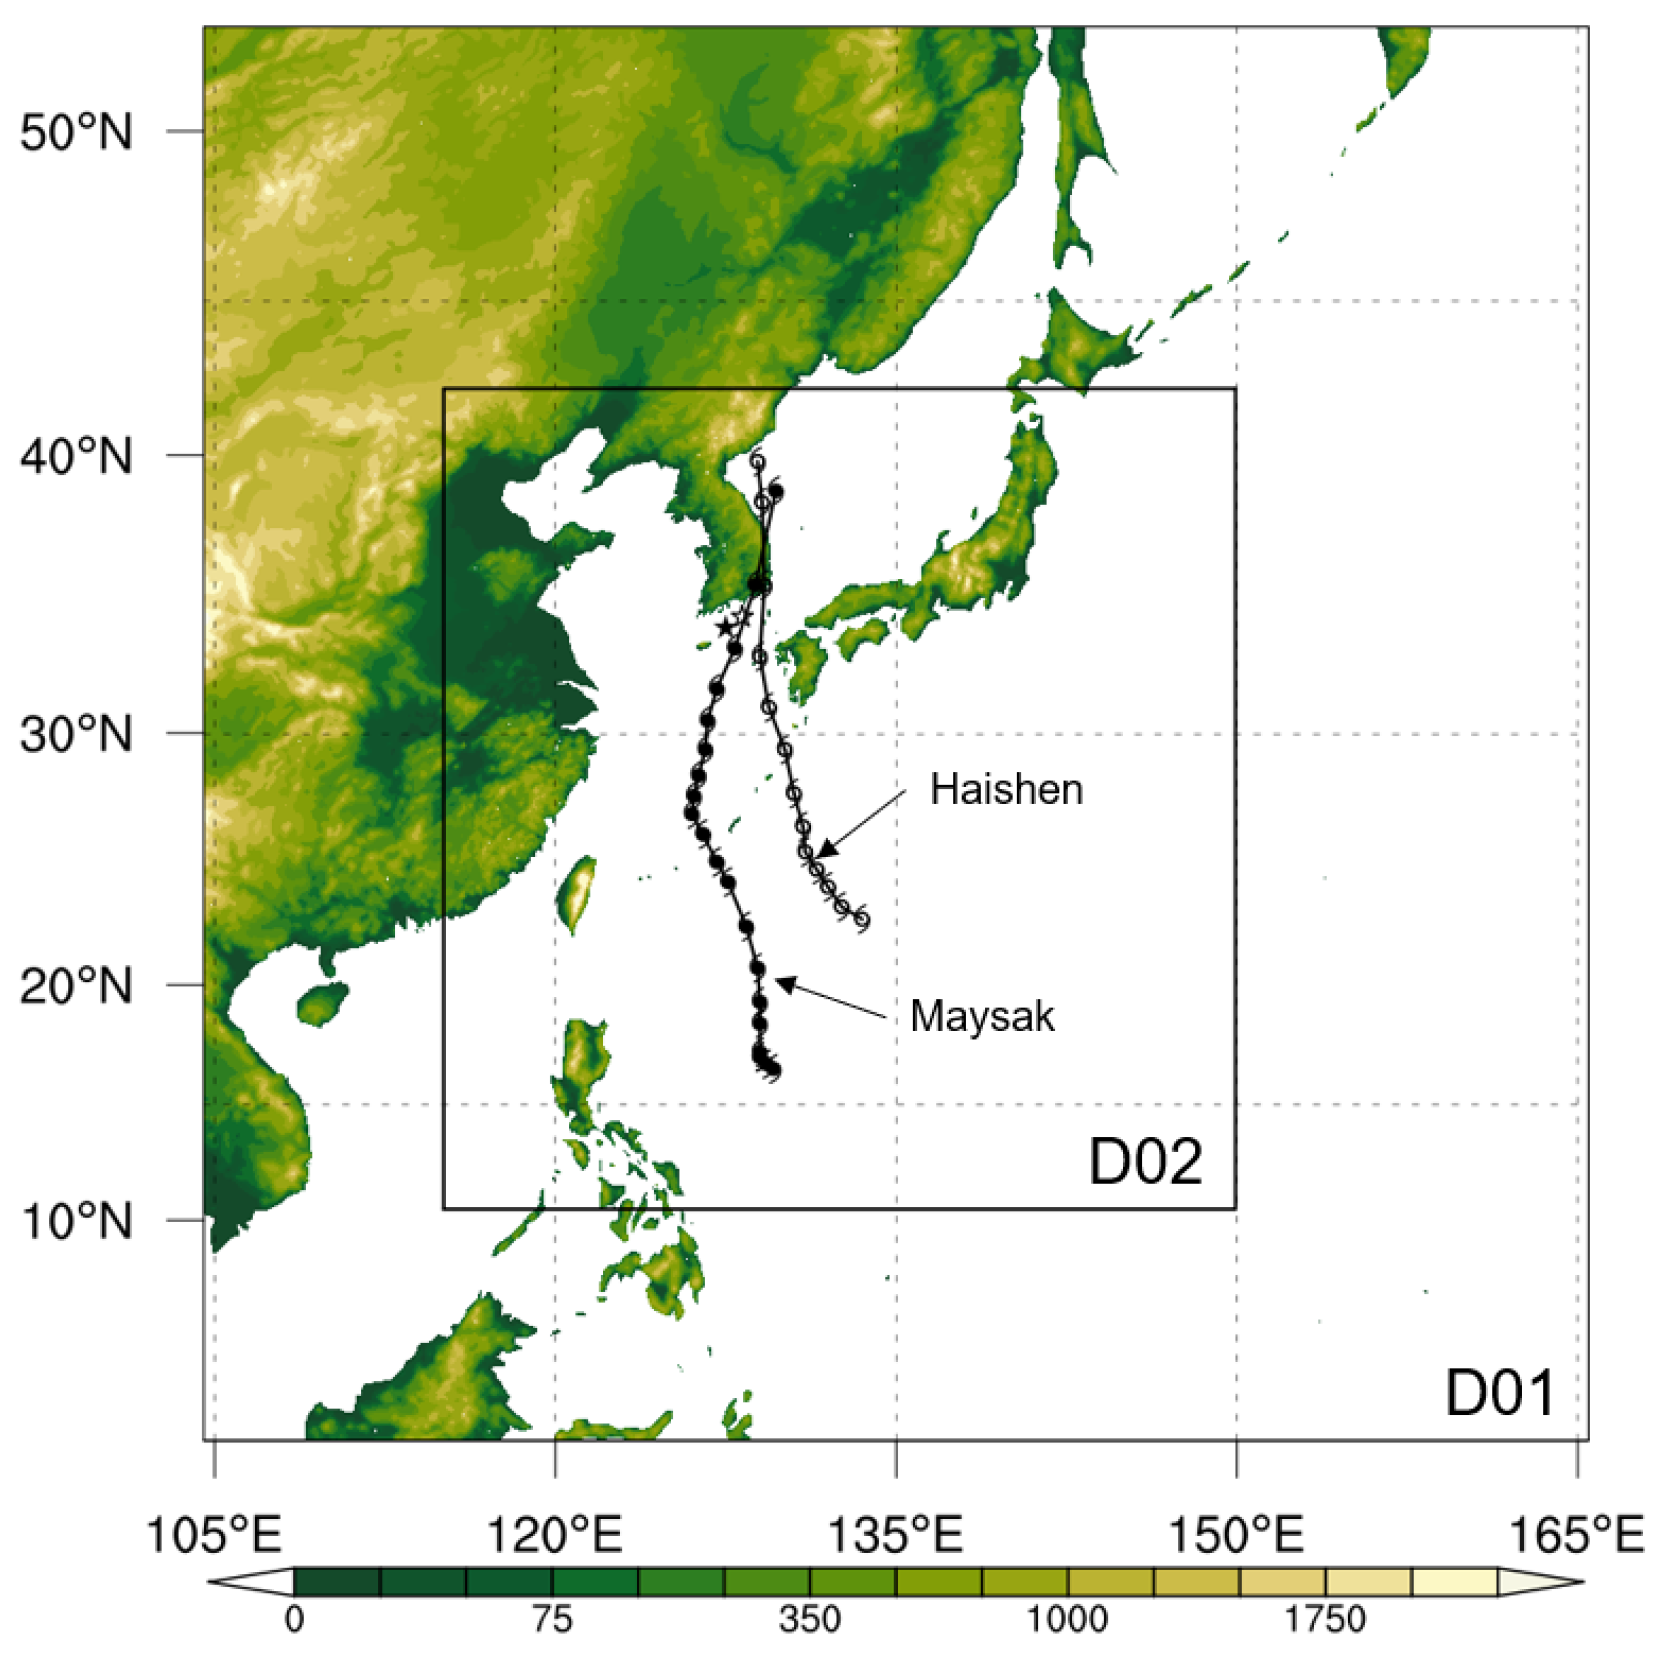
2. Model Configuration and Experimental Design
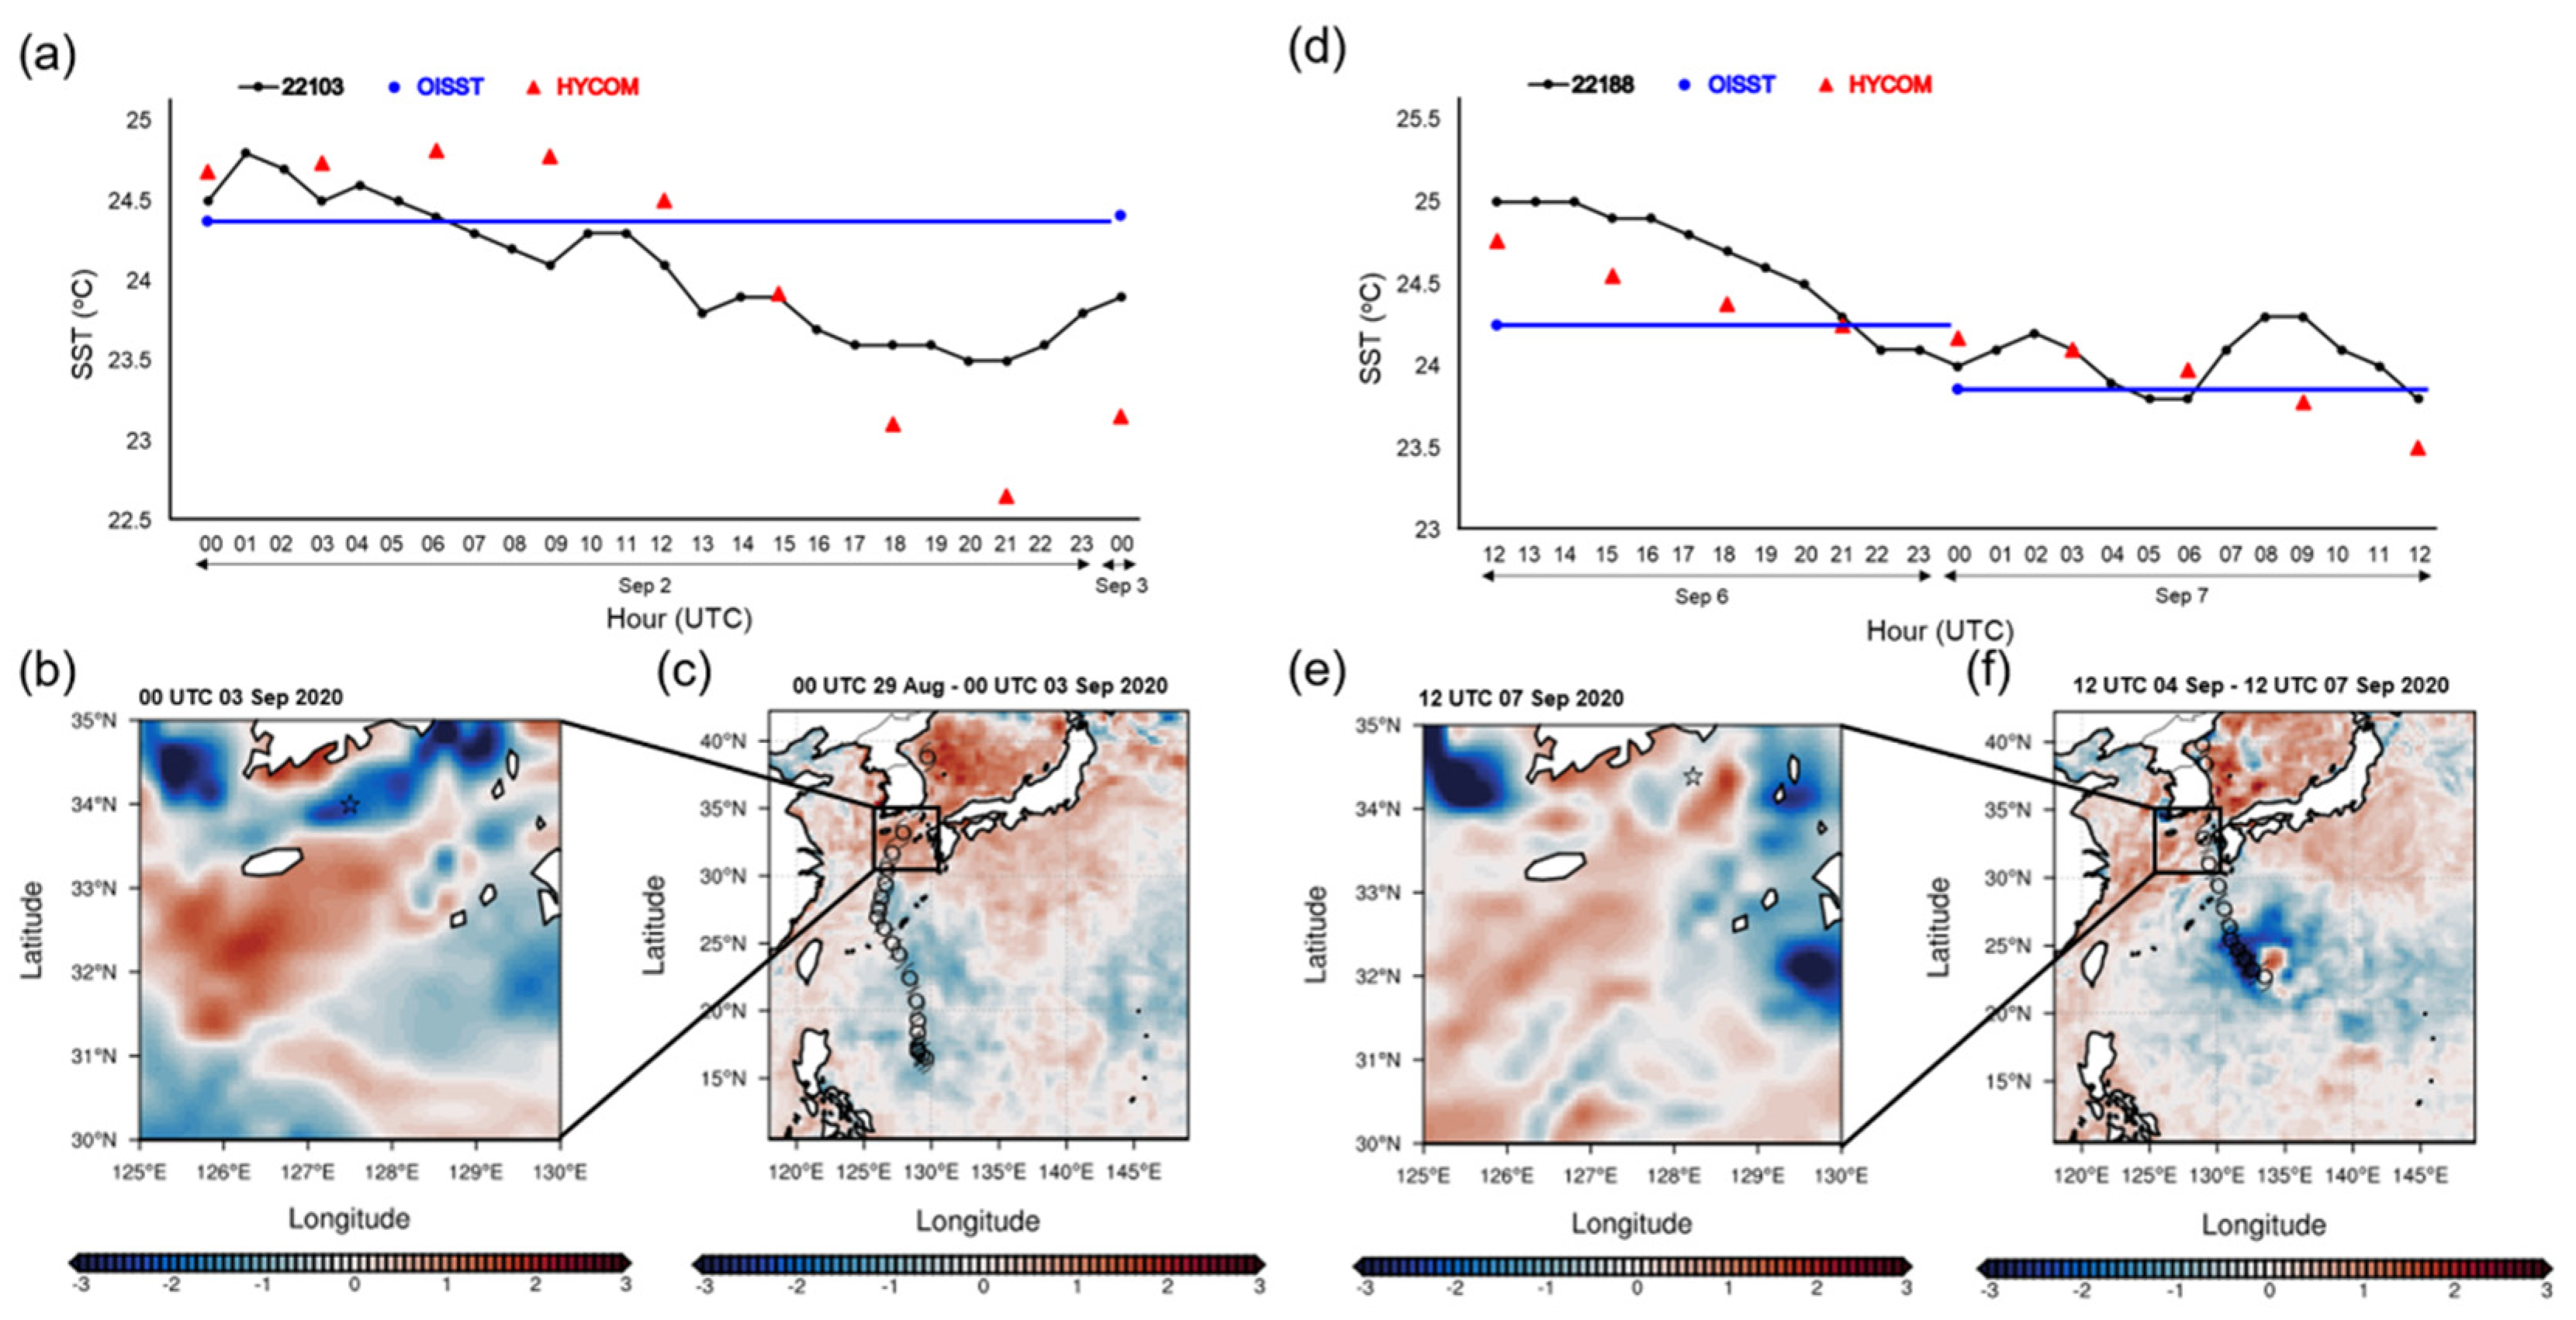
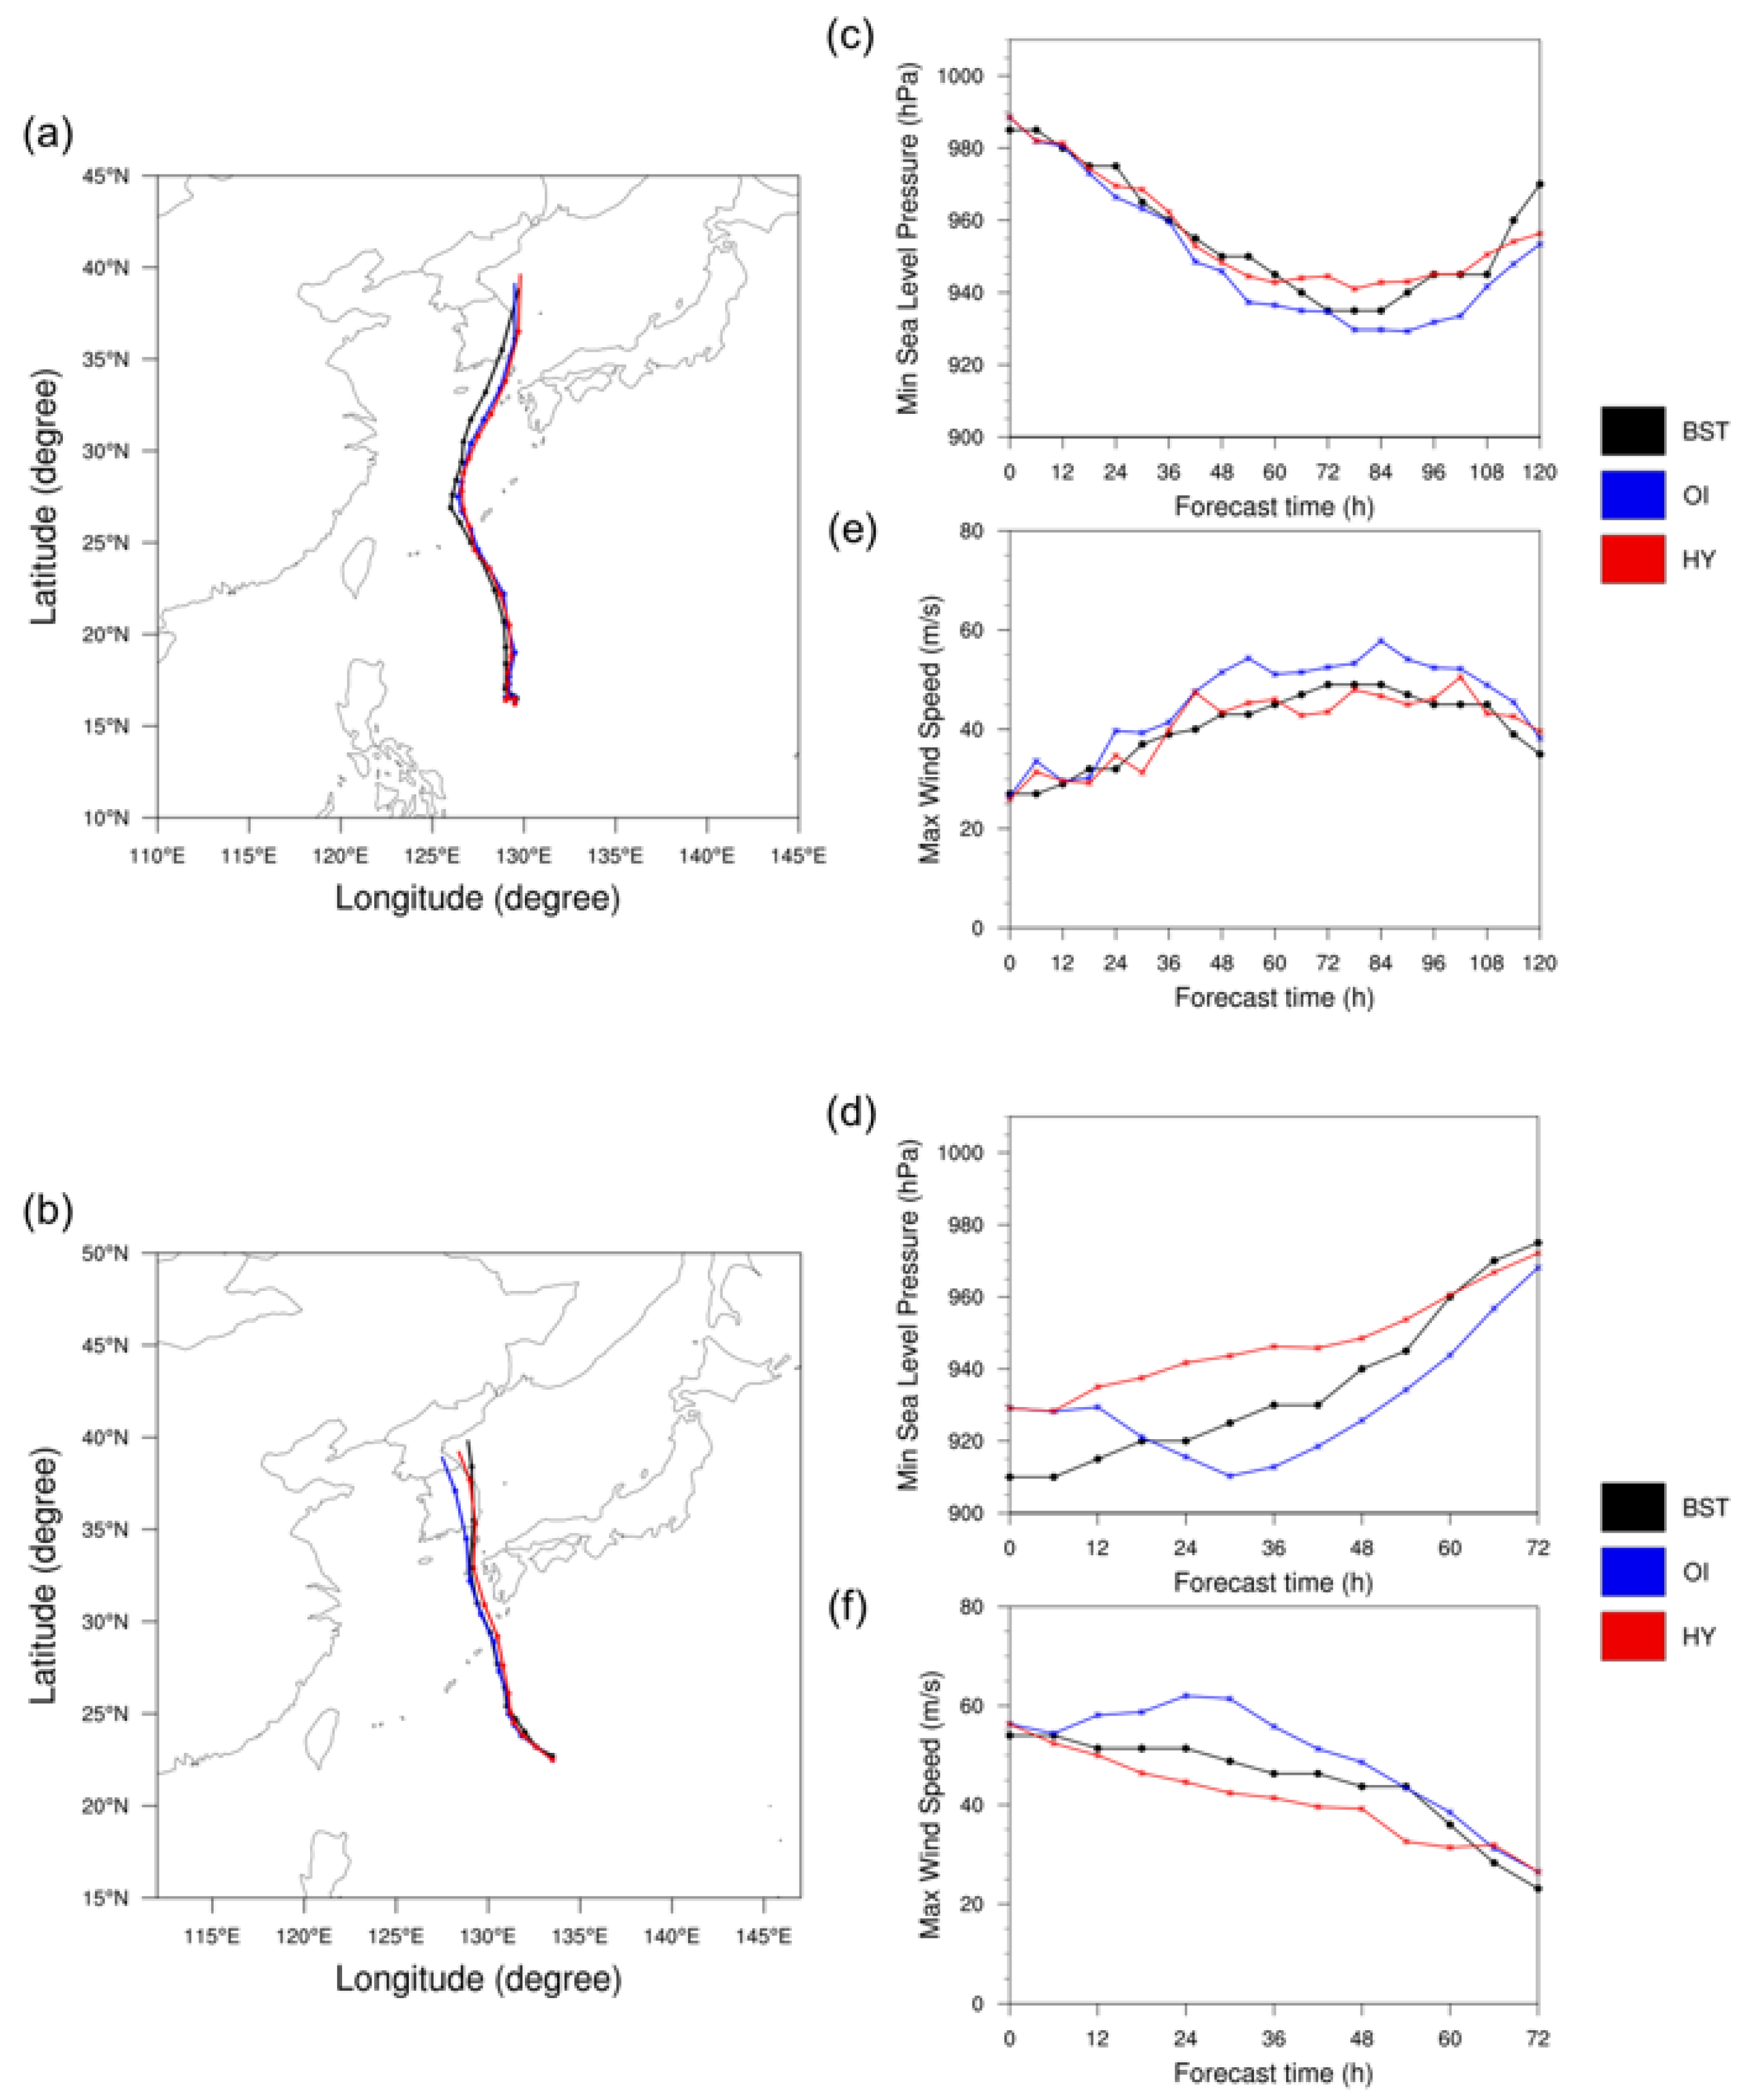
The WRF model version 4.1.2 was used to verify the impact of the different sea surface temperature (SST) data on typhoon forecasts. The model consisted of multiple two-way nesting fixed domains with uniform horizontal resolutions (west-east and south-north grid points) of 12 km (491 × 501) and 4 km (841 × 871), and time steps of 60 s and 20 s, respectively (Figure 1). The model had 35 vertical levels with the top model level at 50 hPa. As shown in Table 1, the model utilized the Kain–Fritsch [22] cumulus parameterization scheme, the 6 class WRF single moment microphysics (WSM6) [23] cloud microphysics scheme, the Yonsei University planetary boundary layer scheme (YSU) [24,25], the rapid radiative transfer model for long-wave radiation scheme [26], and the Dudhia short-wave radiation scheme [27]. We selected those schemes because they have been widely used in diverse study areas and have already demonstrated their good performances for East Asian countries in previous studies [28,29,30].
We used the National Centers for Environmental Prediction (NCEP) FNL (final) operational global analysis and forecast data with a temporal resolution of 6 h and a horizontal spatial resolution of 0.25° × 0.25° as the initial conditions of the WRF model. We selected widely used two SST data in this study, which were obtained from the Daily Optimal Interpolation Sea Surface Temperature (OISST) version 2 [31] and from the HYbrid Coordinate Ocean Model/Navy Coupled Ocean Data Assimilation (HYCOM/NCODA; GLBy0.08/expt_93.0, hereafter HYCOM) [32]. The main characteristics of the two data are summarized in Table 2. The notable differences between the two data are the different horizontal resolutions, data provision time intervals, and the kind of satellite data used to estimate each SST data. OISST (HYCOM) data has 0.25° × 0.25° (0.03° × 0.08°) horizontal resolution in latitude-longitude directions and it is provided daily (3-hour intervals). When it comes to satellite data, the Advanced Very High Resolution Radiometer (AVHRR) data are only used as input for SST estimation in the OISST data, while diverse satellite data are used for SST estimation in HYCOM data. In this study, we prescribed the two data in the WRF model at 6 h intervals, even if OISST data were not changed every 6 h. Thus, the same SST data were used at 6 h intervals during the day when using the OISST data. Hereafter, we refer to our model runs using the OISST and HYCOM data as the OI and HY run, respectively.
We selected two typhoons, Maysak and Haishen, that affected Korea in a row in 2020 for this study. We conducted five-day (from 00 UTC 29 August 2020 to 00 UTC 3 September 2020) and three-day (from 12 UTC 4 September 2020 to 12 UTC 7 September 2020) simulations for typhoons Maysak and Haishen, respectively, to intensively analyze the forecast performance for the landfall period. In this study, the typhoon forecast performances were verified using the Regional Specialized Meteorological Center (RSMC) best track (BST) data, and the BSTs of the two typhoons with respect to the simulation period are shown in Figure 1.

3. Results

To compare the accuracy of satellite-based (OISST) and model-reanalysis (HYCOM) data, we used in situ SST observations around each typhoon’s landfall period at two buoy stations close to each typhoon pathway (Figure 2a,d). Figure 2a,d show SST fluctuations in OISST and HYCOM data while the two typhoons approached and passed by each buoy station. Also, Figure 2b,e show the differences in SST between the HYCOM and OISST data for Maysak (09 KST 3 September 2020; 00 UTC 3 September 2020) and Haishen (21 KST 7 September 2020; 12 UTC 7 September 2020), respectively. Overall, the HYCOM data provided every three hours reflected relatively well the pattern of changes in SST compared to the OISST data. The typhoon-induced SST cooling when the typhoon approached and passed near the buoy was realistically reflected in both typhoon cases in HYCOM data, while OISST data showed relatively little change in SST for that period (Figure 2a,d). We also analyzed the averaged SST differences between the HYCOM and OISST data for entire simulation hours (Figure 2c,f) with the BSTs of two typhoons. The result showed that the HYCOM data had a lower SST than the OISST data, south of 30° N, and especially around the typhoon track. In particular, in the case of Haishen, the largest differences in SST (SST > 4 °C cooler for HYCOM than OISST) occurred at 22° N 130° E to 26° N 133° E, possibly due to the slow translation speed of the typhoon at that time, or the typhoon-induced SST cooling at different locations in the two datasets. In addition, in both typhoon cases, the meridional gradient of the SST difference between the two data seemed large because relatively higher SST was distributed north of 30° N in the HYCOM data than in the OISST data, but not in the subtropical region where the typhoon-induced SST cooling was reflected in the HYCOM data.
To find out how the different SST distributions of these two data affect typhoon forecasts, both data were prescribed as boundary conditions in the WRF model at 6 h intervals.
Figure 3 shows the track and intensity forecast results for typhoons Maysak (Figure 3a–c) and Haishen (Figure 3d–f) in the OI and HY runs. In both typhoon cases, track forecast performances were similar in the OI and HY runs. However, intensity forecast performances were improved in the HY runs. Due to higher SSTs around the typhoons in the OISST data (Figure 2c,f), the simulated typhoons tended to be over-intensified in the OI runs compared to the BSTs and HY runs. The differences in intensity forecasts between the two runs were more considerable in the Haishen case. In the case of Haishen, the maximum differences in minimum sea level pressure (MSLP) and maximum wind speed at 10 m (MWS) between the two runs were 34 hPa at 18 UTC 5 September 2020 (30 h forecast) and 20 m s−1 at 12 UTC 5 September 2020 (24 h forecast), respectively. Notably, despite Haishen being in the weakening stage, the simulated typhoon was strengthened up to 30 h forecasts in the OI run. Whereas in the HY run, the simulated typhoon was weakened with similar intensity to that reflected in the BST data. Due to this, typhoon intensity forecast performance at the landfall time in Korea (00 UTC 7 September 2020) was highly improved compared to the OI run.
Figure 4 shows the simulated outgoing longwave radiation (OLR) in the OI and HY runs for typhoon Haishen at 00 UTC 6 September 2020 (36 h forecast) compared to the satellite image from the University of Wisconsin–Madison, Cooperative Institute for Meteorological Satellite Studies (CIMSS; available at https://tropic.ssec.wisc.edu/#SPECIAL, accessed on 28 April 2020). It seemed that the simulated typhoon eye was distinctive and convections near typhoon center were considerably stronger in the OI run than in the HY run and satellite image. In addition, it seemed that the simulated typhoon eye in the OI run was considerably notable, and it was surrounded by stronger and more symmetric eyewall than in the HY run and satellite image. In addition to the differences near typhoon center, convections located southeast of the typhoon were more organized in the OI run because of the higher SSTs at <30° N. Similarly, for Maysak, simulated typhoon eye size and structure were the largest and strongest, respectively, in the OI run (not shown). In both typhoon cases, there were no distinct OLR differences found over the ocean or land far from the typhoons (not shown).
Additionally, the simulated 30 kt wind radius of typhoon (R30) at the same period in the OI and HY runs were 640 and 600 km, respectively. When comparing the typhoon size with RSMC BST data, the shortest radius of 30 kt winds of the typhoon was about 602 km at that time. It seemed that in HY runs, typhoon intensity simulation and its weakening trend could be improved, as well as typhoon size and structure, through more realistically reflected typhoon-induced SST cooling.
To find out how different SST data greatly influenced the typhoon intensity forecasts in the two runs, we compared the SST data for the initial 24 h forecast (from 12 UTC 4 September to 12 UTC 5 September 2020; Figure 5). In the case of HYCOM data, SST changed every 3 h, hence the SST data shown in Figure 5a,c,e were different. Moreover, typhoon-induced SST cooling occurred followed by the movement of the typhoon, and it seemed that the cold SST anomalies, the so-called cold wake, gradually strengthened over time. A few days later, the strengthened negative SST anomaly in the HYCOM data weakened (12 UTC 6 September 2020; not shown). However, for the same period, SST changed only once in the OISST data (Figure 5d). Unlike the HYCOM data, the OISST data showed strong SST cooling in a small elliptical area east of the typhoon, far from its trajectory; this was maintained since 00 UTC 5 September 2020 (Figure 5d). This cold wake area in the OISST data disappeared 60 h later at 00 UTC 7 September 2020 (not shown). Similarly, for Maysak, typhoon-induced SST cooling was not realistically reflected in the OISST data (not shown).
The reason why the OISST data showed an inaccurate cold wake that deviated from the actual typhoon trajectory might be due to the relatively low horizontal resolution, production of daily mean SST data, and usage of only one satellite data (i.e., AVHRR) for SST estimation. In particular, it is known that the SST estimation from infrared satellite instruments such as AVHRR can only be exactly obtained in clear-sky conditions since cloud-contaminated data are often difficult to identify by infrared radiation [31,33]. Therefore, the inaccurate location or strength of typhoon-induced SST cooling in the OISST data seemed strongly related to the production of daily mean SST data using a somewhat imperfect SST estimation technique.
Figure 5g,h show the time series of averaged SST and upward moisture flux (MFX) within a radius of 300 km from the simulated typhoon Haishen center in both runs when differences in simulated typhoon intensity between the two runs were significant (from 12 h to 48 h forecast; from 00 UTC 5 September 2020 to 12 UTC 6 September 2020). As shown in Figure 5a–f, the simulated typhoon in the OI run moved far from the region with significant cold SST anomalies after the 12 h forecast, moving northward to the mid-latitudes through zones of declining SST. Due to this, SSTs were relatively warmer near the typhoon in the OI run than in the HY run; up to 48 h forecast, the largest difference in SST between the two runs was 2.9 K (at 18 h forecast). The surface sensible heat flux (SHF) and latent heat flux (LHF), which were heat extracted from the ocean and heat extracted from the ocean when seawater evaporates, respectively, were also larger in the OI run (not shown). Bongirwar et al. (2011) [34] obtained similar results that simulated typhoon intensities were significantly affected by the total heat flux. In addition, SST also affects the MFX near the typhoon. The simulated MFX values showed a similar trend (in Figure 5h) to that shown in Figure 5g. In the OI run, the warmer SST around the typhoon produced a larger MFX: the typhoon’s wind field increased the MFX vertically, generating stronger convection, and thus developing a far stronger typhoon than in the HY run.
In addition, as shown in Figure 2f, the significant meridional gradient in the difference in SST between the HYCOM and OISST datasets for the entire simulation was due to the relatively strong typhoon-induced SST cooling for the subtropical region reflected in the HYCOM data. Thus, the wide range of subtropical region cold SST anomalies produced a substantially lower meridional SST gradient in the HYCOM data. Therefore, the HY run showed less variation in average SST near the typhoon than the OI run (Figure 5g).
Figure 6 shows the maximum value of the MWS from the Korea Meteorological Administration (KMA) Automated Synoptic Observing System (ASOS) observation data for the 12 h periods centered on the times when typhoons Maysak and Haishen were closest to the Korean Peninsula (18 UTC 2 September 2020 and 12 UTC 6 September 2020, respectively). Since both typhoons passed through the southern part of the country and over the sea to the east of the peninsula, a very strong MWS was observed mainly along the south and east coast during the time directly affected by the typhoons. We evaluated the forecast performances of the two runs compared to all ASOS stations and the area where the wind from the typhoon was particularly strong. We used percent bias (PBIAS) to compare the overall results of the two runs. PBIAS measures the average tendency of the simulated values to be larger or smaller than the observed values. It can be calculated as follows (Equation (1)):
PBIAS = 100 i = 1 N ( F i O i ) i = 1 N O i
where F i is the simulated value and O i is the observed value. The overall result showed that the OI run had a tendency to overestimate the MWS until landfall compared to the HY run and observation data. Although the HY runs also tended to overestimate the MWS to some extent compared to the observations, they improved by about 3% compared to the forecast performances of the OI run for both typhoon cases. In addition, both runs overestimated the MWS substantially for typhoon Haishen, which has a much stronger LMI compared to typhoon Maysak.
Table 3 shows the forecast performances of the MWS in both runs for the top 10% of ASOS stations, which recorded the highest MWS values during each typhoon’s landfall period. Similar to its overall forecast performance, the OI runs tended to overestimate the MWS for the top 10% of ASOS stations, by 1.10 and 3.50 m s−1 for typhoons Maysak and Haishen, respectively. In the HY runs, the simulated MWS was slightly underestimated by −0.14 m s−1 for Maysak and somewhat overestimated by 2.52 m s−1 for Haishen, but, overall, forecast performances of the MWS were better than that of the OI run. Moreover, for both typhoons, the root mean square error (RMSE) of the HY run is lower than that of the OI run, suggesting that the overall prediction accuracy of the HY run was relatively high.

4. Summary and Conclusions

This study investigated the impact of the SST update on typhoon forecasts. Compared with the in situ SST data for typhoons Maysak and Haishen landfall periods, the daily average OISST data did not accurately reflect typhoon-induced changes in SST, whereas the HYCOM data in 3 h intervals realistically estimated typhoon-induced SST cooling. Furthermore, the typhoon intensity forecast performances in the HY runs were similar to that obtained in the BST data. On the other hand, simulated typhoon intensities tended to be over-intensified in the OI runs due to the unrealistic warm SSTs around the typhoon’s pathway. In addition, the overall forecast performances of simulated MWS during each typhoons’ landfall period were improved in the HY runs compared to the OI runs. Therefore, this study showed that in order to improve the typhoon intensity and overall typhoon forecast performances during the typhoon landfall period, it is important to provide the SST data frequently for a more realistic representation of SST variation by typhoons.
The limitation of this study mostly lies in prescribing SST without directly forecasting it. For this reason, the atmospheric–ocean interaction was not realistically reflected in the simulation results. In addition, if the typhoon track was unrealistically simulated, the realistic typhoon-induced SST changes were also not reflected in the typhoon track. Thus, it was difficult to conduct a study on various typhoon cases. As a result, this study only dealt with typhoons Maysak and Haishen, which showed at least a similar typhoon track compared to the BST data. Therefore, to increase the reliability of the results of this study, it is essential to study various typhoon cases, and it is necessary to investigate the impact of sophisticated SST data on the mid-term (more than 5 days) typhoon forecast. Recently, [35] suggested the new approach to provide the effect of the atmospheric–ocean coupled model for typhoon forecasting using the atmosphere-only model. This could help to overcome the limitations of imperfect SST around typhoons in the atmosphere-only model without prescribing SST data. An atmospheric–ocean coupled model for selected typhoon cases in this study can also overcome the limitations caused by SST prescription. Furthermore, meaningful results will be derived by exploring the impact of TC-induced SST cooling on subsequent typhoons. In addition, we used OISST data, even if the SST estimation of OISST was only exactly obtained in clear-sky conditions. Nevertheless, since many studies have used daily mean OISST data, not only for typhoon forecasting but also for the analysis of typhoon-induced SST cooling [36,37,38,39], this study could provide some perspectives (e.g., the importance of higher temporal-resolution of SST data for typhoon forecast) for improvements in typhoon forecast performance.

Author Contributions

Conceptualization, J.P. and D.-H.C.; methodology, J.P.; validation, W.C. and D.-H.C.; investigation, J.P.; data curation, J.P.; writing—original draft preparation, J.P.; writing—review and editing, J.P., W.C., D.-H.C., S.-H.W. and J.-R.L.; visualization, J.P.; supervision, D.-H.C.; funding acquisition, D.-H.C. All authors have read and agreed to the published version of the manuscript.

Funding

This study was funded by the National Typhoon Center at the Korea Meteorological Administration (‘Development of typhoon analysis and forecast technology’, KMA2018-00722). This study was funded by the Korean Ministry of Oceans and Fisheries (20190344).

Institutional Review Board Statement

Not applicable.

Informed Consent Statement

Not applicable.

Data Availability Statement

The initial and boundary field data in this work are available for download via the Research Data Archive of NCAR: https://doi.org/10.5065/D65Q4T4Z (accessed on 28 April 2020). The NOAA OI SST V2 High Resolution Dataset data provided by the NOAA PSL, Boulder, Colorado, USA, from their website at https://psl.noaa.gov (accessed on 28 April 2020). The HYCOM data provided by the National Ocean Partnership Program and the Office of Naval Research, the output is available at https://hycom.org (accessed on 28 April 2020).

Conflicts of Interest

The authors declare no conflict of interest.

References

  1. Needham, H.F.; Keim, B.D.; Sathiaraj, D. A review of tropical cyclone-generated storm surges: Global data sources, observations, and impacts. Rev. Geophys. 2015, 53, 545–591. [Google Scholar] [CrossRef]
  2. Peduzzi, P.; Chatenoux, B.; Dao, H.; De Bono, A.; Herold, C.; Kossin, J.; Mouton, F.; Nordbeck, O. Global trends in tropical cyclone risk. Nat. Clim. Change 2012, 2, 289–294. [Google Scholar] [CrossRef]
  3. Weinkle, J.; Landsea, C.; Collins, D.; Musulin, R.; Crompton, R.P.; Klotzbach, P.J.; Pielke, R. Normalized hurricane damage in the continental United States 1900–2017. Nat. Sustain. 2018, 1, 808–813. [Google Scholar] [CrossRef]
  4. Emanuel, K. Increasing destructiveness of tropical cyclones over the past 30 years. Nature 2005, 436, 686–688. [Google Scholar] [CrossRef] [PubMed]
  5. Kossin, J.P. A global slowdown of tropical-cyclone translation speed. Nature 2018, 558, 104–107. [Google Scholar] [CrossRef]
  6. Webster, P.J.; Holland, G.J.; Curry, J.A.; Chang, H.-R. Changes in tropical cyclone number, duration, and intensity in a warming environment. Science 2005, 309, 1844–1846. [Google Scholar] [CrossRef] [Green Version]
  7. Chen, T.; Chen, S.; Zhou, M.; Tu, C.; Zhang, A.; Chen, Y.; Li, W. Northward Shift in Landfall Locations of Tropical Cyclones over the Western North Pacific during the Last Four Decades. Adv. Atmos. Sci. 2022, 39, 304–319. [Google Scholar] [CrossRef]
  8. Kossin, J.P.; Emanuel, K.A.; Vecchi, G.A. The poleward migration of the location of tropical cyclone maximum intensity. Nature 2014, 509, 349–352. [Google Scholar] [CrossRef] [Green Version]
  9. Studholme, J.; Fedorov, A.V.; Gulev, S.K.; Emanuel, K.; Hodges, K. Poleward expansion of tropical cyclone latitudes in warming climates. Nat. Geosci. 2022, 15, 14–28. [Google Scholar] [CrossRef]
  10. Chen, G.; Zhang, X.; Bai, L.; Wan, R. Verification of tropical cyclone operational forecast in 2018. In Proceedings of the ESCAP/WMO Typhoon Committee, Guangzhou, China, 26 February–1 March 2019; p. 26. [Google Scholar]
  11. Morgan, S.T.; Pu, Z.; Westrelin, S.; Yamaguchi, M. SIXTH INTERNATIONAL WORKSHOP on TROPICAL CYCLONES, November 2006. Available online: https://severeweather.wmo.int/iwtc/document/Topic_3_3_Chun_Chieh_Wu.pdf (accessed on 15 October 2022).
  12. Cangialosi, J.P.; Blake, E.; DeMaria, M.; Penny, A.; Latto, A.; Rappaport, E.; Tallapragada, V. Recent progress in tropical cyclone intensity forecasting at the National Hurricane Center. Weather. Forecast. 2020, 35, 1913–1922. [Google Scholar] [CrossRef]
  13. Chen, H.; Zhang, D.-L.; Carton, J.; Atlas, R. On the rapid intensification of Hurricane Wilma (2005). Part I: Model prediction and structural changes. Weather. Forecast. 2011, 26, 885–901. [Google Scholar] [CrossRef]
  14. Mohanty, U.; Osuri, K.K.; Tallapragada, V.; Marks, F.D.; Pattanayak, S.; Mohapatra, M.; Rathore, L.; Gopalakrishnan, S.; Niyogi, D. A great escape from the Bay of Bengal “super sapphire–Phailin” tropical cyclone: A case of improved weather forecast and societal response for disaster mitigation. Earth Interact. 2015, 19, 1–11. [Google Scholar] [CrossRef]
  15. Srinivas, C.; Bhaskar Rao, D.; Yesubabu, V.; Baskaran, R.; Venkatraman, B. Tropical cyclone predictions over the Bay of Bengal using the high-resolution Advanced Research Weather Research and Forecasting (ARW) model. Q. J. R. Meteorol. Soc. 2013, 139, 1810–1825. [Google Scholar] [CrossRef]
  16. Brand, S. The effects on a tropical cyclone of cooler surface waters due to upwelling and mixing produced by a prior tropical cyclone. J. Appl. Meteorol. Climatol. 1971, 10, 865–874. [Google Scholar] [CrossRef]
  17. Wada, A.; Niino, H.; Nakano, H. Roles of vertical turbulent mixing in the ocean response to Typhoon Rex (1998). J. Oceanogr. 2009, 65, 373–396. [Google Scholar] [CrossRef]
  18. Chiang, T.-L.; Wu, C.-R.; Oey, L.-Y. Typhoon Kai-Tak: An ocean’s perfect storm. J. Phys. Oceanogr. 2011, 41, 221–233. [Google Scholar] [CrossRef]
  19. Bender, M.A.; Ginis, I.; Kurihara, Y. Numerical simulations of tropical cyclone-ocean interaction with a high-resolution coupled model. J. Geophys. Res. Atmos. 1993, 98, 23245–23263. [Google Scholar] [CrossRef]
  20. Chan, J.C.; Duan, Y.; Shay, L.K. Tropical cyclone intensity change from a simple ocean–atmosphere coupled model. J. Atmos. Sci. 2001, 58, 154–172. [Google Scholar] [CrossRef]
  21. Schade, L.R.; Emanuel, K.A. The ocean’s effect on the intensity of tropical cyclones: Results from a simple coupled atmosphere–ocean model. J. Atmos. Sci. 1999, 56, 642–651. [Google Scholar] [CrossRef]
  22. Kain, J.S. The Kain–Fritsch convective parameterization: An update. J. Appl. Meteorol. 2004, 43, 170–181. [Google Scholar] [CrossRef]
  23. Hong, S.-Y.; Lim, J.-O.J. The WRF single-moment 6-class microphysics scheme (WSM6). Asia-Pac. J. Atmos. Sci. 2006, 42, 129–151. [Google Scholar]
  24. Hong, S.-Y.; Noh, Y.; Dudhia, J. A new vertical diffusion package with an explicit treatment of entrainment processes. Mon. Weather. Rev. 2006, 134, 2318–2341. [Google Scholar] [CrossRef] [Green Version]
  25. Noh, Y.; Cheon, W.; Hong, S.; Raasch, S. Improvement of the K-profile model for the planetary boundary layer based on large eddy simulation data. Bound. -Layer Meteorol. 2003, 107, 401–427. [Google Scholar] [CrossRef] [Green Version]
  26. Mlawer, E.J.; Taubman, S.J.; Brown, P.D.; Iacono, M.J.; Clough, S.A. Radiative transfer for inhomogeneous atmospheres: RRTM, a validated correlated-k model for the longwave. J. Geophys. Res. Atmos. 1997, 102, 16663–16682. [Google Scholar] [CrossRef] [Green Version]
  27. Dudhia, J. A nonhydrostatic version of the Penn State–NCAR mesoscale model: Validation tests and simulation of an Atlantic cyclone and cold front. Mon. Weather. Rev. 1993, 121, 1493–1513. [Google Scholar] [CrossRef]
  28. Bae, S.Y.; Hong, S.-Y.; Lim, K.-S.S. Coupling WRF double-moment 6-class microphysics schemes to RRTMG radiation scheme in weather research forecasting model. Adv. Meteorol. 2016, 2016, 5070154. [Google Scholar] [CrossRef]
  29. Lee, J.-B.; Lee, D.-K. Impact of cumulus parameterization schemes with different horizontal grid sizes on prediction of heavy rainfall. Atmosphere 2011, 21, 391–404. [Google Scholar]
  30. Lee, J.-W.; Hong, S.-Y. A numerical simulation study of orographic effects for a heavy rainfall event over Korea using the WRF model. Atmosphere 2006, 16, 319–332. [Google Scholar]
  31. Reynolds, R.W.; Smith, T.M.; Liu, C.; Chelton, D.B.; Casey, K.S.; Schlax, M.G. Daily high-resolution-blended analyses for sea surface temperature. J. Clim. 2007, 20, 5473–5496. [Google Scholar] [CrossRef]
  32. Chassignet, E.P.; Hurlburt, H.E.; Smedstad, O.M.; Halliwell, G.R.; Hogan, P.J.; Wallcraft, A.J.; Baraille, R.; Bleck, R. The HYCOM (hybrid coordinate ocean model) data assimilative system. J. Mar. Syst. 2007, 65, 60–83. [Google Scholar] [CrossRef]
  33. Chelton, D.B.; Wentz, F.J. Global microwave satellite observations of sea surface temperature for numerical weather prediction and climate research. Bull. Am. Meteorol. Soc. 2005, 86, 1097–1116. [Google Scholar] [CrossRef] [Green Version]
  34. Bongirwar, V.; Rakesh, V.; Kishtawal, C.; Joshi, P. Impact of satellite observed microwave SST on the simulation of tropical cyclones. Nat. Hazards 2011, 58, 929–944. [Google Scholar] [CrossRef]
  35. Liu, X.; Wei, J.; Zhang, D.L.; Miller, W. Parameterizing sea surface temperature cooling induced by tropical cyclones: 1. Theory and an application to Typhoon Matsa (2005). J. Geophys. Res. Ocean. 2019, 124, 1215–1231. [Google Scholar] [CrossRef]
  36. Fujiwara, K.; Kawamura, R. Active role of sea surface temperature changes over the Kuroshio in the development of distant tropical cyclones in boreal fall. J. Geophys. Res. Atmos. 2021, 126, e2021JD035056. [Google Scholar] [CrossRef]
  37. Kim, D.; Kim, H.-S. Relationship between the Tropical Sea Surface Temperature Distribution and Initiation Timing of the Typhoon Season in the Northwestern Pacific. J. Clim. Change Res. 2017, 8, 11–19. [Google Scholar] [CrossRef]
  38. Setiawan, R.Y.; Susanto, R.D.; Wirasatriya, A.; Alifdini, I.; Puryajati, A.D.; Maslukah, L.; Nurdin, N. Impacts of tropical cyclone Seroja on the phytoplankton chlorophyll-a and sea surface temperature in the Savu Sea, Indonesia. IEEE Access 2021, 9, 152938–152944. [Google Scholar] [CrossRef]
  39. Yu, S.; Subrahmanyam, M. Typhoon-Induced SST Cooling and Rainfall Variations: The Case of Typhoon CHAN-HOM and Nangka. Open Access Libr. J. 2017, 4, 1–12. [Google Scholar] [CrossRef]
Figure 1. Terrain height (m, shading) and model domains for all the simulations. Typhoon marks represent the Regional Specialized Meteorological Center (RSMC) best tracks of typhoons Maysak and Haishen. Filled and unfilled stars represent the Geomundo and Tongyeong stations at 34.0° N 127.5° E and 34.4° N 128.2° E, respectively.
Atmosphere 14 00072 g001
Figure 2. Time series of SST (°C) variations at the times when typhoons (a) Maysak and (d) Haishen passed near the Geomundo (34.0° N 127.5° E; 22103) and Tongyeong (34.4° N 128.2° E; 22188) stations. Blue: OISST; red: HYCOM; black: in-situ data. The OISST data are only provided in daily intervals and displayed SST values from OISST data were the same during the day regardless of the displayed time. Horizontal distribution of the difference in SST (°C, shading) between HYCOM and OISST data for typhoons (b) Maysak at 00 UTC 3 September 2020 and (e) Haishen at 12 UTC 7 September 2020. Star mark represents each buoy station, respectively. Horizontal distribution of average difference in SST (°C, shading) between HYCOM and OISST data for the entire forecast time for typhoons (c) Maysak and (f) Haishen. Typhoon marks represent the Regional Specialized Meteorological Center (RSMC) best tracks of typhoons Maysak and Haishen, respectively.
Atmosphere 14 00072 g002
Figure 3. Simulated (a), (b) track; (c,d) minimum sea-level pressure (hPa; MSLP); and (e,f) maximum wind speed at 10 m (m s−1; MWS) for typhoons Maysak (initialized at 00 UTC 29 August 2020; five-day runs) and Haishen (initialized at 12 UTC 4 September 2020; three-day runs), respectively. Black: the Regional Specialized Meteorological Center (RSMC) best track (BST) data; blue: OI run; red: HY run.
Atmosphere 14 00072 g003
Figure 4. (a) Satellite infrared (IR) image (available at https://tropic.ssec.wisc.edu/#SPECIAL (accessed on 28 April 2020)) and simulated outgoing longwave radiation (W m−2, shading; OLR) in the (b) HY and (c) OI runs for typhoon Haishen at 00 UTC 6 September 2020.
Atmosphere 14 00072 g004
Figure 5. Horizontal distribution of SST (K, shading) in the (a,c,e) HYCOM and (b,d,f) OISST data from 12 UTC 4 September to 12 UTC 5 September 2020 at 12 h intervals. Time series of averaged (g) SST (K) and (h) upward moisture flux (g m−2 s−1; MFX) near typhoon Haishen from 00 UTC 5 September 2020 to 12 UTC 6 September 2020. Blue: OI run, red: HY run. Black marks represent typhoon location at that time.
Atmosphere 14 00072 g005
Figure 6. Spatial distributions of observed maximum wind speed at 10 m (MWS) for typhoon (a) Maysak from 12 UTC 2 September 2020 to 00 UTC 3 September 2020 and (b) Haishen from 06 UTC 6 September 2020 to 18 UTC 6 September 2020.
Atmosphere 14 00072 g006
Table 1. WRF model configuration.
VersionWRF V4.1.2
DomainsD01D02
Horizontal Resolution12 km4 km
Grids (west-east × south-north)491 × 501841 × 871
Microphysics schemeWSM6
Cumulus schemeKFX
PBL schemeYSU
Long-wave/short-wave radiation schemeRRTM/Dudhia
LSMUnified Noah LSM
Table 2. Characteristics of two datasets used in this study.
OISSTHYCOM
PeriodSeptember 1981–presentJanuary 2003–present
Spatial Resolution (latitude/longitude)0.25°/0.25°0.03°/0.08°
Temporal resolutionDaily3-hour intervals
Input dataAVHRR, In situAVHRR, AMSR-E, METOP-A, GOES, MeteoSat-2, AATSR, CDT, XBT, In situ
AgencyNCEI/NOAAU.S NRL
Table 3. Comparison of simulated maximum wind speed at 10 m (MWS) during the typhoon landfall period for the top 10% of the observation in the OI and HY runs.
OIHY
MaysakBias1.10−0.14
RMSE4.263.18
HaishenBias3.502.52
RMSE4.393.55
Disclaimer/Publisher’s Note: The statements, opinions and data contained in all publications are solely those of the individual author(s) and contributor(s) and not of MDPI and/or the editor(s). MDPI and/or the editor(s) disclaim responsibility for any injury to people or property resulting from any ideas, methods, instructions or products referred to in the content.

