

Metabolic Factors Associated with Endoscopic Atrophy, Intestinal Metaplasia, and Gastric Neoplasms in Helicobacter pylori-Positive Patients

 ,
,  , ,
, ,
Abstract
1. Introduction
2. Materials and Methods
2.1. Study Design, Setting, and Patients
2.2. Variables and Outcomes
2.3. Statistical Analysis
3. Results
3.1. The Association among Endoscopic Gastric Atrophy, IM, and Gastric Neoplasms
3.2. Factors Associated with Endoscopic Gastric Atrophy
3.3. Factors Associated with Endoscopic Intestinal Metaplasia
3.4. Factors Associated with Gastric Neoplasms
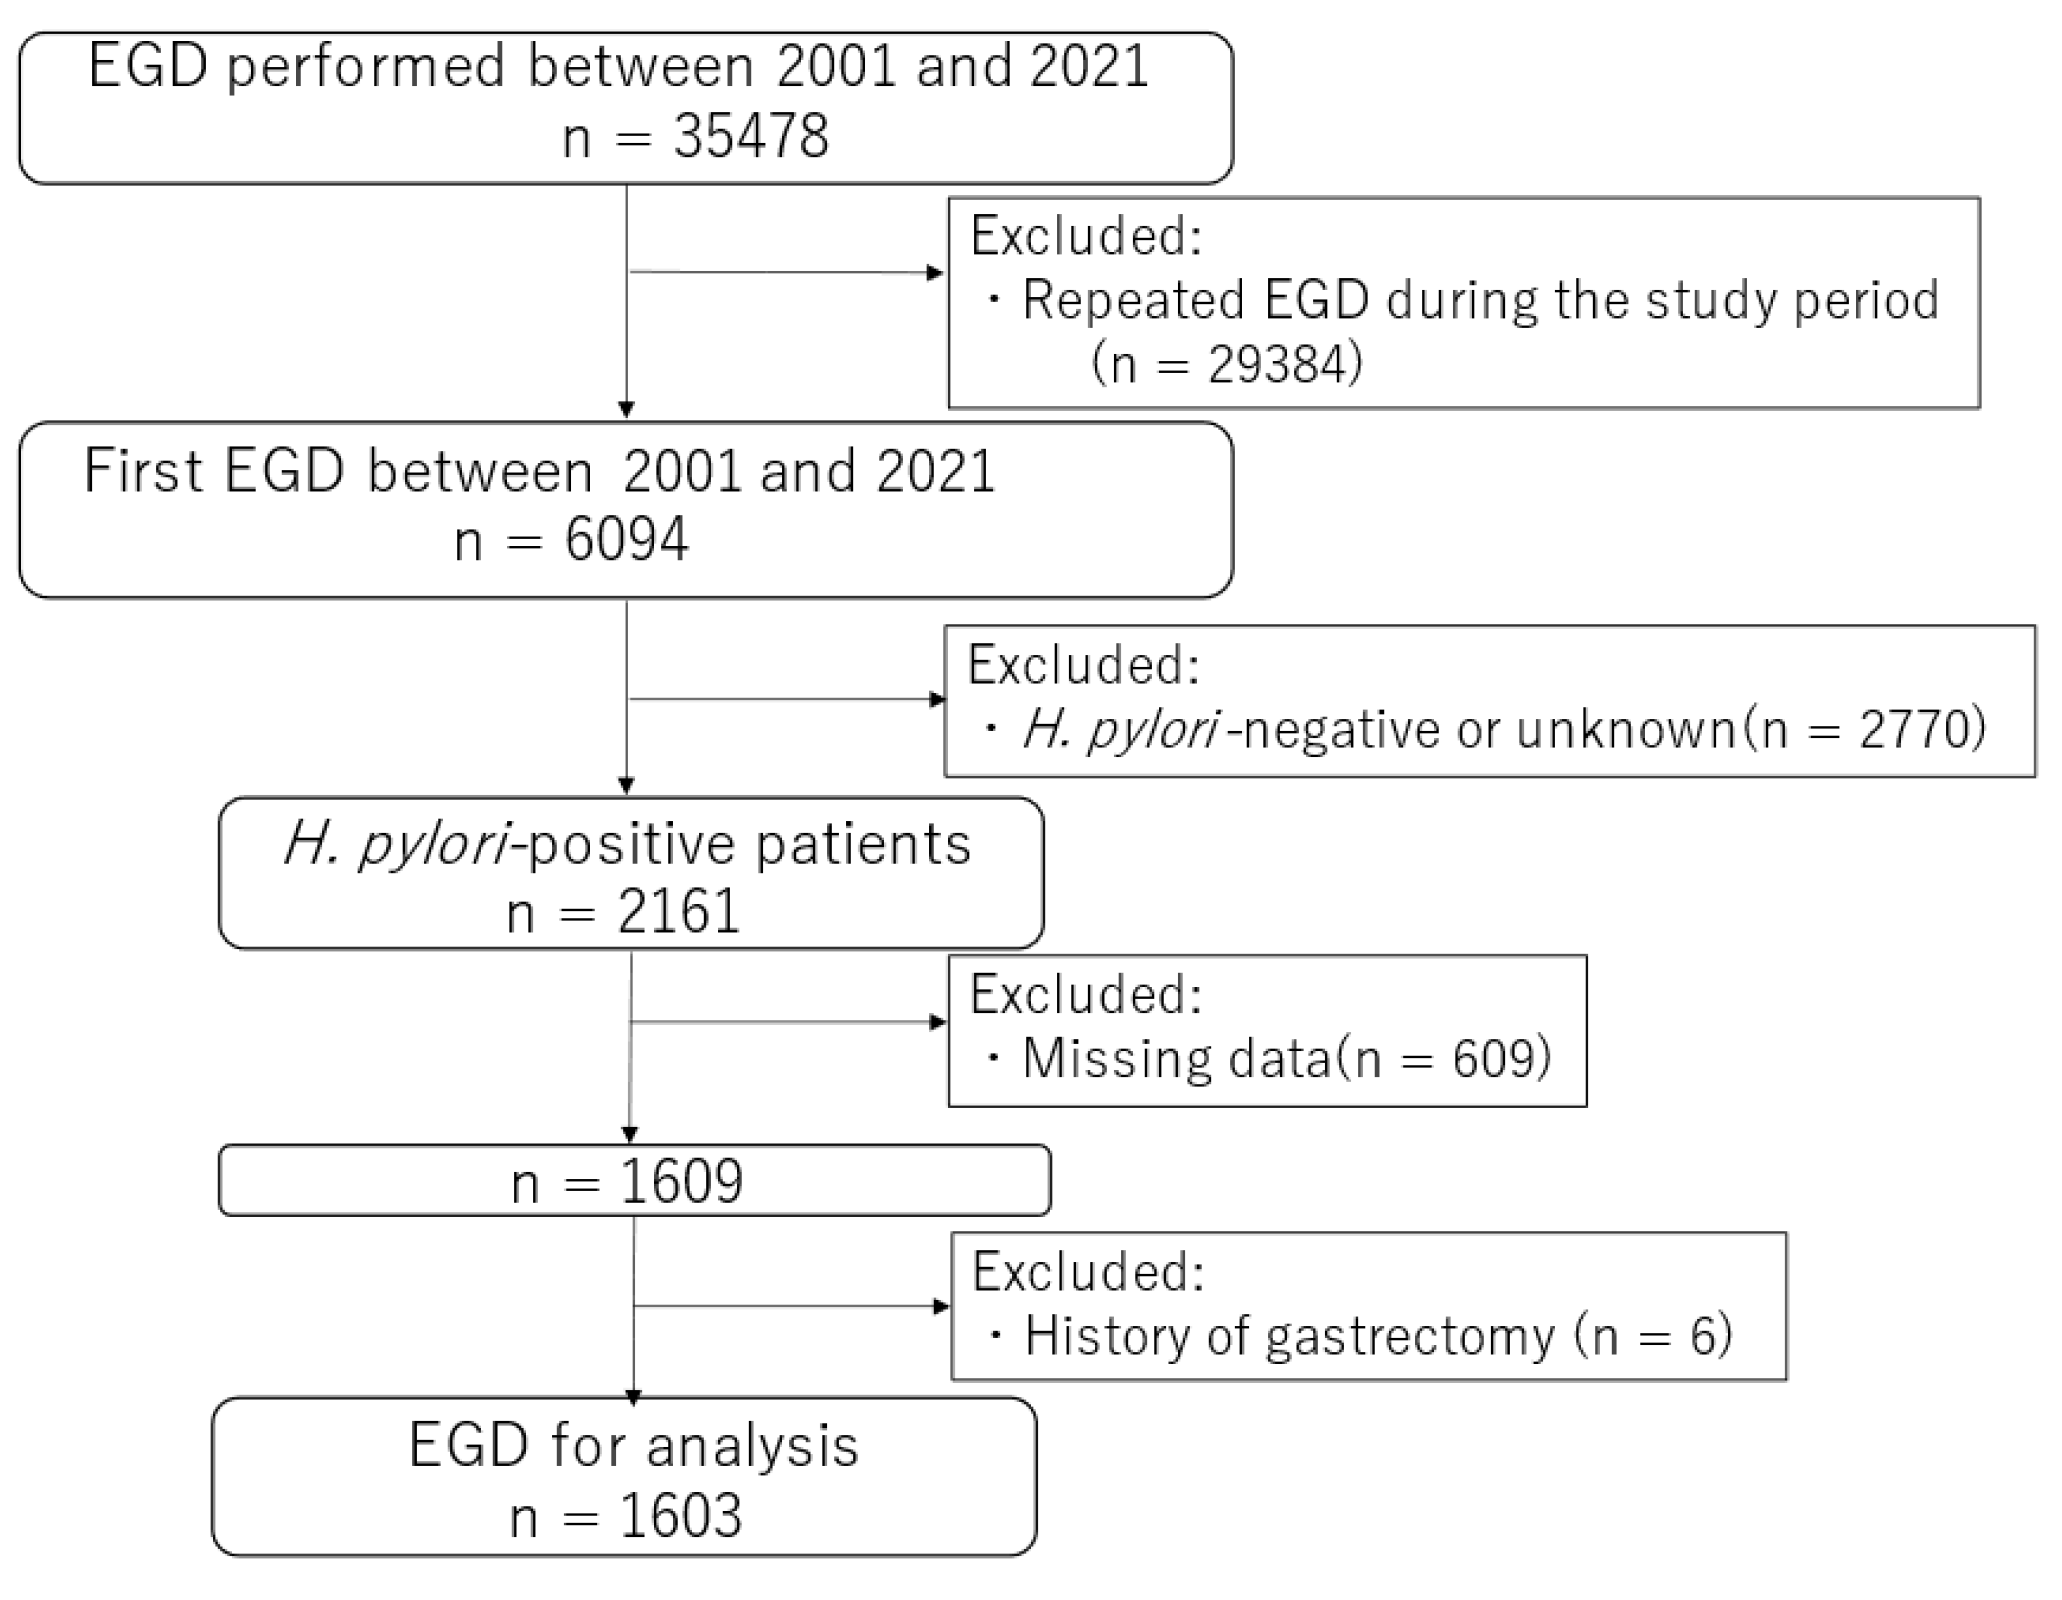
3.5. Prediction Model for Endoscopic Atrophy, Intestinal Metaplasia, and Gastric Neoplasms Using Several Variables
4. Discussion
5. Conclusions
Author Contributions
Funding
Institutional Review Board Statement
Informed Consent Statement
Data Availability Statement
Acknowledgments
Conflicts of Interest
References
- Global Burden of Disease Cancer Collaboration; Fitzmaurice, C.; Abate, D.; Abbasi, N.; Abbastabar, H.; Abd-Allah, F.; Abdel-Rahman, O.; Abdelalim, A.; Abdoli, A.; Abdollahpour, I.; et al. Global, regional, and national cancer incidence, mortality, years of life lost, years lived with disability, and disability-adjusted life-years for 29 cancer groups from 1990 to 2017: A systematic analysis of the Global Burden of Disease Study. JAMA Oncol. 2019, 5, 1749–1768. [Google Scholar] [PubMed]
- Uemura, N.; Okamoto, S.; Yamamoto, S.; Matsumura, N.; Yamaguchi, S.; Yamakido, M.; Taniyama, K.; Sasaki, N.; Schlemper, R.J. Helicobacter pylori infection and the development of gastric cancer. N. Engl. J. Med. 2001, 345, 784–789. [Google Scholar] [CrossRef] [PubMed]
- Smyth, E.C.; Nilsson, M.; Grabsch, H.I.; van Grieken, N.C.; Lordick, F. Gastric cancer. Lancet 2020, 396, 635–648. [Google Scholar] [CrossRef]
- Zamani, M.; Ebrahimtabar, F.; Zamani, V.; Miller, W.H.; Alizadeh-Navaei, R.; Shokri-Shirvani, J.; Derakhshan, M.H. Systematic review with meta-analysis: The worldwide prevalence of Helicobacter pylori infection. Aliment. Pharmacol. Ther. 2018, 47, 868–876. [Google Scholar] [CrossRef] [PubMed]
- Mantovani, A.; Petracca, G.; Beatrice, G.; Csermely, A.; Tilg, H.; Byrne, C.D.; Targher, G. Non-alcoholic fatty liver disease and increased risk of incident extrahepatic cancers: A meta-analysis of observational cohort studies. Gut 2022, 71, 778–788. [Google Scholar] [CrossRef] [PubMed]
- Guo, J.; Liu, C.; Pan, J.; Yang, J. Relationship between diabetes and risk of gastric cancer: A systematic review and meta-analysis of cohort studies. Diabetes Res. Clin. Pract. 2022, 187, 109866. [Google Scholar] [CrossRef]
- Sung, J.J.Y.; Coker, O.O.; Chu, E.; Szeto, C.H.; Luk, S.T.Y.; Lau, H.C.H.; Yu, J. Gastric microbes associated with gastric inflammation, atrophy and intestinal metaplasia 1 year after Helicobacter pylori eradication. Gut 2020, 69, 1572–1580. [Google Scholar] [CrossRef] [PubMed]
- Capelle, L.G.; de Vries, A.C.; Haringsma, J.; Ter Borg, F.; de Vries, R.A.; Bruno, M.J.; van Dekken, H.; Meijer, J.; van Grieken, N.C.; Kuipers, E.J. The staging of gastritis with the OLGA system by using intestinal metaplasia as an accurate alternative for atrophic gastritis. Gastrointest. Endosc. 2010, 71, 1150–1158. [Google Scholar] [CrossRef] [PubMed]
- Rugge, M.; Meggio, A.; Pennelli, G.; Piscioli, F.; Giacomelli, L.; De Pretis, G.; Graham, D.Y. Gastritis staging in clinical practice: The OLGA staging system. Gut 2007, 56, 631–636. [Google Scholar] [CrossRef] [PubMed]
- Arai, J.; Aoki, T.; Sato, M.; Niikura, R.; Suzuki, N.; Ishibashi, R.; Tsuji, Y.; Yamada, A.; Hirata, Y.; Ushiku, T.; et al. Machine learning-based personalized prediction of gastric cancer incidence using the endoscopic and histologic findings at the initial endoscopy. Gastrointest. Endosc. 2022, 95, 864–872. [Google Scholar] [CrossRef]
- Arai, J.; Niikura, R.; Hayakawa, Y.; Aoki, T.; Yamada, A.; Kawai, T.; Fujishiro, M. OLGIM staging and proton pump inhibitor use predict the risk of gastric cancer. Gut 2022, 71, 1043–1044. [Google Scholar] [CrossRef]
- Xiao, G.; Zhu, S.; Xiao, X.; Yan, L.; Yang, J.; Wu, G. Comparison of laboratory tests, ultrasound, or magnetic resonance elastography to detect fibrosis in patients with nonalcoholic fatty liver disease: A meta-analysis. Hepatology 2017, 66, 1486–1501. [Google Scholar] [CrossRef]
- Kimura, K.; Takemoto, T. An endoscopic recognition of the atrophic border and its significance in chronic gastritis. Endoscopy 1969, 1, 87–97. [Google Scholar] [CrossRef]
- Haruma, K.; Kato, M.; Inoue, K.; Murakami, K.; Kamada, T. Kyoto Classification of Gastritis, 1st ed.; Nihon Medical Center: Tokyo, Japan, 2017. [Google Scholar]
- Toyoshima, O.; Nishizawa, T.; Koike, K. Endoscopic Kyoto classification of Helicobacter pylori infection and gastric cancer risk diagnosis. World J. Gastroenterol. 2020, 26, 466–477. [Google Scholar] [CrossRef]
- Tseng, C.H. The relationship between diabetes mellitus and gastric cancer and the potential benefits of metformin: An extensive review of the literature. Biomolecules 2021, 11, 1022. [Google Scholar] [CrossRef]
- Zhao, W.; Chen, R.; Zhao, M.; Li, L.; Fan, L.; Che, X.M. High glucose promotes gastric cancer chemoresistance in vivo and in vitro. Mol. Med. Rep. 2015, 12, 843–850. [Google Scholar] [CrossRef]
- Sanna, C.; Rosso, C.; Marietti, M.; Bugianesi, E. Non-alcoholic fatty liver disease and extra-hepatic cancers. Int. J. Mol. Sci. 2016, 17, 717. [Google Scholar] [CrossRef]
- Tan, M.C.; Ho, Q.; Nguyen, T.H.; Liu, Y.; El-Serag, H.B.; Thrift, A.P. Risk score using demographic and clinical risk factors predicts gastric intestinal metaplasia risk in a U. S. Population. Dig. Dis. Sci. 2022, 67, 4500–4508. [Google Scholar] [CrossRef]
- Tan, M.C.; Sen, A.; Kligman, E.; Othman, M.O.; Liu, Y.; El-Serag, H.B.; Thrift, A.P. Validation of a pre-endoscopy risk score for predicting the presence of gastric intestinal metaplasia in a U.S. Population. Gastrointest. Endosc. 2023, 98, 569–576. [Google Scholar] [CrossRef]
- Carr, P.R.; Weigl, K.; Edelmann, D.; Jansen, L.; Chang-Claude, J.; Brenner, H.; Hoffmeister, M. Estimation of absolute risk of colorectal cancer based on healthy lifestyle, genetic risk, and colonoscopy status in a population-based study. Gastroenterology 2020, 159, 129–138.e9. [Google Scholar] [CrossRef]
- Arai, J.; Aoki, T.; Hayakawa, Y.; Niikura, R.; Ishibashi, R.; Suzuki, N.; Tsuji, Y.; Yamada, A.; Ushiku, T.; Fujishiro, M. Risk and preventive factors of early-onset colorectal neoplasms: Endoscopic and histological database analysis. J. Gastroenterol. Hepatol. 2023, 38, 259–268. [Google Scholar] [CrossRef] [PubMed]

| Variables | No Atrophy (n = 43) | Atrophy C1-C2 (n = 312) | Atrophy C3-O1 (n = 640) | Atrophy O2-O3 (n = 608) | p |
|---|---|---|---|---|---|
| No IM (n = 321) | 42 (97.67) | 153 (49.04) | 115 (17.97) | 11 (1.81) | <0.0001 |
| IM grade I (n = 453) | 0 (0.00) | 131 (41.99) | 239 (37.34) | 83 (13.65) | |
| IM grade II (n = 407) | 1 (2.33) | 24 (7.69) | 190 (26.69) | 192 (31.58) | |
| IM grade III (n = 422) | 0 (0.00) | 4 (1.28) | 96 (15.00) | 322 (52.96) | |
| No neoplasms (n = 1542) | 42 (97.67) | 310 (99.36) | 628 (98.13) | 562 (92.43) | <0.0001 |
| Adenoma (n = 26) | 0 (0.00) | 1 (0.32) | 5 (0.78) | 20 (3.29) | |
| Adenocarcinoma (n = 32) | 1 (2.33) | 1 (0.32) | 7 (1.09) | 26 (4.28) | |
| Variables | No IM (n = 321) | IM grade I (n = 453) | IM grade II (n = 407) | IM grade III (n = 422) | p |
| No neoplasms (n = 1542) | 319 (99.38) | 444 (98.01) | 391 (96.07) | 388 (91.94) | <0.0001 |
| Adenoma (n = 26) | 0 (0.00) | 4 (0.88) | 5 (1.23) | 17 (4.03) | |
| Adenocarcinoma (n = 32) | 2 (0.62) | 5 (1.10) | 11 (2.70) | 17 (4.03) |
| Variables | No Atrophy (n = 43) | Atrophy C1-C2 (n = 312) | Atrophy C3-O1 (n = 640) | Atrophy O2-O3 (n = 608) | p |
|---|---|---|---|---|---|
| Male | 32 (74.42) | 245 (78.53) | 467 (72.97) | 446 (73.36) | 0.286 |
| Age (years) | 59.23 ± 14.74 | 59.89 ± 11.99 | 64.52 ± 10.35 | 70.54 ± 8.75 | <0.0001 |
| Waist | 87.55 ± 9.80 | 90.05 ± 10.22 | 89.75 ± 9.71 | 89.88 ± 8.28 | 0.423 |
| Successful H. pylori eradication | 33 (76.74) | 278 (89.10) | 553 (86.41) | 507 (83.39) | 0.036 |
| Laboratory data | |||||
| AST | 21.86 ± 5.72 | 24.33 ± 12.86 | 23.93 ± 10.75 | 24.05 ± 13.91 | 0.673 |
| ALT | 22.30 ± 11.25 | 28.98 ± 21.05 | 27.10 ± 18.40 | 25.64 ± 17.88 | 0.025 |
| ALP | 202.93 ± 40.84 | 207.79 ± 70.15 | 218.01 ± 68.89 | 224.50 ± 79.27 | 0.0051 |
| γGTP | 38.74 ± 37.07 | 46.91 ± 49.03 | 49.03 ± 52.10 | 45.78 ± 59.84 | 0.534 |
| Alb | 4.39 ± 0.33 | 4.46 ± 0.27 | 4.44 ± 0.27 | 4.40 ± 0.26 | 0.0058 |
| PLT | 24.72 ± 6.23 | 24.29 ± 5.56 | 23.78 ± 5.03 | 23.51 ± 5.39 | 0.124 |
| Cre | 0.80 ± 0.18 | 0.79 ± 0.17 | 0.78 ± 0.17 | 0.78 ± 0.17 | 0.911 |
| LDL | 116.44 ± 31.47 | 120.35 ± 30.67 | 121.95 ± 29.43 | 117.98 ± 29.01 | 0.099 |
| HDL | 57.56 ± 15.68 | 56.24 ± 15.39 | 56.13 ± 15.64 | 54.26 ± 15.23 | 0.091 |
| TG | 140.79 ± 141.32 | 138.89 ± 113.63 | 146.55 ± 151.47 | 148.87 ± 150.94 | 0.786 |
| HbA1c | 6.53 ± 1.75 | 6.74 ± 1.92 | 6.86 ± 1.78 | 7.09 ± 1.89 | 0.015 |
| UA | 5.77 ± 1.42 | 5.62 ± 1.42 | 5.55 ± 1.37 | 5.33 ± 1.36 | 0.0029 |
| AUS findings | |||||
| Fatty liver | 29 (67.44) | 232 (74.36) | 480 (75.00) | 453 (74.51) | 0.750 |
| Gallbladder polyp | 15 (34.88) | 120 (38.46) | 226 (35.31) | 224 (36.84) | 0.805 |
| Aortic calcification | 2 (4.65) | 24 (7.69) | 48 (7.50) | 63 (10.36) | 0.205 |
| Liver fibrosis score | |||||
| Fib4 index | 1.24 ± 0.58 | 1.23 ± 0.57 | 1.36 ± 0.51 | 1.57 ± 0.77 | <0.0001 |
| AAR | 1.11 ± 0.33 | 0.98 ± 0.36 | 1.02 ± 0.35 | 1.11 ± 1.14 | 0.053 |
| APRI | 0.29 ± 0.11 | 0.33 ± 0.19 | 0.33 ± 0.17 | 0.34 ± 0.26 | 0.345 |
| Comorbidities | |||||
| Diabetes mellitus | <0.0001 | ||||
| Type 1 | 1 (2.33) | 8 (2.56) | 17 (2.66) | 23 (3.78) | |
| Type2 | 13 (30.23) | 124 (39.74) | 315 (49.22) | 369 (60.69) | |
| Hypertension | 6 (13.95) | 45 (14.42) | 116 (18.13) | 137 (22.53) | 0.017 |
| Dyslipidemia | 3 (6.98) | 34 (10.90) | 81 (12.66) | 104 (17.11) | 0.017 |
| Hyperuricemia | 2 (4.65) | 13 (4.17) | 35 (5.47) | 39 (6.41) | 0.556 |
| Medications | |||||
| Proton pump inhibitor | 2 (4.65) | 28 (8.97) | 68 (10.63) | 68 (11.18) | 0.449 |
| Variables | No IM (n = 321) | IM grade I (n = 453) | IM grade II (n = 407) | IM grade III (n = 422) | p |
|---|---|---|---|---|---|
| Male | 240 (74.77) | 319 (70.42) | 292 (71.74) | 339 (80.33) | 0.0046 |
| Age (years) | 59.64 ± 12.02 | 63.77 ± 11.05 | 67.34 ± 9.90 | 71.04 ± 8.22 | <0.0001 |
| Waist | 89.03 ± 10.67 | 90.10 ± 9.42 | 89.96 ± 8.99 | 89.88 ± 8.31 | 0.424 |
| Successful H. pylori eradication | 273 (85.05) | 385 (84.99) | 347 (85.26) | 366 (86.73) | 0.877 |
| Laboratory data | |||||
| AST | 24.18 ± 15.43 | 24.32 ± 11.48 | 23.39 ± 11.41 | 24.09 ± 11.49 | 0.706 |
| ALT | 27.93 ± 18.35 | 27.02 ± 18.77 | 25.48 ± 18.70 | 26.94 ± 18.37 | 0.346 |
| ALP | 215.34 ± 69.24 | 216.01 ± 68.33 | 218.81 ± 75.95 | 221.68 ± 77.35 | 0.596 |
| γGTP | 48.29 ± 57.16 | 46.28 ± 43.90 | 45.29 ± 51.84 | 48.86 ± 63.72 | 0.764 |
| Alb | 4.44 ± 0.29 | 4.43 ± 0.26 | 4.41 ± 0.27 | 4.43 ± 0.27 | 0.402 |
| PLT | 24.30 ± 5.59 | 24.24 ± 5.45 | 23.44 ± 5.19 | 23.33 ± 5.00 | 0.011 |
| Cre | 0.79 ± 0.19 | 0.77 ± 0.18 | 0.79 ± 0.17 | 0.79 ± 0.15 | 0.219 |
| LDL | 120.81 ± 31.36 | 120.56 ± 29.71 | 122.04 ± 30.07 | 116.76 ± 27.43 | 0.061 |
| HDL | 58.49 ± 17.17 | 55.40 ± 15.46 | 55.14 ± 14.45 | 53.60 ± 14.71 | 0.0003 |
| TG | 135.58 ± 117.40 | 149.85 ± 159.93 | 143.32 ± 162.03 | 151.52 ± 125.95 | 0.432 |
| HbA1c | 6.85 ± 1.95 | 6.67 ± 1.75 | 6.89 ± 1.78 | 7.24 ± 1.93 | <0.0001 |
| UA | 5.67 ± 1.35 | 5.58 ± 1.46 | 5.38 ± 1.38 | 5.34 ± 1.32 | 0.0022 |
| AUS findings | |||||
| Fatty liver | 219 (68.22) | 338 (74.61) | 314 (77.15) | 323 (76.54) | 0.028 |
| Gallbladder polyp | 108 (33.64) | 169 (37.31) | 144 (35.38) | 164 (38.86) | 0.477 |
| Aortic calcification | 22 (6.85) | 27 (5.96) | 37 (9.09) | 51 (12.09) | 0.0075 |
| Liver fibrosis score | |||||
| Fib4 index | 1.23 ± 0.60 | 1.35 ± 0.56 | 1.46 ± 0.57 | 1.57 ± 0.78 | <0.0001 |
| AAR | 0.99 ± 0.35 | 1.04 ± 0.36 | 1.06 ± 0.33 | 1.10 ± 1.36 | 0.240 |
| APRI | 0.33 ± 0.23 | 0.33 ± 0.18 | 0.33 ± 0.19 | 0.35 ± 0.25 | 0.524 |
| Comorbidities | |||||
| Diabetes mellitus | <0.0001 | ||||
| Type 1 | 9 (2.80) | 7 (1.55) | 15 (3.69) | 18 (4.27) | |
| Type2 | 129 (40.19) | 185 (43.93) | 219 (53.81) | 274 (64.93) | |
| Hypertension | 37 (11.53) | 76 (16.78) | 86 (21.13) | 105 (24.88) | <0.0001 |
| Dyslipidemia | 22 (6.85) | 54 (11.92) | 61 (14.89) | 85 (20.14) | <0.0001 |
| Hyperuricemia | 12 (3.74) | 19 (4.19) | 22 (5.41) | 36 (8.53) | 0.013 |
| Medications | |||||
| Proton pump inhibitor | 29 (9.03) | 50 (11.04) | 40 (9.83) | 47 (11.14) | 0.746 |
| Variables | No Neoplasms (n = 1542) | Adenoma (n = 26) | Adenocarcinoma (n = 35) | p |
|---|---|---|---|---|
| Male | 1138 (73.80) | 22 (84.62) | 30 (85.71) | 0.133 |
| Age (years) | 65.52 ± 11.09 | 74.92 ± 8.81 | 69.86 ± 7.72 | <0.0001 |
| Waist | 89.79 ± 9.31 | 88.85 ± 9.99 | 90.89 ± 8.71 | 0.687 |
| Successful H. pylori eradication | 1325 (85.93) | 19 (73.08) | 27 (77.14) | 0.041 |
| Laboratory data | ||||
| AST | 23.90 ± 12.27 | 25.38 ± 13.15 | 27.09 ± 15.12 | 0.272 |
| ALT | 26.77 ± 18.73 | 25.50 ± 14.37 | 28.46 ± 17.92 | 0.816 |
| ALP | 217.85 ± 72.66 | 236.19 ± 84.30 | 214.89 ± 75.27 | 0.430 |
| γGTP | 46.82 ± 53.82 | 51.19 ± 63.87 | 56.54 ± 66.65 | 0.536 |
| Alb | 4.43 ± 0.27 | 4.38 ± 0.22 | 4.41 ± 0.23 | 0.654 |
| PLT | 23.84 ± 5.33 | 24.00 ± 4.80 | 21.75 ± 4.61 | 0.069 |
| Cre | 0.78 ± 0.17 | 0.80 ± 0.16 | 0.81 ± 0.13 | 0.681 |
| LDL | 119.95 ± 29.57 | 120.46 ± 26.01 | 121.14 ± 34.20 | 0.969 |
| HDL | 55.66 ± 15.53 | 51.58 ± 11.60 | 50.54 ± 13.94 | 0.066 |
| TG | 144.30 ± 144.65 | 179.08 ± 140.94 | 185.94 ± 125.87 | 0.119 |
| HbA1c | 6.91 ± 1.85 | 7.37 ± 2.38 | 7.02 ± 1.51 | 0.418 |
| UA | 5.48 ± 1.40 | 5.57 ± 0.93 | 5.46 ± 1.26 | 0.953 |
| AUS findings | ||||
| Fatty liver | 1141 (73.99) | 23 (88.46) | 30 (85.71) | 0.037 |
| Gallbladder polyp | 562 (36.45) | 10 (38.46) | 13 (37.14) | 0.975 |
| Aortic calcification | 134 (8.69) | 3 (11.54) | 0 (0.00) | 0.165 |
| Liver fibrosis score | ||||
| Fib4 index | 1.40 ± 0.64 | 1.67 ± 0.62 | 1.77 ± 0.84 | 0.0005 |
| AAR | 1.05 ± 0.77 | 1.15 ± 0.51 | 1.07 ± 0.33 | 0.813 |
| APRI | 0.33 ± 0.21 | 0.34 ± 0.17 | 0.43 ± 0.36 | 0.018 |
| Comorbidities | ||||
| Diabetes mellitus | 0.024 | |||
| Type 1 | 48 (3.11) | 1 (3.85) | 0 (0.00) | |
| Type 2 | 778 (50.45) | 20 (76.92) | 23 (65.71) | |
| Hypertension | 291 (18.87) | 5 (19.23) | 8 (22.86) | 0.837 |
| Dyslipidemia | 211 (13.68) | 5 (19.23) | 6 (17.14) | 0.611 |
| Hyperuricemia | 84 (5.45) | 3 (11.54) | 2 (5.71) | 0.404 |
| Medications | ||||
| Proton pump inhibitor | 159 (10.31) | 3 (11.54) | 4 (11.43) | 0.958 |
| Prediction Model for Endoscopic Severe Atrophy (O2-3) Variables | AUC (95% CI) | p |
|---|---|---|
| Male, age, H. pylori eradication | 0.703 (0.678−0.728) | 0.082 |
| Male, age, H. pylori eradication, DM, HT, DL, Fib4 index | 0.709 (0.684−0.735) | |
| Prediction model for endoscopic severe intestinal metaplasia (grade III) Variables | AUC (95% CI) | p |
| Male, age, H. pylori eradication | 0.702 (0.674−0.729) | 0.029 |
| Male, age, H. pylori eradication, DM, HT, DL, HUA, fatty liver, AC, Fib4 index | 0.714 (0.688−0.741) | |
| Prediction model for endoscopic neoplasms (adenoma and adenocarcinoma) Variables | AUC (95% CI) | p |
| Male, age, H. pylori eradication | 0.695 (0.629−0.760) | 0.005 |
| Male, age, H. pylori eradication, atrophy, IM | 0.770 (0.713−0.828) | |
| Male, age, H. pylori eradication, atrophy, IM, DM, fatty liver, Fib4 index | 0.785 (0.727−0.843) |
Disclaimer/Publisher’s Note: The statements, opinions and data contained in all publications are solely those of the individual author(s) and contributor(s) and not of MDPI and/or the editor(s). MDPI and/or the editor(s) disclaim responsibility for any injury to people or property resulting from any ideas, methods, instructions or products referred to in the content. |
© 2024 by the authors. Licensee MDPI, Basel, Switzerland. This article is an open access article distributed under the terms and conditions of the Creative Commons Attribution (CC BY) license (https://creativecommons.org/licenses/by/4.0/).
Share and Cite
Arai, J.; Fujiwara, H.; Aoki, T.; Niikura, R.; Ihara, S.; Suzuki, N.; Hayakawa, Y.; Kasuga, M.; Fujishiro, M. Metabolic Factors Associated with Endoscopic Atrophy, Intestinal Metaplasia, and Gastric Neoplasms in Helicobacter pylori-Positive Patients. Clin. Pract. 2024, 14, 779-788. https://doi.org/10.3390/clinpract14030062
Arai J, Fujiwara H, Aoki T, Niikura R, Ihara S, Suzuki N, Hayakawa Y, Kasuga M, Fujishiro M. Metabolic Factors Associated with Endoscopic Atrophy, Intestinal Metaplasia, and Gastric Neoplasms in Helicobacter pylori-Positive Patients. Clinics and Practice. 2024; 14(3):779-788. https://doi.org/10.3390/clinpract14030062
Chicago/Turabian StyleArai, Junya, Hiroaki Fujiwara, Tomonori Aoki, Ryota Niikura, Sozaburo Ihara, Nobumi Suzuki, Yoku Hayakawa, Masato Kasuga, and Mitsuhiro Fujishiro. 2024. "Metabolic Factors Associated with Endoscopic Atrophy, Intestinal Metaplasia, and Gastric Neoplasms in Helicobacter pylori-Positive Patients" Clinics and Practice 14, no. 3: 779-788. https://doi.org/10.3390/clinpract14030062
APA StyleArai, J., Fujiwara, H., Aoki, T., Niikura, R., Ihara, S., Suzuki, N., Hayakawa, Y., Kasuga, M., & Fujishiro, M. (2024). Metabolic Factors Associated with Endoscopic Atrophy, Intestinal Metaplasia, and Gastric Neoplasms in Helicobacter pylori-Positive Patients. Clinics and Practice, 14(3), 779-788. https://doi.org/10.3390/clinpract14030062