Abstract
Paraquat (PQ) is a bipyridylium herbicide that is applied around trees in orchards and between crop rows to control broad-leaved and grassy weeds. Its oxidation results in the formation of superoxides which causes damage to cellular components. In this study, we determined the antioxidant effect vitamin C has on the cellular integrity of kidney function in rats following repeated exposure to PQ. Ninety-six male rats, grouped twelve rats per subgroup (A, Avit.c, B, Bvit.c, C, Cvit.c, D and Dvit.c) were intraperitoneally injected with different sublethal increasing doses (0, 0, 2, 2, 4, 4, 6 and 6 mg/kg body weight) of PQ respectively on biweekly (14 days) intervals over a period of three months (84 days). Subsequently, the subgrouped animals (Avit.c, Bvit.c, Cvit.c and Dvit.c) were maintained orally with 1 g/L vitamin C, while the other subgrouped animals (A, B, C and D) received drinking water with negligible vitamin content throughout the study period. At the end of each monthly (28 days) treatment, four animals per subgroup were selected. Urine samples were collected from each of the selected rats, after which each of the animals were anaesthetized with gaseous isoflurane and 5 mL of blood samples were collected using cardiac puncture procedure. The animals were later decapitated and their kidneys harvested. The samples collected were analyzed for urine [specific gravity (SG), pH, protein and glucose], blood (urea, creatinine, total protein and glucose), and the histological studies on kidney slides. The dose and exposure-time dependent PQ toxicity resulted in the reduction in urinary pH, elevation in urinary SG, and the detectable presence of protein and glucose in urine. It also caused marked elevation in serum urea and creatinine levels with reduction in serum protein and glucose levels and alterations in the cellular integrity of the renal architecture, especially the glomeruli and tubular tissues. Treatments on the PQ insulted animals with vitamin C resulted in the significant presentation of biochemical and histological values that were a complete reversal or near normalization in the parameters assayed, except the urinary pH which presented with more acidic values (vitamin C is acidic in solution). Vitamin C treatment significantly brought down the urine SG level to normal or near normal. It caused near or total disappearance of protein and glucose in urine, reduction in serum urea and creatinine concentration and elevation or normalization of serum total protein and glucose values with restoration of the renal function of treated rats. These findings clearly show that vitamin C has an important role to play in the body’s antioxidant defense system. Its use caused normalization of the biochemical and histological parameters studied and restored the health status of the affected animals.
Keywords:
vitamin C; paraquat; kidney; reactive oxygen species; toxicity; cellular integrity; antioxidant; rats Introduction
Paraquat (PQ) a bipyridylium herbicide that is effective as a non-selective synthetic herbicide when applied around leaves.[1] Because PQ has a redox potential of 446 mV, any reducing agent with sufficient energy can donate an electron to the bipyridylium divalent cation (PQ2+) to form a free radical (PQ+). The oxidation of the bipyridylium radical to form the original PQ2+ results in the transfer of the electron to oxygen and the formation of superoxides called reactive oxygen species (ROS).[2,3] Subsequent Haber-Weiss and Fenton reactions yield toxic hydroxyl radicals3. Thus the herbicide (PQ) functions as a catalyst to transfer reducing equivalent to oxygen. These ROS so formed may escape the electron transport chain and when in excess causes damage to cellular components.[4]
The kidneys being one of the organs involved in the excretion of waste products of metabolism in the body is composed of nephrons and collecting tubules. The functions of the kidney include maintenance of water and electrolyte balance, maintenance of the blood pH and the excretion of unwanted substances from the body.[5] To perform these functions the kidney utilizes the processes of glomerular filtration, tubular reabsorption and tubular secretion.[6] Renal functions are easily affected by toxins.[7] During PQ poisoning, normal renal processes actively secrete PQ into the urine, efficiently clearing it from the blood. But toxic doses overwhelms the secretory capability of the nephrons thereby causing destruction of the cellular integrity of the glomeruli and tubular cells leading to the release of reabsorbable substances which collects in the bladder for excretion. The voided urine presents with proteinuria, hematuria, ketonuria, glycosuria, etc. this situation if not arrested progresses to renal failure and azotemia.[8,9,10,11] Some of the metabolic indicators of kidney function (urea, creatinine, glucose and protein) are of diagnostic importance in the establishment of renal injuries or diseases, because they respond favorably to the smallest insult or injury on the renal tubules and can be detected early. Also the architectural status of the nephrons helps in confirming the degree of injury and site of localization of the injury.[8]
Previous studies have shown that PQ toxicity causes acute oliguric renal failure and in less severe cases lead to impaired renal function with manifestations like proteinuria with hyaline casts, glycosuria, aminoaciduria and excessive leakage of phosphorus, sodium and uric acid. Sometimes necrosis of the proximal tubules is found together with extreme dilatation of the distal tubules of the kidney. Wershana[12] in his study on the influence of vitamin C or selenium on PQ induced toxicity in Guinea pigs showed that animals injected (ip) with sublethal dose [1 mg/kg body weight (bw)] of PQ for 7 days presented with abnormal hematocrit values, abnormal liver functions, impaired renal function and electrolyte imbalance as compared to those previously administered daily (ip) injection of vitamin C (100 mg/kg bw) and selenium (20 mol/kg bw) before the PQ insult, which showed little or no abnormalities on the parameters evaluated.
Antioxidants are classified into two broad divisions depending on their solubility in water (hydrophilic) or in lipids (hydrophobic/lipophilic). Water soluble antioxidants react with oxidants in the cell cytosol and the blood plasma, while the lipid soluble ones protect cell membranes from lipid peroxidation.[13] Though various antioxidants behave synergistically, vitamin C can degrade or reactivate other antioxidants.[13] Vitamin C can directly scavenge oxygen free radicals with and without enzyme catalyst, and can indirectly scavenge them by recycling others to their reduced form.[14,15] By reacting with activated oxygen more readily than any other aqueous components, vitamin C protects critical macromolecules from oxidative damage.[14] In general, vitamin C antioxidant system either prevents these ROS from being formed or removes them before they can become injurious to vital components of the cell.[16,17]
Because of this potent functionality of vitamin C as an antioxidant, this study was geared towards assessing the acceptability of vitamin C as an adjunct in the treatment and management of PQ toxicity cases.
Materials and Methods
Paraquat
20% W/V Dizmazone® (paraquat dichloride solution) from Dizengoff W.A. Ltd. (Lagos, Nigeria) sealed in an opaque plastic container with a shelf-life of two years was employed.
Vitamin C
Pure vitamin C (1000 mg) caplets from Mason Natural® (Mason Vitamins, Inc., Miami Lakes, FL, USA) were employed.
Urinalysis strips
Urine reagent strips (9-parameters) for urinalysis, product of Atlas Medical Ltd., Cambridge, UK (http://atlas-medical.com/index. php) were employed.
Animals and treatments
A total of 96 white male albino rats (Rattusnor vegicus), weighing between 180-220 g (average bw of 0.2±0.02 kg), obtained from the animal house of the Department of Pharmacology and Toxicology, College of Health Sciences, University of Port-Harcourt, Choba, Rivers Statem Nigeria, were fed ad libitum with pelletized animal finisher feed with negligible vitamin C (vit. C) content and allowed to acclimatize for two weeks in metabolic cages before the commencement of the study.
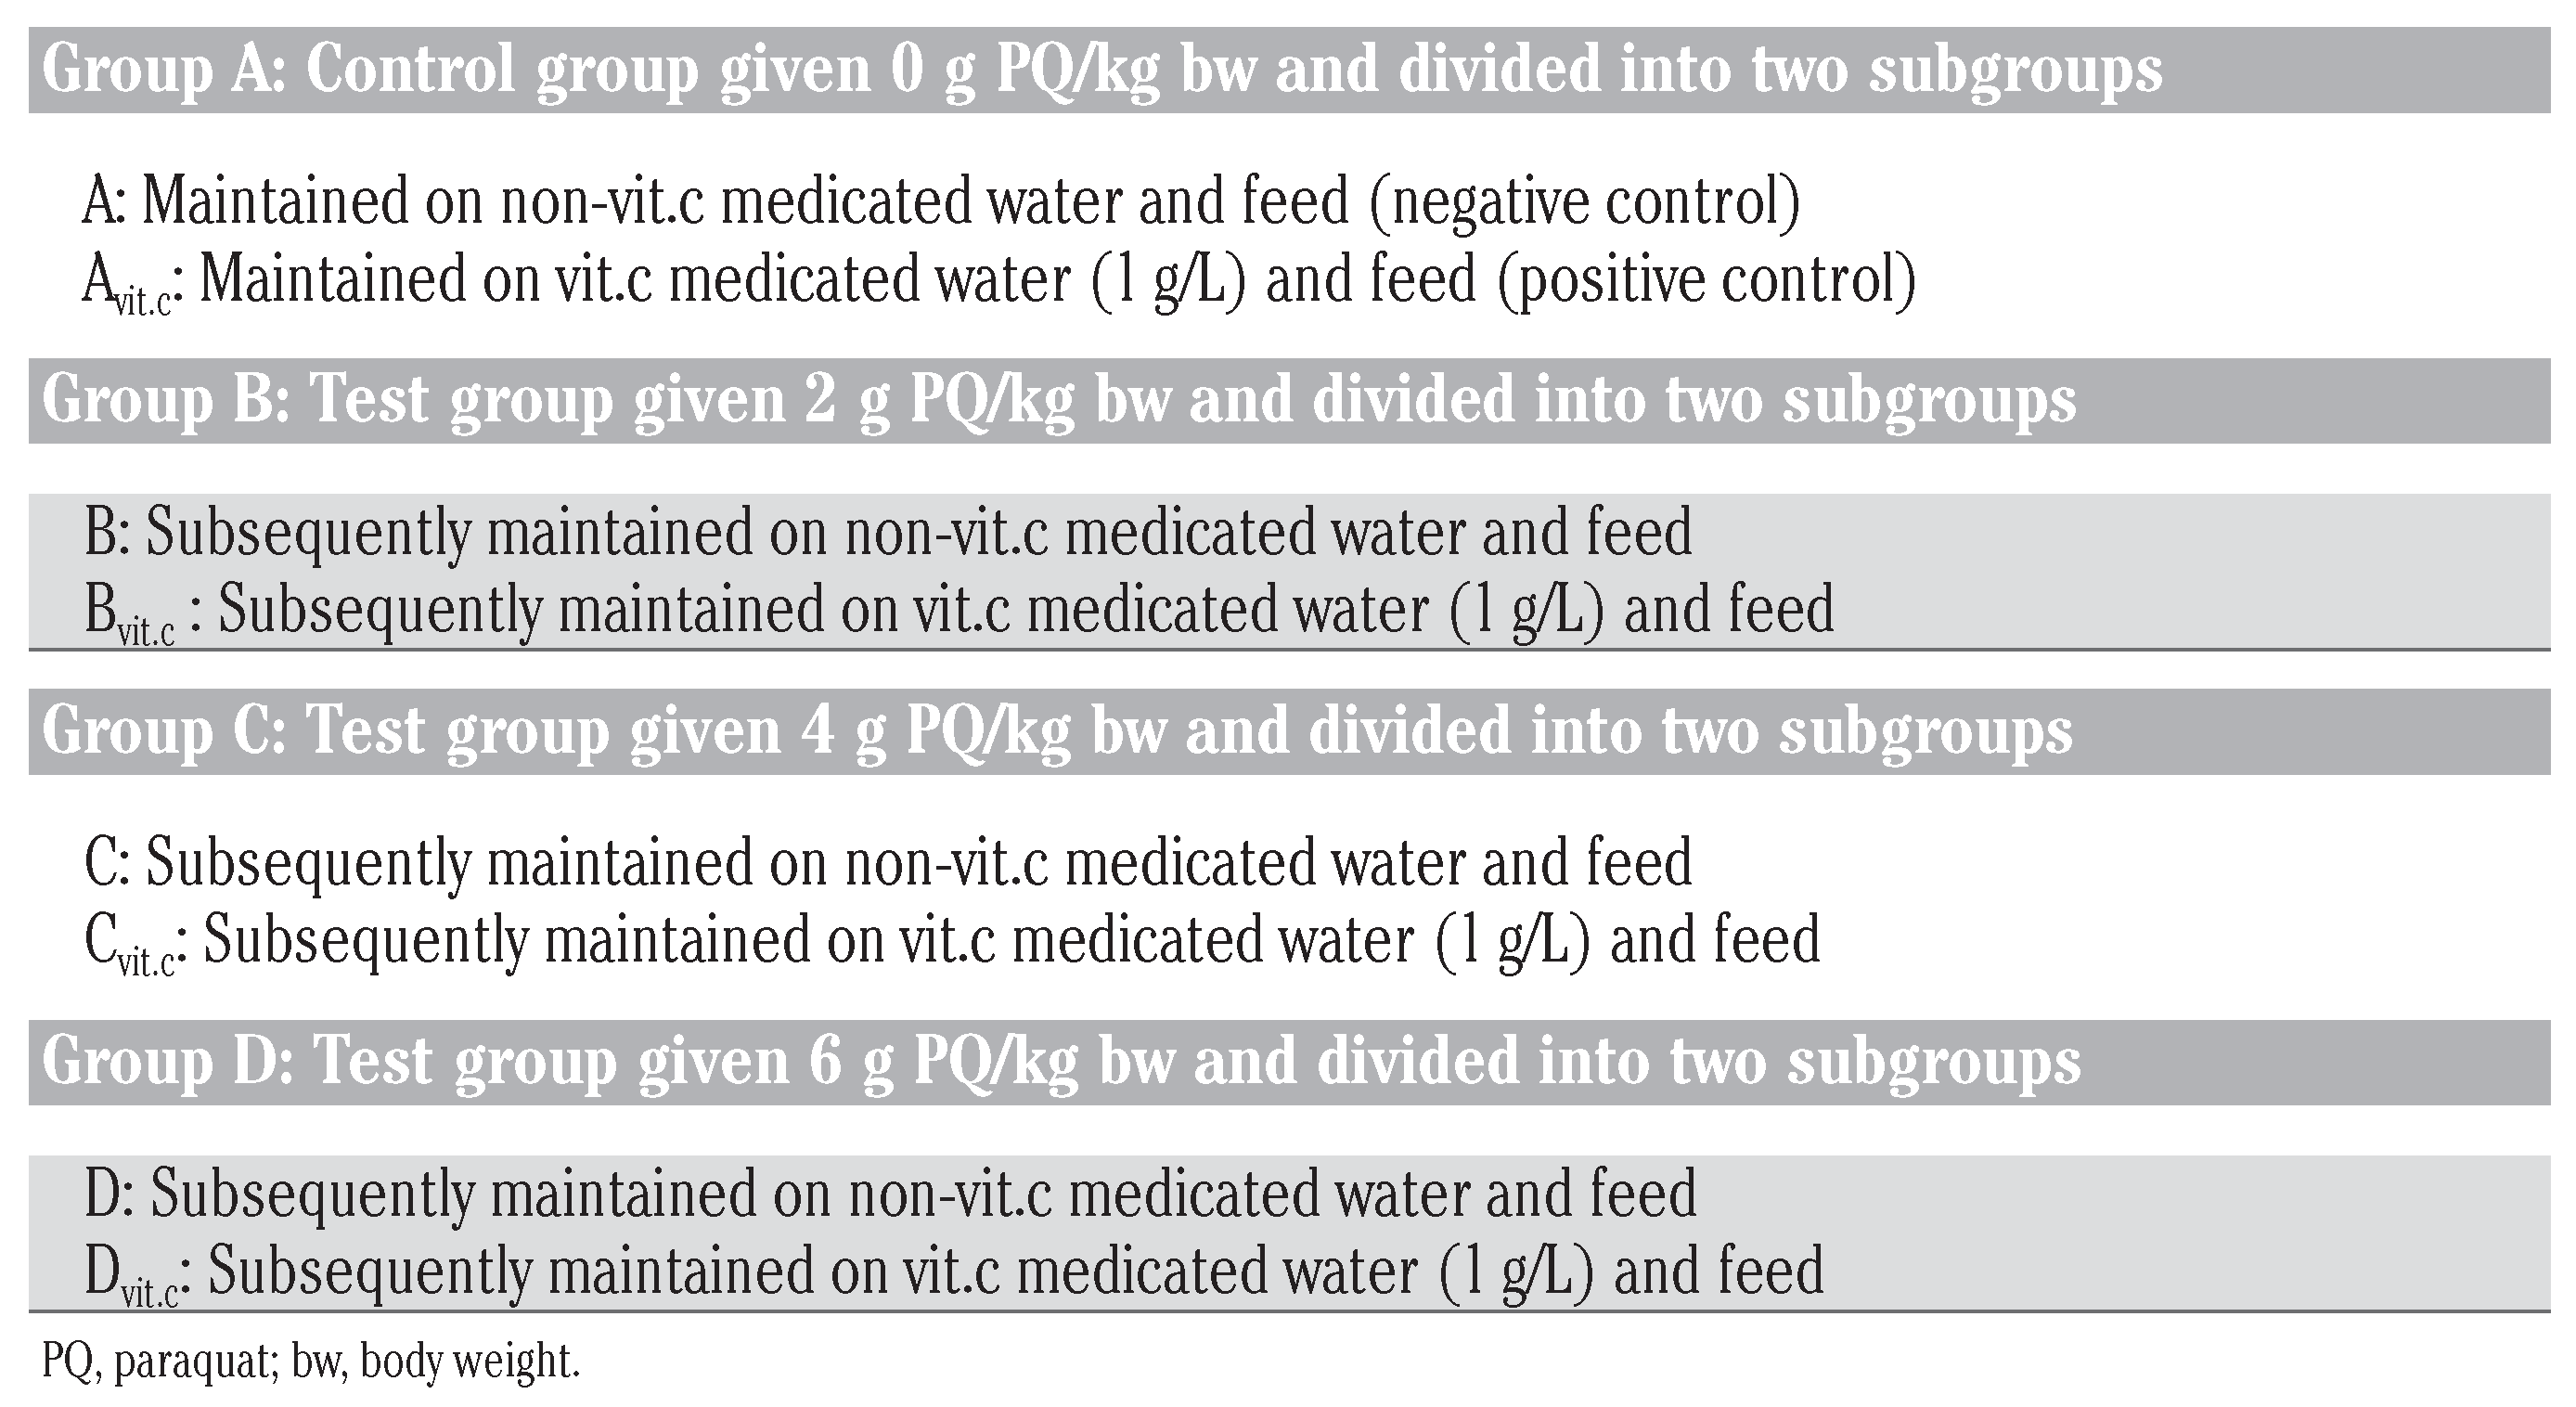
Following acute toxicity study by Dede et al.,[18] where 50% lethal dose of PQ was calculated to be 0.35 g per kg bw of rat (35 mg/kg). A selection of four sublethal doses of PQ was made (0, 2, 4 and 6 mg/kg) to be used in this study [it was generally accepted that at these dose range PQ fatality to the animals will be greatly eliminated since it was a sub-chronic study], and the four selected doses were grouped (A, B, C and D) respectively. Each of the group was subdivided into two no itamin Cand itamin C-subgroups (A: Avit.c, B: Bvit.c, C: Cvit.c and D: Dvit.c), with each subgroup containing 12 animals. Avit.c is a positive control (note: a subgroup of control A to be treated with vitamin C to check if vitamin C at the dose given was injurious to the animals).
Two mL of the respective sublethal doses of the toxicant (PQ) was ip administered to the animals under anesthetics[19] every two weeks (14 days) for up to three months (84 days) in the presence or absence of vitamin C medicated water (1 g/L). [Note: the animals were anaesthetized before PQ treatment to avoid injection site injury on the animal during struggle (i.e. if given without anesthesia), and also the route and frequency of PQ treatment was chosen in simulation of environmental contamination of animals/man from polluted feeds, air or water bodies]. The animals were made to drink water or medicated vitamin C water (1 g/L) from suspended inverted water bottles that have glass-sipper tubes. The liquid content bottles were exchanged for new ones, aseptically, trice daily irrespective of the volume of the remnant liquid content (Table 1).

Table 1.
Chart of the treatment method used.
Urine collection and analysis
This method was designed to obtain urine from a large number of animals (rats) for qualitative and semi-quantitative analysis, e.g. to detect the presence or absence of glucose, protein or ketone in conditions presenting with glycosuria, proteinuria or ketonuria.[20,21] It is simple, reliable and efficient. A 5 mL polystyrene beaker (Dispo Beaker Polystyrene) was attached to the perineal wall using tape that is adherent on both sides. This allowed the collection beaker to be attached and removed with ease. The rat was then held by the tail, after the beaker was attached and the back of the animal was stimulated tactilely using the fingers of the opposite hand. It was observed that 80% of the animals voided between 0.1 and 0.8 mL of the urine within a few seconds, while it took 5-10 min for the remaining 20% of the animal to void urine. The specimens collected were analyzed using urine qualitative/semi-quantitative test strips. The parameters examined were pH, specific gravity (SG), glucose and protein.
Blood sample collection and analysis
The blood sample collection was done using cardiac puncture procedure.[22] At the end of each treatment month (28th, 56th and 84th days), four animals per subgroup were selected, anaesthetized with gaseous isoflurane and 5 mL of blood sample were collected using cardiac puncture procedure.[19] The blood sample collected were dispensed into a centrifuge glass-test tubes, allowed to clot and retract, centrifuged at 2000 r/min for 5 min, after which the serum is separated from the red cells and transferred into a plain sample container, labeled and stored frozen at 0°C until needed for analysis of the parameters urea, creatinine and total protein. The serum samples were estimated using methods for glucose,[23] urea,[24] creatinine[25] and total protein.[25]
Histopathology
After collection of blood samples the animals were euthanized and the kidneys removed, washed thoroughly in ice-cold physiological saline (0.9% W/V sodium chloride) and fixed in 10% formaldehyde solution for 24 h.[26] The tissues were sliced and dehydrated with different increasing concentrations (50, 70, 95 and 100%) of ethanol for about 24 h. After then, they were cleared with xylene to remove the alcohol and improve their refractive index. It was then embedded in the molten paraffin wax, allowed to solidify inside the wax. The resulting blocks were sectioned with a Shandon AS 325 microtome, and later slides were prepared with the best of the sections. The slides were stained with hematoxylin/eosin solution,[26] and the stained slides were carefully studied for any histopathological lesions as a result of the toxicant (PQ) and the antioxidant (vitamin C). Photomicrographs were made using a Leitz Wetzlar (Model Dialux 20) microscope at 100, 200 and 400 magnification depending on the underlying lesions observed or studied. The remaining carcasses were incinerated to avoid environmental pollution.
Statistical analysis
The results or data produced were analyzed using Excel 2007 Microsoft package and results expressed as (X=mean±standard error mean), and the statistical comparison were done with two-way analysis of variance (2-WAY ANOVA) system, with the level of significance calculated at (P≤0.01) depending on the values obtained and how the interaction correlated.
Animal care
We do affirm that in carring out this research The Nigerian Institutional and National Guide for the care of laboratory animals were followed.
Results
Paraquat treatment on rats produced changes in their behavioral pattern which were dose and exposure-time dependent. As the ip dose were increased from 0 to 6 mg/kg bw of rat, symptoms such as respiratory distress, Irritation or redness of the eye, sedation or restiveness became more pronounced, even as the duration of treatment lasted, especially on the PQ only treated subgroups (B, C and D). Also their feeding and fluid intake habit significantly reduced as the dose and duration of treatment increased. This was observed more on the animal subgroups dosed 4 and 6 mg/kg PQ without vitamin C medicated water intake.
Biochemical results
Intraperitoneally administered sublethal increasing doses of PQ (0, 2, 4 and 6 mg/kg bw) to rats subgroups produced significant changes in biochemical parameters assayed, which were both dose and exposure-time dependent. The subsequent treatments of the differently dosed subgroups (Avit.c, Bvit.c, Cvit.c and Dvit.c) with vitamin C medicated water (1 g/L) within the study period was seen to have restored the biochemical markers assayed to near-control or control levels.
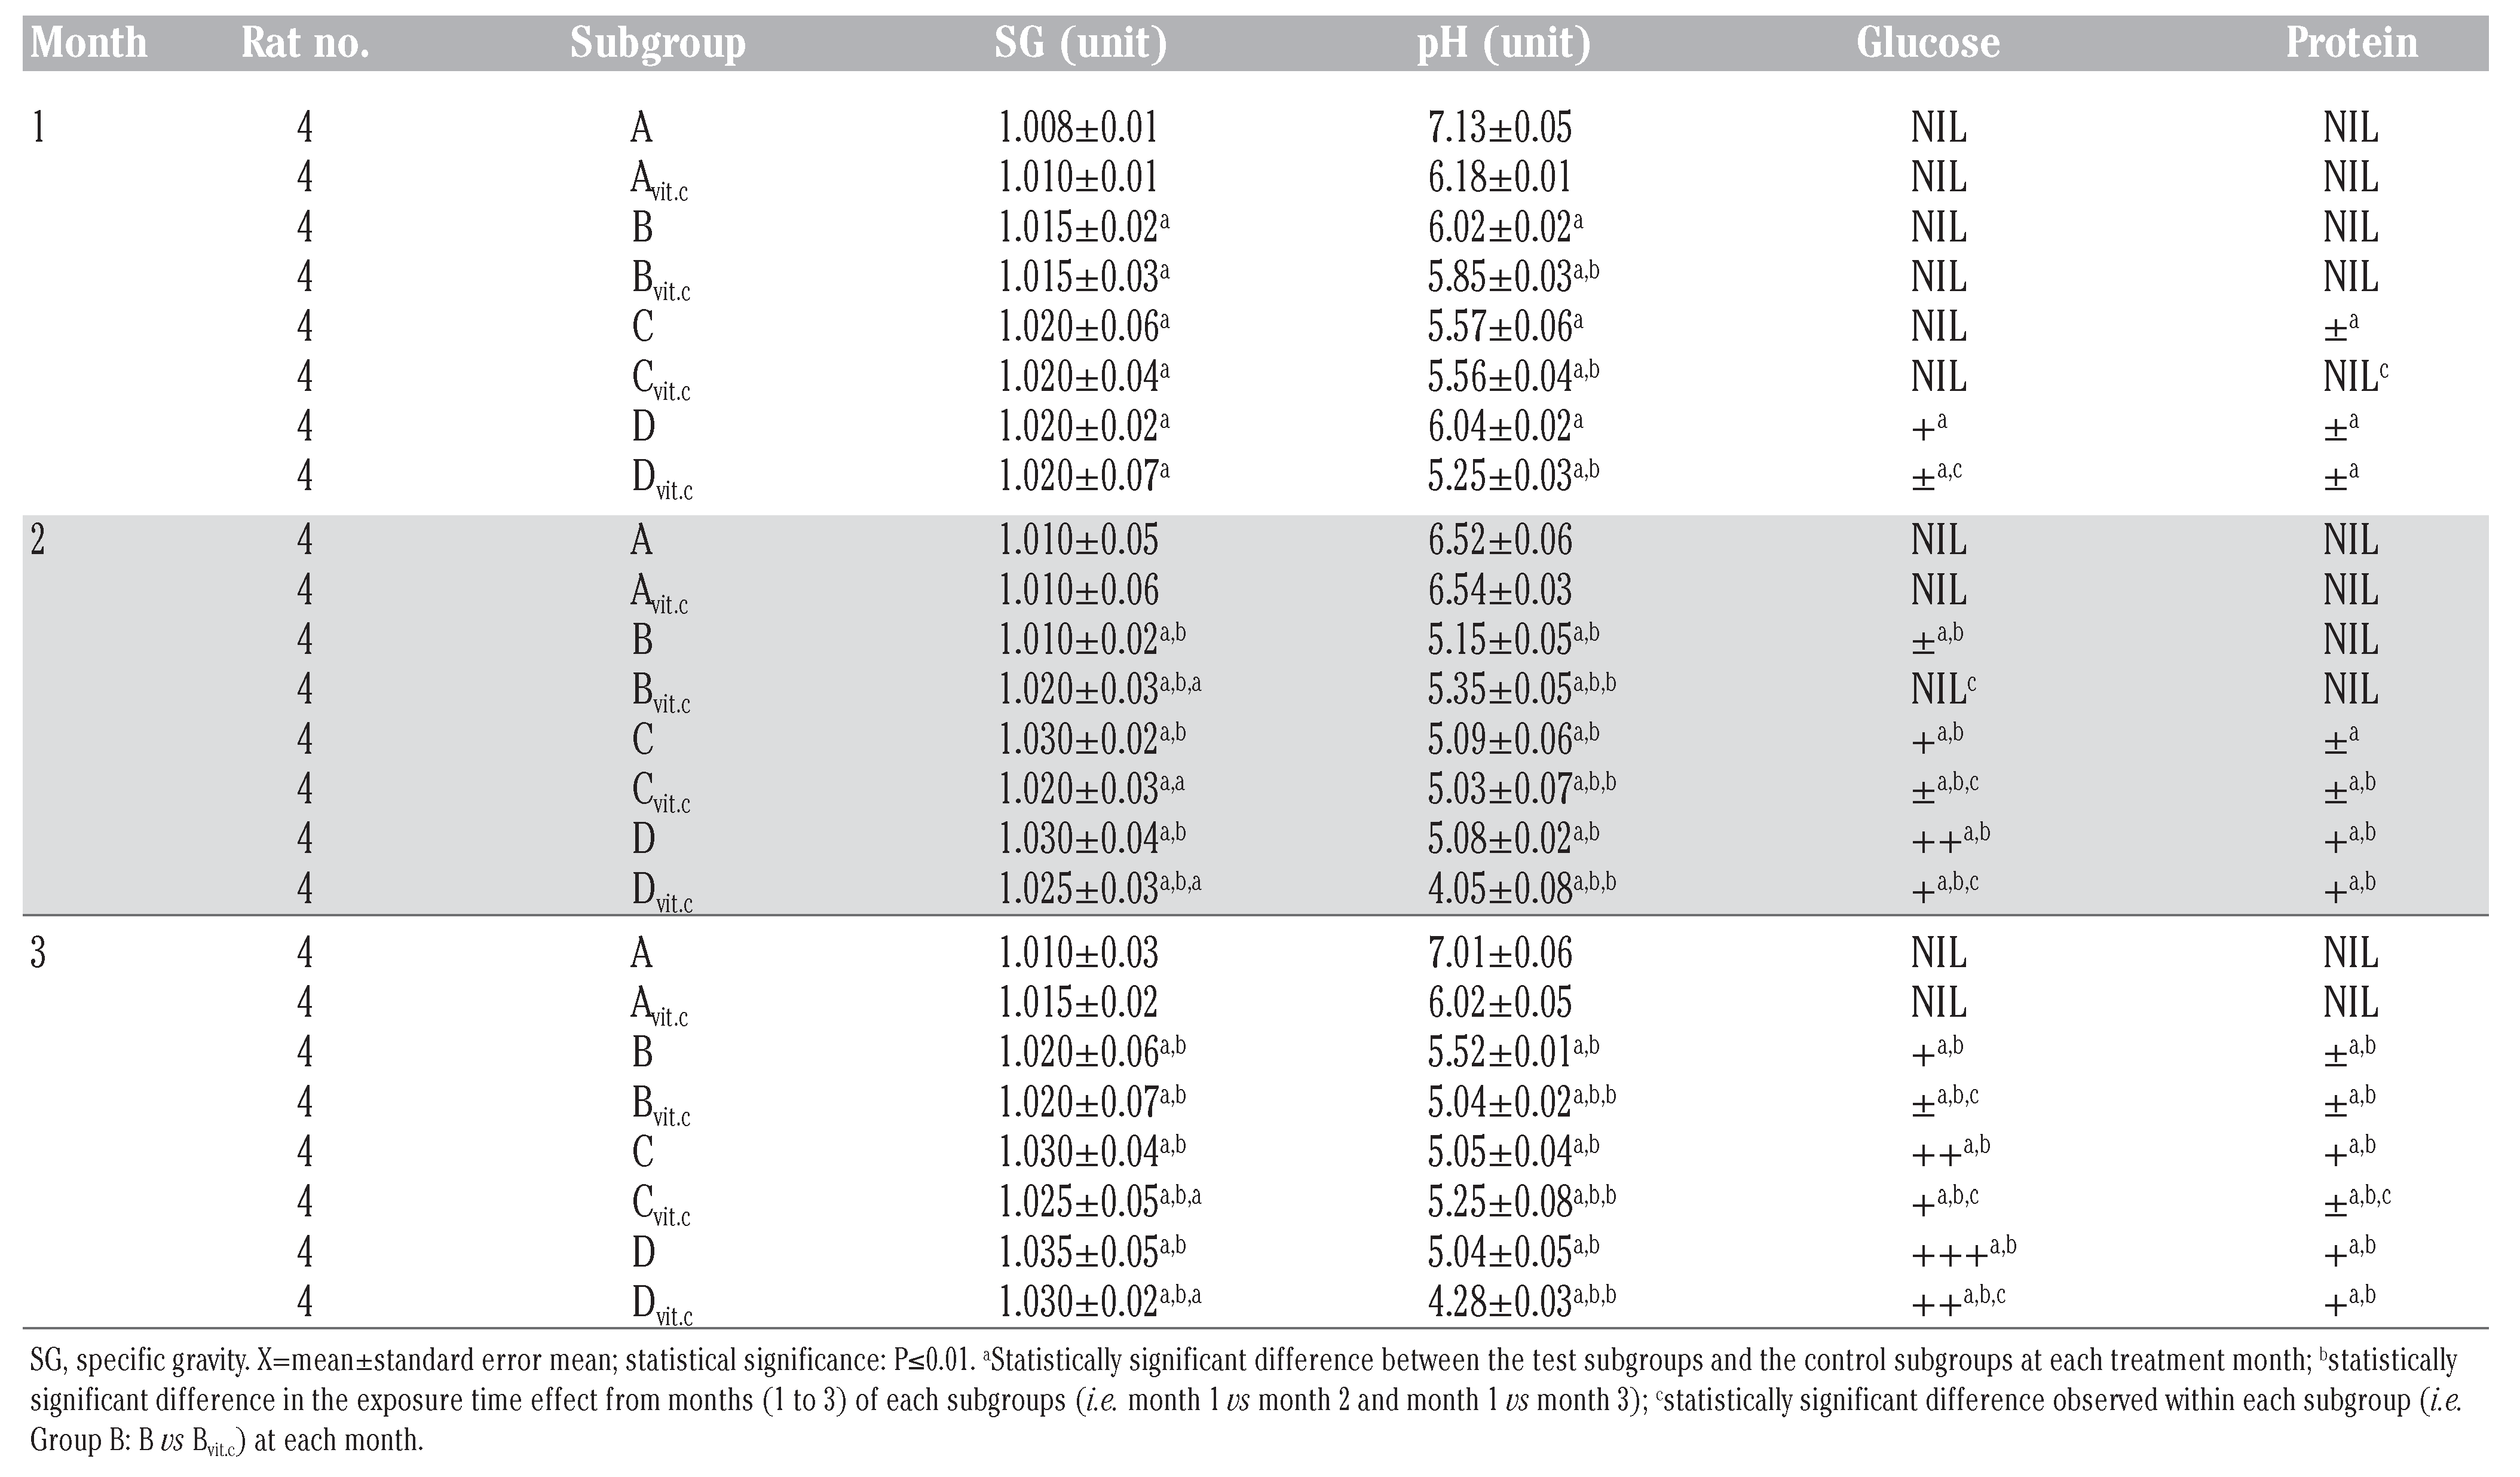
The results obtained in Table 2 and Figure 1 indicated that the urine SG values of the test subgroups were significantly higher when compared to the control subgroups (A and Avitc) at P≤01. The increase in values was found to be dose and exposure-time dependent. The control subgroups had no statistical difference between them, meaning that vitamin C (1 g/L) used in medicating the drinking water for subgroup Avitc was not toxic. This confirms that the changes observed on the test subgroups were subject to only PQ toxicity. Similarly, significant decreases in SG values were observed in PQ treated subgroups maintained with vitamin C medicated water (Bvit.c, Cvit.c and Dvit.c) than the subgroups on PQ treatment only (B, C and D), especially in samples collected at the end of months 2 and 3, and mainly on rats subgroups dosed 4 mg and 6 mg/kg PQ. Also within each test subgroup, significant increases (P≤0.01) were observed in the exposure time comparison between months 2 and 3 against month 1 (e.g. Bvitc: month 1 vs month 2 or 3). This confirmed that dose effects were increasing proportionately with exposure time of the study.

Table 2.
Mean urine specific gravity, pH, glucose and protein results obtained during study period.
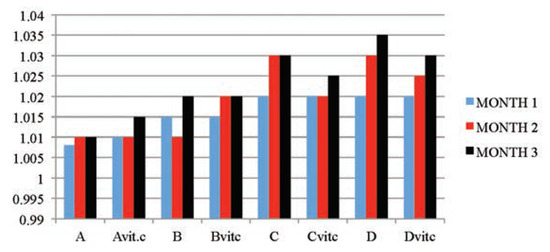
Figure 1.
The mean urine specific gravity values of the different subgroups during the three months study period.
The data in Table 2 and Figure 2, indicated that the urine pH of the test animal’s subgroups were dose and exposure time significantly lower (P≤0.01) than that of the control subgroups. The test subgroups on vitamin C medicated water (Bvit.c, Cvit.c and Dvit.c) had values in pH that were significantly much lower than that of the test subgroups on PQ treatment only (B, C and D) at P≤0.01. Even the vitamin C treated control subgroup (Avit.c) was having a significantly lower pH values when compared to the control subgroup without vitamin C (A) at P≤0.01. This result has shown that vitamin C also contributed to the acidic pH nature of the test animals urine samples analyzed.
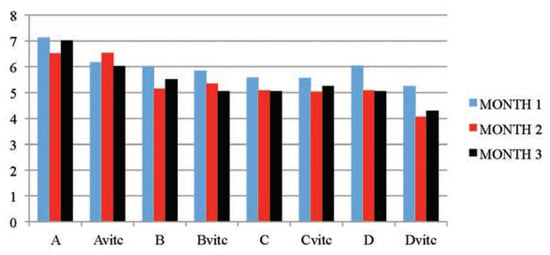
Figure 2.
The mean urine pH values of the different subgroups during the three months study period.
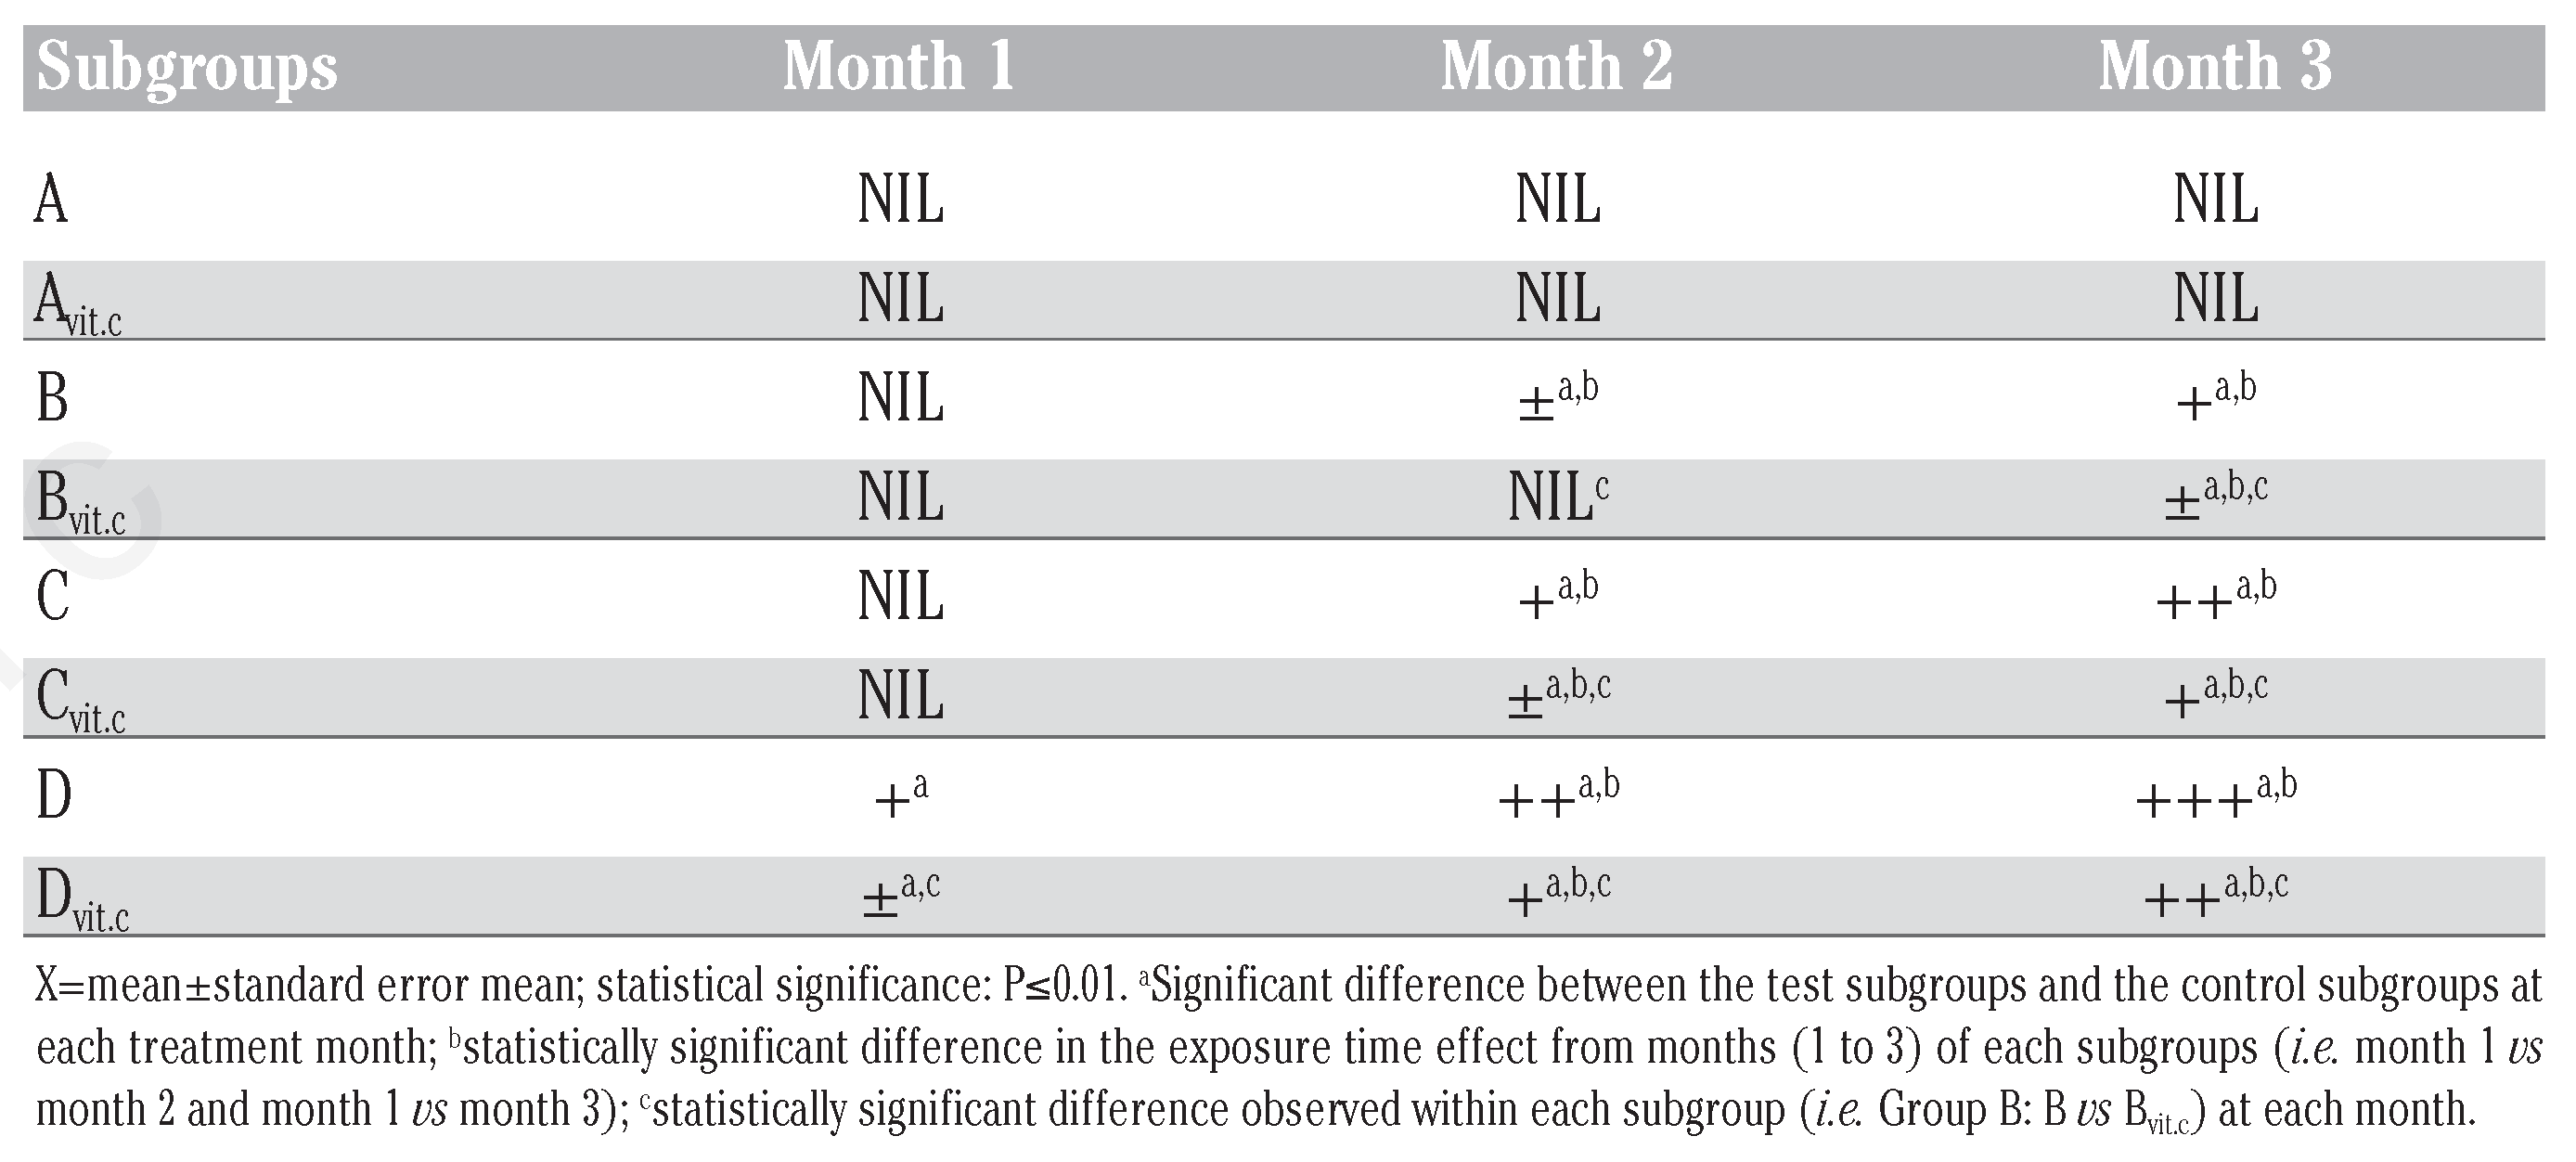
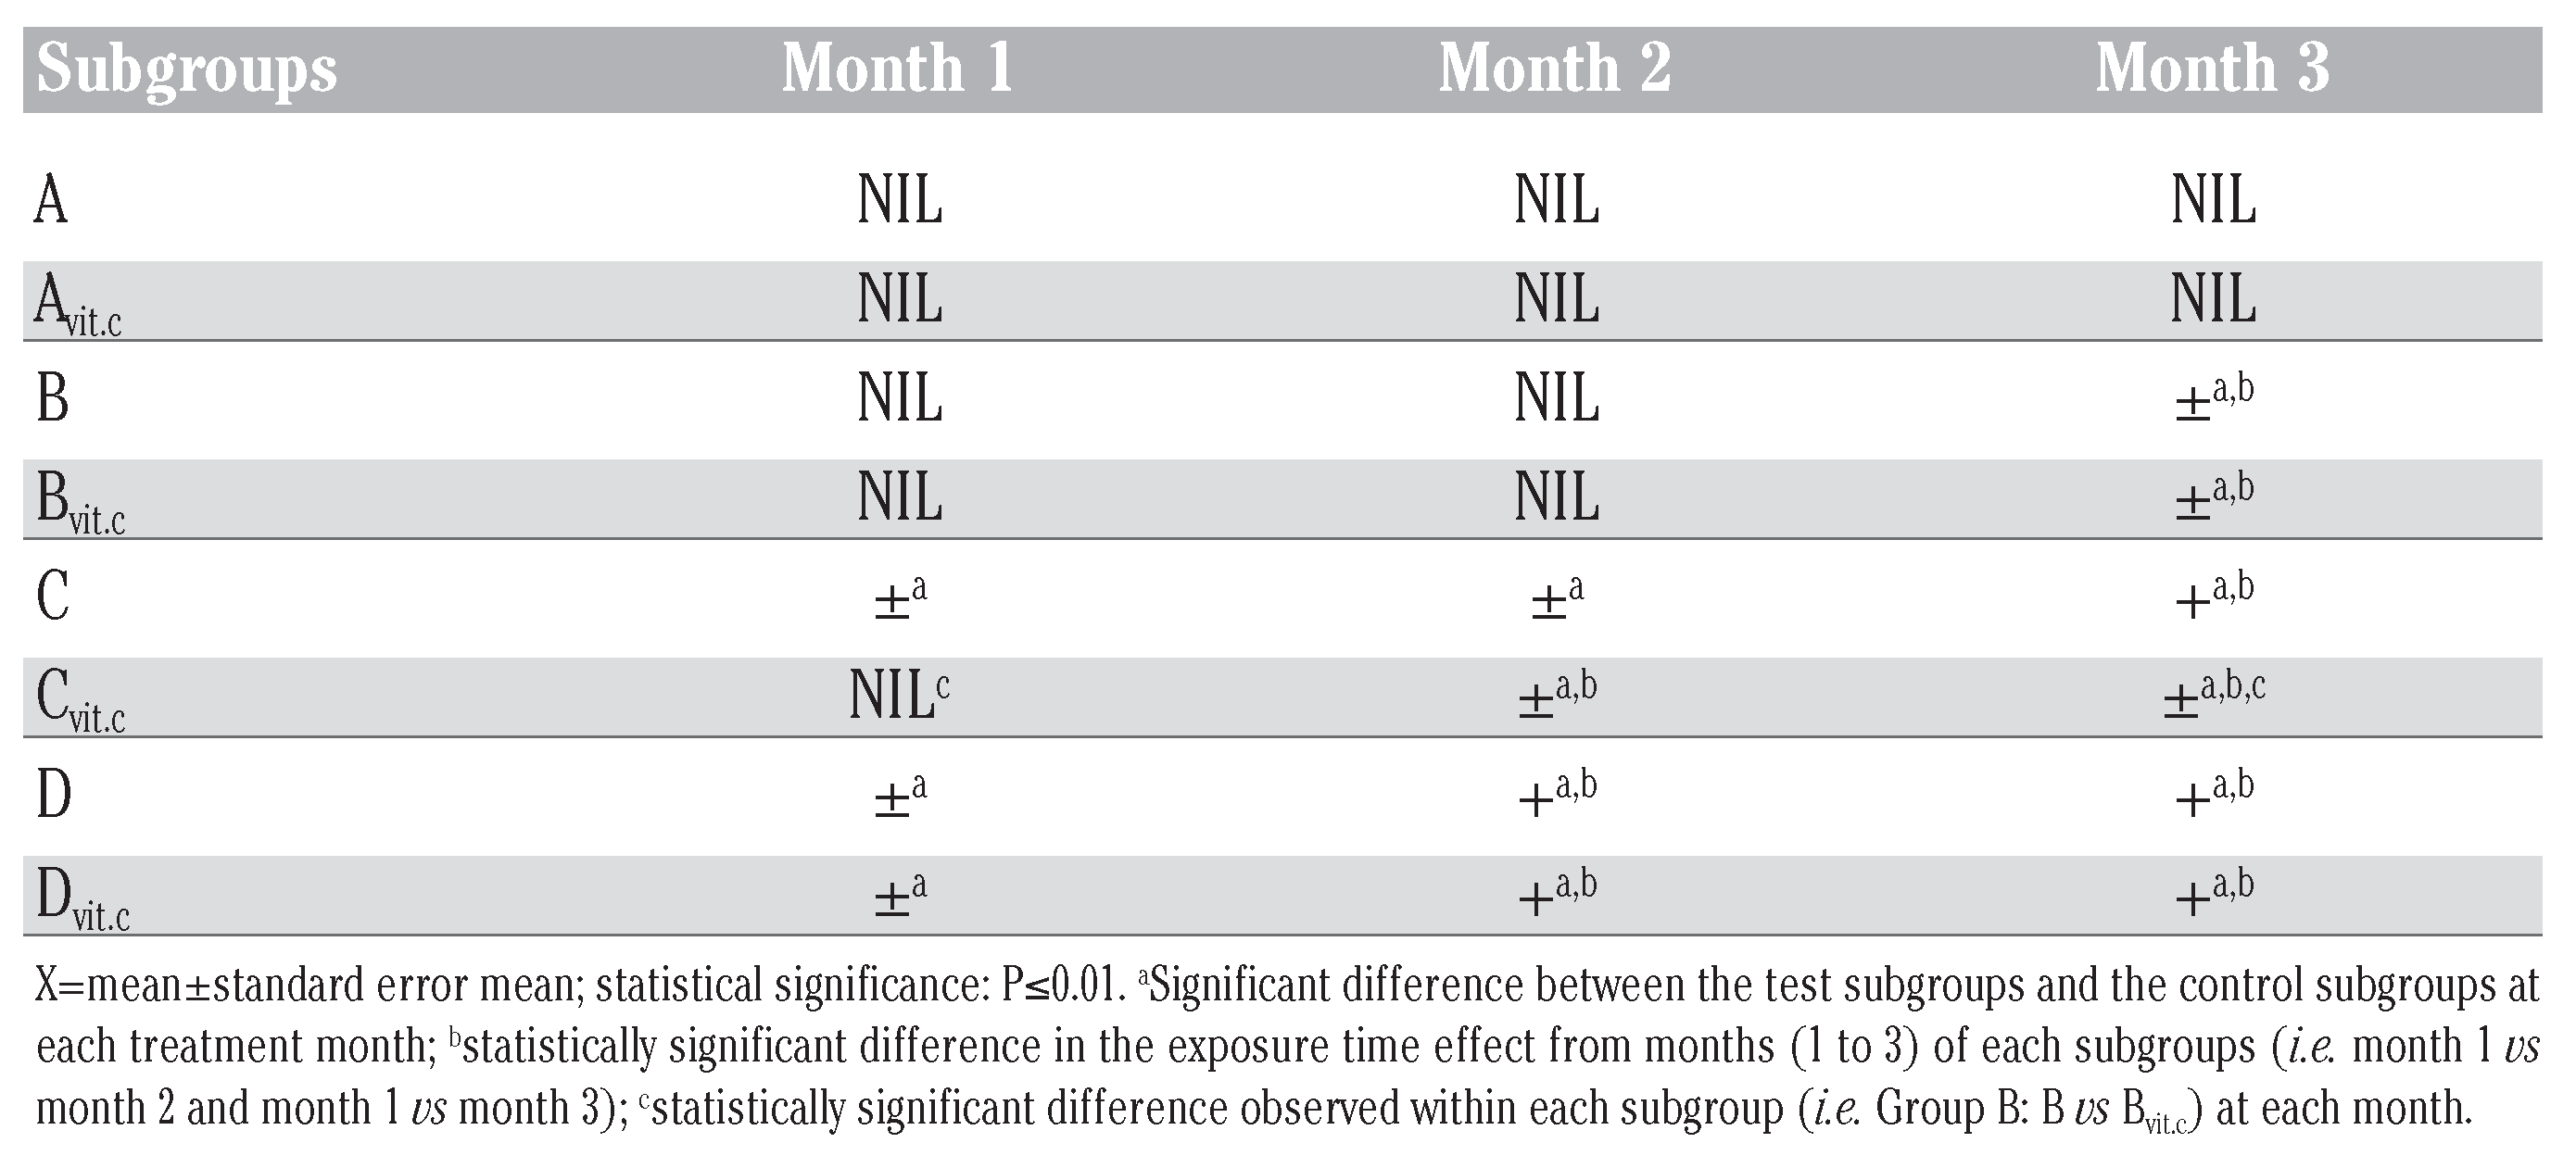
Table 2, Table 3 and Table 4 illustrated the findings in the semi-quantitative analysis of the presence of glucose and protein in the urine samples of test animals. The significant increases in urinary glucose and protein excretion were more on the test subgroups on PQ treatment only (B, C and D) than on the subgroups that were maintained with vitamin C medicated water during PQ treatments (Bvit.c, Cvit.c and Dvit.c) at P≤0.01, which were also dose and exposure time dependent. It was also evident that the established glycosuria was semi-quantitatively more than the proteinuria. This could suggest that the renal injuries created by PQ intoxication allowed the leakage of more micro molecular substances than macromolecules.

Table 3.
Mean urine glucose qualitative detection in treated rats.

Table 4.
Mean urine protein qualitative detection in treated rats.
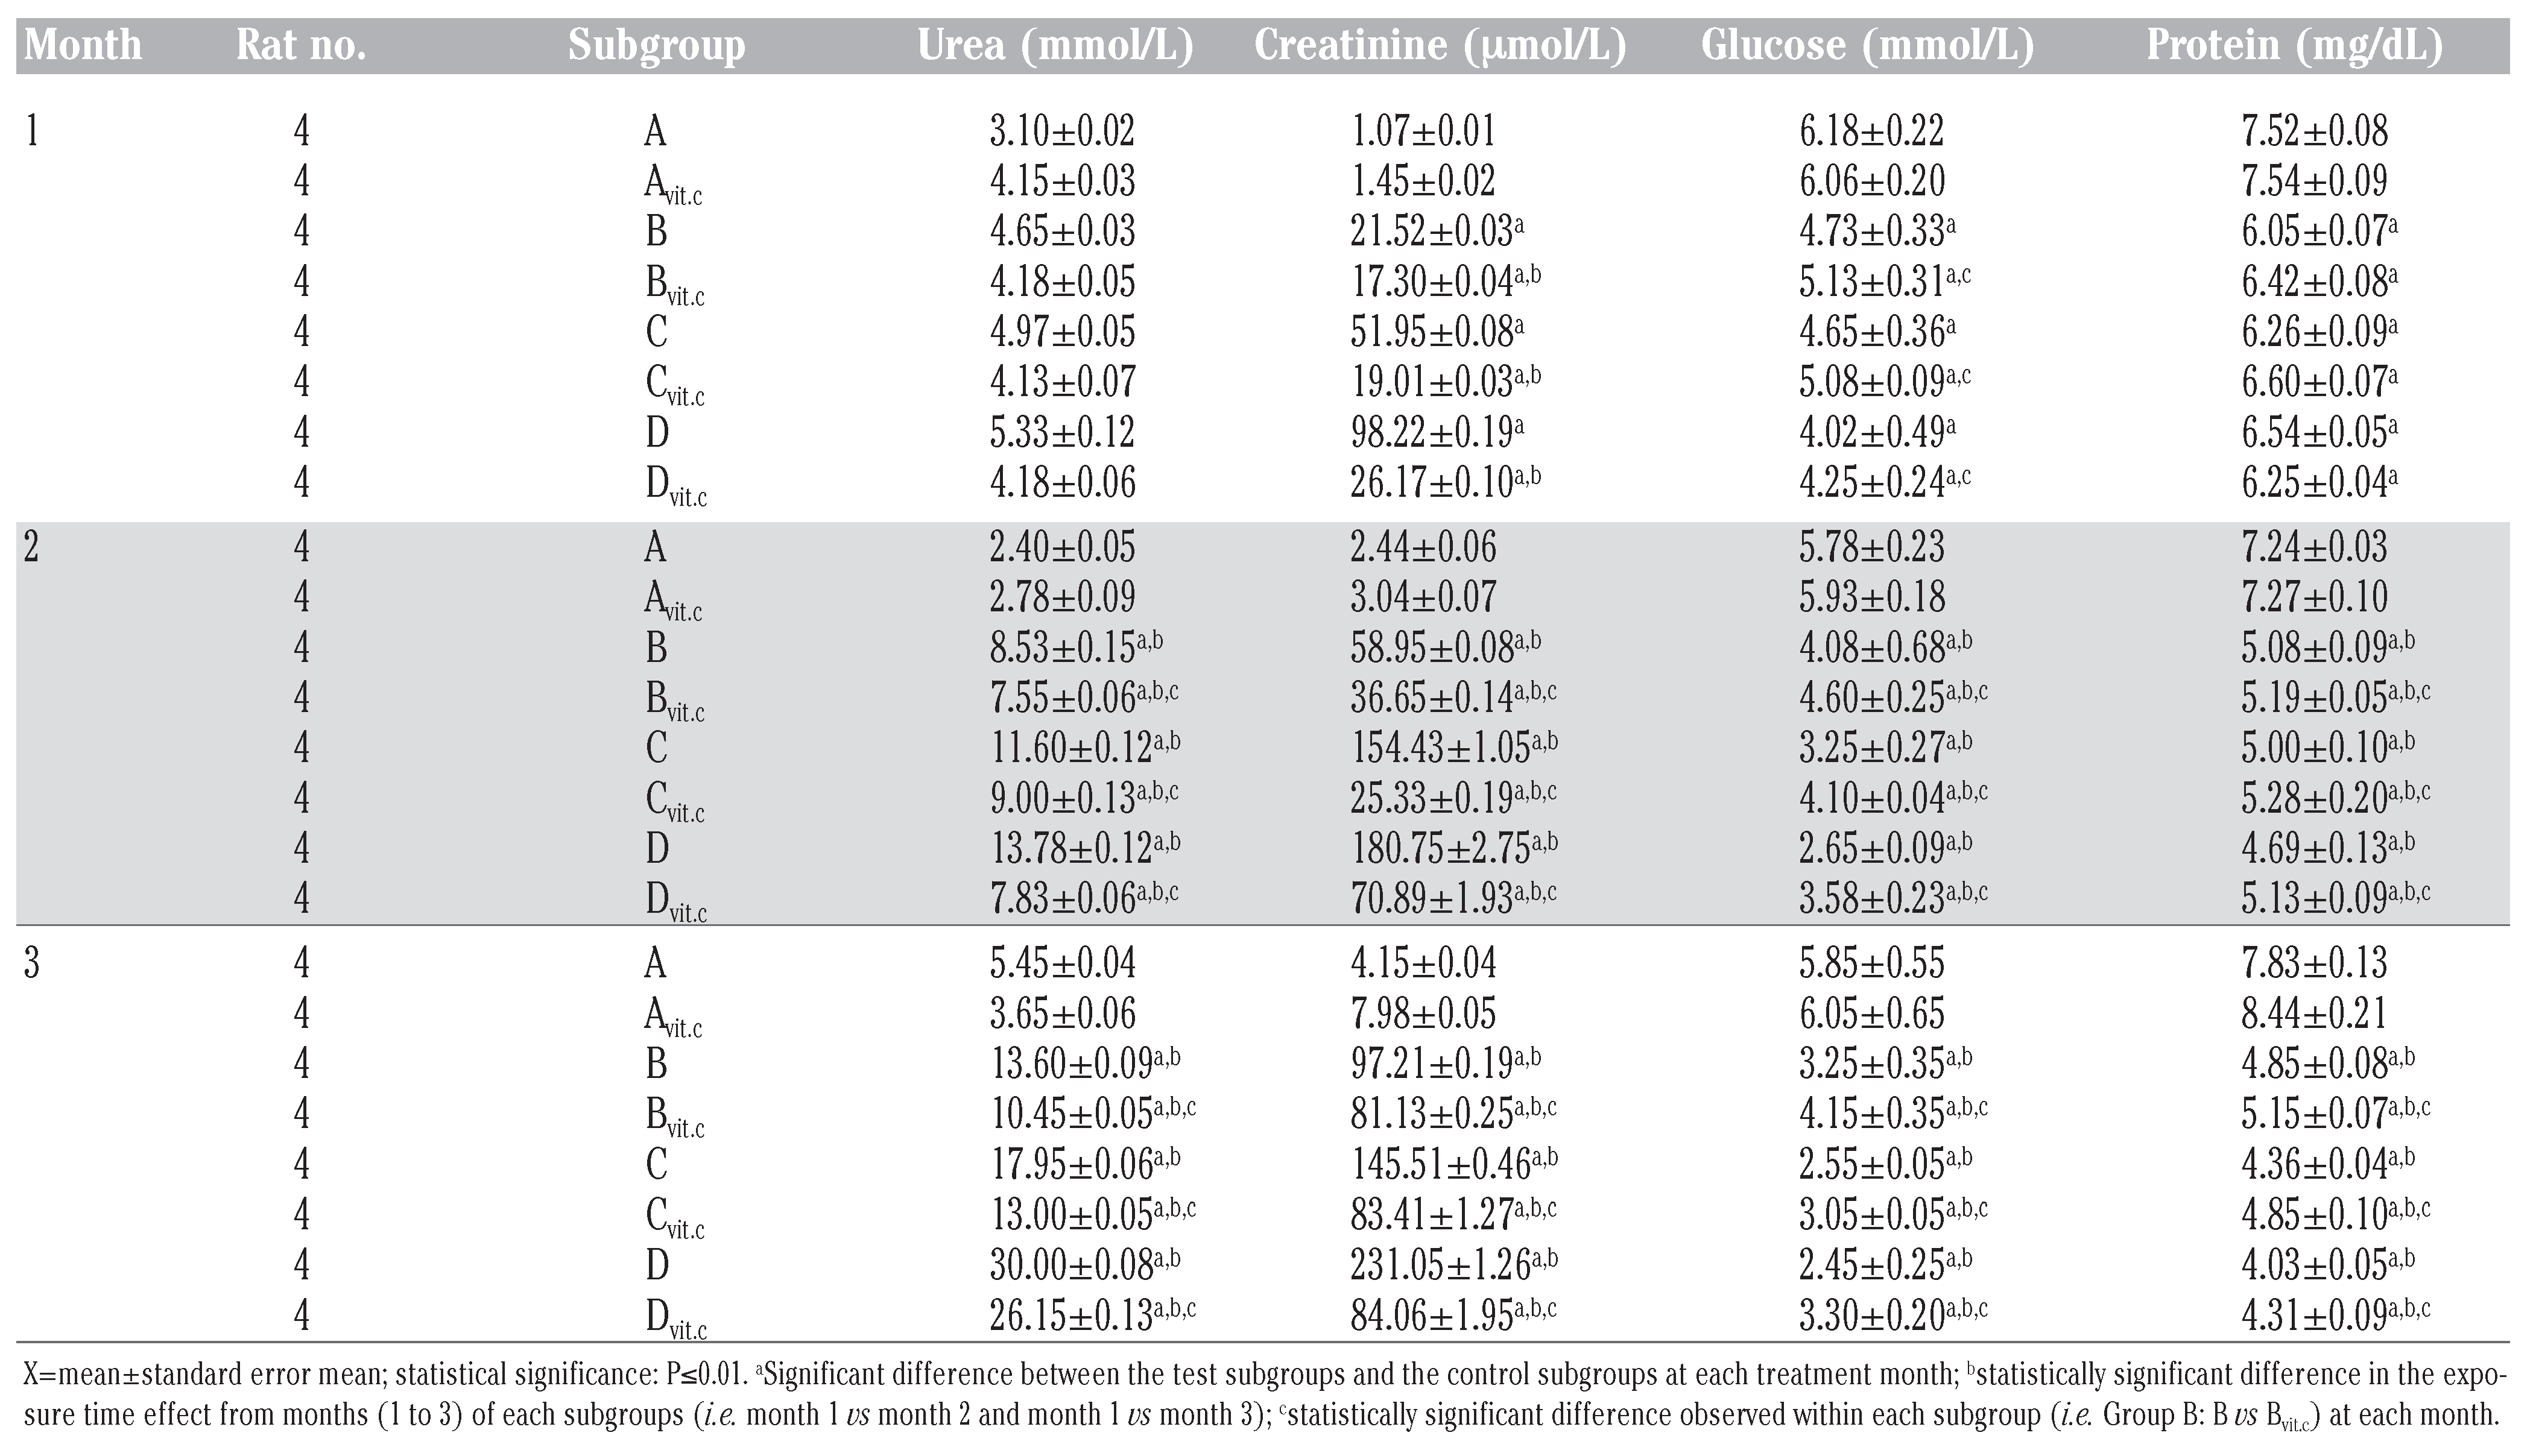
Table 5 and Figure 3, Figure 4, Figure 5 and Figure 6 below illustrated that PQ exposure caused significant increases in serum levels of urea and creatinine and reductions in serum levels of glucose and total protein concentrations (P≤0.01) in rats treated with (2, 4 and 6 mg/kg PQ) at month 1 (28th day), month 2 (56th day) and month 3 (84th day) compared to those of the respective monthly control subgroups, and the comparison was found to be dependent on the dose given and the exposure-time of treatment. The control subgroups of each parametric treatment (Figure 3, Figure 4, Figure 5 and Figure 6) showed no observable significant changes when the subgroups on vitamin C medicated water maintenance (Avitc) were compared to the subgroup maintained on ordinary drinking water with negligible vitamin C content (A). But on comparing the test subgroups (PQ only vs PQ + vit. C), a significant decrease in values were observed on the vitamin C medicated subgroups at each dosed subgroup and at each month in serum urea and creatinine, while a significant increase were similarly observed on the same subgroups in serum total protein and glucose levels. When an exposuretime comparison was done on the test subgroups (e.g. subgroup B: month 1 vs months 2 or 3) in all the parameters assayed. There were significant increases for urea and creatinine serum level while significant decreases for total protein and glucose serum levels were observed in the data obtained.

Table 5.
Mean serum urea, creatinine, glucose and total protein results obtained during study period.
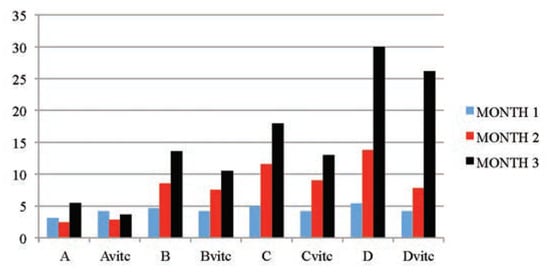
Figure 3.
The mean serum urea (mmol/L) values of the different subgroups during the three months study period.
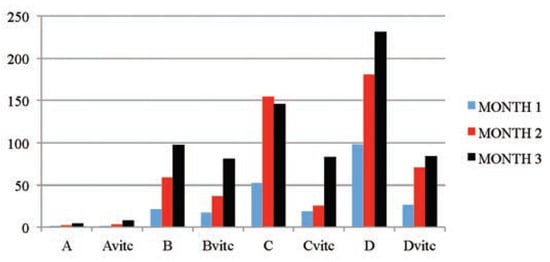
Figure 4.
The mean serum creatinine (µmol/L) values of the different subgroups during the three months study period.
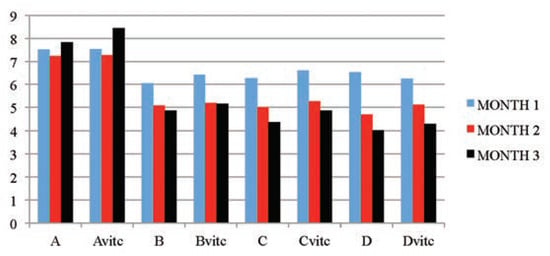
Figure 5.
The mean serum total protein (mg/dL) values of the different subgroups during the three months study period.
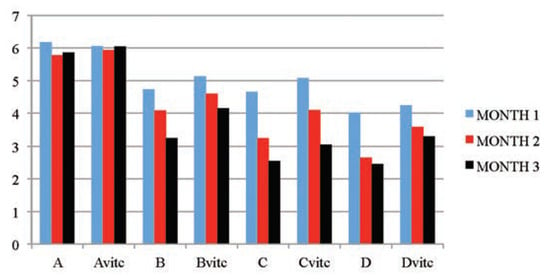
Figure 6.
The mean serum glucose (mmol/L) values of the different subgroups during the three months study period.
In all the serum parameters assayed, the vitamin C maintained subgroups had values that were near-control or at control levels all through the study period. This shows that vitamin C given caused an improvement on the affected parameters in PQ intoxicated rats.
Histological results
Histological examination of the kidney sections (Figure 7) of the control subgroups A and Avitc revealed normal cortex with normal renal corpuscles, proximal and distal tubules as represented at months (1), (2) and (3) in the slide pictures. These pictures are showing clearly the glomeruli tuft (G) with its surrounding Bowman’s capsules and the renal tubules, lined by simple cuboidal or columnar epithelium and the renal vein running all through the tubular cells, emptying at the tuft of the glomerulus as capillaries.
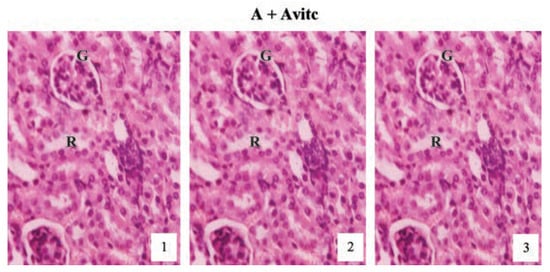
Figure 7.
Hematoxylin and eosin staining after administration of 0 mg/kg of paraquat representing control subgroups maintained with no vitamin C and vitamin C medicated (1 g/L) water (A and Avitc) respectively for a period of 3 months (original magnification 400X). The slides represent results obtained at months 1, 2 and 3. The results are showing normal architecture. The renal corpuscles, Bowman’s capsules, glomeruli (G) and convoluted tubules presented normal features.
Animals treated with 2 mg/kg PQ only (Figure 8) showed pictures of mild congested renal veins and tubules, progressing to shrunken Bowman’s capsule and G as the exposure-time extended to months (2) and (3). The other PQ only dosed subgroups (Figure 9 and Figure 10) showed dose and exposuretime dependent structural abnormalities in the cortex and medulla regions. The changes were more marked at month (3) in Figure 9 and Figure 10. The main findings were: i) narrowed appearance of Bowman’s space; ii) degeneration of tubular epithelial lining; iii) swollen or edematous lumen and congestion of the renal tissues. These changes increased in a dose and exposure-time dependent manner.
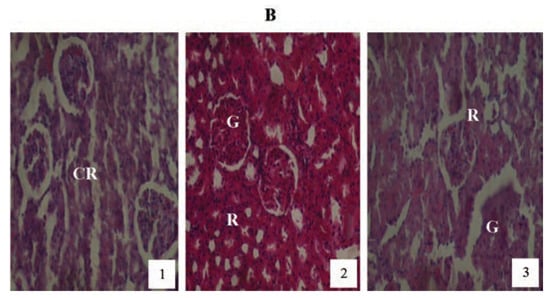
Figure 8.
Hematoxylin and eosin staining after administration of 2 mg/kg of paraquat representing test subgroups maintained with ordinary drinking water with negligible vitamin C content for a period of 3 months (original magnification 400X). The slide at month (1) is showing a picture of congested renal veins and renal tubules (CR), progressing to shrunken Bowman’s capsules and glomerular (G) and renal vascular congestion (R) at month (2). At month (3) the picture indicated advanced renal tubular atrophy (R) with glomerular (G) and tubular degeneration. Changes increased in an exposure time dependent manner.
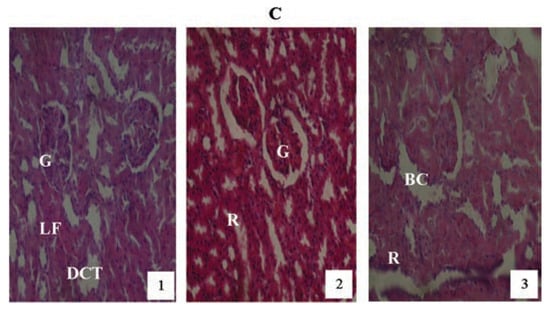
Figure 9.
Hematoxylin and eosin staining after administration of 4 mg/kg of paraquat representing test subgroups maintained with no vitamin C medicated drinking water for a period of 3 months (original magnification 400X). The slide at month (1) is showing a picture of shrunken Bowman’s capsules and swollen glomeruli (G), leucocytes infiltration and vascular congestion (DCT) progressing glomerular congestion, intralobular vacuolation and renal vascular congestion (R) at month (2). At month (3) the picture indicated advanced renal tubular hypertrophy (R), swollen Bowman’s capsules (BC). Changes increased in an exposure time dependent manner.
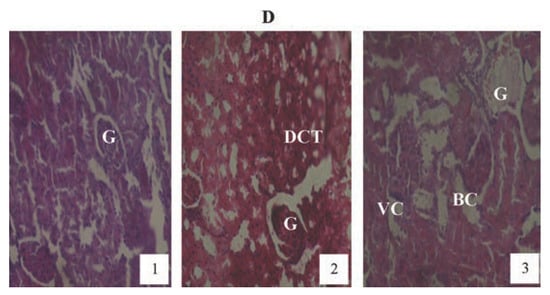
Figure 10.
Hematoxylin and eosin staining after administration of 6 mg/kg of paraquat representing test subgroups maintained with no vitamin C medicated drinking water for a period of 3 months (original magnification 400X). The slide at month (1) is showing a picture of shrunken Bowman’s capsules (BC) and swollen glomeruli (G) progressing to massive renal vascular congestion (R) and degeneration (DCT) at month (2). At month (3) the picture indicated advanced renal tubular atrophy (VC), interlobular vacuolation with glomerular (G) and tubular degeneration. Changes increased in an exposure time dependent manner.
These structural abnormalities were also observed in a dose and exposure-time dependent manner in the test subgroups medicated with vitamin C (Bvitc, Cvitc and Dvitc), but its severity were somewhat mild when compared to the PQ only treated test subgroups (B, C and D) as shown in Figure 11, Figure 12 and Figure 13. Most of the renal tubules were damaged and lost their characteristic appearance [Figure 8 (month 3), Figure 9 (month 3) and Figure 10 (months 2 and 3), Figure 11 (month 2)]. The epithelial cells linings became undistinguishable and their contents lost. The walls of the Bowman’s capsules were eroded and the glomeruli atrophied [Figure 12 (month 2)] and in some sections appeared as empty spaces [Figure 10 (month 3) containing amorphous debris.
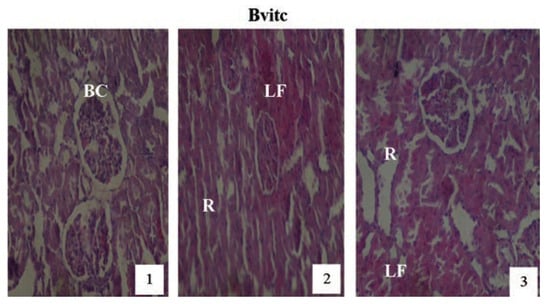
Figure 11.
Hematoxylin and eosin staining after administration of 2 mg/kg of paraquat representing test subgroups maintained with vitamin C medicated drinking water (1 g/L) for a period of 3 months (original magnification 400X). The slide at month (1) is showing a picture of shrunken Bowman’s capsules (BC) and swollen glomeruli progressing to renal vascular congestion (R) and leucocyte infiltrations (LF) at month (2). At month (3) the picture indicated advanced renal tubular hypertrophy (R), leucocytes infiltrations (LF), interlobular vacuolation with glomerular and tubular degeneration. Changes increased in an exposure time dependent manner.
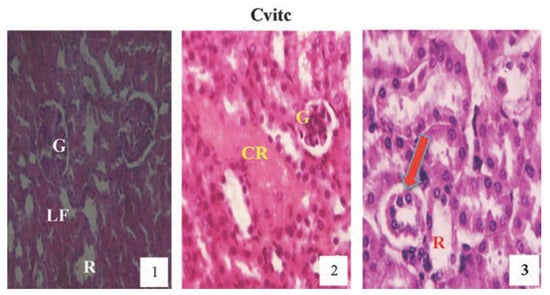
Figure 12.
Hematoxylin and eosin staining after administration of 4 mg/kg of paraquat representing test subgroups maintained with vitamin C medicated drinking water (1 g/L) for a period of 3 months (original magnification 400X). The slide at month (1) is showing a picture of shrunken Bowman’s capsules and congested glomeruli (G) and leucocyte infiltrations (LF), progressing to renal vascular congestion (CR) and leucocyte infiltrations (LF) with shrunken glomeruli at month (2). At month (3) the picture indicated renal tubular (R) desquamated from the underlying basement membranes (arrow), interlobular vacuolation with glomerular (G) and tubular degeneration. Changes increased in an exposure time dependent manner but much better than Figure 10.
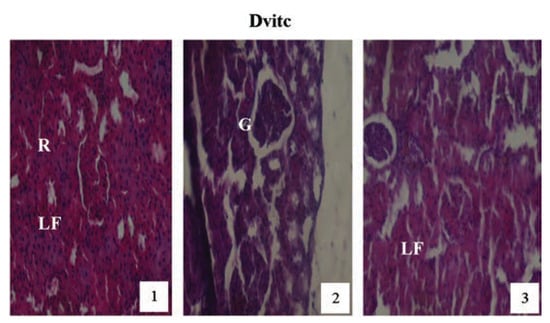
Figure 13.
Hematoxylin and eosin staining after administration of 6 mg/kg of paraquat representing test subgroups maintained with vitamin C medicated drinking water (1 g/L) for a period of 3 months (original magnification 400X). The slide at month (1) is showing a picture of shrunken Bowman’s capsules and glomeruli (G) with leucocytes infiltration (LF), progressing to renal vascular congestion (R) and leucocyte infiltrations (LF) at month (2). At month (3) the picture indicated advanced renal tubular hypertrophy (R), leucocyte infiltrations (LF), interlobular vacuolation with glomerular (G) and tubular degeneration. Changes increased in an exposure time dependent manner.
Discussion
Humans are exposed to a mixture of environmental pollutants, such as pesticides, herbicides, fungicides, etc., by various routes: air, food and water.[27] These compounds have the potential to disrupt metabolic processes, resulting in various metabolic abnormalities, reproductive problems, cancers and other effects.[28] PQ is a synthetic bipyridylium herbicide, widely used in weed control, which when accidentally ingested causes damage to cellular component as a result of its highly oxidative properties that produce superoxides. Following the findings from the acute toxicity study,[18] where it was observed that toxicity effects existed with increasing dose and exposure-time of PQ ip insult on the kidney cells. A chronic study was designed to assess the toxicity of PQ at longer period of treatment (3 months), and also to find the possibility of ameliorating the toxic injury using the antioxidant, vitamin C.
In this study, the biochemical and histological changes in the rat’s kidney were examined, in vivo, after 3 months exposure to sublethal doses of PQ. Dose and exposure-time dependent PQ toxicity resulted in significant reduction in urine pH, elevation of urine SG, proteinuria, glycosuria, reduction in serum glucose and total protein, elevation of serum urea and creatinine concentrations and progression of glomerular and tubular injuries. The results were in agreement with the findings of other studies.[29,30] Abdel-Mageid[31] observed that kidney tissues of PQ intoxicated rats, revealed degeneration of renal tubules, shrunken glomeruli and congested dilated blood vessels. Damin, et al.[32] emphasized that PQ poisoning caused renal damage. Laurence and Bennett[33] reported that toxicity of PQ caused renal tubular necrosis followed by kidney failure. Hassina[27] in his work on biochemical and hietopathological changes in the kidney and adrenal gland of rats following repeated exposure to lambda-cyhalothrin (LCT) observed that the kidneys of treated rats showed narrowed appearance of Bowman’s space, degeneration of tubular epithelial lining, widened lumen and tissue congestions. Fetoui et al. [34] also observed similar lesions in the kidneys of rats treated with LCT. Other published works also accented to the fact that PQ is highly toxic to the kidney cells and that inflammatory cells were found in the interstitial tissues of the kidneys of PQ treated animals.[18,35,36,37,38,39] The subsequent maintenance of PQ intoxicated rats with vitamin C medicated water (1 g/L) ameliorated the toxic insult by rejuvenating the injured cells and restoring the normal metabolic processes in vivo. Asada[14] confirmed that vitamin C acted as a substrate for the antioxidant enzyme ascorbate peroxidase, a function that is particularly important in stress resistance[40] thereby maintaining and repairing cellular integrity and functions of affected organs.[12,41,42] From a practical perspective, it is useful to apply a tiered strategy in analyses of urine to gain different levels of knowledge on kidney function. First, urine osmolality, urine volume and urine pH provides basic insight into overall fluid homeostatic and acid-base state. These parameters are highly dependent upon intakes and metabolic state, and treatmentrelated changes are most easily detected by comparison with untreated controls or appropriate historical controls. While urine osmolarity or SG is the ratio of excreted osmotically active solutes to excreted water, and is susceptible to changes in either water or solute excretion. Urine pH is an indicator of relative total body acid (or base) load. From the results of this study, it is evident that, the pH of the samples of the test subgroups became more acidic as the dose and exposure-time of PQ toxicity increased. The acidic nature of the test subgroups were more on the PQ dosed subgroups maintained with vitamin C medicated water than on the subgroups on only PQ toxicity throughout the study period. This result was corroborated by the findings of Lee et al.,[30] which the pH of urine is a reflection of the kidneys ability to maintain normal hydrogen ion concentration in plasma and extracellular fluid, and that the xenobiotic-induced metabolic activities produces non-volatile acids that cannot be extracted by the lungs which when in excess renders the urine acid in reaction. Schumann and Schweitzer[43] also supported the findings by stating that the capacity to exchange hydrogen ions for cation and the formation of ammonia is decreased when tubular function is impaired, resulting in systemic acidosis. Thus, it appears that both PQ toxicity effect and vitamin C medication lead to the increase in urinary pH of the test animals.
It could also be suggested that the increase in urinary SG of the test subgroups could either be as a result of PQ toxicity effect or by the reduction in fluid intake by the test animals with increase in dose and exposure time of treatment. It is expected that the test-animal’s urine became more concentrated with reduction in urine volume leading to raised excretable solutes, which in-turn raised the urine SG. These increases were directly proportional to the increase in dose and exposuretime of treatment. Lee et al.[30] and Schumann and Schweitzer[43] corroborated this findings with their various reports summed up that the volume of excreted urine and its concentration of solute are varied by the kidney to maintain homeostasis of the body fluid and electrolyte. To achieve this, they stated that with reduction in fluid intake, the kidneys produce urine that are more concentrated than in solutes than the plasma from which it was derived, thereby riding itself of unwanted solutes that would have been injurious to the system. Paraquat is known to be filtered at the glomerulus and actively secreted by tubular cells unchanged.[44] In addition, it has been reported that the kidney is next to the lungs in having the highest concentration of PQ in animals.[45] The damage done to the renal tubules as a result of high PQ toxicity effects could result in leakage of the reabsorbable solutes causing the establishment of raised urinary SG.
The semi-quantitative established presence of glucose and protein in the urine specimens of treated animals can also be explained by the findings of the supporting literatures above.[30,43-45] It was also observed in our study that the established proteinuria and glycosuria were more in the PQ only treated subgroups than in the subgroups that were maintained with vitamin C medicated water. The degrees of glycosuria in the result were more than the proteinuria observed. Sastry et al. [46] and Das and Mukherjee[47] in support, observed that exposure of fish for a long time to most toxicants, including pesticides, interfered with protein metabolism. Depletion of total protein in plasma or serum of fish may be due to impaired synthesis of protein or enhanced loss via excretion through the kidney. Jee et al.[48] suggested that toxic insult were responsible for the severe proteinuria and glycosuria observed in their study. The progress report of International Programme on Chemical Safety (IPCS)[36] confirmed that the resulting proteinuria was as a result of kidney failure occasioned by PQ insult in the renal tubular cells. The case of a Korean woman who presented upon admission with generalized proximal tubular dysfunction with aminoaciduria, phosphaturia and glycosuria after accidental PQ intoxication also gave support to the findings.[49] It was also observed in this report that the level of glycosuria and proteinuria were much lower in the vitamin C medicated subgroups than the PQ only treated subgroups.
The dose and exposure-time dependent increases in serum urea and creatinine levels as observed in Table 5 and Figure 3 and Figure 4, dosed 4 and 6 mg/kg PQ were considered as significant markers of renal dysfunction.[50,51] Also, the PQ treated vitamin C medicated subgroups had increased values that were significantly lower than the PQ only treated subgroups. The controls showed no observable significant difference when a comparison was placed between subgroup on vitamin C and the subgroup on no vitamin C or PQ treatments. This is also confirming that the concentration of vitamin C used was non-toxic to the animals treated. Urea levels can be increased by many factors such as dehydration, diet and antidiuretic drugs, while creatinine is more specific to the kidney. Raised creatinine concentration is an index of kidney dysfunction.[52] The significant increases in serum urea and creatinine in this study were classical signs of adverse affects of PQ toxicity on the kidney cells. Akinloye et al.,[39] asserted that the increased level of blood creatinine with decreased level of blood protein may indicate protein catabolism and/or dysfunction. Cobe[53] confirmed that increased blood urea and creatinine values were as a result of PQ poisoning. Hassina[27] and Garba et al.[52] in their works with a pyrethroid insecticide LCT also confirmed the establishment of increased levels of urea and creatinine in plasma of toxic insulted animals. The positive lowering effect vitamin C medication has on the urea and creatinine concentrations in PQ intoxicated rats is corroborated by the report of Wershana[12] which stated that vitamin C succeeded partially in preventing the impairment in renal function as seen from the significantly reduced urea and creatinine concentrations when compared to the findings in the test subgroups on only PQ insult. Also McCall and Balz[54] confirmed that antioxidant nutrients as vitamin C, vitamin E, B-carotene, etc. are considered to give protection against oxidative damage induced by different toxicants and reduce the activity of free radicalinduced reactions.
The significant findings of a dose and exposure-time dependent decreases in serum total protein and glucose levels in PQ treated test subgroups when compared to the controls are considered as markers of renal dysfunction. The test animal subgroups maintained with vitamin C medication had better improved serum glucose and total protein levels (P≤0.01) than the test subgroups on PQ only treatment. The control subgroups comparison also showed no observable effect between the vitamin C medicated control (Avitc) and the null (A) subgroups. Hypoglycemia has been reported in a wide variety of acquired hepatic and renal diseases, it could also be caused by excessive metabolic loss, by inadequate production or by a combination of both mechanisms.[12] Excessive insulin secretion occasioned by toxic insult could also result in hypoglycemia.[55] PQ significantly decreased plasma levels of total protein and albumin.[39] Post treatments with vitamin C resulted in marked protection against PQ-induced liver, kidney and lungs injuries with observable improvement in the levels of plasma protein.[39,56] Seifi et al.[57] observed in their study that rats treated with Deoxycorticostrone acetate salt for 4 weeks exhibited a marked increase in urinary protein excretion, hypoproteinemia and structural abnormalities in the kidney. When the rats were treated with antioxidants (vitamin C and/or vitamin E), an observable decreases in urinary protein excretion, and improvement in plasma protein levels and improvement in renal architecture were significantly noted. In corroboration, the findings that the co-administration of vitamin E and C to a mouse under PQ insult completely restored the liver and kidney functions with normalization of the liver enzyme activities, plasma glucose, urea, protein and creatinine levels within 28 days of treatment.[58,59] Wershana[12] gave a contrary opinion in his findings that administration of vitamin C or selenium to PQ treated animals induced more hypoglycemic effect than that caused by PQ insult.
So far, paraquat is widely used for recreational, agricultural and industrial purposes. Thus residues of PQ and its metabolites could remain as pollutants in water, air and food,[60] when accidentally inhaled, contacted or ingested at toxic doses could lead to major organ toxicity effect resulting in altered metabolic processes which could finally culminate in death.[18,61,62,63] The present study therefore clearly shows that PQ has a harmful influence on the renal tissues and caused alterations in the levels of metabolic markers of kidney functions. Vitamin C has also been shown to offer protection against toxic insults[64,65] as indicated in the findings of the present study.
Conclusions
Our data has shown that vitamin C administration in PQ intoxicated animals improved the values of the biochemical parameters used to assess toxicity. The decreases in urinary protein and glucose excretion, the restoration of serum protein, glucose, urea and creatinine levels and the improvement in renal and function architecture in vitamin C treated subgroups suggests a major role of antioxidant, vitamin C, in the treatment of toxic insult. It will be imperative that vitamin C medication should be given priority attention in cases of PQ poisoning as a first-line treatment.
Contributions
BNO, lead author, research and study design, specimens analysis and overall supervision; EON, manuscript revising; PCE, preparation of kidney histological slides; CUO, animals handling for sample production, sample analysis and statistical computation of results; GOA, histological procedures and tissue slide microscopic examination, data proofreading.
Conflict of interests
this research work was not sponsored by any Organization, Institution or Individual. It did not receive grant from any Institution for the development of this research work or during the preparation of the final manuscript for publication. There exists no conflict of interest whatsoever in the conduct of this research work, either with the co-authors or anybody else.
References
- Mee, G.C. Experiments on the herbicidal action of 1, 1-ethylene-2. 2dipyridylium dibromide. Ann Appl Biol 1960, 48, 601–12. [Google Scholar]
- Summers, L.A. Paraquat and diquat. The bipyridylium herbicides; Academic Press: London, New York, 1980; pp. 1–449. [Google Scholar]
- Punchard, N.A.; Kelly, F.J. (Eds.) Free radicals: a practical approach; IRL Press: Oxford, 1996; pp. 271–285. [Google Scholar]
- Davies, K. oxidative stress: the paradox of aerobic life. Biochem Soc Symp 1995, 61, 1–31. [Google Scholar]
- Baker, F.J.; Silverton, R.E. (Eds.) Renal function tests. In Introduction to medical laboratory technology; 5th ed.; Butterworth: London, 1976; pp. 233–282. [Google Scholar]
- Beeuwkes, R. The vascular organization of the kidney. Annu Rev Physiol 1980, 42, 531–3. [Google Scholar] [CrossRef]
- Mitch, W.E. Acute renal failure. In Cecil textbook of medicine, 21st ed.; Goldman, F., Bennet, J.C., Eds.; W.B. Saunders: Philadelphia, 2000; pp. 567–570. [Google Scholar]
- Bullivant, C.M. Accidental poisoning by paraquat: report of two cases in man. Br Med J 1966, 1, 1272–3. [Google Scholar] [CrossRef]
- Kadagoda, N.; Jayewardene, R.P.; Attygalle, D. Poisoning with paraquat. Forens Sci 1973, 2, 107–11. [Google Scholar] [CrossRef]
- Vale, J.A.; Meredith, T.J.; Buckley, B.M. Paraquat poisoning: clinical features and immediate general management. Hum Toxicol 1987, 6, 41–7. [Google Scholar] [CrossRef]
- Jones, G.M.; Vale, J.A. Mechanism of toxicity, clinical features, and management of diquat poisoning: a review journal of toxicology. Clin Toxicol 2000, 38, 123–8. [Google Scholar]
- Wershana, K.Z. The influence of vitamin C or selenium on paraquat-induced toxicity in guinea pigs. Pakistan J Biol Sci 2001, 4, 81–8. [Google Scholar] [CrossRef][Green Version]
- Sies, H. Oxidative stress: oxidants and antioxidants. Exp Physiol 1997, 82, 291–5. [Google Scholar] [CrossRef]
- Asada, K. Ascorbate peroxidase-hydrogen peroxide-scavenging enzyme in plants. Physiol Plant 1992, 85, 235–41. [Google Scholar] [CrossRef]
- Foyer, C. Ascorbic acid. In Antioxidants in higher plants; Alscher, R.G., Hess, J.L., Eds.; CRC Press: Boca Raton, 1993; pp. 31–58. [Google Scholar]
- Rhee, S.G. Cell signaling. H2O2, a necessary evil for cell signaling. Science 2006, 312, 1882–3. [Google Scholar] [CrossRef]
- Loewus, F.A. Ascorbic acid and its metabolic products. In The biochemistry of plants; Preiss, J., Ed.; Academic Press: New York, 1988; pp. 85–107. [Google Scholar]
- Dede, E.B.; Okolonkwo, B.N.; Ngokere, A.A. Toxicological effects of paraquat on the histology of the stomach, small intestine and testis of male albino rats (Rattus rattus). Port Harcourt Med J 2007, 2, 51–5. [Google Scholar]
- Animal Care and Ethics, Committee. Blood collection in rodents and rabbits. Newcastle: University of Newcastle, ACEC; 1999. Accessed: June 2007. Available online: http://www.newcastle.edu.au/research/animal/revision/acec2 9.pdf.
- Kurien, B.T.; Everds, E.N.; Scofield, R.H. Experimental animal urine collection: a review. Lab Anim Sci 2004, 38, 333–63. [Google Scholar] [CrossRef]
- Khosho, F.K.; Kaufmann, R.C.; Amankwah, K.S. A simple and efficient method for obtaining urine samples from rats. Lab Anim Sci 1985, 35, 513–4. [Google Scholar]
- Diel, K.H.; Hull, R.; Morton, D.; Pfister, R.; Rabemampianina, Y.; Smith, D.; et al. A good practice guide to the administration of substances and removal of blood including routes and volumes. J Appl Toxicol 2001, 21, 15–23. [Google Scholar] [CrossRef]
- Roche Diagnostics®. Glucose oxidase meter: Accu-check active and glucotrend. Roche Diagnostics GmbH, Manheim, Germany; 2009. Available online: https://www.accu-chek.com/index.html.
- Young, D.S. Urea estimation. Effects of drugs on clinical laboratory tests, 4th ed.; AACC Press: Washington, DC, 1995. [Google Scholar]
- Teitz: textbook of clinical chemistry, 3rd ed.; Burtis, A., Ashwood, E.R., Eds.; W.B. Saunders: Philadelphia, 1999; pp. 2184–2190. [Google Scholar]
- Brzoska, M.M.; Moniuszko-Jakoniuk, J.; PilatMarcinkiewicz, B.; Sawicki, B. Liver and kidney function and histology in rats exposed to cadmium and ethanol. Alcohol Alcoholism 2003, 38, 2–10. [Google Scholar] [CrossRef]
- Hassina, K.O. Biochemical and histopathological changes in the kidney and adrenal gland of rats following repeated exposure to lambda-cyhalothrin. J Xenobiotics 2014, 4, 8–13. [Google Scholar]
- Pratera, M.R.; Gogal, J.R.A.R.; Blaylockb, B.L.; Longstrethc, J.; Holladaya, S.D. Single-dose topical exposure to the pyrethroid insecticide, permethrin in C57BL/6N mice: effects on thymus and spleen. Food Chem Toxicol 2002, 40, 1863–73. [Google Scholar] [CrossRef]
- Kawai, Y.; Kubota, K.; Tanaka, H. Effect of acute paraquat toxicity on ascorbic acid levels of liver and plasma in mice. Jpn Fukoka Uni Acad J 2008, 38, 37–46. [Google Scholar]
- Lee, E.Y.; Lee, M.Y.; Hong, S.H.; Chung, C.H.; Hong, S.Y. Blockade of oxidative stress by vitamin C ameliorates albuminuria and renal sclerosis in experimental diabetic rats. Yonsei Med J 2007, 48, 847–55. [Google Scholar] [CrossRef]
- Abdel-Mageid, S.A. Structural changes in the kidney of albino rat in response to the administration of paraquat herbicide. J Egypt Ger Soc Zool 1994, 15, 153–75. [Google Scholar]
- Damin, F.; Frank, B.; Winfried, H.; Hartmut, M.; Laus, W. Failure of radio therapy to resolve fatal lung damage due to paraquat poisoning. Chest 1992, 100, 1146–65. [Google Scholar]
- Laurence, D.R.; Bennett, D.N. Clinical pharmacology, 7th ed.; Churchill Livingstone, Oxford University Press: Oxford, 1992. [Google Scholar]
- Fetoui, H.; Makni, M.; Garoui Zeghal, E.M.N. Toxic effects of lambda-cyhalothrin, a synthetic pyrethroids pesticide, on the rat kidney: involvement of oxidative stress and protective role of ascorbic acid. Exp Toxicol Pathol 2010, 62, 593–9. [Google Scholar] [CrossRef]
- Vaziri, N.D.; Ness, R.L.; Fairshter, R.D.; Smith, W.R.; Rosen, S.M. Nephrotoxicity of paraquat in man. Arch Intern Med 1979, 139, 172–74. [Google Scholar] [CrossRef]
- International Programme on Chemical Safety (IPCS). Paraquat and diquat. Geneva: World Health Organization: Environmental Health Criteria series 1984, 39, 1–2.
- Hassan, H.M.; Fridovich, I. Superoxide dismutases: detoxification by a free radical. In Enzymatic basis of detoxication; Jakoby, W.B., Ed.; Academic Press: New York, 1980; pp. 1, 311–322. [Google Scholar]
- Borchard, F. [Ultrastructural and microscopical findings in 3 cases of paraquat poisoning with prolonged lethal course (author’s transl)]. Pneumologie [Article in German]. 1974, 150, 185–9. [Google Scholar]
- Akinloye, O.A.; Adamson, I.; Ademuyiwa, O.; Arowolo, T.A. Supplimentation of vitamin C, E and its combination on paraquat intoxicated rats: effects of some biochemical and markers of oxidative stress parameters. Adv Biores 2011, 2, 92–100. [Google Scholar]
- Shigeoka, S.; Ishikawa, T.; Tamoi, M.; Miyagawa, Y.; Takeda, T.; Yabuta, Y.; et al. Regulation and function of ascorbate peroxidase isoenzymes. J Exp Bot 2002, 53, 1305–19. [Google Scholar] [CrossRef]
- Wefers, H.; Sies, H. The protection by ascorbate and glutathione against microsomal lipid peroxidation is dependent on vitamin E. Eur J Biochem 1988, 174, 353–7. [Google Scholar] [CrossRef]
- Tantcheva, L.P.; Stoeva, E.S.; Galabov, A.S.; Braykova, A.A.; Savov, V.M.; Mileva, M.M. Effect of vitamin E and vitamin C combination on experimental influenza virus infection. Exp Clin Pharmacol 2003, 4, 259–64. [Google Scholar] [CrossRef]
- Schumann, B.G.; Schweitzer, C.S. Examination of urine. In Clinical diagnosis and management by laboratory methods, 18th ed.; Henry, J.B., Ed.; W.B. Saunders: Philadelphia, PA, 1991; pp. 396–408. [Google Scholar]
- Bismuth, C.; Garnier, R.; Baud, F.J.; Muszynski, J.; Keyes, C. Paraquat poisoning; an overview of the current status. Drug Saf 1990, 5, 243–51. [Google Scholar] [CrossRef]
- Sharp, C.W.; Ottolenghi, A.; Posner, A.S. Correlation of paraquat toxicity with tissue concentration and weight loss of the rat. Toxicol Appl Pharmacol 1972, 22, 241–51. [Google Scholar] [CrossRef]
- Sastry, K.V.; Diqui, A.A.; Singh, S.K. Alterations in some biochemical parameters in the Dnake head fish Channa punctatus exposed clinically to quinalphose. Chemosphere 1982, 2, 1211–12. [Google Scholar] [CrossRef]
- Das, B.K.; Mukherjee, S.C. Sub-lethal effects of Quinalphos on selected blood parameters of Labeo rohita (Ham) fingerlings. Asian Fish Sci 2000, 13, 225–33. [Google Scholar]
- Jee, L.H.; Masroor, F.; Kang, J. Responses of cypermethrin induced stress in haematological parameters of Korean rockfish, Sebastes schegeli. Aqua Res 2005, 36, 898–905. [Google Scholar] [CrossRef]
- Hyo, W.G.; Jong, O.Y.; Eun, Y.L.; Sae, Y.H. Paraquat-induced fanconi syndrome. Nephrology 2005, 10, 430–32. [Google Scholar]
- Coles, E.H. Veterinary clinical pathology; W.B. Saunders: Philadelphia, PA, 1986. [Google Scholar]
- Almdal, T.P.; Vilstrup, H. Strict insulin treatment normalizes the organic nitrogen contents and the capacity of urea-N synthesis in experimental diabetes in rats. Diabetologica 1988, 31, 114–8. [Google Scholar] [CrossRef]
- Garba, S.H.; Adelaiye, A.B.; Mshellia, L.Y. Histopathological and biochemical changes in the rat’s kidney following exposure to a pyrethroid based mosquito coil. J Appl Sci Res 2007, 3, 1788–93. [Google Scholar]
- Cobe, R.B. Helping animals exposed to the herbicide paraquat. Vet Med 2004, 110, 755–62. [Google Scholar]
- McCall, M.R.; Balz, F. Can antioxidant vitamins materially reduce oxidative damage in humans? Free Rad Biol Med 1999, 26, 1034–53. [Google Scholar] [CrossRef]
- Campbell, E.J.; Dickson, C.J.; Spater, J.D.; Edwards, C.W.; Sikora, K. Insulin production. Clinical physiology, 5th ed.; Butter and Tanner Ltd.: London, 1984; pp. 446–470. [Google Scholar]
- Yeragi, S.G.; Rana, A.M.; Koli, V.A. Effect of pesticides on protein metabolism of mudskipper Boleophthalmus dussumieri. J Ecotoxicol Environ Monit 2003, 13, 211–4. [Google Scholar]
- Seifi, B.; Kadkhodaee, M.; Karimian, S.M.; Zahmatkesh, M.; Shams, S.; Bakhshi, E. reduction of kidney damage by supplementation of vitamin C and E in rats with deoxycorticosterone-salt-induced hypertension. Int J Kidney Dis 2009, 3, 197–202. [Google Scholar]
- Hercberg, S.; Glan, P.; Preziosi, P.; Roussel, A.M.; Arnaud, J.; Richard, M.J.; et al. Background and rationale behind the SU. VI. MAX. study, a prevention trial using nutritional doses of a combination of antioxidant vitamins and minerals to reduce cardiovascular diseases and cancer. Int J Vitam Nutr Res 1998, 68, 3–20. [Google Scholar]
- Murray, K.K.; Granner, D.K.; Mayes, P.A.; RodWell, W.V. Glucose metabolism. Harper’s biochemistry, 24th ed.; Appleton & Lang: Norwalk, CT, Los Altos, CA, 1993. [Google Scholar]
- Graciela, H.C.; Astiz, M.; Alaniz, M.J.T.; Marra, C.A. Frequently-used agrochemicals lead to functional and morphological spermatozoa alterations in rats. J Toxicol Environ Health Sci 2011, 3, 180–92. [Google Scholar]
- Okolonkwo, B.N.; Nwachuku, O.E. The antioxidant effects of vitamin C on liver enzymes: aspartate aminotransferase, alanine aminotransferase, alkaline phosphatase and gamma-glutamyltransferase activities in rats under paraquat insult. J Xenobiotics 2013, 3, 24–8. [Google Scholar] [CrossRef][Green Version]
- Lewis, C.P.L.; Nemery, B. Pathophysiology and biochemical mechanisms of the pulmonary toxicity of paraquat. In Paraquat poisoning. Mechanism, prevention and treatment; Bismuth, C., Hall, A.H., Eds.; Dekker, M. Inc.: New York, 1995; pp. 107–140. [Google Scholar]
- Okolonkwo, B.N.; Eneh, P.C.; Ibharokhonre, V. Antioxidant effect of vitamin c on lipid profile parameters in paraquat treated male rats (Rattus norvegicus): cardiovascular risk factors. Eur J Cardiovasc Med 2013, 2, 204–9. [Google Scholar]
- Nagano, N.; Yagi, M.; Koji, N. Protective effects of antioxidants on paraquat induced acute renal failure in mice. Jpn J Pharmacol 1992, 59, 481–3. [Google Scholar] [CrossRef][Green Version]
- Shukla, G.S.; Chandra, S.V. Cadmium toxicity and bioantioxidants: Status of vitamin E and ascorbic acid of selected organs in rat. J Appl Toxicol 1989, 9, 119–22. [Google Scholar] [CrossRef]
© Copyright B.N. Okolonkwo et al., 2014 Licensee PAGEPress, Italy. This work is licensed under a Creative Commons Attribution NonCommercial 3.0 License (CC BYNC 3.0).
