Article

Urinary β2-Microglobulin Predicts the Risk of Hypertension in Populations Chronically Exposed to Environmental Cadmium

by
Soisungwan Satarug
Centre for Kidney Disease Research, Translational Research Institute, Woolloongabba, Brisbane, QLD 4102, Australia
J. Xenobiot. 2025, 15(2), 49; https://doi.org/10.3390/jox15020049
Submission received: 29 November 2024 / Revised: 14 March 2025 / Accepted: 27 March 2025 / Published: 28 March 2025

Abstract

:
Chronic exposure to the pollutant cadmium (Cd) is inevitable for most people because it is present in nearly all food types. Concerningly, the risk of developing hypertension has been linked to dietary Cd exposure lower than 58 µg/day for a 70 kg person. The mechanisms involved are, however, unclear. Since the kidneys play an indispensable role in long-term blood pressure regulation, and they are also the main site of Cd accumulation and toxicity, a retrospective analysis was conducted to examine if kidney damage and malfunction, reflected by urinary β2-microglobulin excretion (Eβ2M), and the estimated glomerular filtration rate (eGFR), are related to Cd excretion (ECd) and blood pressure variation. Data were obtained from 689 Thai Nationals without diabetes or occupational exposure to Cd, of which 32.4% had hypertension and 7.3% had β2-microglobulinuria, defined as an increase in the β2M excretion rate ≥ 300 µg/g creatinine. Respective prevalence odds ratio (POR) and 95% confidence interval (CI) values for β2-microglobulinuria and hypertension were 10.7 (1.36–83.4), p = 0.024 and 2.79 (1.60–4.87) p < 0.001, comparing the top quartile of ECd with the bottom quartile. Only in subjects with eGFR below 90 mL/min/1.73 m2 did systolic blood pressure (SBP) and diastolic blood pressure (DBP) both increase linearly with Eβ2M (respective β = 0.182 and 0.192 for SBP and DBP) after adjustment for age, body mass index, gender, and smoking. The present study confirms the significant impact of Cd on the risk of having hypertension, following GFR loss induced by Cd. A simple mediation model analysis for cause–effect inference has provided, for the first time, evidence that may link rising SBP and DBP in Cd-exposed people to a novel role of β2M as a predictor of blood pressure variability.

1. Introduction

Nearly a third of the adult population worldwide is affected by hypertension, defined as a persistent elevation of systolic blood pressure (SBP) and/or diastolic blood pressure (DBP)  ≥ 140/90 mm Hg [1,2]. In 2019, high SBP contributed to 19.2% of all deaths globally [2]. Notably, hypertension is a modifiable risk factor for dementia and cardiovascular disease and is a contributing factor to the progression of chronic kidney disease (CKD) toward kidney failure [3,4,5]. The majority of hypertensive patients (90–95%) have primary hypertension, also known as essential hypertension, for which the cause is unknown, while an underlying pathology, which causes a rise in blood pressure, is responsible for hypertension development in 5–10% of hypertensive patients [3,4,5].
Cadmium (Cd) is one of the environmental contaminants with significant global public health threats because Cd is found in a normal diet [6,7,8]. Polluted air and cigarette smoke are increasingly reported as additional Cd exposure routes in urban populations [9,10,11]. Cd has no nutritional value or physiological role, but due to a lack of excretory mechanisms, it is retained within cells, tissues, and organs, especially the kidney cortex, where most acquired Cd accumulate [6,12,13].
Increased risks of kidney damage and dysfunction [14,15,16], hypertension [17,18,19], and CKD [20,21] in many populations have been associated with exposure to Cd levels much lower than a tolerable intake level of 58 µg/day for a 70 kg person, suggested to be an exposure level that carries a negligible health risk [https://apps.who.int/iris/handle/10665/44521, accessed on 7 February 2025]. However, there is evidence that links an increased risk of CKD with exposure to a Cd dose between 10 and 15 µg/day [20,21,22]. In a cross-section study on the U.S. general population, aged 20–85 years (n = 55,677), CKD risk rose linearly with blood Cd concentration independently of smoking and obesity [21]. In a prospective cohort study from the U.S., Cd excretion rates of ≥0.60 μg/g of creatinine or blood Cd levels of ≥0.70 μg/L were associated with an increased mortality in CKD patients [23].
Epidemiological studies from the U.S. [24,25,26], Canada [27], China [28,29], Korea [30,31], Japan [32], and Thailand [33,34] have implicated chronic exposure to Cd as an environmental risk factor hypertension. However, investigations into the mechanisms of Cd-linked hypertension are limited.
With the molecular weight of 12,000 Daltons, β2-microglobulin (β2M) passes through the glomerular membrane to lumen, where it is internalized and degraded by proximal tubular cells [35,36]. In Cd toxicity research, an increased excretion of β2M ≥ 300 µg/g creatinine is used to signify a reduced protein reabsorption [37]. Current evidence, however, suggest that β2M has a wide diversity of biological roles, which include blood pressure control [38,39,40]; an elevated plasma β2M has been found to be associated with increases in prevalent and incident hypertension in the Framingham Heart Study (n = 7065) [40].
The present study was aimed to explore the potential role of β2M in the variation in SBP/DBP and the risk of having hypertension in relation to eGFR and Cd body burden. In addition, it was aimed to examine if gender differences are related to Cd-induced hypertension.

2. Materials and Methods

2.1. Data Sources

Data were collected from 689 Thai Nationals (251 males, 438 females) who did not have diabetes type 2 [22,41,42]. Of a total 689 subjects, 308 were residents of Mae Sot District, Tak Province, endemically contaminated with Cd, and 381 persons were selected from the following three low-exposure localities: a non-contaminated zone of the Mae Sot District (n = 63), Bangkok (n = 248), and Nakhon-Si-Thammarat Province (n = 70). For the Bangkok group, those aged 16 years or older were selected [22]. The health status was ascertained by a physician’s examination reports and routine blood and urinary chemistry profiles. For the Nakhon-Si-Thammarat group [42] and the two Mae Sot groups, those who had resided at their current addresses for 30 years or longer were selected [22,41].
Exclusion criteria for all groups were pregnancy, breast-feeding, a history of exposure to metals in workplace settings, and a hospital record or physician’s diagnosis of an advanced chronic disease. The sociodemographic data, educational attainment, occupation, health status, family history of diabetes, and smoking status were obtained by structured interview questionnaires.

2.2. Measurement of Cd Exposure and Its Effects on Kidney Function

Urinary Cd and β2M were used to assess exposure to Cd and its effect on tubular re-absorptive function, respectively [22,41,42]. The estimated glomerular filtration rate (eGFR), a clinical measure of kidney function, was computed with equations of the Chronic Kidney Disease Epidemiology Collaboration (CKD-EPI) [43,44,45]. CKD stages 1, 2, 3, 4, and 5 corresponded to eGFR of 90–119, 60–89, 30–59, 15–29, and <15 mL/min/1.73 m2, respectively [45].
Samples of urine and whole blood with ethylene diamine tetra acetic acid (EDTA) as an anticoagulant were collected after an overnight fast. To prevent the degradation of β2M in acidic conditions, an alkaline (NaOH) solution was added to adjust the pH of urine samples to >6 before their storage. Aliquots of whole blood, plasma, and urine were stored at −80 °C for later analysis.
The alkaline picrate Jaffe’s reaction, as described by Bonness and Taussky [46] and Apple et al. [47], was used to determine urinary and plasma creatinine concentrations. The latex immunoagglutination method, as described by Bernard et al. [48], was employed to assay urinary β2M concentration (LX test, Eiken 2MGII, Eiken and Shionogi Co., Tokyo, Japan).
Urinary Cd concentration, expressed as µg/L was determined by Graphite Furnace Atomic Absorption Spectrometry (GBC System 5000, PAL2000 autosampler) [GBC Scientific Equipment, Hampshire, IL, USA], as described by Trzcinka-Ochocka et al. [49]. Multielement standards containing nine elements in dilute nitric acid, including As, Be, Cd, Cr (VI), Hg, Ni, Pb, Se, and Tl at 100 mg/L concentration per each element (Merck KGaA, Darmstadt, Germany) were used to calibrate the instrument. For quality control, the analytical accuracy and precision of Cd analysis were evaluated using reference urine metal controls containing Cd in three concentration ranges (Lyphocheck, Bio-Rad, Hercules, CA, USA). To maintain analytical accuracy, external quality assessments for Cd detection were conducted every three years.
For a urine sample containing Cd below the limit of detection (LOD), the Cd concentration assigned was the LOD value divided by the square root of 2 [50]. The LOD value for urinary Cd was the SD of at least 10 blank sample measurement multiplied by 3.

2.3. Normalization of Cd Excretion Rate and β2-Microglobulin Excretion Rate

Excretion of x (Ex) was normalized to Ecr as [x]u/[cr]u, where x = Cd or β2M; [x]u = urine concentration of x (mass/volume) and [cr]u = urine creatinine concentration (mg/dL). Ex/Ecr was expressed as an amount of x excreted per g of creatinine.
Excretion of x (Ex) was normalized to creatinine clearance (Ccr) as Ex/Ccr = [Cd]u[cr]p/[cr]u, where x = Cd or β2M; [x]u = urine concentration of x (mass/volume); [cr]p = plasma creatinine concentration (mg/dL); and [cr]u = urine creatinine concentration (mg/dL). Ex/Ccr was expressed as an amount of x excreted per volume of the glomerular filtrate [51].
Normalizations of ECd and Eβ2M were necessary because urine samples were collected at a single time point (term voided urine). The purpose of normalization of ECd and Eβ2M to Ecr as ECd/Ecr and Eβ2M/Ecr was to correct for differences in urine dilution among people. However, this Ecr-normalization has been shown to introduce non-differential errors, which bias the dose–response relationship toward null [52,53]. In comparison, the purpose of normalization of ECd and Eβ2M to Ccr as ECd/Ccr and Eβ2M/Ccr was to simultaneously correct for interindividual differences in urine dilution, and the functioning nephrons. This Ccr-normalization has unveiled an unambiguous effect of Cd on GFR.

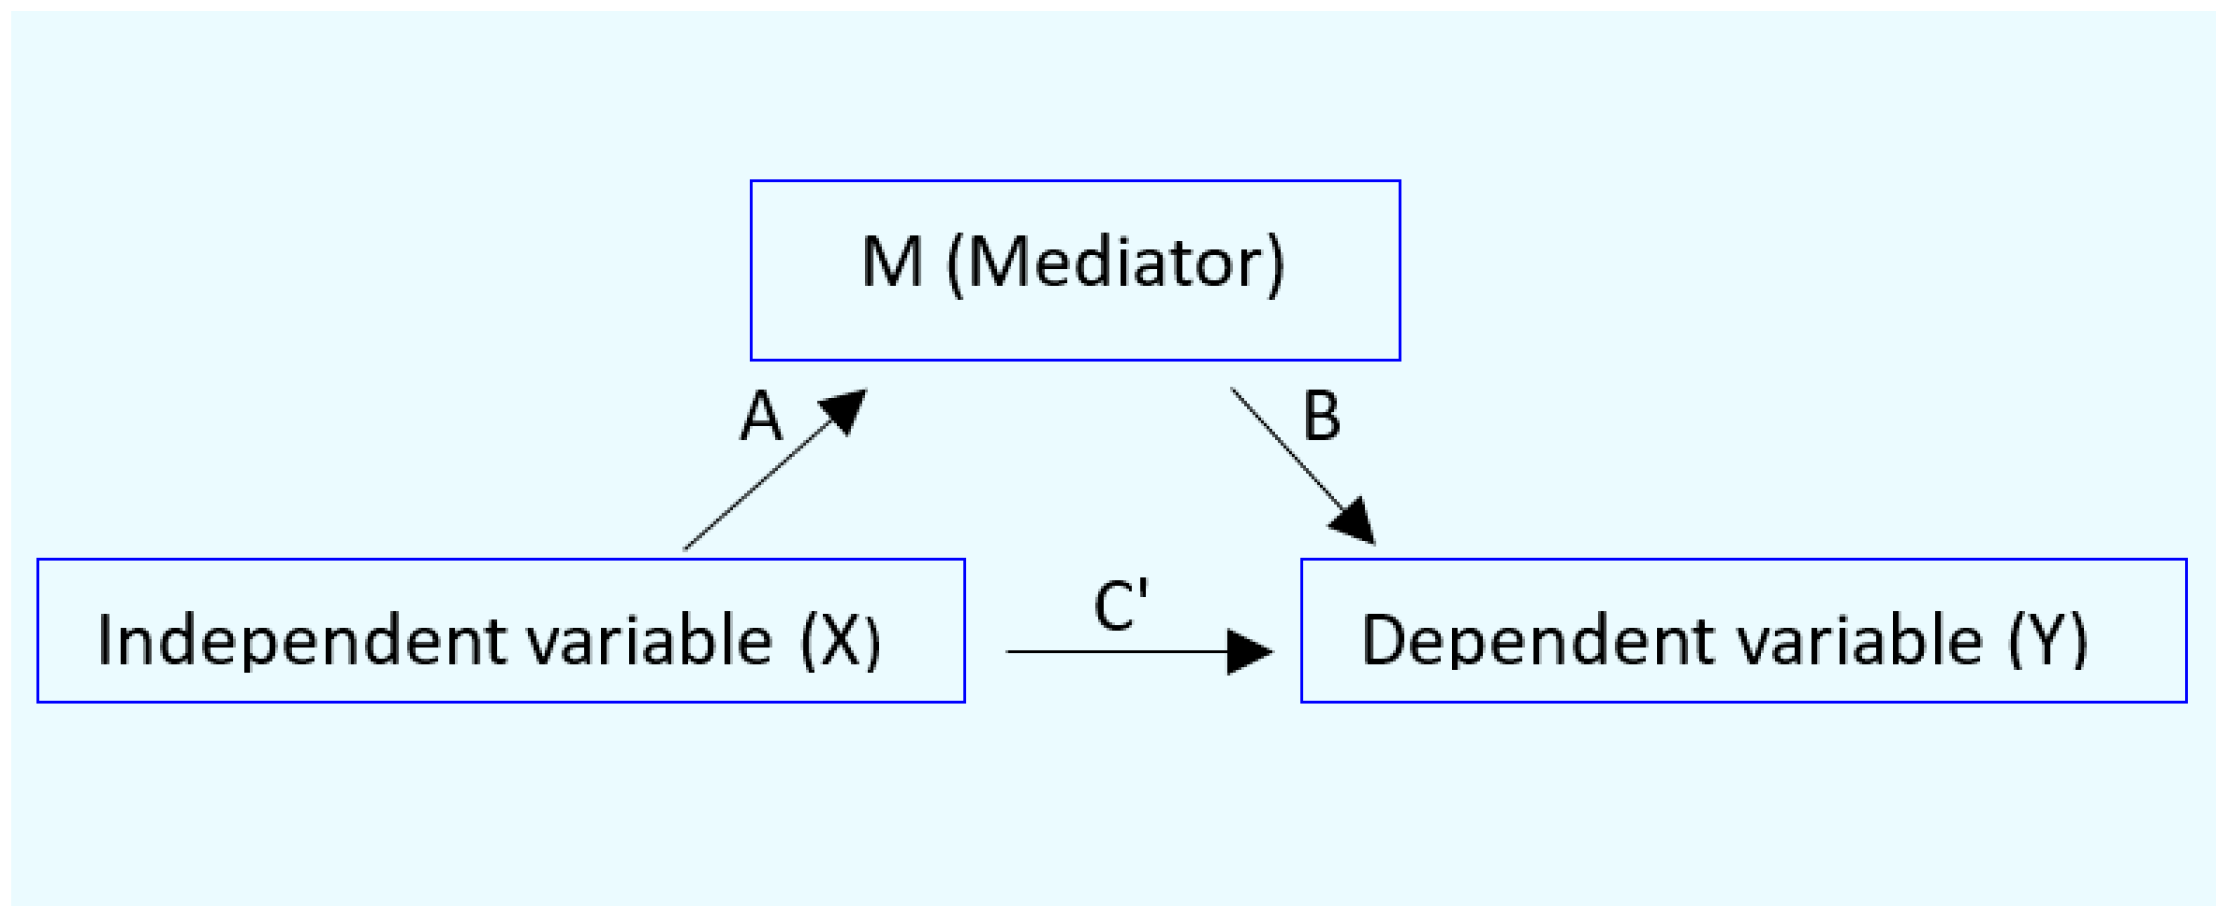
2.4. Analysis of Mediated Effects

A simple mediation model is used to examine cause–effect relationships among study variables [54,55,56]. Here, it was used to determine if ECd could be causally related to rising SBP and DBP and if urinary β2M mediated Cd-induced SBP and DBP increment. Scheme 1 depicts a generalized simple mediation model.
In the diagram above, A, B, and C’ are standardized β coefficients, describing an effect of X on Y with M as a mediator. These β values are used for computing, (1) total effect of X on Y designated as C, (2) the ratio of indirect effect, and (3) the proportion mediated [54,55,56].
C = C’ + A*B
The ratio of indirect effect = A*B/C’
The proportion mediated = A*B/C’ + A*B

2.5. Statistical Analysis

Data were analyzed with IBM SPSS Statistics 21 (IBM Inc., New York, NY, USA). The Mann–Whitney U test. was used to assess the differences between males and females. The Kruskal–Wallis test was to assess differences across the quartiles of Eβ2M. The Pearson’s chi-squared test was used to determine differences in percentages and prevalences of smoking, hypertension, low eGFR, and β2-microglobulinuria. The conformity to a normal distribution of continuous variables was assessed by the one-sample Kolmogorov–Smirnov test. Logarithmic transformation was applied ECd and Eβ2M, which showed a right-skewed distribution. The variable like eGFR, showed a left-skewed distribution and they were analyzed without any transformation. Determinants of SBP and DBP were identified by multiple linear regression modeling.
Determinants of the prevalence odds ratio (POR) values for hypertension and β2-microglobulinuria were obtained by logistic regression models, for which potential confounders (age, body mass index, smoking, and gender) were adjusted. For the Ecr-normalized data, β2-microglobulinuria was defined as Eβ2M/Ecr ≥ 300 µg/g creatinine. For the Ccr-normalized data, β2-microglobulinuria was defined as Eβ2M/Ccr ≥ 3 µg/L filtrate. For all tests, p-values ≤ 0.05 were considered to indicate statistical significance.

3. Results

3.1. Characterization of Selected Subjects According to eGFR and β2-Microglobulin Excretion

The description of participants can be found in Table 1.
Of a total 689 participants, the respective percentages (%) of females, smokers, and those with hypertension were 63.4, 28.3, and 32.4. The overall % of low eGFR and β2-microglobulinuria, defined as Eβ2M/Ecr ≥ 300 µg/g creatinine, and Eβ2M/Ccr ≥ 3 µg/L filtrate were 2.6, 7.3, and 6.8, respectively.
Respective overall mean values for age, BMI, eGFR, SBP, and DBP were 42.7 years, 23.4 kg/m2, 97.4, mL/min/1.73 m2, 121 mm Hg, and 78 mm Hg. The overall mean ECd/Ecr and mean ECd/Ccr were 2.77 µg/g creatinine and 0.0219 µg/L filtrate, respectively.
Given that Eβ2M and eGFR have been shown to be inversely related, participants were assigned to the normal eGFR group or the reduced eGFR group. The normal eGFR group included those with eGFR values ≥ 90 mL/min/1.73 m2, while the reduced eGFR group enlisted those with GFR values < 90 mL/min/1.73 m2.
The parameters showing male–female differences in both normal and reduced eGFR groups were % smokers (particularly high among males), age, BMI, and Cd exposure levels (assessed as ECd/Ecr, and ECd/Ccr). In comparison, % hypertension was higher in females (30.7) than males (22.4) in the normal eGFR group only. Similarly, % β2-microglobulinuria, based on both Ecr and Ccr normalized data, were more prevalent in males compared to females in the normal eGFR group only. In the reduced eGFR group, however, the % β2-microgloubinuria and hypertension in males were similarly high as in females.
The inverse relationship between eGFR and Eβ2M, were apparent also when participants were grouped according to the quartiles of β2-microglobulin excretion rate, assessed as Eβ2M/Ccr (Table 2).
The % of females, smokers, hypertension, and those with BMI values > 30 kg/m2 were similar across the Eβ2M/Ccr quartile groups. Mean BMI, mean SBP, and mean DBP were also similar across the Eβ2M/Ccr quartile groups. However, there were significant differences in % low eGFR, mean values for age, eGFR, ECd/Ecr, and ECd/Ccr across Eβ2M/Ccr quartile groups. Notably, the prevalence of low eGFR in the Eβ2M/Ccr quartiles were markedly different (p < 0.001). In the top Eβ2M/Ccr quartile, the prevalence of low eGFR was as high as 10.3%, and it was nil in the bottom quartile. The prevalence of low eGFR in the Eβ2M/Ccr quartiles 2 and 3 were 0.7% and 1.4%, respectively.

3.2. Determinants of Risks of Hypertension and β2-Microglobulinuria

Two logistic regression models were constructed to evaluate an effect of Cd exposure on the POR values for two adverse outcomes (Table 3).
The POR for hypertension was influenced by age, BMI, and ECd/Ccr, but not gender or smoking. Per every one year older, the POR for hypertension increased 5.9% (95% CI: 4.0, 7.8, p < 0.001). The respective POR values for hypertension rose 2.08-fold (95% CI: 1.442, 3.001, p < 0.001) and 3.34-fold (95% CI: 1.481, 7.543, p = 0.004) in those with a BMI of 24–30 and > 30 kg/m2, compared to a BMI < 24 kg/m2. Compared with the bottom quartile, respective POR values for hypertension rose 2.52-fold (95% CI: 1.465, 4.342, p = 0.001) and 2.79-fold (95% CI: 1.595, 4.871, p < 0.001) in the ECd/Ccr quartiles 3 and 2.
Among five independent variables tested, the POR for β2-microglobulinuria was affected markedly by Cd (ECd/Ccr). Compared with the bottom quartile of ECd/Ccr, the POR for β2-microglobulinuria in the top quartile rose 10.67-fold (95% CI: 1.364, 83.4, p = 0.024). However, the 6.98-fold (95% CI: 0.887, 54.93) increase in POR for β2-microglobulinuria in the ECd/Ccr quartile 3 was statistically significant (p = 0.065).
Scatterplots were constructed to visualize the correlations of SBP and DBP with a β2-microglobulin excretion rate only in the female gender (Figure 1).
Additional scatterplots (Figure 2) indicate the correlations of SBP and DBP with a β2-microglobulin excretion rate only in the reduced eGFR group.

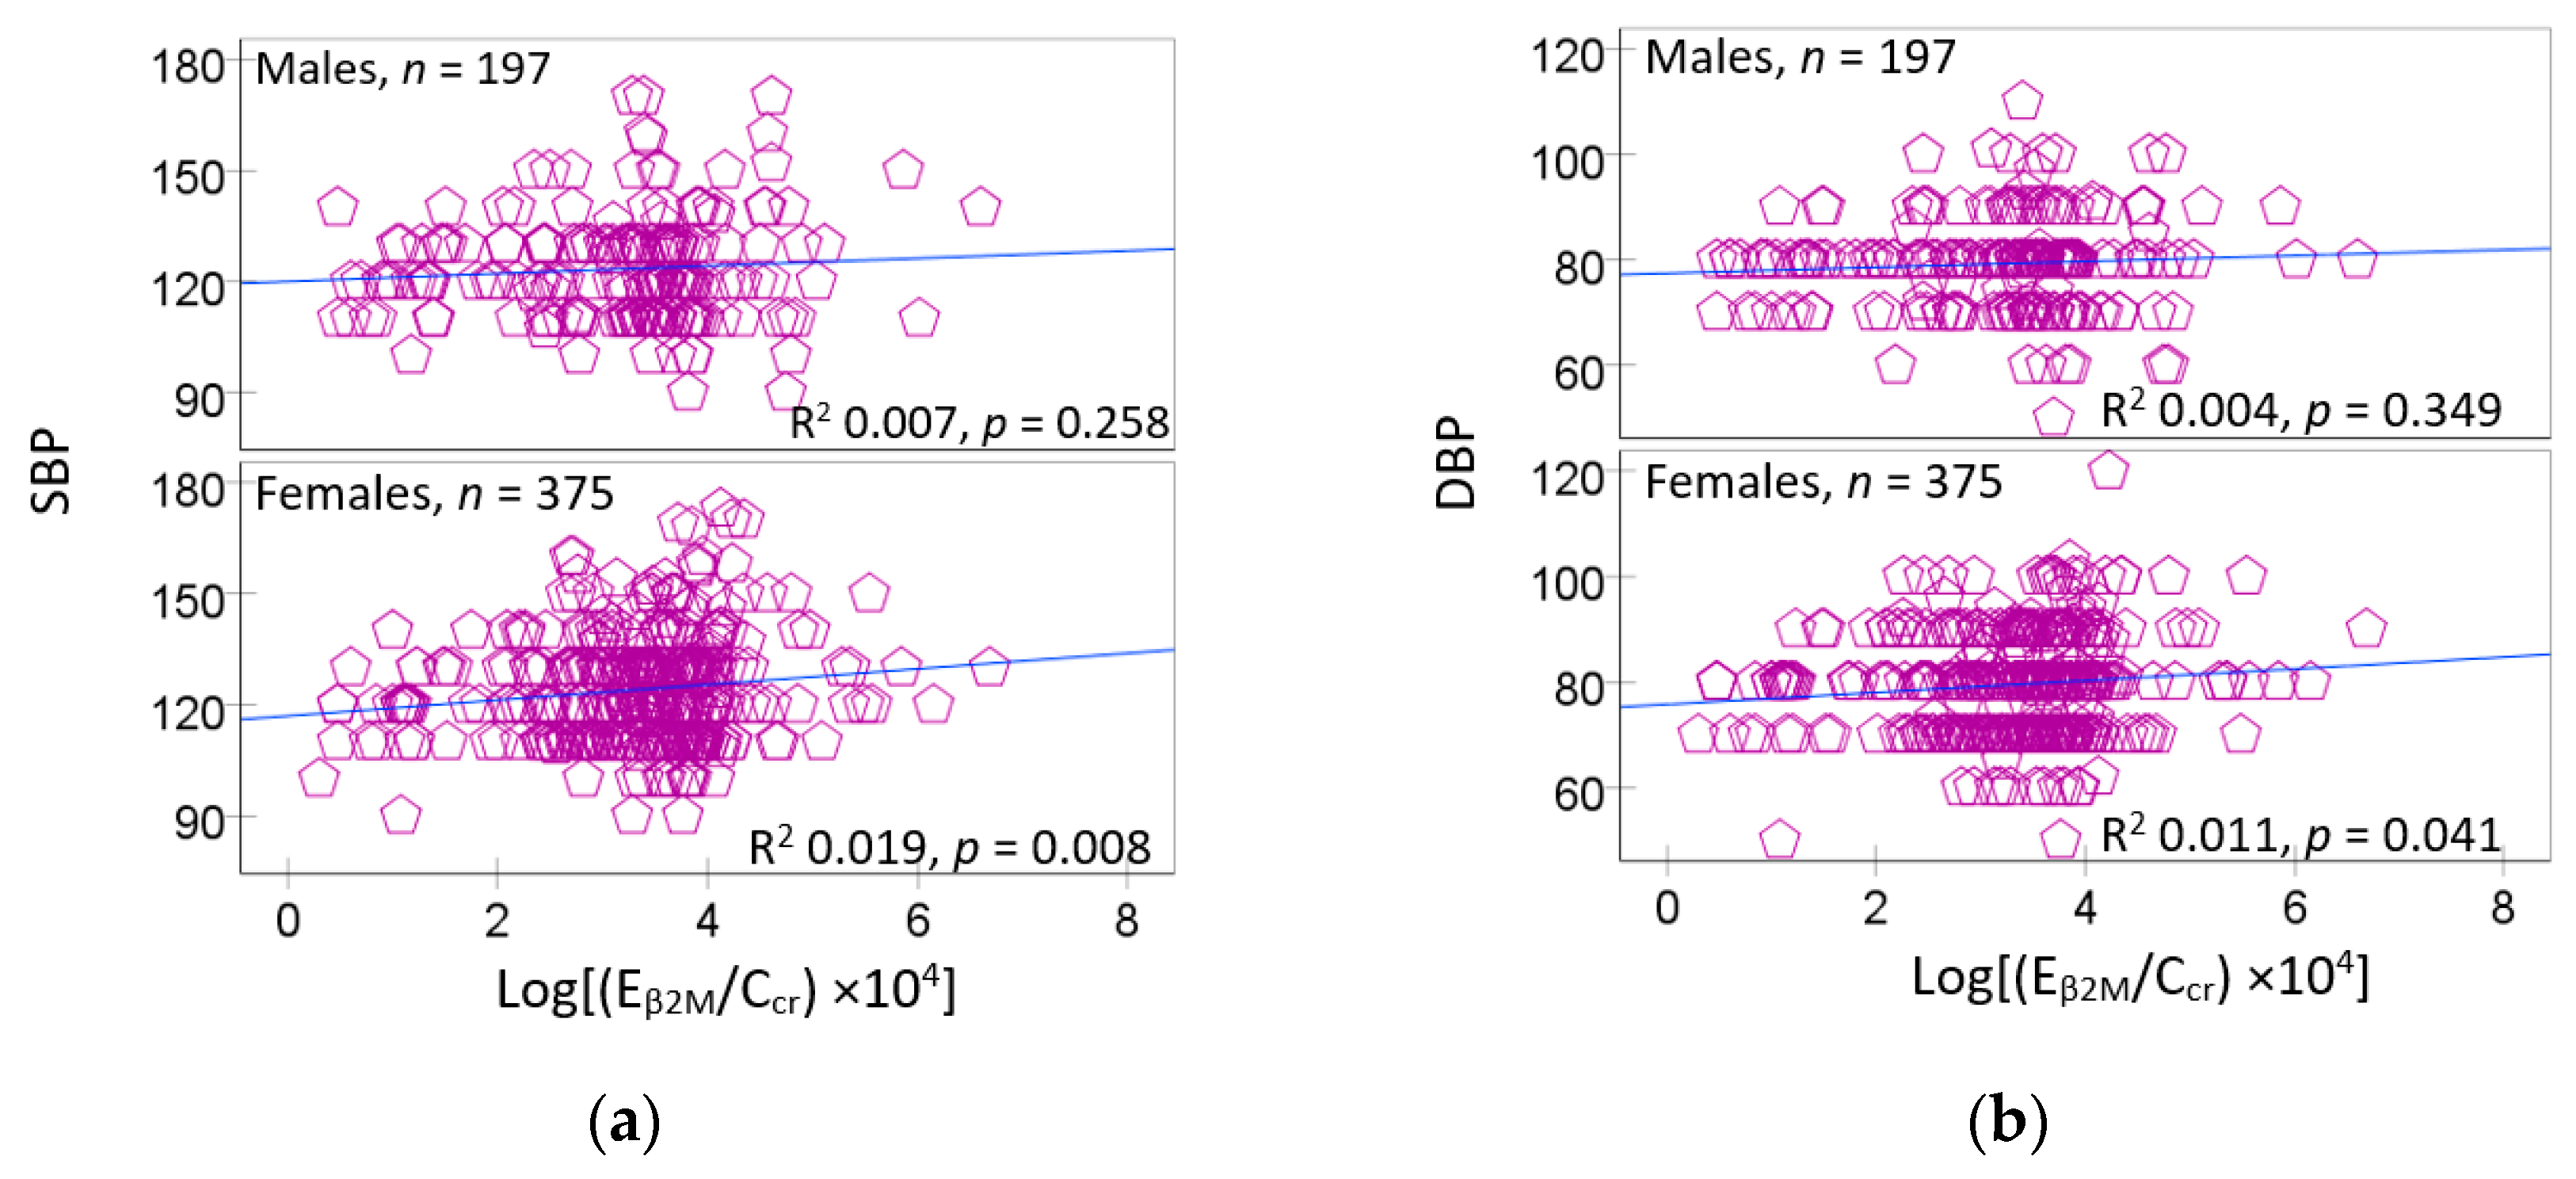
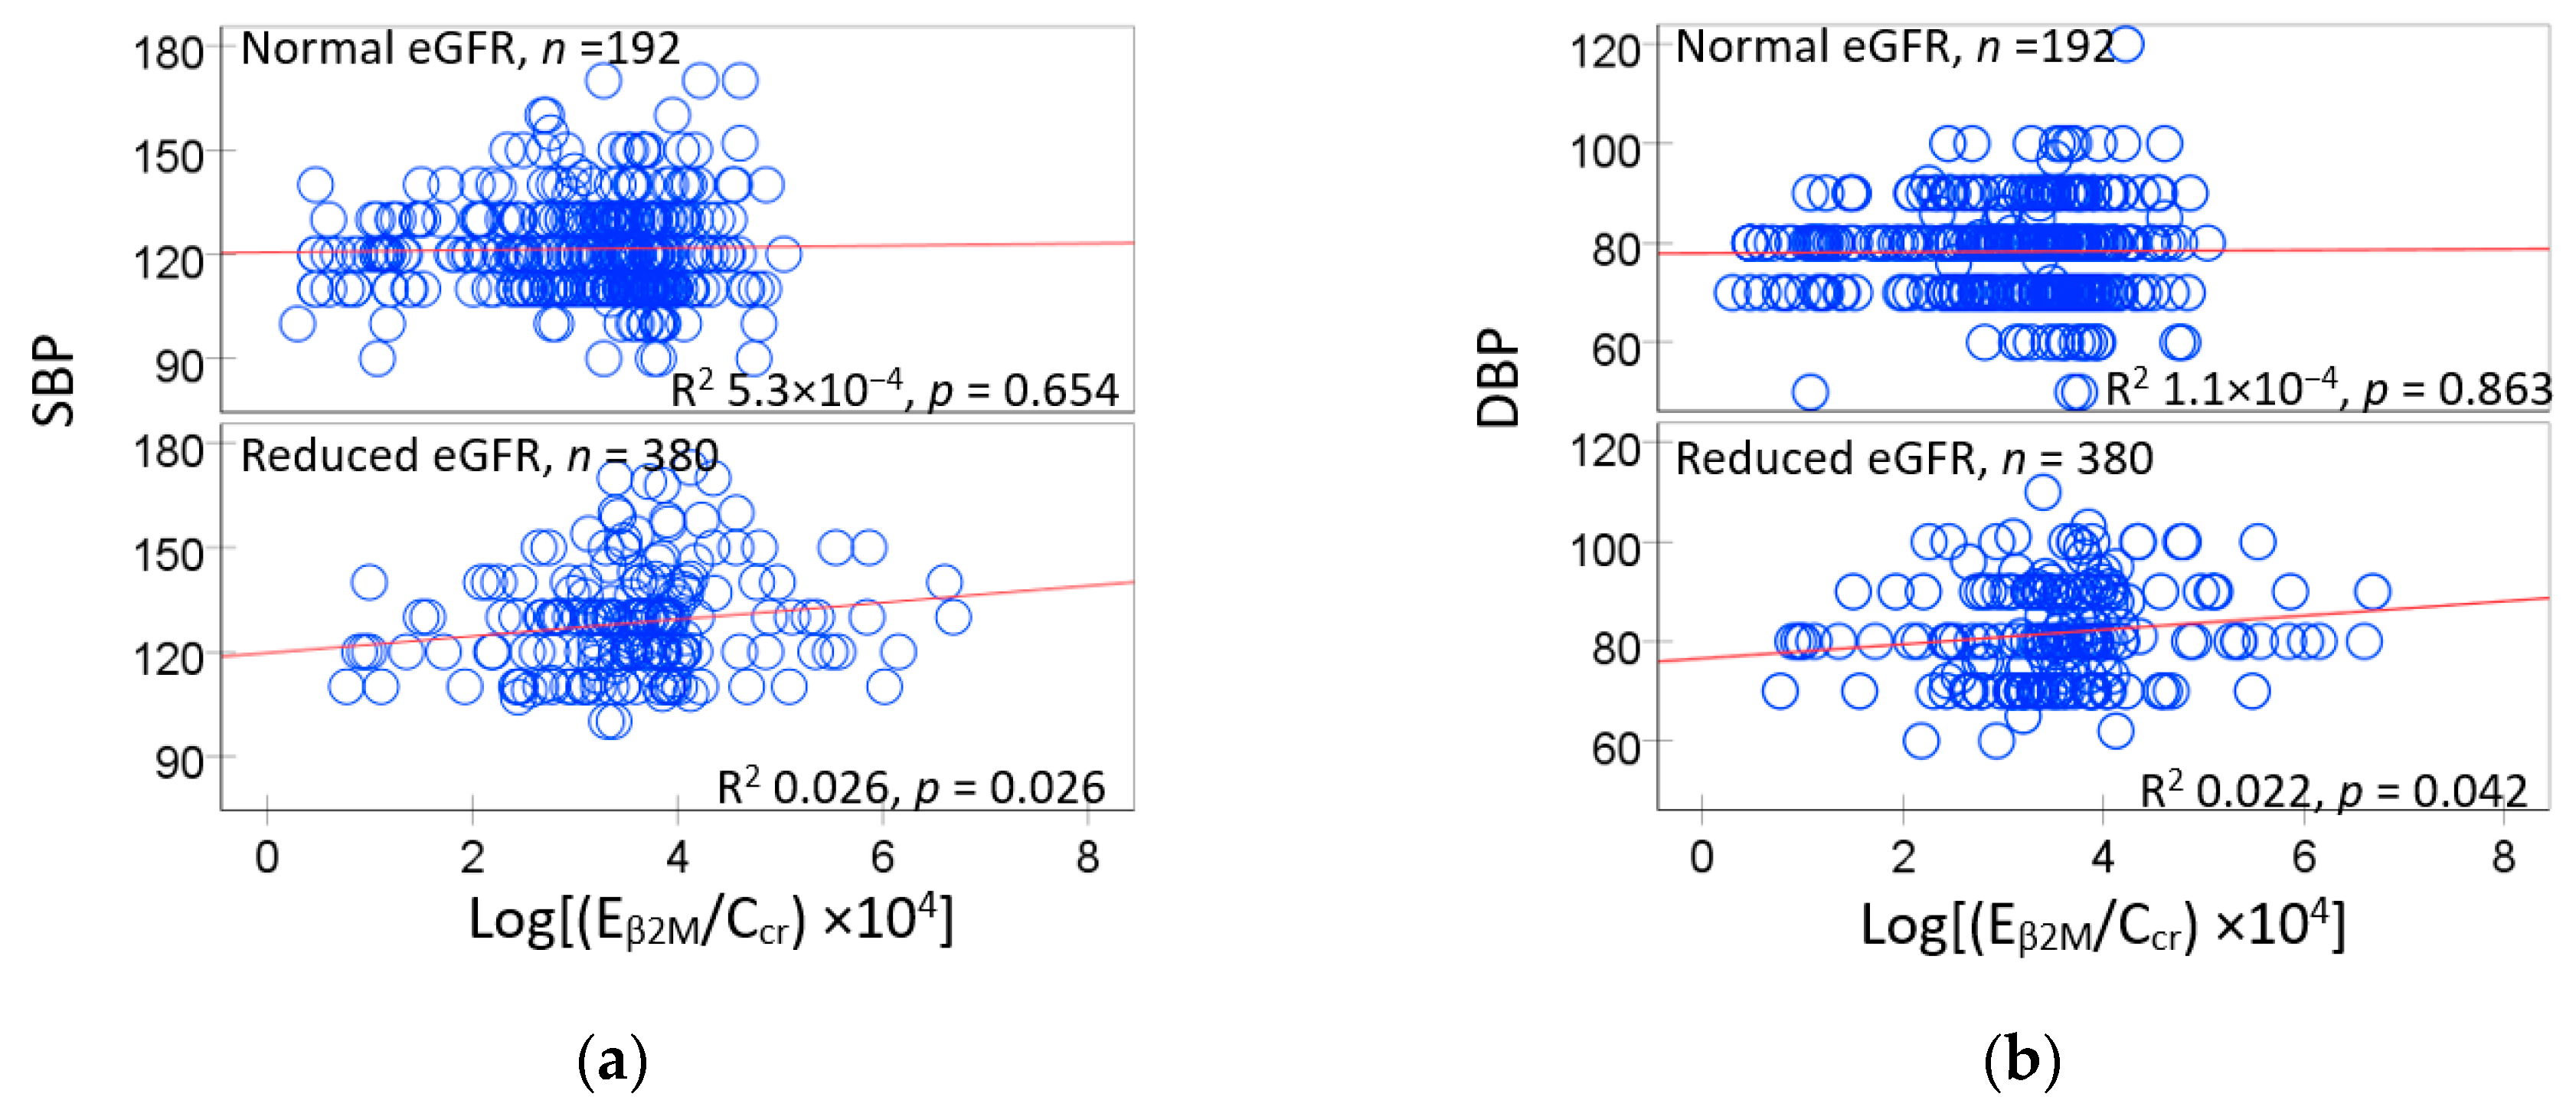
3.3. Urinary β2M Predicts Blood Pressure Elevation

In multiple linear regressions of SBP and DBP (Table 4), respective proportions of the SBP variation in all subjects, the normal eGFR group, and the reduced eGFR group that were related to a set of six independent variables (age, BMI, ECd/Ccr, Eβ2M/Ccr, smoking, and gender) were 14.5% (p < 0.001), 10.6% (p < 0.001), and 10.3% (p < 0.001). In comparison, the same set of independent variables explained only 5.4% (p < 0.001) and 5.3% (p < 0.001) of the DBP variation in all subjects and the normal eGFR group. The DBP variability among those with a reduced eGFR was minimally related to these variables.
Notably, however, the associations of Eβ2M/Ccr with SBP (β = 0.182, p = 0.013) and DBP (β = 0.192, p = 0.012) were found only in the reduced eGFR group. These results were in line with scatterplots in Figure 2.

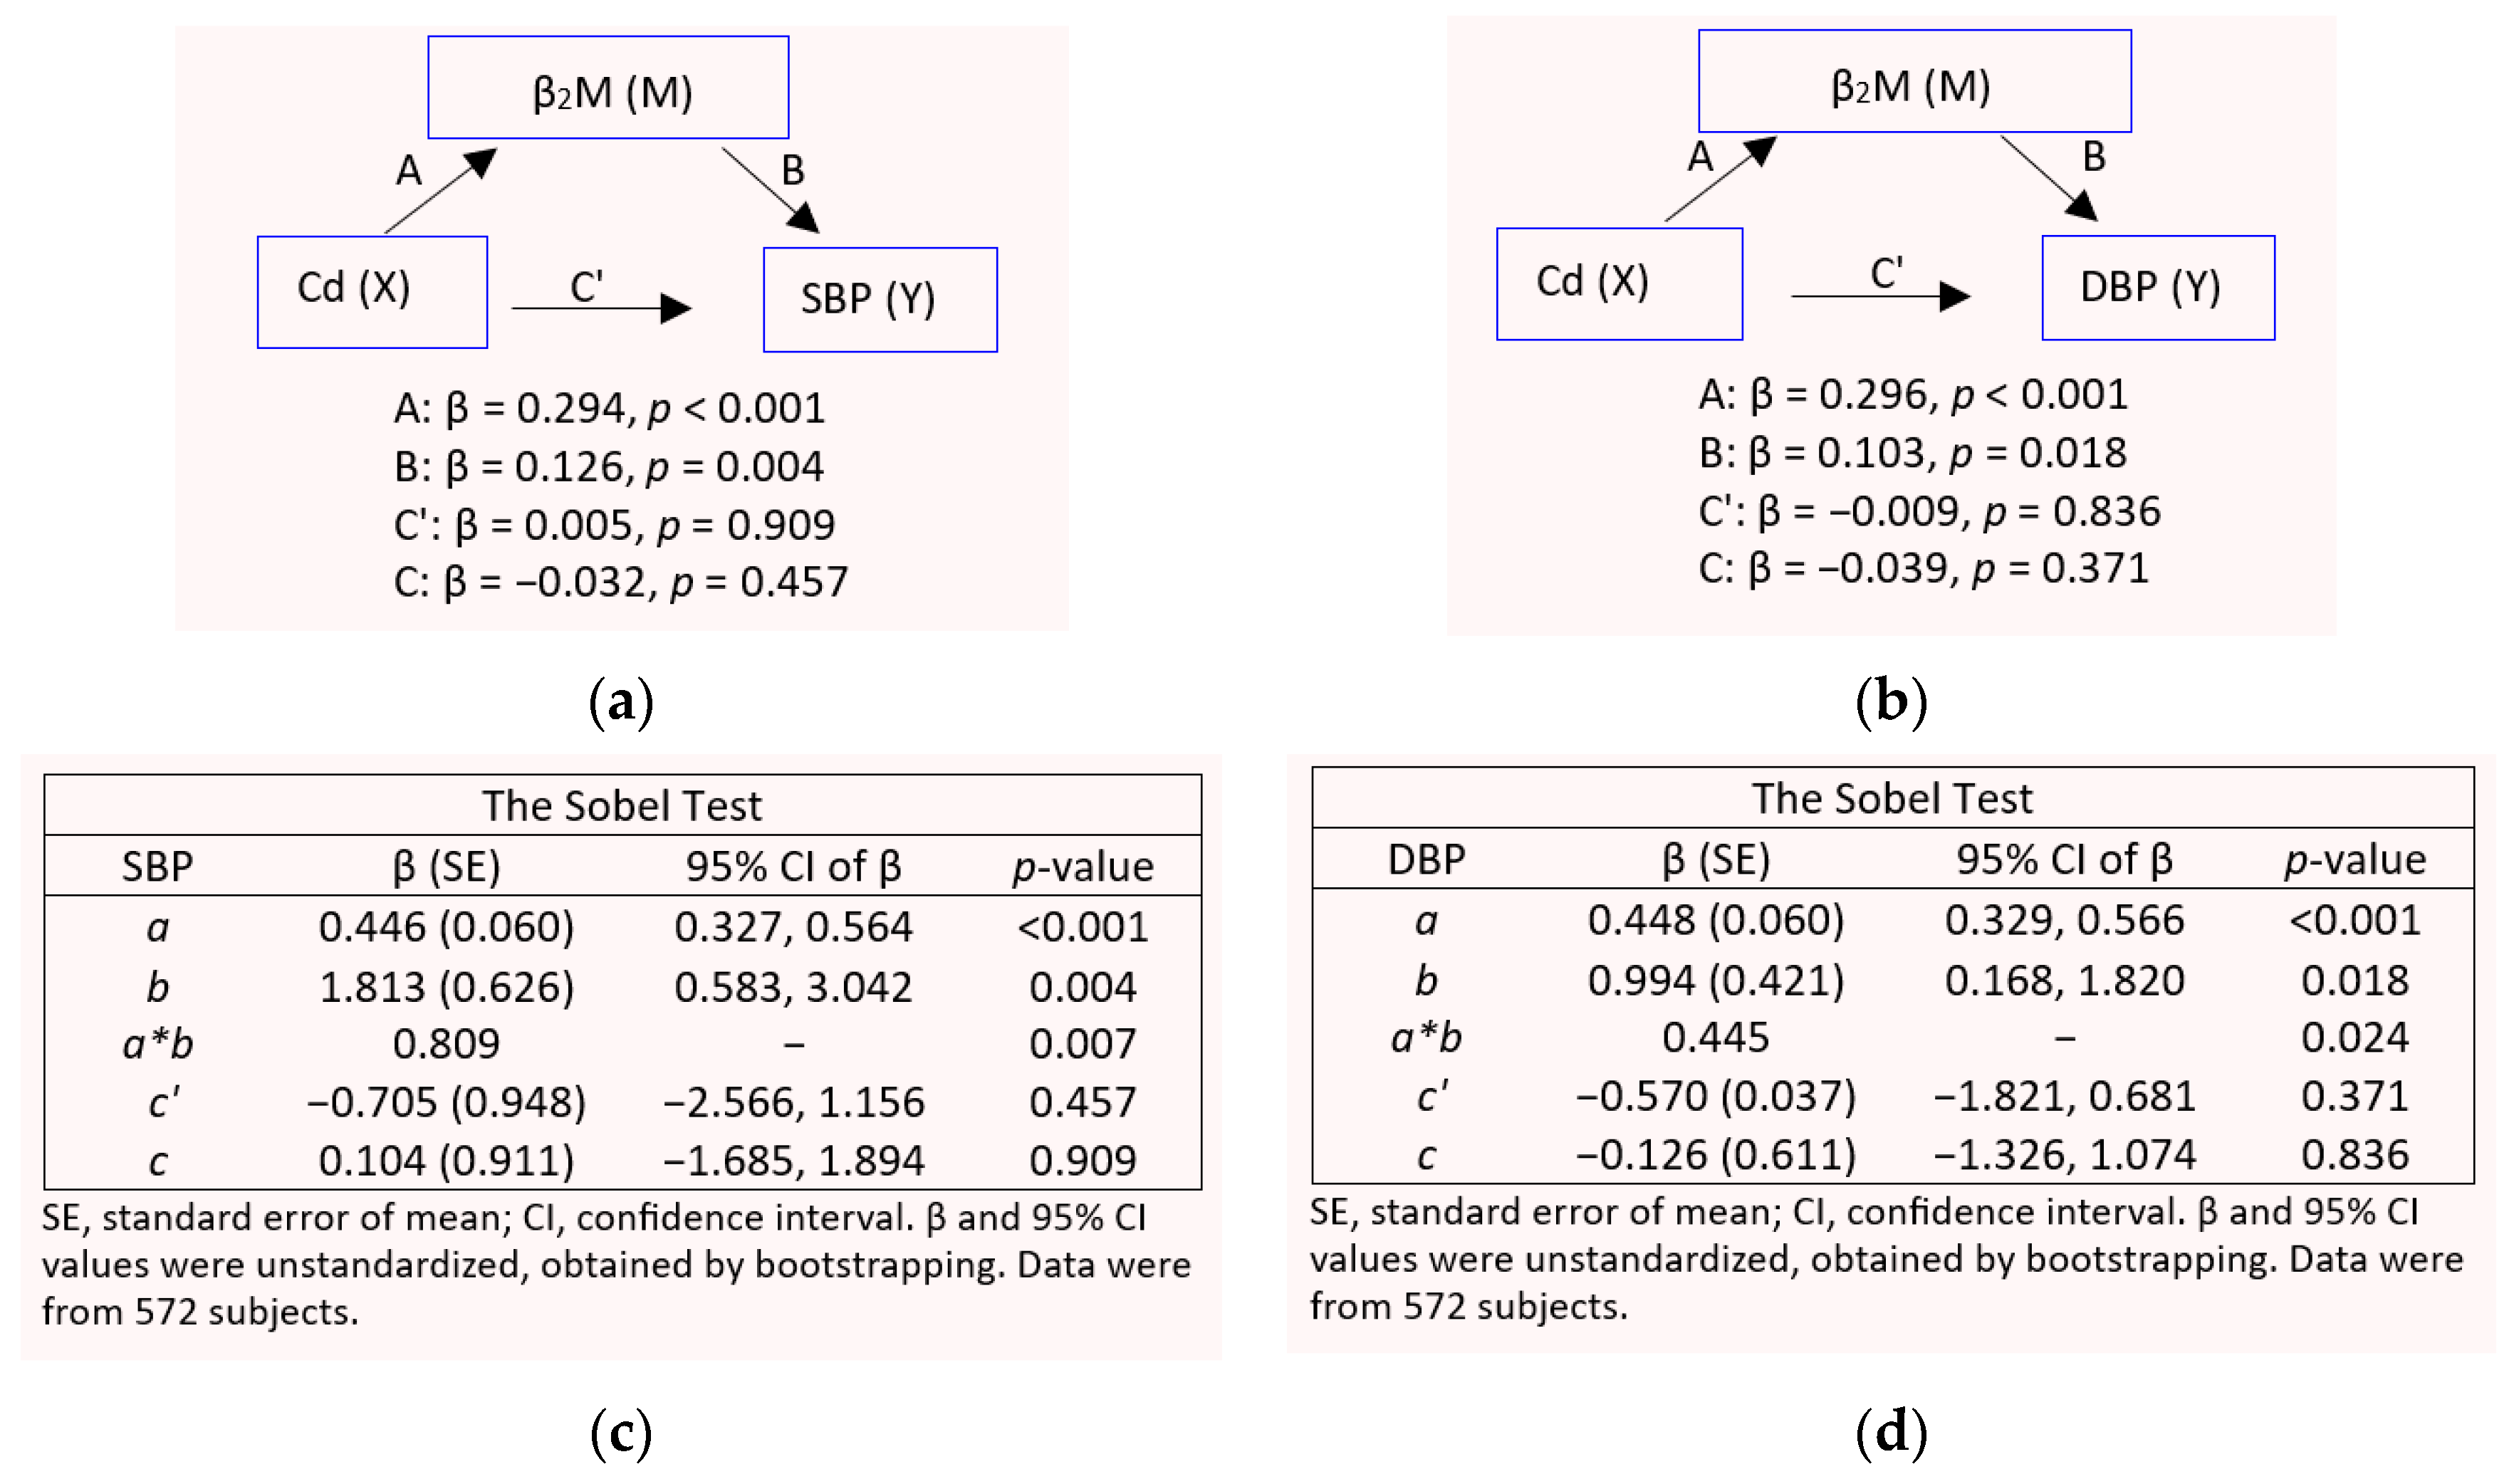
3.4. GFR and β2-Microglobulin as Mediators of Cd-Induced Blood Pressure Elevation

Figure 3 provides results of a simple mediation model that assessed whether eGFR mediated an effect of Cd on SBP and DBP.
In the SBP model (Figure 3), Cd had a direct effect on a mediator (eGFR) (β =−0.116, p < 0.001) as well a significant indirect effect on SBP (Sobel test p = 0.006) (Figure 3a,c). A fall of eGFR mediated the indirect effect of Cd on SBP. The proportion mediated by a declining eGFR, calculated from the equation (A*B/C’ + A*B), was 19%.
In the DBP model, Cd had a direct effect a mediator (eGFR) (β =−0.133, p < 0.001) as well an indirect effect (Sobel test p = 0.012) (Figure 3b,d). The indirect effect of Cd on DBP was also through a reduction in eGFR. Using the equation (A*B/C’ + A*B), the proportion of effect mediated through eGFR was 16%.
Mediating effects of Cd on SBP and DBP by β2M were assessed in Figure 4a and 4b, respectively. In the SBP model, Cd had a direct effect on a mediator (β2M) (β = 0.294, p < 0.001) (Figure 4a). The indirect effect of Cd on SBP was statistically significant (Sobel test p = 0.007) (Figure 4c). In the DBP model, Cd had a direct effect on a mediator (β2M) (β = 0.296, p < 0.001), as well as a significant indirect effect on SBP (Sobel test p = 0.024) (Figure 4b,d). The effects of Cd on SBP and DBP were mediated through β2M.

4. Discussion

This study analyzed data from 251 males and 438 females, aged 16–80 years, who did not have diabetes type 2. They were selected from a large cohort of apparently healthy Thais. The % females, smokers, obese subjects, hypertension, β2-microglubulinuria, and CKD (eGFR ≤ 60 mL/min/1.73 m2) were 63.4, 28.3, 4.9, 32.4, 7.3, and 2.6, respectively. Mean BMI, mean eGFR were 23.4 kg/m2, and 97.4 mL/min/1.73 m2, respectively. Age and BMI histograms of this study group conformed to a normal distribution. This group could thus be considered to represent a sample of the general population. The mean ECd/Ecr and mean ECd/Ccr were 2.77 µg/g creatinine and 0.0219 µg/L filtrate, respectively.
The environmental Cd exposure levels among cohort participants were comparable to those reported for non-occupationally exposed populations. It is well recognized that blood pressure levels and prevalence of hypertension in males and females are dissimilar [3,4,57,58,59]. The present study included 438 females and 251 males. A small number of males was a limitation because it precluded a definitive conclusion on an effect of Cd in men. A one-time-only assessment of Cd exposure and its effects was also its limitation.

4.1. Cd and Risks of Developing Hypertension and β2-Microglobulinuria

In line with previous studies [24,25,26,27], age, BMI, and Cd exposure were associated with an increased risk of having hypertension (Table 3). The risk of having hypertension rose 5.9% for every one-year older, and it was increased 3.3-fold in those with BMI > 30 kg/m2. There was a 2.5-fold increase in the risk of hypertension at (ECd/Ccr) × 100 value of 0.71 µg/L filtrate, corresponding to 0.68 µg/g creatinine. In comparison, however, neither age nor BMI influenced the risk of having tubular proteinuria. An increase in risk of having such proteinuria was statistically significant only in the top quartile of Cd exposure (ECd/Ccr) × 100 value of 2.74 µg/L filtrate, corresponding to 2.32 µg/g creatinine. These data suggest that β2-microglubulinuria occurred after hypertension development; a significant increase in risk of hypertension was observed at the exposure level producing ECd/Ecr of 0.68 µg/g creatinine, which was much lower than ECd/Ecr of 2.32 µg/g creatinine. Thus, blood pressure increase could be a sensitive biomarker for an early detection of an adverse effect of Cd on kidneys.

4.2. Effects of Cd on SBP/DBP and Tubular Function

In the SBP regression model, including all subjects (Table 4), SBP did not correlate with ECd or Eβ2M, but it was associated with age (β = 0.323), BMI (β = 0.188), and gender (β = 0.105). The DBP regression model showed similar correlative patterns, but the strengths of correlation were weaker, compared with SBP. In subgroup analysis, association of SBP with Eβ2M (β = 0.182) and DBP with Eβ2M (β = 0.192) were found only in the reduced eGFR group. These results were evident also from scatterplots in Figure 2. Similarly, a 10% increase in β2M excretion rate was found in participants of the SPRINT Trial (n = 2436) who had low eGFR and a 16 mm Hg higher SBP than mean SBP [60].
A mediated effect analysis (Figure 3) has revealed that respective SBP and DBP increases by 19% and 16% were mediated by a declining eGFR. This explained the presence of SBP/Eβ2M and DBP/Eβ2M correlations only in those with eGFR < 90 mL/min/1.73 m2. Previously, GFR loss was found to mediate the elevation of SBP and DBP in people exposed to relatively higher Cd doses than participants in the present study [34].
Interestingly, the effects of Cd exposure on SBP and DBP among participants in the present study appeared to be mediated by β2M (Figure 4). This mediating effect of β2M provided an explanation for the absence of SBP-ECd and DBP-ECd correlations in multiple regression analysis (Table 4). Further studies are warranted to examine the played by β2M in Cd-induced hypertension.
In a cross-sectional study on Japanese general population, an increased risk of hypertension was associated an elevated β2M excretion [61]. In a prospective cohort study on the Japanese population, a 79% increase in the risk of eGFR reduction of 10 mL/min/1.73 m2 within five years was found in cohort participants who had β2-microglobulinuria [62].

4.3. Gender Differences in Blood Pressure Variability and Cd Effects

In the descriptive characteristics of cohort participants (Table 1), % hypertension in the normal eGFR group was higher in females than males (30.7 vs. 22.4). In the reduced eGFR group, however, the % hypertension and % β2-microgloubinuria in males and females were similar.
Further evidence for gender differences in risk of hypertension was apparent from a multiple regression analysis (Table 4) where SBP, not DBP, was found to be associated with gender (β = 0.105) after adjustment for effects of other variables (age, BMI, smoking). The scatterplots in Figure 1 revealed significant SBP-Eβ2M and DBP-Eβ2M correlations in females.
The different effects of Cd on blood pressure in men and women have been noted in several studies. For example, 1.54-time and 2.38-time increases in hypertension risk were found in white and Mexican-American women, who had blood Cd as little as 0.4 µg/L, compared with black women, white, black, or Mexican-American men [26]. In a study from Taiwan, Cd-related kidney damage, evident from an elevated excretion rate of N-acetyl-β-D-glucosaminidase (NAG), was found in women only [63].
Previously, gender differentiated effects of Cd on blood pressure were attributable to circulating levels of sex hormones [64,65,66,67]. A rise in urinary Cd levels from <2 to ≥3 μg/g creatinine in postmenopausal Japanese women was associated with an elevation of serum testosterone by 28% [64]. Serum estradiol levels in postmenopausal Japanese and Swedish women showed an inverse association with urinary Cd excretion rates [65,66]. The Swiss Kidney Project on Genes in Hypertension observed a correlation between urinary Cd and testosterone excretion in men, while a trend for an association was found in women [67].
In general, hypertension occurs more frequently in men than premenopausal women of a similar age [3,4,57,58,59]. Clinical and experimental studies have attributed male preponderance hypertension to the eicosanoid, 20-hydroxyeicosatetraenoic acid (20-HETE), which mediates an effect of the androgen hormone on SBP and DBP levels [68,69,70,71]. Studies from Thailand support the role of 20-HETE in Cd-induced hypertension; an association of urinary 20-HETE and urinary Cd was found in women only, while urinary 20-HETE and SBP were associated with an increased albumin excretion in men [33].

4.4. Modifiable Risk by Other Metals

In addition to the influence of the sex hormone, potential roles of other metals, like zinc (Zn) and calcium (Ca), have been reported in humans [72] and experimental animals [73,74]. Given their similar electronegativity, Zn, in theory, can modulate the manifestation of nephrotoxicity of Cd. In a study from the U.S. (n = 9557), aged ≥ 18 years, there was a 2.79-fold increase in the risk of having CKD among those with blood Cd in quartile 4, compared to those with blood Cd in the quartile 1 [72]. Comparing low zinc and high Cd with high zinc plus high Cd and high zinc plus low Cd, there were 90% and 89% reductions in CKD risk, respectively.
An elevated systemic blood pressure and a decline in kidney function, measured by inulin clearance, were observed in rats fed with a diet containing Zn that was 40 times higher than that of a normal diet for 4 weeks [73]. Ca and Cd have similar ionic radii, and in theory, Ca can be expected to influence Cd-induced hypertension. Such an effect of Ca has been demonstrated experimentally [74].

5. Conclusions

Exposure to environmental Cd, producing a urinary Cd excretion rate of 0.68 µg/g creatinine, is associated with a 2.5-fold increase in risk of developing hypertension. The development of hypertension in Cd-exposed people is an outcome of rising SBP and DBP because of a decrease in eGFR induced by Cd. The increases in SBP and DBP by 16–19% are found to be causally related to a fall of eGFR. This eGFR loss occurs in advance of β2-microglobulinuria, given that an increased risk of having β2-microglobulinuria is observed at a urinary Cd excretion rate of 2.32 µg/g creatinine. There is evidence that β2M independently affects blood pressure.

Funding

This research received no external funding. It was supported by resources from the Centre for Kidney Disease Research, Translational Research Institute, the Department of Kidney and Transplant Services, Princess Alexandra Hospital.

Institutional Review Board Statement

This study analyzed the archived data, for which the ethical approval was obtained when the original study was approved. The study for this manuscript has been determined to be exempt under The Australian Code for the Responsible Conduct of Research, 2018 (the 2018 Code) [https://www.nhmrc.gov.au/about-us/publications/australian-code-responsible-conduct-research-2018] (accessed on 28 November 2024) by the University of Queensland Human Ethics Committee [https://research-support.uq.edu.au/resources-and-support/ethics-integrity-and-compliance/human-ethics/policies-and-legislation] (accessed on 28 November 2024).

Informed Consent Statement

Informed consent for participation was obtained by Chulalongkorn University Research Ethics Review for Research Involving Human and Walailak University Ethics Committee at the time of data collection. This study is a retrospective analysis using secondary data. As such, additional informed consent was not required.

Data Availability Statement

All data are contained within this article.

Acknowledgments

The author thanks the Commission of Higher Education, Thailand Ministry of Education, and the National Science and Technology Development Agency, and Thailand Ministry of Sciences and Technology for overseas travel grants through the Reverse Brain Drain Project.

Conflicts of Interest

The author declares no conflicts of interest.

References

  1. Unger, T.; Borghi, C.; Charchar, F.; Khan, N.A.; Poulter, N.R.; Prabhakaran, D.; Ramirez, A.; Schlaich, M.; Stergiou, G.S.; Tomaszewski, M.; et al. 2020 International Society of Hypertension Global Hypertension Practice Guidelines. Hypertension 2020, 75, 1334–1357. [Google Scholar] [PubMed]
  2. Murray, C.J.L.; Aravkin, A.Y.; Zheng, P.; Abbafati, C.; Abbas, K.M.; Abbasi-Kangevari, M.; Abd-Allah, F.; Abdelalim, A.; Abdollahi, M.; Abdollahpour, I.; et al. Global burden of 87 risk factors in 204 countries and territories, 1990–2019: A systematic analysis for the Global Burden of Disease Study 2019. Lancet 2020, 396, 1223–1249. [Google Scholar]
  3. Zhang, H.; Singal, P.K.; Ravandi, A.; Rabinovich-Nikitin, I. Sex-Specific Differences in the Pathophysiology of Hypertension. Biomolecules 2025, 15, 143. [Google Scholar] [CrossRef]
  4. Chapman, N.; Ching, S.M.; Konradi, A.O.; Nuyt, A.M.; Khan, T.; Twumasi-Ankrah, B.; Cho, E.J.; Schutte, A.E.; Touyz, R.M.; Steckelings, U.M.; et al. Arterial Hypertension in Women: State of the Art and Knowledge Gaps. Hypertension 2023, 80, 1140–1149. [Google Scholar]
  5. Kim, H.L.; Lee, E.M.; Ahn, S.Y.; Kim, K.I.; Kim, H.C.; Kim, J.H.; Lee, H.Y.; Lee, J.H.; Park, J.M.; Cho, E.J.; et al. The 2022 focused update of the 2018 Korean Hypertension Society Guidelines for the management of hypertension. Clin. Hypertens. 2023, 29, 11. [Google Scholar] [CrossRef]
  6. Satarug, S.; Vesey, D.A.; Gobe, G.C.; Phelps, K.R. Estimation of health risks associated with dietary cadmium exposure. Arch. Toxicol. 2023, 97, 329–358. [Google Scholar] [PubMed]
  7. Fechner, C.; Hackethal, C.; Höpfner, T.; Dietrich, J.; Bloch, D.; Lindtner, O.; Sarvan, I. Results of the BfR MEAL Study: In Germany, mercury is mostly contained in fish and seafood while cadmium, lead, and nickel are present in a broad spectrum of foods. Food Chem. X 2022, 14, 100326. [Google Scholar]
  8. Watanabe, T.; Kataoka, Y.; Hayashi, K.; Matsuda, R.; Uneyama, C. Dietary exposure of the Japanese general population to elements: Total diet study 2013–2018. Food Saf. 2022, 10, 83–101. [Google Scholar]
  9. Hill, D.T.; Jandev, V.; Petroni, M.; Atallah-Yunes, N.; Bendinskas, K.; Brann, L.S.; Heffernan, K.; Larsen, D.A.; MacKenzie, J.A.; Palmer, C.D.; et al. Airborne levels of cadmium are correlated with urinary cadmium concentrations among young children living in the New York state city of Syracuse, USA. Environ. Res. 2023, 223, 115450. [Google Scholar]
  10. Almerud, P.; Zamaratskaia, G.; Lindroos, A.K.; Bjermo, H.; Andersson, E.M.; Lundh, T.; Ankarberg, E.H.; Lignell, S. Cadmium, total mercury, and lead in blood and associations with diet, sociodemographic factors, and smoking in Swedish adolescents. Environ. Res. 2021, 197, 110991. [Google Scholar]
  11. Pappas, R.S.; Fresquez, M.R.; Watson, C.H. Cigarette smoke cadmium breakthrough from traditional filters: Implications for exposure. J. Anal. Toxicol. 2015, 39, 45–51. [Google Scholar] [CrossRef] [PubMed]
  12. Thévenod, F.; Herbrechter, R.; Schlabs, C.; Pethe, A.; Lee, W.K.; Wolff, N.A.; Roussa, E. Role of the SLC22A17/lipocalin-2 receptor in renal endocytosis of proteins/metalloproteins: A focus on iron- and cadmium-binding proteins. Am. J. Physiol. Ren. Physiol. 2023, 325, F564–F577. [Google Scholar]
  13. Thévenod, F.; Lee, W.K.; Garrick, M.D. Iron and Cadmium Entry Into Renal Mitochondria: Physiological and Toxicological Implications. Front. Cell Dev. Biol. 2020, 8, 848. [Google Scholar] [CrossRef]
  14. Wei, Y.; Wang, X.; Sun, Q.; Shi, W.; Zhang, W.; Gao, X.; Li, Y.; Hao, R.; Dong, X.; Chen, C.; et al. Associations of environmental cadmium exposure with kidney damage: Exploring mediating DNA methylation sites in Chinese adults. Environ. Res. 2024, 251 Pt 1, 118667. [Google Scholar]
  15. Sakuma, S.; Nogawa, K.; Watanabe, Y.; Sakurai, M.; Nishijo, M.; Ishizaki, M.; Morikawa, Y.; Kido, T.; Nakagawa, H.; Suwazono, Y. Effect of renal tubular damage on non-cancer mortality in the general Japanese population living in cadmium non-polluted areas. J. Appl. Toxicol. 2023, 43, 1849–1858. [Google Scholar] [CrossRef] [PubMed]
  16. Smereczański, N.M.; Brzóska, M.M. Current levels of environmental exposure to cadmium in industrialized countries as a risk factor for kidney damage in the general population: A comprehensive review of available data. Int. J. Mol. Sci. 2023, 24, 8413. [Google Scholar] [CrossRef]
  17. Aramjoo, H.; Arab-Zozani, M.; Feyzi, A.; Naghizadeh, A.; Aschner, M.; Naimabadi, A.; Farkhondeh, T.; Samarghandian, S. The association between environmental cadmium exposure, blood pressure, and hypertension: A systematic review and meta-analysis. Environ. Sci. Pollut. Res. Int. 2022, 29, 35682–35706. [Google Scholar]
  18. Martins, A.C.; Almeida Lopes, A.C.B.; Urbano, M.R.; Carvalho, M.F.H.; Silva, A.M.R.; Tinkov, A.A.; Aschner, M.; Mesas, A.E.; Silbergeld, E.K.; Paoliello, M.M.B. An updated systematic review on the association between Cd exposure, blood pressure and hypertension. Ecotoxicol. Environ. Saf. 2021, 208, 111636. [Google Scholar]
  19. Verzelloni, P.; Giuliano, V.; Wise, L.A.; Urbano, T.; Baraldi, C.; Vinceti, M.; Filippini, T. Cadmium exposure and risk of hypertension: A systematic review and dose-response meta-analysis. Environ. Res. 2024, 263, 120014. [Google Scholar]
  20. Doccioli, C.; Sera, F.; Francavilla, A.; Cupisti, A.; Biggeri, A. Association of cadmium environmental exposure with chronic kidney disease: A systematic review and meta-analysis. Sci. Total Environ. 2024, 906, 167165. [Google Scholar]
  21. Akinleye, A.; Oremade, O.; Xu, X. Exposure to low levels of heavy metals and chronic kidney disease in the US population: A cross sectional study. PLoS ONE 2024, 19, e0288190. [Google Scholar]
  22. Satarug, S.; Đorđević, A.B.; Yimthiang, S.; Vesey, D.A.; Gobe, G.C. The NOAEL Equivalent of Environmental Cadmium Exposure Associated with GFR Reduction and Chronic Kidney Disease. Toxics 2022, 10, 614. [Google Scholar] [CrossRef] [PubMed]
  23. Zhang, J.; Wang, X.; Ma, Z.; Dang, Y.; Yang, Y.; Cao, S.; Ouyang, C.; Shi, X.; Pan, J.; Hu, X. Associations of urinary and blood cadmium concentrations with all-cause mortality in US adults with chronic kidney disease: A prospective cohort study. Environ. Sci. Pollut. Res. Int. 2023, 30, 61659–61671. [Google Scholar] [PubMed]
  24. Oliver-Williams, C.; Howard, A.G.; Navas-Acien, A.; Howard, B.V.; Tellez-Plaza, M.; Franceschini, N. Cadmium body burden, hypertension, and changes in blood pressure over time: Results from a prospective cohort study in American Indians. J. Am. Soc. Hypertens. 2018, 12, 426–437.e9. [Google Scholar] [CrossRef]
  25. Tellez-Plaza, M.; Navas-Acien, A.; Crainiceanu, C.M.; Guallar, E. Cadmium exposure and hypertension in the 1999–2004 National Health and Nutrition Examination Survey (NHANES). Environ. Health Perspect. 2008, 116, 51–56. [Google Scholar] [PubMed]
  26. Scinicariello, F.; Abadin, H.G.; Murray, H.E. Association of low-level blood lead and blood pressure in NHANES 1999–2006. Environ. Res. 2011, 111, 1249–1257. [Google Scholar]
  27. Garner, R.E.; Levallois, P. Associations between cadmium levels in blood and urine, blood pressure and hypertension among Canadian adults. Environ. Res. 2017, 155, 64–72. [Google Scholar]
  28. Zhong, Q.; Wu, H.B.; Niu, Q.S.; Jia, P.P.; Qin, Q.R.; Wang, X.D.; He, J.L.; Yang, W.J.; Huang, F. Exposure to multiple metals and the risk of hypertension in adults: A prospective cohort study in a local area on the Yangtze River, China. Environ. Int. 2021, 153, 106538. [Google Scholar]
  29. Wu, W.; Liu, D.; Jiang, S.; Zhang, K.; Zhou, H.; Lu, Q. Polymorphisms in gene MMP-2 modify the association of cadmium exposure with hypertension risk. Environ. Int. 2019, 124, 441–447. [Google Scholar]
  30. Lee, B.K.; Kim, Y. Association of blood cadmium with hypertension in the Korean general population: Analysis of the 2008–2010 Korean National Health and Nutrition Examination Survey data. Am. J. Ind. Med. 2012, 55, 1060–1067. [Google Scholar]
  31. Kwon, J.A.; Park, E.; Kim, S.; Kim, B. Influence of serum ferritin combined with blood cadmium concentrations on blood pressure and hypertension: From the Korean National Health and Nutrition Examination Survey. Chemosphere 2022, 288, 132469. [Google Scholar] [CrossRef] [PubMed]
  32. Kaneda, M.; Wai, K.M.; Kanda, A.; Ando, M.; Murashita, K.; Nakaji, S.; Ihara, K. Low Level of Serum Cadmium in Relation to Blood Pressures Among Japanese General Population. Biol. Trace Elem. Res. 2022, 200, 67–75. [Google Scholar] [CrossRef]
  33. Boonprasert, K.; Vesey, D.A.; Gobe, G.C.; Ruenweerayut, R.; Johnson, D.W.; Na-Bangchang, K.; Satarug, S. Is renal tubular cadmium toxicity clinically relevant? Clin. Kidney J. 2018, 11, 681–687. [Google Scholar] [CrossRef] [PubMed]
  34. Satarug, S.; Vesey, D.A.; Yimthiang, S.; Khamphaya, T.; Pouyfung, P.; Đorđević, A.B. Environmental Cadmium Exposure Induces an Increase in Systolic Blood Pressure by Its Effect on GFR. Stresses 2024, 4, 436–451. [Google Scholar] [CrossRef]
  35. Argyropoulos, C.P.; Chen, S.S.; Ng, Y.-H.; Roumelioti, M.-E.; Shaffi, K.; Singh, P.P.; Tzamaloukas, A.H. Rediscovering Beta-2 Microglobulin As a Biomarker across the Spectrum of Kidney Diseases. Front. Med. 2017, 4, 73. [Google Scholar]
  36. Sivanathan, P.C.; Ooi, K.S.; Mohammad Haniff, M.A.S.; Ahmadipour, M.; Dee, C.F.; Mokhtar, N.M.; Hamzah, A.A.; Chang, E.Y. Lifting the Veil: Characteristics, Clinical Significance, and Application of β-2-Microglobulin as Biomarkers and Its Detection with Biosensors. ACS Biomater. Sci. Eng. 2022, 8, 3142–3161. [Google Scholar] [CrossRef]
  37. Hayashi, T.; Nogawa, K.; Watanabe, Y.; Kido, T.; Sakurai, M.; Nakagawa, H.; Suwazono, Y. Benchmark Dose of Urinary Cadmium for Assessing Renal Tubular and Glomerular Function in a Cadmium-Polluted Area of Japan. Toxics 2024, 12, 836. [Google Scholar] [CrossRef]
  38. Huan, T.; Meng, Q.; Saleh, M.A.; Norlander, A.E.; Joehanes, R.; Zhu, J.; Chen, B.H.; Zhang, B.; Johnson, A.D.; Ying, S.; et al. Integrative network analysis reveals molecular mechanisms of blood pressure regulation. Mol. Syst. Biol. 2015, 11, 799. [Google Scholar] [CrossRef]
  39. Alexander, M.R.; Hank, S.; Dale, B.L.; Himmel, L.; Zhong, X.; Smart, C.D.; Fehrenbach, D.J.; Chen, Y.; Prabakaran, N.; Tirado, B.; et al. A single nucleotide polymorphism in SH2B3/LNK promotes hypertension development and renal damage. Circ. Res. 2022, 131, 731–747. [Google Scholar] [CrossRef]
  40. Keefe, J.A.; Hwang, S.J.; Huan, T.; Mendelson, M.; Yao, C.; Courchesne, P.; Saleh, M.A.; Madhur, M.S.; Levy, D. Evidence for a causal role of the SH2B3-β2M axis in blood pressure regulation. Hypertension 2019, 73, 497–503. [Google Scholar] [CrossRef]
  41. Satarug, S.; Swaddiwudhipong, W.; Ruangyuttikarn, W.; Nishijo, M.; Ruiz, P. Modeling cadmium exposures in low- and high-exposure areas in Thailand. Environ. Health Perspect. 2013, 121, 531–536. [Google Scholar] [PubMed]
  42. Yimthiang, S.; Pouyfung, P.; Khamphaya, T.; Kuraeiad, S.; Wongrith, P.; Vesey, D.A.; Gobe, G.C.; Satarug, S. Effects of Environmental Exposure to Cadmium and Lead on the Risks of Diabetes and Kidney Dysfunction. Int. J. Environ. Res. Public Health 2022, 19, 2259. [Google Scholar] [CrossRef] [PubMed]
  43. Levey, A.S.; Stevens, L.A.; Scmid, C.H.; Zhang, Y.; Castro, A.F., III; Feldman, H.I.; Kusek, J.W.; Eggers, P.; Van Lente, F.; Greene, T.; et al. A new equation to estimate glomerular filtration rate. Ann. Intern. Med. 2009, 150, 604–612. [Google Scholar] [PubMed]
  44. White, C.A.; Allen, C.M.; Akbari, A.; Collier, C.P.; Holland, D.C.; Day, A.G.; Knoll, G.A. Comparison of the new and traditional CKD-EPI GFR estimation equations with urinary inulin clearance: A study of equation performance. Clin. Chim. Acta 2019, 488, 189–195. [Google Scholar]
  45. Levey, A.S.; Becker, C.; Inker, L.A. Glomerular filtration rate and albuminuria for detection and staging of acute and chronic kidney disease in adults: A systematic review. JAMA 2015, 313, 837–846. [Google Scholar]
  46. Bonness, R.W.; Taussky, M.H. On the colorimetric determination of creatinine by the Jaffe reaction. J. Biol. Chem. 1945, 158, 581–591. [Google Scholar]
  47. Apple, F.; Bandt, C.; Prosch, A.; Erlandson, G.; Holmstrom, V.; Scholen, J.; Googins, M. Creatinine clearance: Enzymatic vs Jaffé determinations of creatinine in plasma and urine. Clin. Chem. 1986, 32, 388–390. [Google Scholar] [CrossRef]
  48. Bernard, A.M.; Vyskocil, A.; Lauwerys, R.R. Determination of beta 2-microglobulin in human urine and serum by latex immunoassay. Clin. Chem. 1981, 27, 832–837. [Google Scholar]
  49. Trzcinka-Ochocka, M.; Brodzka, R.; Janasik, B. Useful and Fast Method for Blood Lead and Cadmium Determination Using ICP-MS and GF-AAS; Validation Parameters. J. Clin. Lab. Anal. 2016, 30, 130–139. [Google Scholar]
  50. Hornung, R.W.; Reed, L.D. Estimation of average concentration in the presence of nondetectable values. Appl. Occup. Environ. Hyg. 1990, 5, 46–51. [Google Scholar]
  51. Phelps, K.R.; Gosmanova, E.O. A generic method for analysis of plasma concentrations. Clin. Nephrol. 2020, 94, 43–49. [Google Scholar] [PubMed]
  52. Satarug, S.; Vesey, D.A.; Gobe, G.C. Cadmium-Induced Proteinuria: Mechanistic Insights from Dose–Effect Analyses. Int. J. Mol. Sci. 2023, 24, 1893. [Google Scholar] [CrossRef] [PubMed]
  53. Grandjean, P.; Budtz-Jørgensen, E. Total imprecision of exposure biomarkers: Implications for calculating exposure limits. Am. J. Ind. Med. 2007, 50, 712–719. [Google Scholar]
  54. Preacher, K.J. Advances in mediation analysis: A survey and synthesis of new developments. Annu. Rev. Psychol. 2015, 66, 825–852. [Google Scholar] [PubMed]
  55. MacKinnon, D.P.; Warsi, G.; Dwyer, J.H. A simulation study of mediated effect measures. Multiv. Behav. Res. 1995, 30, 41–62. [Google Scholar]
  56. Preacher, K.J.; Hayes, A.F. SPSS and SAS procedures for estimating indirect effects in simple mediation models. Behav. Res. Meth. Instrum. Comput. 2004, 36, 717–731. [Google Scholar]
  57. Reckelhoff, J.F. Gender differences in the regulation of blood pressure. Hypertension 2001, 37, 1199–1208. [Google Scholar]
  58. Reckelhoff, J.F. Mechanisms of sex and gender differences in hypertension. J. Hum. Hypertens. 2023, 37, 596–601. [Google Scholar]
  59. Connelly, P.J.; Currie, G.; Delles, C. Sex differences in the prevalence, outcomes and management of hypertension. Curr. Hypertens. Rep. 2022, 24, 185–192. [Google Scholar]
  60. Ikeme, J.C.; Katz, R.; Muiru, A.N.; Estrella, M.M.; Scherzer, R.; Garimella, P.S.; Hallan, S.I.; Peralta, C.A.; Ix, J.H.; Shlipak, M.G. Clinical Risk Factors For Kidney Tubule Biomarker Abnormalities Among Hypertensive Adults With Reduced eGFR in the SPRINT Trial. Am. J. Hypertens. 2022, 35, 1006–1013. [Google Scholar]
  61. Mashima, Y.; Konta, T.; Kudo, K.; Takasaki, S.; Ichikawa, K.; Suzuki, K.; Shibata, Y.; Watanabe, T.; Kato, T.; Kawata, S.; et al. Increases in urinary albumin and beta2-microglobulin are independently associated with blood pressure in the Japanese general population: The Takahata Study. Hypertens. Res. 2011, 34, 831–835. [Google Scholar] [CrossRef]
  62. Kudo, K.; Konta, T.; Mashima, Y.; Ichikawa, K.; Takasaki, S.; Ikeda, A.; Hoshikawa, M.; Suzuki, K.; Shibata, Y.; Watanabe, T.; et al. The association between renal tubular damage and rapid renal deterioration in the Japanese population: The Takahata study. Clin. Exp. Nephrol. 2011, 15, 235–241. [Google Scholar] [CrossRef] [PubMed]
  63. Liao, K.W.; Chien, L.C.; Chen, Y.C.; Kao, H.C. Sex-specific differences in early renal impairment associated with arsenic, lead, and cadmium exposure among young adults in Taiwan. Environ. Sci. Pollut. Res. Int. 2022, 29, 52655–52664. [Google Scholar] [CrossRef] [PubMed]
  64. Nagata, C.; Nagao, Y.; Shibuya, C.; Kashiki, Y.; Shimizu, H. Urinary cadmium and serum levels of estrogens and androgens in postmenopausal Japanese women. Cancer Epidemiol. Biomark. Prev. 2005, 14, 705–708. [Google Scholar] [CrossRef] [PubMed]
  65. Nagata, C.; Konishi, K.; Goto, Y.; Tamura, T.; Wada, K.; Hayashi, M.; Takeda, N.; Yasuda, K. Associations of urinary cadmium with circulating sex hormone levels in pre- and postmenopausal Japanese women. Environ. Res. 2016, 150, 82–87. [Google Scholar] [CrossRef]
  66. Ali, I.; Engström, A.; Vahter, M.; Skerfving, S.; Lundh, T.; Lidfeldt, J.; Samsioe, G.; Halldin, K.; Åkesson, A. Associations between cadmium exposure and circulating levels of sex hormones in postmenopausal women. Environ. Res. 2014, 134, 265–269. [Google Scholar] [CrossRef]
  67. Bochud, M.; Jenny-Burri, J.; Pruijm, M.; Ponte, B.; Guessous, I.; Ehret, G.; Petrovic, D.; Dudler, V.; Haldimann, M.; Escher, G.; et al. Urinary Cadmium Excretion Is Associated with Increased Synthesis of Cortico- and Sex Steroids in a Population Study. J. Clin. Endocrinol. Metab. 2018, 103, 748–758. [Google Scholar] [CrossRef]
  68. Roman, R.J. 20-HETE and Hypertension. Hypertension 2024, 81, 2012–2015. [Google Scholar] [CrossRef]
  69. Wu, C.C.; Schwartzman, M.L. The role of 20-HETE in androgen-mediated hypertension. Prostaglandins Other Lipid Mediat. 2011, 96, 45–53. [Google Scholar] [CrossRef]
  70. Dalmasso, C.; Maranon, R.; Patil, C.; Moulana, M.; Romero, D.G.; Reckelhoff, J.F. 20-HETE and CYP4A2 ω-hydroxylase contribute to the elevated blood pressure in hyperandrogenemic female rats. Am. J. Physiol. Renal Physiol. 2016, 311, F71–F77. [Google Scholar] [CrossRef]
  71. Pandey, V.; Garcia, V.; Gilani, A.; Mishra, P.; Zhang, F.F.; Paudyal, M.P.; Falck, J.R.; Nasjletti, A.; Wang, W.H.; Schwartzman, M.L. The Blood Pressure-Lowering Effect of 20-HETE Blockade in Cyp4a14(-/-) Mice Is Associated with Natriuresis. J. Pharmacol. Exp. Ther. 2017, 363, 412–418. [Google Scholar] [PubMed]
  72. Lin, C.J.; Shih, H.M.; Wu, P.C.; Pan, C.F.; Lin, Y.H.; Wu, C.J. Plasma selenium and zinc alter associations between ne-phrotoxic metals and chronic kidney disease: Results from NHANES database 2011–2018. Ann. Acad. Med. Singap. 2023, 52, 398–410. [Google Scholar] [PubMed]
  73. Yanagisawa, H.; Miyazaki, T.; Nodera, M.; Miyajima, Y.; Suzuki, T.; Kido, T.; Suka, M. Zinc-excess intake causes the deterioration of renal function accompanied by an elevation in systemic blood pressure primarily through superoxide radical-induced oxidative stress. Int. J. Toxicol. 2014, 33, 288–296. [Google Scholar] [CrossRef]
  74. Revis, N.W.; Zinsmeister, A.R.; Bull, R. Atherosclerosis and hypertension induction by lead and cadmium ions: An effect prevented by calcium ion. Proc. Natl. Acad. Sci. USA 1981, 78, 6494–6498. [Google Scholar] [PubMed]
Scheme 1. A simple model to analyze a mediating effect of the independent variable.
Jox 15 00049 sch001
Figure 1. Effects of gender on the correlation between β2-microglobulin excretion rate and rising SBP/DBP. Scatterplots relate SBP (a) and DBP (b) to log(Eβ2M/Ccr) × 104 in men and women. Coefficients of determination (R2) are provided together with standardized β values, numbers of participants, and p-values.
Jox 15 00049 g001
Figure 2. Effects of eGFR on the correlation between the β2-microglobulin excretion rate and rising SBP/DBP. Scatterplots relate SBP (a) and DBP (b) to log(Eβ2M/Ccr) × 104 in groups of subjects with normal and reduced eGFR. Coefficients of determination (R2) are provided together with standardized β values, numbers of participants, and p-values.
Jox 15 00049 g002
Figure 3. A simple model showing the mediating effect of Cd by eGFR. The model with GFR mediating an effect of Cd on SBP (a), DBP (b), and the Sobel tests for indirect effects of Cd on SBP (c) and DBP (d). For both SBP and DBP models, a*b describes the indirect effect of Cd.
Jox 15 00049 g003
Figure 4. A simple model showing mediating effect of Cd by β2-microglobulin. A model with β2M mediating an effect of Cd on SBP (a) and DBP (b) and an assessment for the statistical significance of Cd on SBP (c) and DBP (d). For both SBP and DBP models, a*b describes the indirect effect of Cd.
Jox 15 00049 g004
Table 1. Descriptive characteristics of study subjects according to eGFR and gender.
ParametersAll, n = 689Normal eGFR aReduced eGFR b
Males,
n = 183
Females,
n = 280
Males,
n = 68
Females,
n = 158
% Female63.439.560.5 ***30.169.5 ***
% Smoking28.348.517.7 ***53.013.2 ***
% Hypertension32.422.430.7 *42.042.4
Age, years42.7 (12.4)37.8 (11.5)40.8 (11.4) **44.6 (12.5)51.0 (11.0) **
Age range, years16–8016–7318–6919–7119–80
BMI, kg/m223.4 (3.9)22.6 (3.1)23.7 (4.3) **23.6 (3.6)24.6 (3.7) *
eGFR, mL/min/1.73 m297.4 (17.6)106.7 (10.7)107.6 (10.0)77.9 (9.4)76.7 (11,0)
% eGFR ≤ 60 mL/min/1.73 m22.6002.910.1
SBP, mm Hg121 (15)120 (14)119 (14)125 (16)126 (17)
DBP, mm Hg78 (10)77 (10)77 (10)80 (11)80 (11)
ECd/Ecr, µg/g creatinine2.77 (3.9)1.70 (2.88)3.29 (3.94) ***1.73 (2.74)3.51 (4.95) **
Eβ2M/Ecr, µg/g creatinine253 (1975)83 (174)70 (118) *748 (2868)549 (3522)
% Eβ2M/Ecr ≥ 300 µg/g creatinine7.38.62.7 *16.710.0
(ECd/Ccr) × 100, µg/L filtrate2.19 (3.27)1.46 (2.41)2.13 (2.56) **2.04 (3.35)3.22 (4.69) *
(Eβ2M/Ccr) × 100, µg/L filtrate301 (2753)71 (151)46 (77)1297 (5949)597 (4182)
% (Eβ2M/Ccr) × 100 ≥ 300 µg/L filtrate6.87.91.8 **16.710.1
n, number of subjects; BMI, body mass index; eGFR, estimated glomerular filtration rate; SBP, systolic blood pressure; DBP, diastolic blood pressure; Cd, cadmium; β2M, β2-microglobulin; cr, creatinine; Ccr, creatinine clearance. a, b Normal eGFR and reduced eGFR were defined as eGFR values ≥ 90 and < 90 mL/min/1.73 m2, respectively. Continuous variables were expressed as arithmetic mean and arithmetic standard deviation (SD) values. Data for Eβ2M were from 548 subjects. All other data were from 689 subjects. For all tests, p ≤ 0.05 identifies statistical significance. *** p < 0.001, ** p = 0.001–0.009, and * p = 0.012–0.050.
Table 2. Characteristics of participants according to β2-microglobulin excretion rate.
ParametersAll, n = 572Quartile of β2M Excretion Rate a
Quartile 1,
n = 142
Quartile 2,
n = 143
Quartile 3,
n = 142
Quartile 4,
n = 145
% Female65.657.069.267.668.3
% Smoking31.527.527.334.536.6
% Hypertension37.134.531.528.743.4
Age, years46.2 (10)44.2 (9.3)45.9 (10.2)45.0 (10.2)49.7 (9.6) ***
Age range, years16–8016–6818–7418–7021–80
BMI, kg/m224.1 (3.8)24.3 (3.4)24.4 (4.4)24.0 (3.5)23.6 (3.5)
% BMI > 30 kg/m24.95.34.94.34.3
eGFR, mL/min/1.73 m296.8 (17.5)100.4 (14.4)99.6 (16.6)99.8 (17.5)87.6 (18.3) ***
% eGFR ≤ 60 mL/min/1.73 m23.100.71.410.3 ***
SBP, mm Hg124 (14)122 (12)124 (14)122 (14)126 (17)
DBP, mm Hg79 (10)79 (8)79 (9)79 (10)81 (10)
ECd/Ecr, µg/g creatinine3.23 (4.13)2.05 (2.67)2.56 (3.34)3.50 (4.58)4.80 (4.99) ***
Eβ2M/Ecr, µg/g creatinine276 (2070)2.54 (2.54)21.4 (9.7)59 (21)1009 (4032) ***
% Eβ2M/Ecr ≥ 300 µg/g creatinine7.200028.3
(ECd/Ccr) × 100, µg/L filtrate2.56 (3.46)1.55 (1.98)1.86 (2.43)2.64 (3.50)4.14 (4.65) ***
(Eβ2M/Ccr) × 100, µg/L filtrate314 (2757)1.95 (1.89)15.7 (6.2)44 (12)1179 (5396) ***
% (Eβ2M/Ccr) × 100 ≥ 300 µg/L filtrate6.6%00026.2
n, number of subjects; BMI, body mass index; eGFR, estimated glomerular filtration rate; Cd, cadmium; β2M, β2-microglobulin; cr, creatinine; Ccr, creatinine clearance. a Quartile of β2M excretion rate was based on (Eβ2M/Ccr) × 100. Data for continuous variables were expressed as arithmetic mean and arithmetic standard (SD) values. Data for Eβ2M were from 548 subjects. Due to missing BMI data, all other data were from 572 subjects. For all tests, p ≤ 0.05 identifies statistical significance. *** p < 0.001.
Table 3. The prevalence odds ratios hypertension and β2-microglobulinuria in relation to Cd excretion rate normalized to creatinine clearance.
Independent Variables/FactorsHypertensionβ2-Microglobulinuria a
POR (95% CI)pPOR (95% CI)p
Age, years1.059 (1.040, 1.078)<0.0010.998 (0.948, 1.050)0.926
Gender 1.477 (0.953, 2.290)0.0812.165 (0.946, 4.955)0.068
Smoking 1.524 (0.974, 2.363)0.0650.600 (0.266, 1.354)0.219
BMI, kg/m2
<24Referent Referent
24–302.080 (1.442, 3.001)<0.0010.605 (0.287, 1.276)0.187
>30 3.342 (1.481, 7.543)0.0041.121 (0.230, 5.466)0.887
ECd/Ccr quartile: (ECd/Ccr) × 100 µg/L filtrate
Q1: <0.18Referent Referent
Q2: 0.18–0.701.078 (0.583, 1.994)0.8110.574 (0.034, 9.658)0.700
Q3: 0.71–2.732.522 (1.465, 4.342)0.0016.982 (0.887, 54.93)0.065
Q4: ≥2.742.787 (1.595, 4.871)<0.00110.67 (1.364, 83.40)0.024
POR, prevalence odds ratio; CI, confidence interval; BMI, body mass index; a β2-microglobulinuria was defined as Eβ2M/Ccr ≥ 3 µg/L filtrate. Numbers of subjects in the calculation of POR values for hypertension and β2-microglobulinuria were 689 and 548, respectively. For all tests, p-values ≤ 0.05 indicate statistical significance.
Table 4. Predictors of rising systolic and diastolic blood pressure levels.
Independent
Variables/Factors
SBP or DBP
All, n = 548Normal eGFR a
n = 362
Reduced eGFR b
n = 186
βpβpβp
SBP Model
Age, years0.323<0.0010.281<0.0010.2500.002
BMI, kg/m20.188<0.0010.201<0.0010.1580.029
Log[(ECd/Ccr) × 105, µg/L filtrate −0.0370.400−0.0380.510−0.0120.885
Log(Eβ2M/Ccr) × 104, µg/L filtrate0.0800.0590.0004250.9930.1820.013
Smoking −0.0590.207−0.0080.888−0.1380.094
Gender0.1050.029−0.1060.0800.0870.283
Adjusted R20.145<0.0010.106<0.0010.103<0.001
DBP Model
Age, years0.1210.0060.1140.045−0.0350.675
BMI, kg/m20.199<0.0010.229<0.0010.0900.231
Log[(ECd/Ccr) × 105, µg/L filtrate −0.0380.406−0.0680.245−0.0510.563
Log(Eβ2M/Ccr) × 104, µg/L filtrate0.0780.081−0.0040.9450.1920.012
Smoking −0.0410.4060.0070.903−0.1320.125
Gender0.0540.2860.0340.5850.0740.379
Adjusted R20.054<0.0010.053<0.0010.0230.114
SBP, systolic blood pressure; DBP, diastolic blood pressure; adjusted R2, coefficient of determination. a, b Normal and reduced eGFR were based on eGFR values ≥ 90 and < 90 mL/min/1.73 m2, respectively. Adjusted R2 was the proportion of SBP/DBP variance accounted by all six independent variables, while β indicated strength of association between SBP/DBP and independent variables. p-values ≤ 0.05 indicate statistical significance.
Disclaimer/Publisher’s Note: The statements, opinions and data contained in all publications are solely those of the individual author(s) and contributor(s) and not of MDPI and/or the editor(s). MDPI and/or the editor(s) disclaim responsibility for any injury to people or property resulting from any ideas, methods, instructions or products referred to in the content.

