Abstract
Excess sodium in soil disrupts ionic balance and limits water uptake, negatively affecting growth and stolon production in strawberry plants. This study assessed the effects of chitosan (CTS), brassinosteroids (BRs), and thidiazuron (TDZ) on stolon performance and physiological responses of strawberry cv. ‘Portola’ under saline conditions. A greenhouse experiment included seven treatments: CTS, BRs, CTS + BRs combinations, TDZ, and an untreated control. Foliar applications were used to evaluate impacts on nutrient uptake, photosynthetic pigments, oxidative stress, and stolon production. BRs alone [2.53 × 10⁻⁶ μM] significantly increased crown diameter (+43%), stolon number (+65%), stolon length (+4%), and daughter plant formation (+8%), while reducing leaf sodium by 60% and improving Mg2+/Na+ and K+/Na+ ratios. The CTS + BRs combination enhanced phenolic content and produced the heaviest first daughter plants (6.1 g). TDZ, however, resulted in weaker stolons, lower chlorophyll a content, and reduced K+/Na+ ratios, suggesting a need for dose optimization. Overall, BRs, alone or with CTS, improved salt tolerance and stolon propagation through enhanced ion regulation, photosynthesis, and antioxidant defenses. These findings advance understanding of how biostimulants modulate metal ion homeostasis, antioxidant signaling, and growth in salt-sensitive crops, offering strategies to mitigate salinity stress in strawberry cultivation.
Keywords:
oxidative damage; phenols; photosynthetic pigments; plant protection; sodicity; strawberry 1. Introduction
Strawberry (Fragaria × ananassa Duch.) is a globally valued fruit due to its sensory attributes, nutritional composition, and antioxidant properties [1]. Among the berries analyzed, strawberries stand out as the crop with the largest export volume from Mexico, with the United States being the main recipient of these exports, underscoring its economic significance [2]. Nevertheless, strawberry cultivation is highly vulnerable to saline environments [3,4,5,6], which disturb water relations, nutrient balance, pigment stability, and photosynthetic efficiency, leading to reduced growth, low yields, and in severe cases, plant death [7,8,9,10,11]. Salinity tolerance differs among cultivars [4], for example, ‘Albion’, ‘Camarosa’, and ‘San Andreas’ are reported as relatively tolerant, while ‘Camino Real’ and ‘Chandler’ are considered more sensitive [6].
Commercial propagation of strawberry is mainly achieved through runners, which guarantee genetic uniformity [12]. Saline conditions, however, negatively affect stolon number and elongation, restricting propagation efficiency and plant establishment [13]. This issue is critical given that approximately 20% of arable soils and one-third of irrigated land are already salinized, and projections suggest that nearly half of global cropland may be affected by 2050 [14].
Recent studies have revealed multiple physiological and molecular mechanisms underlying strawberry responses to salt stress, for example, the transcription factor FaWRKY40 enhances salt tolerance by activating FaRbohD, FaSOS1, and FaNHX1, thereby promoting ROS signaling, Na+ efflux, and vacuolar sequestration [15]. Additional regulators have been identified, such as the FaTINY2 gene, belonging to the AP2/ERF family, was isolated from Fragaria × ananassa. Its protein is located in the nucleus and has a conserved AP2 domain. FaTINY2 regulates genes related to stress response and provide grounds for improving resistance in strawberry under adverse conditions [16]. Furthermore, salinity tolerance in strawberry involves various molecular mechanisms, including ABC transporters and cell wall remodeling. These processes are related to plant adaptation through structural and metabolic reorganization of the wall, as well as to the regulation of the transport of essential compounds [17]. Collectively, these findings demonstrate a coordinated network of transcriptional regulation, ROS detoxification, and ion homeostasis that support strawberry resilience to salinity.
In recent years, biostimulants have also emerged as promising tools to enhance stress resilience in crops. Chitosan (CTS), a natural polymer derived from chitin, has been shown to improve growth, fruit quality, and antioxidant defenses under salinity [18,19,20]. Brassinosteroids (BRs), essential phytohormones, contribute to stress tolerance by regulating ion transport, osmotic adjustment, and ROS-mediated signaling [21,22]. Thidiazuron (TDZ), a synthetic cytokinin analog, extends cytokinin activity and promotes phenolic metabolism [23], although its impact under saline conditions in strawberry remains scarcely documented.
Given the limited evidence comparing these biostimulants, this study aimed to investigate the effects of CTS, BRs, and TDZ on the growth, mineral status, antioxidant capacity, and runner production of strawberry cv. ‘Portola’ under salt stress. We hypothesized that CTS and BRs would enhance stress tolerance by supporting physiological performance, antioxidant defenses, and stolon propagation.
2. Materials and Methods
2.1. Research Location
The study was carried out at the Faculty of Agrotechnological Sciences of the Autonomous University of Chihuahua at location coordinates: 28°38′20″ North, 106°05′20″ West inside a greenhouse protected with fiberglass from December 2022 to October 2023. The Photosynthetic pigments and the extraction and quantification of hydrogen peroxide were carried out at the Food and Development Research Center in Delicias, Chihuahua in September 2023. Soil and water analysis were performed in the same Faculty’s Soil and Water Department Laboratory.
2.2. Plant Materials, and Soil Characteristics
The mother plants of strawberry cv. ‘Portola’ for this study were kindly provided by the Faculty of Agrotechnological Sciences of the Autonomous University of Chihuahua, Mexico. ‘Portola’ is a day-neutral variety, established in the greenhouse, from its stolons, 140 small plants, with a crown diameter of 1 cm, were transplanted in winter on 5 December 2022, in saline soil characterized by sandy loam crumb texture whose physical-chemical characteristics are specified in Table 1. The soil analysis was carried out only once. For the transplant, a black polyethylene nursery bag 30 cm high, 28 cm in diameter, 82 cm in circumference, and 14 kg in capacity with perforations in the base for drainage were used.

Table 1.
Physical-chemical characteristics of the saline soil used in the essay.
2.3. Irrigation Water Characteristics
Plants were irrigated three times per week, conserving field capacity. Water analysis was performed only once. The characteristics of irrigation water were as follows: Cations (mmol) Ca 4.56, Mg 1.08, Na 2.63, K 0.04. Regarding anions (mmol) CaCO3 0.15, HCO3 3.05, SO4 0.84, Cl 1.45, the sodium adsorption ratio 2.22, percentage of sodium of 47.95, residual sodium content 0.38. Effective salinity, ES, was calculated by the sum of Cations–(Ca + Mg) = [2.67 meqL−1], potential salinity of [1.87 meq L−1] σ, precipitable sodium of 51.35%, with a pH of 8.45, and Electrical Conductivity, C.E. 470 dS m−1, and Low Cl. The soil and water methodology are described in the data recorded.
2.4. Experiment Treatments
Strawberry plants, including control, were placed in blocks for experimental divided plots with 30 cm distance between plants and 60 cm between treatments. The total area of the experimental plot was 272,240 m2. Five plants were used which formed an experimental unit, and four repetitions were carried out, with twenty plants per treatment, 140 total plants, and six treatments between biostimulants of CTS, BRs, and TDZ and a group of untreated plants used as control, as presented in the design of treatments in Table 2, where are specified the doses of the treatments 1 to 6, and its combinations of biostimulants as well as the control. In this study, the daytime temperature conditions ranged between 16 °C and 33 °C, and the nighttime ones fluctuated between 10 °C and 16 °C. An illumination of 16.65 μm m−2 s−1, 59,940 μm m−2 h−1, was recorded in the warmest hours of the day.
Table 2.
Design of treatments.
The foliage was sprayed eight times during the growth period, from 20 December 2022, through 23 June 2023, at 15, 40, 65, 90, 115, 140, 165, and 185 days after transplanting. The production of runners began on 27 June 200 days after the transplant.
The following products were used as follows:
CTS is a Low molecular weight product from Sigma Aldrich laboratory, made in Iceland, CAS number: 9012-76-4, Lot BCC09853, synonym Deacetylated chitin, poly (D-glucosamine). It was dissolved in 0.5% acetic acid. According to the study by Abdel-Aziz et al. [24], 0.07% potassium was loaded. It was applied in a Foliar spray of [0.65511309, 1.96533927, 2.62045236 μM].
VitazymeTM is a commercial product from SyngentaTM, made in the (Greensboro, NC, USA) Reg Number: RSCO-158/XII/14, and contains a mix of BRs: homobrasinolide, dolicholide, homodolicholide, and brassinone [0.00220% w/v], in a solution of [1.265 × 10⁻⁶ μM] in Treatment 2; [2.53 × 10⁻⁶ μM] in Treatment 3; and [1.0 × 10⁻⁵ μM] in Treatment 4. Treatment had only [2.53 × 10⁻⁶ μM] of the product.
CHARGER–PLEXTM a commercial product from AgroScience(MR), made in (Tlajomulco de Zúñiga) Mexico and holds 42.5% TDZ synthetic cytokinin in a solution of [3.30375 × 10⁵ μM] in treatment 6.
For the control treatment, the plants were sprayed with purified water.
The dose of CTS in Treatment 3 was reported by Reyes-Perez et al. [25], and the dose of BRs [2.53 × 10⁻⁶ μM] was recommended by Syngenta Corporation’s commercial trade. In Treatment 6, the dose of TDZ was recommended by AgroScience Labs. The concentration used in combination treatments were adjusted to their sole applications according to manufacturer recommendations. TDZ was tested as a positive control.
2.5. Data Recorded
As a representative sample, 20 plants were taken from each experimental plot, and the following data were recorded:
2.5.1. Foliar Mineral Nutrients, Soil, and Water Analyses
The methodology implemented in the Soil, Water, and Plant Analysis Laboratory of the Faculty of Agrotechnological Sciences of the Autonomous University of Chihuahua was carried out to determine the plant mineral metabolic content. The soil analysis was carried out at the establishment of the study, and the foliar analysis at the end to evaluate the effects on metabolism. The Methodologies implemented by Lachica et al. [26] at the Zaidin Experimental Station of the Higher Council for Scientific Research of Granada, Spain were used.
2.5.2. Morphological Parameters of the Mother Plants
The number of runners per plant and the number of daughter plants per runner were counted by units. The crown of the mother plant and the first daughter plant produced in the runner and the runners’ diameter were measured with a Vernier Caliper 5″, Aneng, made in (Yanzhou, Shandong) China. The runners’ length was measured with a Stanley FatMAX classic tape made in the (New Britain, CT) USA. The runners’ weights were weighed with a TORREY LEQ 10/20 high-precision digital scale
2.5.3. Total Phenols (TP)
Total phenols content was determined by the Folin–Ciocalteu method by Singleton and Rossi [27]. For the determination, 2 g of fresh-weight fruit were used and macerated in 40 mL of 80% methanol, a product from Sigma-Aldrich, CAS number 67-56-1, 750 μL of 20% Na2CO3, from Sigma-Aldrich (St. Louis, MO, USA), CAS number: 497-19-8, 1375 μL of distilled water from J.T.Baker CAS number: 7732-18-5, 250 μL of the 50% Folin–Ciocalteu phenolic reagent, from Sigma®, lot number: 118H5406, and 250 μL of the sample supernatant of the methanolic extract previously prepared were taken. The mixtures were then incubated at room temperature in the darkness for 1 h. Absorbance was measured at 725 nm on a Spectrophotometer Genesis 10 s V/Vis, Thermo Scientific, Waltham, MA, USA. Gallic acid (GA), from Sigma-Aldrich, CAS number: 149-91-7 was used as standard. The results were expressed as mg of gallic acid per 100 g fresh weight (mg GA 100 g−1). A calibration curve was drawn, using reagent-grade gallic acid with a
y = 1.1698 × −0.0257, and a R2 = 0.9919.
2.5.4. Photosynthetic Pigments
The Wellburn [28] method was used to determine photosynthetic pigments. cross-sectional cut of leaf tissue of 7 mm diameter with a weight of 0.2 to 0.3 g were extracted from fresh leaves. 10 mL of pure methanol (CH3OH) was added and incubated in the dark for 24 h at room temperature. For carotenoids, the absorbance was measured at 470 nm, for chlorophyll b, chl b, at 653 nm, and for chlorophyll a, Chl a, at 666 nm.
The calculation of the pigment concentration was carried out with the following formulas:
where V1: Volume of the extraction, p1: weight in g per circular cross-section of leaf tissue, p2: total weight in g, n: number of circular cross-sections of leaf tissue. Chlorophyll a, chlorophyll b, and carotenoids concentrations were expressed as µg cm−2.
2.5.5. Extraction and Quantification of Hydrogen Peroxide
The dismutation and quantification of hydrogen peroxide (H2O2) was performed using the method modified by Brennan and Frenkel [29]. When Titanium (Ti 4+) reacts with H2O2, a yellow complex is formed and separates H2O2 from the rest of the hydroperoxides after precipitation with ammonium hydroxide (NH4OH aq). The precipitate formed when resuspended in sulfuric acid (TiO2 (SO4)22− was measured by colorimetry at 415 nm against a standard curve of H2O2 in a range of 0.1 to 1 nm. The amount of H2O2 was expressed in μmol g−1.
2.6. Statistical Analysis
The design was completely random in plots. A classic analysis of variance with multiple comparisons of means was used. The variance homogeneity test was performed, and when heterogeneity was detected, the Mann–Whitney test of medians was performed. To obtain the results of foliar pigments, the completely random analysis of variance with a comparison of means by Tukey (p ≤ 0.05) was used. IBM, SPSS Statistics 25 Version was utilized [30].
3. Results
3.1. Response of the Foliar Application of CTS, BRs, and TDZ on the Macro and Micronutrient Foliar Content in Soil Salinity Conditions
The influence of the foliar application of CTS, BRs, and TDZ on macro and microelements contained in foliar is presented in Table 3 as a nutrient profile of the plants in the study. As it is shown, the values of Na increased in the untreated plants, 0.05%, and the lower amount was noticed in Treatment 3 and 5, both showed a 60% decrease in sodium content compared to CK. The presence of N was higher in Treatment 1 (1.92%), and after in Treatments 2 (1.83%), and 3 (1.87%), and lower in Treatment 4, (1.52%). Regarding P, the results were higher in Treatment 1 (48.38%) than in the control. The K content was higher in Treatment 1 (2.96%) and the control (2.86%) and lower in Treatment 6 (2.21%). Regarding Ca the results were statistically equal. The highest Mg content was found in Treatment 5, 14.5% higher than the control. Cu increased with Treatment 1, 34.44% in contrast to the untreated plants, and Fe 79.77% more in Treatment 4 than the control. Mn in Treatment 6 exceeded the control by 36.54%. On the other hand, Zn content was higher in Treatment 1 and untreated plants.
Table 3.
Effect of foliar application of treatments on macro, and micronutrients.
The nutritional quality of the leaves according to their treatments and the control can be seen in Figure 1.
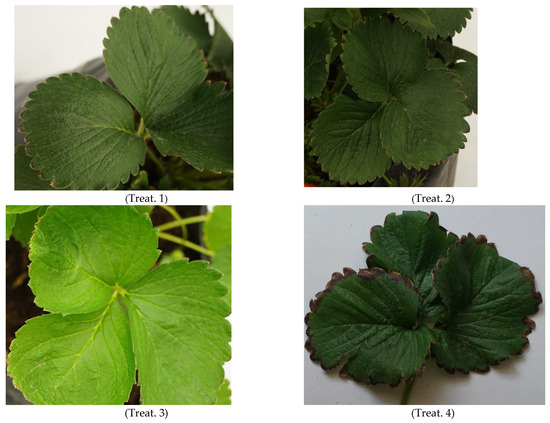
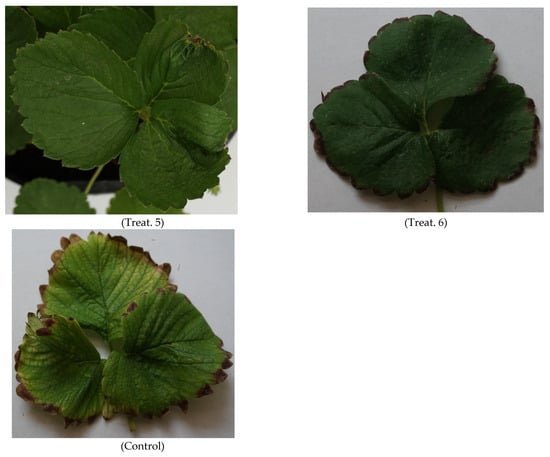
Figure 1.
Leaflets from the different chitosan (CTS), brassinosteroid (BRs), and thidiazuron (TDZ) treatments under salt stress conditions. Treat. = Treatment; Treat. 1: [CTS 1.96533927 μM]; Treat. 2: [CTS 2.62045236 μM + BRs 1.265 × 10⁻⁶ μM]; Treat. 3: [CTS 1.96533927 μM + BRs 2.53 × 10⁻⁶ μM]; Treat. 4: [CTS 0.65511309 μM + BRs 1.0 × 10⁻⁵ μM]; Treat. 5: [BRs 2.53 × 10⁻⁶ μM]; Treat. 6: [TDZ 3.30375 × 10⁵ μM]; and Control. Scale bar 1:60.
There was not a remarkable variation in the ratio between nitrogen and total chlorophyll. It showed that the plants during the study did not engage their metabolism (Figure 2A). About the Mg+/Na+ (Figure 2B) and K+/Na+ (Figure 2C) ratios of leaves, they were significantly reduced in treatments 2, 4, 6, and untreated plants due to the imposition of salt stress. However, the highest values in these parameters were obtained in treatments 1, 3, and 5 by 88.12, 91.74, and 84 in the K+/Na+ ratio and 18.91, 22.30, and 25.01, respectively, in the Mg+/Na+ ratio.
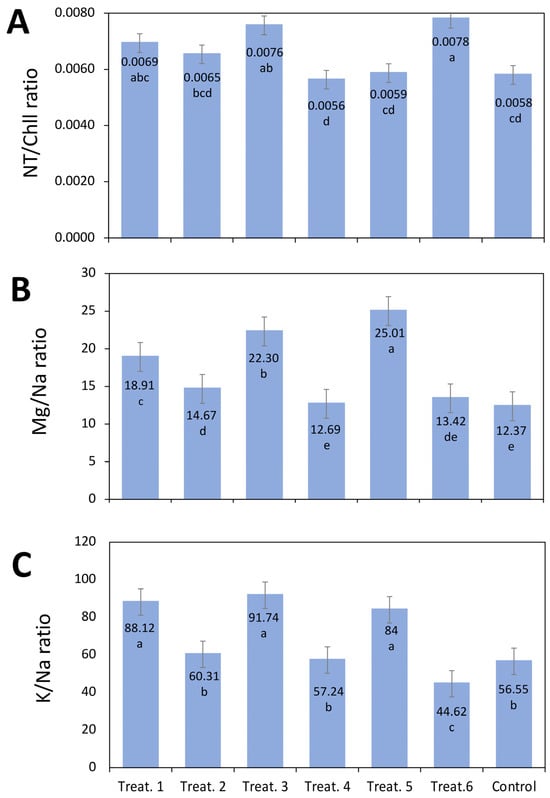
Figure 2.
Effect of chitosan (CTS), brassinosteroid (BRs), and thidiazuron (TDZ) treatments on nutrient ratios in mother leaves. (A) NT/Chl ratio, (B) Mg/Na ratio, and (C) K/Na ratio. Treat. = Treatment. Treat. 1: [CTS 1.96533927 μM]; Treat. 2: [CTS 2.62045236 μM + BRs 1.265 × 10⁻⁶ μM]; Treat. 3: [CTS 1.96533927 μM + BRs 2.53 × 10⁻⁶ μM]; Treat. 4: [CTS 0.65511309 μM + BRs 1.0 × 10⁻⁵ μM]; Treat. 5: [BRs 2.53 × 10⁻⁶ μM]; Treat. 6: [TDZ 3.30375 × 10⁵ μM]; and Control. Different letters above bars indicate significant differences among treatments according to Tukey’s HSD test (p < 0.05).
3.2. Morphological Parameters of the Mother Plants
Regarding the morphological parameters of the mother plants, significant differences were found between the treatments and between them and the untreated plants, except for the diameter of the runner, in which there were no significant differences between the treatments or among them compared to CK (Table 4). Treatment 5 recorded the highest values in crown diameter (2.35 cm), number of runners per ten plants (43), runners’ length (141.20 cm), and the number of daughter plants per runner per ten plants (52). Concerning the crown diameter, similar results were recorded between treatments 1 (1.86 cm), 2 (2.06 cm), 3 (1.87 cm), 4 (2.13 cm), and 6 (1.85 cm), but contrasting with the untreated plants which showed less crown development (1.64 cm diameter). Treatment 6 developed the smallest number of runners per ten plants (16), while treatments 1 and 2 developed the shortest runners with 80.20, and 87.65 cm, respectively. The heaviest runners (18.2 g) occurred in Treatment 4, followed by treatments 2 and 3. Treatments 1 and 5 did not show statistical differences with 14.9, and 14.7 g, respectively, the lowest weight in Treatment 6 (13.60 g), and the untreated plants (12.8 g).
Table 4.
Morphological parameters of the mother plants in the strawberry cultivar cv. Portola.
3.3. Morphological Parameters of the Stolons
As presented in Table 5, there were no significant differences in the diameter of the crown of the first plant between the treatments. However, the weight of the first daughter plant produced in the stolon differed. In this parameter, Treatment 4 stood out with a greater weight (6.2 g), while treatments 2 and 3 showed similar results between them (5.3 and 5.2 g, respectively). Treatments 1 (5.1 g) and 5 (4.9 g) resulted in a lower weight than previously mentioned treatments. Treatment 6 and the untreated plants produced daughter plants with the lowest weight (4.1 and 4.0 g).
Table 5.
Parameters of crown diameter and weight of daughter ‘Portola’ plants.
Figure 3 shows the development of the first daughter seedling of each treatment and the control. The treated mother plants produced seedlings with different vegetative development. Greater vegetative development was exhibited in the seedlings produced with Treatment 4, while those produced by treatments 1, 2, 3, and 5 had similar growth.
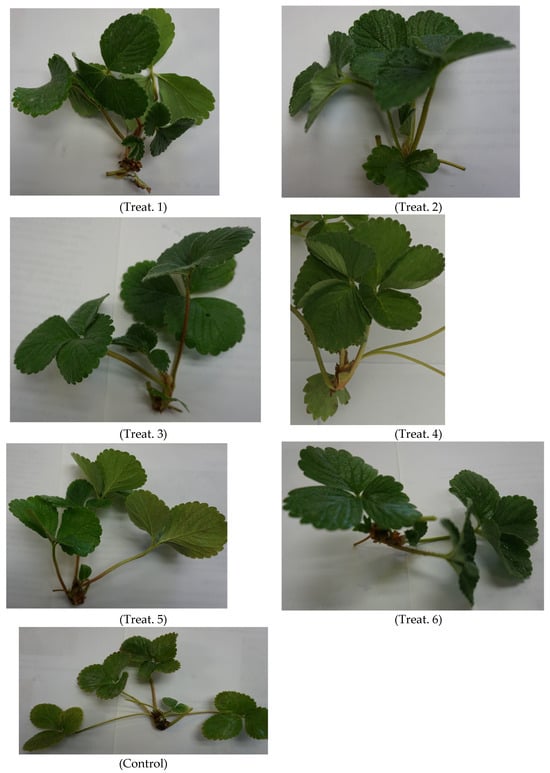
Figure 3.
First daughter plant produced from the different treatments under salt stress conditions. Chitosan = CTS; Brassinosteroids = BRs; Thidiazuron = TDZ; Treat. = Treatment. Treat. 1: [CTS 1.96533927 μM]; Treat. 2: [CTS 2.62045236 μM + BRs 1.265 × 10⁻⁶ μM]; Treat. 3: [CTS 1.96533927 μM + BRs 2.53 × 10⁻⁶ μM]; Treat. 4: [CTS 0.65511309 μM + BRs 1.0 × 10⁻⁶ μM]; Treat. 5: [BRs 2.53 × 10⁻⁶ μM]; Treat. 6: [TDZ 3.30375 × 10⁵ μM]; and Control. Scale bar 1:60.
3.4. Physiological Attributes and Biochemical Content in Mother Plants
The results from Table 6 illustrate that the highest chlorophyll a content was present in Treatment 5 with [211.9 mg g−1], followed by Treatment 2 [205.4 mg g−1], Treatment 1, and untreated plants with [192.6 and 191.9 mg g−1], respectively, without showing significant differences between them. The lowest content of Chlorophyll a [140.1 mg g−1] was recorded in plants treated with TDZ (Treatment 6). Regarding Chlorophyll b the highest content was present in Treatments 2 (93 mg g−1), untreated plants [90.8 mg g−1], Treatment 1 [86.8 mg g−1], and Treatment 4 [82.7 mg g−1]. Treatments 3 and 5 had similar results, without significant differences, while T6 registered the lowest content [67.8 mg g−1]. The results showed that Treatment 5 increased by 10.4%, chlorophyll a relative to the untreated plants, and 51.2% regarding T6. The results showed no significant differences in the carotenoid content or the chlorophyll a/b ratio in the treatments, nor between them and the control. The exogenous application of CTS, BRS, and TDZ on strawberry plants significantly reduced the ratio of total chlorophyll/carotenoids, and significant differences were shown between the treatments. The highest value in this parameter was recorded by untreated plants (4.0), followed by Treatment 1 (4.0), while Treatments 3 and 6 presented the lowest value (3.7).
Table 6.
Effect of foliar application sprays of chitosan, brassinosteroids, and thidiazuron concentrations to strawberry mother on leaf chlorophyll, and carotenoids.
Table 7 shows that the foliar application of CTS, BRS, and TDZ on the strawberry mother plants had a significant impact on total phenols that were meaningly and substantially increased by 31.7 mg/100 g fresh weight in Treatment 4. The lowest content was shown in Treatment 5 with 16.9 mg/100 g fresh weight. There were significant differences between the treatments in this parameter evaluated. Regarding the adversative effects of the overexpression of H2O2, there was a substantial reduction in plants, where CTS (Treatment 1), and TDZ (Treatment 6) were applied, with [4.8, and 6.62 μmol g−1] respectively, followed by untreated plants [6.65 μmol g−1], and Treatment 3 [6.8 μmol g−1]. The highest content was noticed in Treatment 2 [10.0 μmol g−1], followed by Treatments 5 [8.8 μmol g−1], and 4 [8.7 μmol g−1].
Table 7.
Foliar application of CTS, BRs, and TDZ significantly affect strawberry mother plants’ total phenols and H2O2 concentration.
4. Discussion
4.1. Sensitivity of Strawberry to Salinity
Strawberry is considered one of the most salt-sensitive horticultural crops, experiencing reductions in growth and yield even under moderate salinity. The normal range for soil sodium percentage is 3.1 to 5.0; in our study, it was 24.7. In this study, untreated plants (CK) exhibited evident signs of ionic imbalance and oxidative stress, such as smaller crown diameter, fewer and weaker stolons, and leaf necrosis. These observations are consistent with earlier studies reporting that salinity hampers water absorption, disrupts ion balance, and lowers chlorophyll content, ultimately affecting photosynthesis and growth [31,32]. The ‘Portola’ cultivar thus demonstrates its vulnerability to saline soils, as has been reported for other sensitive strawberry varieties [3,4,5,6].
4.2. Effects of Biostimulants on Nutrient Uptake and Metal Ion Homeostasis
Foliar treatments with CTS and BRs markedly enhanced mineral nutrition and maintained ion balance under saline conditions. Treatments 3 and 5 were the most effective, lowering Na+ accumulation by 60% compared to CK and sustaining higher K+/Na+ and Mg2+/Na+ ratios. Recent studies document that the use of BRs under saline conditions helps maize seedlings maintain ionic homeostasis by decreasing Na+ levels and replenishing K+ concentrations [33]. While Otie et al. [34] reported that applying Brassinosteroids externally enhances the absorption of various ions, including K+, Ca2+, and Mg2+, in soybean plants exposed to salt stress. These findings also align with research in maize and soybean, where BRs regulate nitrate transporters and improve nutrient uptake [35,36], In this study, high Na+ in the soil competed with essential cations like K+ and Mg2+, disrupting enzyme activities, photosynthesis, and osmotic balance and BRs’ role enhance the activity of ion transporters and antiporters, for example, SOS1, NHX1 that actively remove Na+ from the cytoplasm or sequester it into vacuoles [15]. This reduces cytosolic Na+ concentration, thereby increasing K+/Na+ and Mg2+/Na+ ratios. In this way, maintaining this ionic balance is essential for osmotic regulation, enzyme activity, and photosynthetic efficiency [37,38,39], commonly used as an indicator of plant salt tolerance. While CTS enhances N and P assimilation and mitigates Na+ toxicity, as has also been reported in wheat [40]. In contrast, TDZ increased P content but provided limited overall benefits, indicating that its dosage may need adjustment for optimal effect.
4.3. Morphological Responses of Strawberry Mother Plants
On the other hand, BRs suppresses the expression of the GA2ox-3 gene, which participates in GA inactivation, suggesting that BRs positively contributes to plant growth [41]. Brassinosteroids alone (Treatment 5) significantly increased crown diameter, stolon number and length, and the production of daughter plants, emphasizing their role as growth-promoting hormones. A larger crown is closely associated with higher carbohydrate accumulation and greater propagation potential in strawberries [42]. Chitosan also enhanced stolon development when it is applied with BRs (Treatment 4), resulting in the heaviest first daughter plant. This improvement is likely due to CTS-induced increases in the phenolic content and antioxidant protection, as has also been studied in Durum wheat [43], which boost plant vigor under stress. By contrast, TDZ and CK produced weaker stolons and lighter daughter plants, highlighting the limited tolerance of ‘Portola’ in the absence of biostimulant treatments.
4.4. Biochemical and Physiological Bases for the Effects
Enhanced stolon growth under BRs treatment was linked to higher magnesium levels and the stabilization of chlorophyll a, which supported efficient photosynthesis despite salt stress. Additionally, BRs led to increased H2O2 accumulation compared to CK, reflecting H2O2’s role as a signaling molecule that activates antioxidant defenses and preserves photosystem II function [44,45]. On the other hand, CTS treatments reduced H2O2 levels while boosting total phenol content, emphasizing their protective function against oxidative damage [46]. These complementary actions indicate that BRs stimulate growth through signaling and nutrient regulation, whereas CTS reinforces antioxidant defenses, jointly improving stolon production under saline conditions.
4.5. Implications for Strawberry Propagation and Future Research
This study demonstrates that BRs, whether applied alone or together with CTS, can effectively mitigate salt stress and enhance the propagation potential of strawberry cv. ‘Portola’. The findings highlight the particular effectiveness of BRs in increasing crown diameter, stolon quantity, and daughter plant production, while CTS further contributes by boosting plant vigor and antioxidant activity. These results are in agreement with Khaengkhan et al. [47] who demonstrated that the application of exogenous brassinosteroids, 0.002 mg L−1 and 7.5 mg L−1 of chitosan, showed a strong potential to improve the growth of glutinous rice plants. This study also coincides with Abulmagd et al. [48] who applied brassinolide at 200 ppm and chitosan at 500 ppm and obtained a positive effect on the growth of Aglaonema plants. In contrast, TDZ at the tested concentration proved less effective, suggesting that future studies should investigate lower doses to optimize its impact. Beyond the agronomic significance, these findings contribute to the broader understanding of how biostimulants modulate ion homeostasis, antioxidant signaling, growth, and sustainable strawberry propagation in salt-sensitive crops and underscore the value of integrating BRs and CTS into nursery and field management strategies.
Additional research incorporating molecular analyses of ion transporters and ROS-scavenging genes is recommended to elucidate the mechanisms behind these responses.
5. Conclusions
This research shows that brassinosteroids (BRs) and chitosan (CTS) can effectively reduce the adverse effects of soil salinity on strawberry cv. ‘Portola’. Application of BRs alone, [2.53 × 10⁻⁶ μM], notably enhanced crown diameter, stolon number and length, and the production of daughter plants, while also improving Mg content and sustaining higher K+/Na+ and Mg2+/Na+ ratios. These improvements contributed to chlorophyll syntesis, more stable photosynthesis, overall metabolic activity, and greater propagation potential. About K+, it regulates cell turgor, stomatal movement, and enzyme activation. Higher K+/Na+ ratios mean cells can maintain water balance and turgor pressure, which supports stolon elongation and expansion even under salt stress.
When combined with CTS, BRs further increased phenolic content and produced the heaviest first daughter plants, demonstrating synergistic effects under saline conditions. Where BRs act as key regulators of growth and ion transport, CTS reinforces antioxidant capacity, and together sustaining plant vigor under adverse soil conditions. This work offers a strategy for how biostimulants can counteract in saline contexts by combining physiological responses such as ion transport and photosynthetic stabilization with phenolic accumulation.
In contrast, TDZ at the tested concentration was less effective, resulting in weaker stolons and reduced photosynthetic pigments, which suggest that dose optimization is required before recommending its use in strawberry propagation under stress conditions.
Overall, the results underscore the potential of BRs and CTS as sustainable biostimulants for enhancing strawberry propagation in saline soils. By improving ion balance, antioxidant defenses, and stolon performance, these treatments provide a practical approach to sustaining productivity in salt-sensitive varieties. Future studies should aim to optimize TDZ application and investigate the molecular mechanisms involved, especially regarding ion transporters and ROS signaling pathways.
Author Contributions
Conceptualization, M.E.M.-P.; methodology, M.E.M.-P., T.d.J.R.-A., J.L.J.-C. and E.S.-C.; implemented all the research work, M.E.M.-P.; supervised the research work, T.d.J.R.-A., D.L.O.-B., R.Á.P.-Q. and E.S.-C.; software, B.I.G.; validation, T.d.J.R.-A.; formal analysis, J.L.J.-C. and B.I.G.; investigation, M.E.M.-P.; chemical resources and technical support in the laboratory, T.d.J.R.-A. and E.S.-C.; statistical study of this research, J.L.J.-C.; writing—original draft preparation, M.E.M.-P.; writing—review and editing, M.E.M.-P. and T.d.J.R.-A.; visualization, M.E.M.-P. All authors have read and agreed to the published version of the manuscript.
Funding
We thank the National Council of Science and Technology for the doctoral scholarship for Miriam Elizabeth Martínez Pérez.
Data Availability Statement
Data are contained within the article.
Acknowledgments
The authors would like to thank Linda Noperi, and the Department of Soil Management of our Faculty for the facilities provided and its technical assistance, and to Teresita de Jesús León Hernández for her photographic work.
Conflicts of Interest
The authors declare no conflicts of interest.
References
- Hernández Valencia, R.D.; Juárez Maldonado, A.; Pérez Hernández, A.; Lozano Cavazos, C.J.; Zermeño González, A.; González Fuentes, J.A. Influencia de fertilizantes orgánicos y del silicio sobre la fisiología, el rendimiento y la calidad nutracéutica del cultivo de fresa. [Influence of organic fertilizers and silicon on the physiology, yield and nutraceutical quality of strawberry cultivation]. Nova Sci. 2022, 14, 1–16. [Google Scholar] [CrossRef]
- Rocha-Ibarra, J.E.; Mireles-Arriaga, A.I.; Ruiz-Nieto, J.E.; Maki-Díaz, G. Production and export of berries in Mexico’s agricultural development: A study of competitive advantage. Agrociencia 2024, 58, 1–14. [Google Scholar] [CrossRef]
- Lu, W.; Fan, H.; Zhang, Y.; Cai, B.; Wang, X.; Xue, Z.; Li, Q. Low-concentration NaCl foliar spraying enhances photosynthesis, mineral concentration, and fruit quality of strawberry during greenhouse high-temperature periods. BMC Plant Biol. 2025, 25, 487. [Google Scholar] [CrossRef]
- Denaxa, N.K.; Nomikou, A.; Malamos, N.; Liveri, E.; Roussos, P.A.; Papasotiropoulos, V. Salinity effect on plant growth parameters and fruit bioactive compounds of two strawberry cultivars, coupled with environmental conditions monitoring. Agron 2022, 12, 2279. [Google Scholar] [CrossRef]
- Malekzadeh, M.R.; Roosta, H.R.; Kalaji, H.M. Enhancing strawberry resilience to saline, alkaline, and combined stresses with light spectra: Impacts on growth, enzymatic activity, nutrient uptake, and osmotic regulation. BMC Plant Biol. 2024, 24, 1038. [Google Scholar] [CrossRef]
- Muradoğlu, F.; Batur, Ş.; Hasanov, M.; Güler, E. Putrescine eases saline stress by regulating biochemicals, antioxidative enzymes, and osmolyte balance in hydroponic strawberries (cv. Albion). Physiol. Plant. 2025, 177, e70259. [Google Scholar] [CrossRef]
- Hung, N.Q.; Thi Thanh Nga, N.; Lam, V.P. Effects of varying electrical conductivity levels on plant growth, yield, and photosynthetic parameters of Tochiotome strawberry (‘Fragaria × ananassa’ ‘Tochiotome’) in a greenhouse. Aust. J. Crop Sci. 2025, 19, 436–441. [Google Scholar] [CrossRef]
- Tian, J.; Pang, Y.; Yuan, W.; Peng, J.; Zhao, Z. Growth and nitrogen metabolism in Sophora japonica (L.) as affected by salinity under different nitrogen forms. Plant Sci. 2022, 322, 111347. [Google Scholar] [CrossRef] [PubMed]
- Poury, N.; Seifi, E.; Alizadeh, M. Effects of salinity and proline on growth and physiological characteristics of three olive cultivars. Gesunde Pflanz. 2022, 75, 1169–1180. [Google Scholar] [CrossRef]
- Tammam, A.; El-Aggan, W.; Helaly, A.; Badr, G.; El-Dakak, R. Proteomics and photosynthetic apparatus response to vermicompost attenuation of salinity stress Vicia faba leaves. Acta Physiol. Plant. 2023, 45, 17. [Google Scholar] [CrossRef]
- Bağ, E.; Kocaman, B. Effects of mycorrhizal fungi application on some growth parameters of Monterey strawberry cultivars under different salt stress conditions. Int. J. Agric. Environ. Food Sci. 2024, 8, 158–168. [Google Scholar] [CrossRef]
- Guevara-Matus, K.; Loría-Quirós, C.L.; Granados-Montero, M. Efecto de la vernalización sobre la producción de estolones de Fresa. [Effect of vernalization on the production of strawberry runners]. Rev. Mex. Cienc. Agrícolas 2023, 14, 129–134. [Google Scholar] [CrossRef]
- Malekzadeh, M.R.; Roosta, H.R.; Esmaeilizadeh, M.; Dąbrowski, P.; Kalaji, H.M. Improving strawberry plant resilience to salinity and alkalinity through the use of diverse spectra of supplemental lighting. BMC Plant Biol. 2025, 24, 252. [Google Scholar] [CrossRef]
- Wekesa, C.; Asudi, G.O.; Okoth, P.; Reichelt, M.; Muoma, J.O.; Furch, A.C.U.; Oelmüller, R. Rhizobia Contribute to Salinity Tolerance in Common Beans (Phaseolus vulgaris L.). Cells 2022, 11, 3628. [Google Scholar] [CrossRef] [PubMed]
- Yang, H.; Zhang, J.; Zhong, Y.; Wang, L. 5-Aminolevulinic acid improves strawberry salt tolerance through a NO–H2O2 signaling circuit regulated by FaWRKY70 and FaWRKY40. J. Adv. Res. 2024; in press. [Google Scholar] [CrossRef]
- Li, W.; Zhang, W.; Li, H.; Yao, A.; Ma, Z.; Kang, R.; Guo, Y.; Li, X.; Yu, W.; Han, D. Overexpression of a Fragaria × ananassa AP2/ERF Transcription Factor Gene (FaTINY2) Increases Cold and Salt Tolerance in Arabidopsis thaliana. Int. J. Mol. Sci. 2025, 26, 2109. [Google Scholar] [CrossRef]
- Hu, T.; Liu, L.; Wei, Y.; Wu, F.; Yang, X.; Zhang, J. Combined transcriptomic and metabolomic analysis reveals a role for ATP-binding cassette transporters and cell wall remodeling in response to salt stress in strawberry. Front. Plant Sci. 2022, 14, 952312. [Google Scholar] [CrossRef]
- El Amerany, F.; Rhazi, M.; Balcke, G.; Wahbi, S.; Meddich, A.; Taourirte, M.; Hause, B. The effect of chitosan on plant physiology, wound response, and fruit quality of tomato. J. Polym. 2022, 14, 5006. [Google Scholar] [CrossRef] [PubMed]
- Mukarram, M.; Khan, M.M.A.; Kurjak, D.; Corpas, F.J. Chitosan oligomers (COS) trigger a coordinated biochemical response of lemongrass (Cymbopogon flexuosus) plants to palliate salinity-induced oxidative stress. Sci Rep. 2023, 13, 8636. [Google Scholar] [CrossRef]
- Hidangmayum, A.; Dwivedi, P.; Kumar, P.; Upadhyay, S.K. Seed Priming and Foliar Application of Chitosan Ameliorate Drought Stress Responses in Mungbean Genotypes Through Modulation of Morpho-physiological Attributes and Increased Antioxidative Defense Mechanism. J. Plant Growth Regul. 2023, 42, 6137–6154. [Google Scholar] [CrossRef]
- Ghoname, A.A.; AbdelMotlb, N.A.; Abdel-Al, F.S.; Abu El-Azm, N.A.; Abd Elhady, S.A.; Merah, O.; Abdelhamid, M.T. Brassinosteroids or proline can alleviate yield inhibition under salt stress via modulating physio-biochemical activities and antioxidant systems in snap bean. J. Hortic. Sci. Biotechnol. 2023, 98, 526–539. [Google Scholar] [CrossRef]
- Nazir, F.; Jahan, B.; Kumari, S.; Iqbal, N.; Albaqami, M.; Sofo, A.; Khan, M.I.R. Brassinosteroid modulates ethylene synthesis and antioxidant metabolism to protect rice (Oryza sativa) against heat stress-induced inhibition of source–sink capacity and photosynthetic and growth attributes. J. Plant Physiol. 2023, 289, 154096. [Google Scholar] [CrossRef]
- Hathal, N.M.; Al-Hayany, A.M. Effect of Humic Acid, Organic Nitrogen and Thidiazuron Spray on Growth and Yield Characteristics of Pear trees (Pyrus communis L.) cv. Le-Conte. IOP Conf. Ser. Earth Environ. Sci. 2023, 1262, 042027. [Google Scholar] [CrossRef]
- Abdel-Aziz, H.M.M.; Hasaneen, M.N.A.; Omer, A.M. Nano chitosan-NPK fertilizer enhances the growth and productivity of wheat plants grown in sandy soil. Span. J. Agric. Res. 2016, 14, e0902. [Google Scholar] [CrossRef]
- Reyes-Perez, J.J.; Enríquez-Acosta, E.A.; Ramírez-Arrebato, M.Á.; Zúñiga Valenzuela, E.; Lara-Capistrán, L.; Hernández-Montiel, L.G. Efecto del quitosano sobre variables del crecimiento, rendimiento y contenido nutricional del tomate. Rev. Mex. Cienc. Agrícolas 2020, 11, 457–465. [Google Scholar] [CrossRef]
- Lachica, M.; Aguilar, A.; Yánez, J. Análisis foliar: Métodos utilizados en la Estación Experimental del Zaidin. Ina. Edafol. Agrobiol. 1973, 32, 1033–1047. [Google Scholar]
- Singleton, V.L.; Rossi, J.A. Colorimetry of total phenolics with phosphomolybdic-phosphotungstic acid reagents. Am. J. Enol. Vitic. 1965, 16, 144–158. [Google Scholar] [CrossRef]
- Wellburn, A.R. The spectral determination of chlorophylls a and b as well as total carotenoids, using various solvents with spectrophotometers of different resolution. J. Plant Physiol. 1994, 144, 307–313. [Google Scholar] [CrossRef]
- Brennan, T.; Frenkel, C. Involvement of hydrogen peroxide in the regulation of senescence in pear. J. Plant Physiol. 1977, 59, 411–416. [Google Scholar] [CrossRef]
- IBM Corp. IBM SPSS Statistics for Windows, Version 25.0; IBM Corp.: Armonk, NY, USA, 2017.
- Zörb, C.; Geilfus, C.M.; Dietz, K.J. Salinity and crop yield. Plant Biol. 2019, 21, 31–38. [Google Scholar] [CrossRef]
- Kumar, A.; Singh, S.; Gaurav, A.K.; Srivastava, S.; Verma, J.P. Plant growth-promoting bacteria: Biological tools for the mitigation of salinity stress in plants. Front. Microbiol. 2020, 11, 1216. [Google Scholar] [CrossRef]
- Rattan, A.; Kapoor, D.; Kapoor, N.; Bhardwaj, R.; Sharma, A. Brassinosteroids regulate functional components of antioxidative defense system in salt stressed maize seedlings. J. Plant Growth Regul. 2020, 39, 1465–1475. [Google Scholar] [CrossRef]
- Otie, V.; Udo, I.; Shao, Y.; Itam, M.O.; Okamoto, H.; An, P.; Eneji, E.A. Salinity effects on morphophysiological and yield traits of soybean (Glycine max L.) as mediated by foliar spray with brassinolide. Plants 2021, 10, 541. [Google Scholar] [CrossRef] [PubMed]
- Cheng, L.; Li, M.; Min, W.; Wang, M.; Chen, R.; Wang, W. Optimal Brassinosteroid Levels Are Required for Soybean Growth and Mineral Nutrient Homeostasis. Int. J. Mol. Sci. 2021, 22, 8400. [Google Scholar] [CrossRef]
- Xing, J.; Wang, Y.; Yao, Q.; Zhang, Y.; Zhang, M.; Li, Z. Brassinosteroids modulate nitrogen physiological response and promote nitrogen uptake in maize (Zea mays L.). Crop J. 2022, 10, 166–176. [Google Scholar] [CrossRef]
- Gu, M.F.; Li, N.; Shao, T.Y.; Long, X.H.; Brestič, M.; Shao, H.B.; Li, J.B.; Mbarki, S. Accumulation capacity of ions in cabbage (Brassica oleracea L.) supplied with sea water. Plant Soil Environ. 2016, 62, 314–320. [Google Scholar] [CrossRef]
- Al-Ghumaiz, N.S.; Abd-Elmoniem, E.M.; Motawei, M.I. Salt tolerance and K/Na ratio of some introduced forage grass species under salinity stress in irrigated areas. Commun. Soil Sci. Plant Anal. 2017, 48, 1494–1502. [Google Scholar] [CrossRef]
- Xia, S.P.; Guo, S.W.; Xu, Y.Y.; Li, P.F. The regulation of accumulation and secretion of several major inorganic cations by Chinese Iris under NaCl stress. J. Plant Nutr. 2018, 41, 67–79. [Google Scholar] [CrossRef]
- Zhang, X.; Li, K.; Xing, R.; Liu, S.; Li, P. Metabolite Profiling of Wheat Seedlings Induced by Chitosan: Revelation of the Enhanced Carbon and Nitrogen Metabolism. Front. Plant Sci. 2017, 8, 2017. [Google Scholar] [CrossRef]
- Castorina, G.; Consonni, G. The role of brassinosteroids in controlling plant height in Poaceae: A genetic perspective. Int. J. Mol. Sci. 2020, 21, 1191. [Google Scholar] [CrossRef]
- Fagherazzi, A.F.; Suek Zanin, D.; Soares dos Santos, M.F.; Martins de Lima, J.; Welter, P.D.; Francis Richter, A.; Nerbass, F.R.; Kretzschmar, A.A.; Rufato, L.; Baruzzi, G. Initial crown diameter influences on the fruit yield and quality of strawberry Pircinque. J. Agron. 2021, 11, 184. [Google Scholar] [CrossRef]
- Quitadamo, F.; De Simone, V.; Beleggia, R.; Trono, D. Chitosan-Induced Activation of the Antioxidant Defense System Counteracts the Adverse Effects of Salinity in Durum Wheat. Plants 2021, 10, 1365. [Google Scholar] [CrossRef]
- Zhu, T.; Deng, X.; Zhou, X.; Zhu, L.; Zou, L.; Li, P.; Zhang, D.; Lin, H. Ethylene and hydrogen peroxide are involved in brassinosteroid-induced salt tolerance in tomato. Sci. Rep. 2016, 6, 35392. [Google Scholar] [CrossRef] [PubMed]
- Sehar, Z.; Jahan, B.; Masood, A.; Anjum, N.A.; Khan, N.A. Hydrogen peroxide potentiates defense system in presence of sulfur to protect chloroplast damage and photosynthesis of wheat under drought stress. Physiol. Plant. 2020, 172, 922–934. [Google Scholar] [CrossRef] [PubMed]
- Tabassum, M.; Noreen, Z.; Aslam, M.; Shah, A.N.; Usman, S.; Waqas, A.; Alsherif, E.A.; Korany, S.M.; Nazim, M. Chitosan modulated antioxidant activity, inorganic ions homeostasis and endogenous melatonin to improve yield of Pisum sativum L. accessions under salt stress. Sci. Hortic. 2024, 323, 112509. [Google Scholar] [CrossRef]
- Khaengkhan, P.; Wanna, R.; Bunphan, D.; Kunlanit, B.; Srisompan, O.; Jirakajornjaritkul, C.; Khaengkhan, P.; Bozdoğan, H. Foliar application of chitosan and brassinosteroids on glutinous rice (‘RD6’): Alteration in growth, agronomic trait, antioxidant capacity, elemental composition and aroma compound, 2-acetyl-1-pyrroline (2AP) in rice grain. Chil. J. Agric. Res. 2024, 84, 739–748. [Google Scholar] [CrossRef]
- Abulmagd, S.; EL-Leithy, A.; El-maadawy, E.; Heider, S. Effect of Brassinolide and Chitosan on Growth and Chemical Composition of Aglaonema commutatum plant. Egypt. J. Chem. 2023, 66, 419–427. [Google Scholar] [CrossRef]
Disclaimer/Publisher’s Note: The statements, opinions and data contained in all publications are solely those of the individual author(s) and contributor(s) and not of MDPI and/or the editor(s). MDPI and/or the editor(s) disclaim responsibility for any injury to people or property resulting from any ideas, methods, instructions or products referred to in the content. |
© 2025 by the authors. Licensee MDPI, Basel, Switzerland. This article is an open access article distributed under the terms and conditions of the Creative Commons Attribution (CC BY) license (https://creativecommons.org/licenses/by/4.0/).