Abstract
Cannabis sativa L. is a high-value medicinal crop whose nutritional requirements and fertilization strategies remain poorly defined, particularly in relation to cannabinoid production. This study evaluated the effects of inorganic fertilization (N, P, and K) on biomass accumulation, nutrient uptake and balance, and cannabinoid content in Cannabis sativa L. A high-cannabidiol (CBD) cultivar was propagated from ex vitro cuttings and grown in 10 L pots with commercial substrate. Treatments included a non-fertilized control and increasing doses of N (0–10 g plant−1), P (0–6 g plant−1), and K (0–10 g plant−1), with higher P and K doses applied during the reproductive stage. Biomass production peaked at 5 g N, 2 g P, and 3 g K plant−1, yielding 41.9% more than the control. Fertilized plants showed harvest indexes of 31–42%. Additional P and K during the reproductive stage did not enhance inflorescence biomass and CBD content. Tissue nutrient concentrations increased with fertilization. Inflorescences had maximum N and P levels at 5 g N and 2 g P plant−1, while leaves accumulated more K at 7.5 g K plant−1. CBD content increased and THC (%) decreased progressively with nutrient supply. High nutrient doses, however, led to nutritional imbalances and plant health issues. Nutrient balance analysis showed differential macronutrient extraction by treatment. These findings highlight the importance of optimized fertilization strategies to enhance both biomass and cannabinoid production in high-CBD cannabis cultivars.
1. Introduction
Cannabis sativa L. is an annual herbaceous plant belonging to the Cannabaceae family, indigenous to Central Asia, that has accompanied human societies for millennia due to its wide range of industrial, medicinal, and recreational applications. Archeological evidence suggests its use as early as the third millennium BCE in China, where it was valued both for its strong fibers and medicinal properties [1]. Over time, various cultures have incorporated C. sativa into their therapeutic practices, notably in traditional Indian medicine and religious rituals [2]. In recent decades, scientific interest in C. sativa has resurged, particularly with regard to its bioactive compounds, known as phytocannabinoids. Among these, cannabidiol (CBD) has garnered special attention due to its potential therapeutic applications—such as anticonvulsant, anxiolytic, anti-inflammatory, and neuroprotective effects—while lacking the psychoactive properties of Δ9-tetrahydrocannabinol (THC) [3,4,5].
The cultivation of C. sativa for optimal CBD production requires a detailed understanding of crop management practices, particularly nutrient management [6]. The macronutrients nitrogen (N), phosphorus (P), and potassium (K) play essential roles in plant growth and development. Nitrogen is critical for amino acid, protein, and chlorophyll synthesis, directly influencing photosynthetic activity and vegetative vigor. Adequate nitrogen availability promotes vigorous development and increases overall biomass production [7]. Phosphorus is fundamental for energy transfer processes, nucleic acid synthesis, and root development; its deficiency can restrict growth and delay plant maturation [8]. Potassium, by contrast, is essential for osmoregulation, enzymatic activation in carbohydrate and protein synthesis, and contributes to improved resilience against biotic and abiotic stressors [9].
Despite the recognized importance of these macronutrients, scientific information on the nutritional requirements of C. sativa under various cultivation systems—such as soil, substrate, and hydroponics—and across different genotypes (high-CBD, high-THC, or balanced chemotypes) remains limited. This knowledge gap hampers the development of fertilization recommendations tailored to each cultivation method, potentially affecting both yield and cannabinoid quality. Further research is needed to elucidate the nutritional demands and phytoremediation capacities of C. sativa, particularly in relation to soil types and the long-term impacts of different fertilization regimes [6].
Recent studies have shown that the supplementation of N, P, and K not only promotes healthy plant growth but may also influence the biosynthesis and accumulation of cannabinoids, including CBD. For instance, ref. [10] demonstrated that optimal nitrogen levels can increase cannabinoid concentrations in inflorescences, whereas excessive nitrogen may have adverse effects. Similarly, ref. [11] reported that increased phosphorus availability did not necessarily lead to higher production of bioactive compounds.
However, none of the aforementioned studies have addressed the quantitative relationships between inorganic fertilization, tissue nutrient composition, and cannabinoid content in C. sativa L. The present work is the first to systematically evaluate how varying doses of N, P, and K—applied through temporally fractionated inorganic fertilization regimes—affect not only biomass accumulation and nutrient uptake, but also the distribution of these nutrients across plant organs and their subsequent impact on CBD and THC profiles.
In summary, the efficient and high-quality production of CBD is largely dependent on agronomic practices that address the specific macronutrient requirements of the plant and its cultivation environment. Nutrient management synchronized with the plant’s phenological stages is key to optimizing cannabinoid yields and maximizing the therapeutic potential of CBD.
In this context, the present study aims to provide evidence on the effects of nitrogen, phosphorus, and potassium supply during the vegetative and reproductive stages of C. sativa L. The following hypotheses were proposed: (a) fertilization with these nutrients induces morphophysiological changes in the plant, modifying the partitioning and accumulation of dry matter across different organs (roots, stems, leaves, and inflorescences), and thereby altering both the concentration (%) and total content (mg plant−1) of cannabinoids in the inflorescences; (b) these changes are associated with the availability and distribution of each nutrient across vegetative and reproductive organs.
2. Materials and Methods
2.1. Plant Material and Growth Conditions
This study used a single cultivar of C. sativa L., characterized by a high CBD content (~95%) and phenotypic traits typical of indica-type genotypes. The plant material consisted of clones obtained from ex vitro cuttings generated through standardized vegetative propagation techniques. Cuttings were successfully rooted under controlled conditions for 26 days after removal from the mother plant and subsequently transplanted into individual 10 L pots. Each pot was filled with a commercial horticultural substrate specifically formulated for vegetable crops (see Supplementary Materials). This substrate provided adequate physical support and a balanced initial nutrient supply during early development.
Environmental conditions were controlled throughout the experiment. Day and night temperatures were maintained between 24 and 26 °C, and relative humidity ranged from 45% to 55%. Lighting was provided by GS Iluminaciones JX150 series lamps (gsiluminaciones, Buenos Aires, Argentina), with a photosynthetic photon flux density of 550 μmol/m2/s. Irrigation was applied daily according to plant water requirements, with an estimated 30% leaching at each event to prevent salt accumulation in the substrate.
2.2. Experimental Design and Fertilization Scheme
The experiment was structured in two main phases: a vegetative stage and a reproductive stage, defined by photoperiod manipulation. Different progressive fertilization schemes were applied during each phase.
During the 42-day vegetative stage, plants were grown under an 18 h light/6 h dark photoperiod and subjected to fertilization treatments (T, D1, D2, D3; see Table 1). Five replicates were used per treatment, resulting in a total of 50 plants at the start of the experiment.

Table 1.
Fertilization scheme by treatment and dose (g plant−1).
Fertilization doses were formulated with varying amounts of essential macronutrients: nitrogen, phosphorus, and potassium. These were supplied as granular urea, triple superphosphate, and potassium chloride, respectively. Fertilizers were incorporated into the substrate at a uniform depth of 3 cm and irrigated immediately to enhance absorption and minimize volatilization or leaching losses.
After six weeks under vegetative conditions, the 42-day reproductive phase began with a photoperiod shift to 12 h light/12 h dark. During this stage, each initial fertilization group was subdivided into three additional treatments (T1, T2, and T3; see Table 1), based on modifications to the nutrient supply from the vegetative stage:
- T1: Maintained the same N, P, and K doses as in the vegetative stage.
- T2: Maintained the N and K doses but increased P relative to the vegetative stage.
- T3: Maintained the same as T2, with an additional increase in K.
These subdivisions within the D1, D2, and D3 groups allowed evaluation of how nutritional adjustments during the reproductive stage affected plant growth and yield (Figure 1).
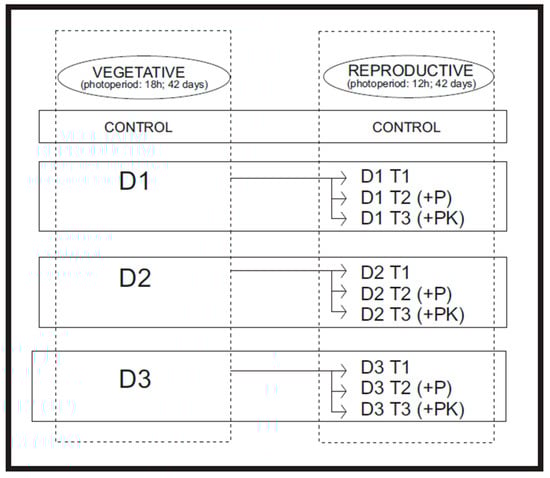
Figure 1.
Diagram illustrating the experimental workflow and treatment structure used in the study.
Nitrogen doses were kept constant throughout the experiment. This decision was based on previous findings indicating that excessive nitrogen availability during the reproductive stage can promote continued vegetative growth, potentially delaying or reducing flower and cannabinoid production. In contrast, phosphorus and potassium were increased during this stage due to their known physiological roles in reproductive development. Phosphorus is essential for energy transfer and flower initiation, while potassium contributes to osmoregulation, enzyme activation, and assimilate transport toward reproductive structures.
2.3. Fresh and Dry Biomass Determination
At the end of the trial, each plant was harvested individually. Roots, stems, leaves, and inflorescences were separated and placed in paper bags. Plant material was dried in a forced-air oven at 60 °C for 48 h, and dry weights were recorded. Inflorescences were dried separately in a temperature- and humidity-controlled room (18–24 °C; 45–55% RH), using air extractors and air conditioning to ensure a slow, uniform drying process that preserved cannabinoid integrity. The final dry weight was recorded after drying.
Total dry biomass was calculated as the sum of the dry weights of all plant organs. Harvest index (HI) was calculated as follows:
2.4. Mineral Nutrient Analysis
Collected samples were analyzed at the Livestock Waste Analysis Laboratory of the Faculty of Agricultural Sciences, Universidad Nacional del Litoral. Quantitative determinations of nitrogen, phosphorus, and potassium concentrations were performed.
2.5. Cannabinoid Content
Cannabinoids were extracted from 5 g of dried, ground inflorescence using Soxhlet extraction with hexane as the solvent. After extraction, the solvent was removed via rotary evaporation, and an aliquot of the concentrated extract was submitted to an external laboratory registered with the SENASA National Laboratory Network (LR0120) for CBD and THC quantification using a gas chromatograph Agilent 7890B (Agilen, Santa Clara, CA, USA) coupled to a mass spectrometer Agilent 5977A (Agilen, Santa Clara, CA, USA).
The cannabinoid analysis referred to the neutral forms (CBD and THC). Both compounds concentrations and mass content in the aliquots were reported by the laboratory. Total cannabinoid accumulation per plant was calculated as follows:
Cannabinoid content per gram of dry inflorescence was calculated:
Total cannabinoid accumulation per plant (mg) was then estimated by multiplying the concentration by the total dry weight of inflorescences per plant:
2.6. Substrate Nutrient Analysis and Balance
A homogeneous sample of the initial substrate was collected at the beginning of the experiment (T0), and representative samples of each treatment were collected at the end. Total N (%), total P (ppm), and total K (ppm) were determined. Nutrient quantities at the beginning and end of the trial were calculated based on concentrations and substrate mass. These values, combined with nutrient content by organ, were used to calculate nutrient balances.
2.7. Statistical Analysis
Data were subjected to one-way analysis of variance (ANOVA) to evaluate the effects of N, P, and K doses on each response variable, considering each nutrient separately. Prior to ANOVA, data were tested for normality and homogeneity of variances to ensure the validity of the model assumptions. Fisher’s least significant difference (LSD) test (p ≤ 0.05) was used for mean comparisons. This method has been widely applied in agronomic and cannabis studies for post hoc comparisons [7]. In figures, different letters denote significant differences. Statistical analyses were performed using InfoStat software v 2020 [12].
The D3 T3 treatment was excluded from the statistical analysis due to total plant mortality before harvest, reducing the number of experimental units to n = 40.
3. Results
The plants subjected to the highest fertilization dose (D3 T3) did not survive until the end of the experiment. This treatment was excluded from the results. Visual and anatomical assessment indicated symptoms consistent with Fusarium spp. infection (Figure 2). Plant mortality occurred between weeks 5 and 7 of the experiment, during the early to mid-reproductive stage. As a result of this loss, the total number of experimental units was reduced to n = 40 from that point forward (Table 2).
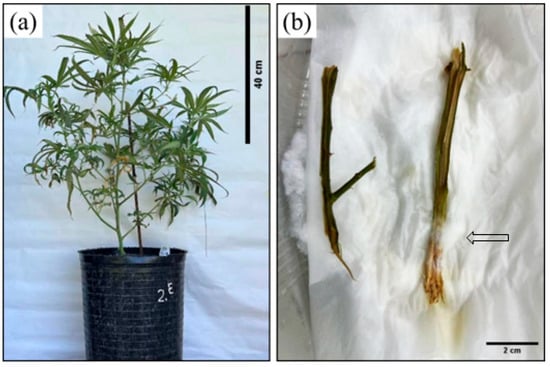
Figure 2.
(a) Plant exhibiting typical wilting symptoms associated with Fusarium spp. infection. (b) Transverse stem section incubated in a humid chamber, displaying mycelial emergence from vascular tissues—evidence of pathogen colonization. The arrow shows the progression of mycelial growth on the stem.
Table 2.
Number of plants per treatment used in the statistical analysis. All plants died in Treatment D3 T3 and were excluded from the analysis.
3.1. Biomass Partitioning, Accumulation, and Harvest Index
Fertilization significantly influenced biomass accumulation, with increases of up to 42% (D1 T1) relative to the control. Higher fertilization doses did not result in proportional increases in total dry matter (Figure 3). In five of eight treatments, inflorescences represented the largest biomass fraction (26–42%), followed by leaves (26–37%), stems (13–21%), and roots (12–21%). The highest harvest index (HI) was recorded in treatment D2 T3 (42%). Although no significant differences were observed among treatments for harvest index (HI), values ranged between 0.30 and 0.42 across fertilized treatments. The lowest HI values were recorded under the highest overall NPK doses (D3 T1 and D3 T2, with 33.5% and 31.1%, respectively), whereas the highest HI (42%) occurred under moderate fertilization (D2 T3).
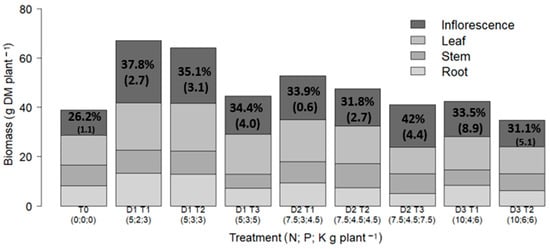
Figure 3.
Total dry matter (g) accumulated in plant organs (roots, stems, leaves, and inflorescences) by treatment. Percent values indicate harvest index (HI). Data are shown as means with standard errors in parentheses.
3.2. Effect of N, P, and K Fertilization on Biomass Allocation in Organs
Dry biomass allocation among different plant organs varied depending on the nutrient and the applied dose. In the nitrogen treatments, no significant differences were observed in the biomass of roots, stems, or leaves (Figure 4a). However, inflorescence biomass was significantly higher at the 5 g N plant−1 dose compared to both the unfertilized control and the highest nitrogen application.
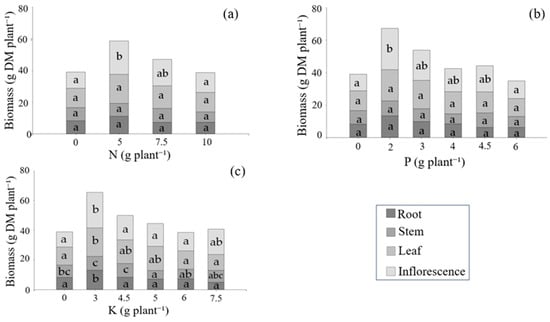
Figure 4.
Dry biomass (g DM per plant) of roots, stems, leaves, and inflorescences in response to nitrogen (a), phosphorus (b), and potassium (c) applications. ANOVA and Fisher’s LSD test (5%) were performed independently for each organ. Different letters denote statistically significant differences (p < 0.05) within each organ.
In response to phosphorus supply (Figure 4b), root, stem, and leaf biomass remained statistically unchanged across treatments. Inflorescences, however, responded positively to fertilization, with 2 g P plant−1 resulting in significantly greater dry matter accumulation than both the control and the highest P dose.
Potassium treatments (Figure 4c) showed a more complex pattern. Root biomass peaked at 3 g K plant−1, being significantly greater than in treatments with 4.5 to 7.5 g K plant−1 and the control. Stem biomass was also enhanced at 3 and 4.5 g K plant−1. Leaf biomass reached its maximum at 3 g K plant−1 and declined at higher doses (6 and 7.5 g K plant−1), with values significantly lower than those at 3 g and the control. Inflorescence biomass was highest at 3 g K plant−1, and significantly greater than in the control as well as in the 4.5, 5, and 6 g K plant−1 treatments.
3.3. Effect of Fertilization on Tissue Nutrient Concentrations
The concentrations of nitrogen (N), phosphorus (P), and potassium (K) in different plant organs varied significantly in response to the applied doses of each nutrient (Table 3). In all cases, nutrient concentrations increased with higher fertilization rates, although the magnitude and pattern of accumulation differed among organs.
Table 3.
Effect of N, P, and K fertilization on nutrient concentrations (g kg−1 DM) in Cannabis sativa L. organs. Values represent treatment means, standard error in parentheses. Different letters indicate significant differences (LSD, p < 0.05) within columns. CV: Coefficient of Variation. LSD: Least Significant Difference.
For nitrogen, a progressive increase in concentration was observed across all organs as the N dose increased. Inflorescences exhibited the highest N content, followed by leaves, while stems and roots showed the lowest values. In leaves, nitrogen concentrations became significantly different from the control starting at 5 g N plant−1 and reached their highest levels at 7.5 and 10 g N plant−1. Inflorescence N concentration peaked at 7.5 g N plant−1, showing a significant increase relative to unfertilized plants.
Phosphorus concentration also responded positively to fertilization. The highest P levels in inflorescences were recorded at 2, 3, 4, and 6 g P plant−1. In leaves, all fertilized treatments significantly differed from the control. P concentrations in roots and stems remained comparatively low across treatments, although a significant peak was detected at 6 g P plant−1. These results indicate that reproductive and photosynthetic organs are strong P sinks, while structural organs show lower accumulation capacity.
Potassium concentrations showed a marked increase in leaves with rising K supply, reaching a maximum at 7.5 g K plant−1. This organ consistently exhibited the highest K content, in line with its physiological role in photosynthesis and osmoregulation. Inflorescence K content peaked at 3, 5, and 6 g K plant−1. In stems, a significant increase was observed at 6 g K plant−1 compared to 3 g K plant−1. No statistically significant differences were detected in root K concentrations across treatments, suggesting limited K remobilization to below-ground tissues under the tested conditions.
3.4. Cannabinoids
Effect of N, P, and K Fertilization on CBD and THC Concentration and Accumulation
Cannabinoid profiles were significantly influenced by nutrient supply, with both the concentration (%) and total accumulation (mg plant−1) of cannabidiol (CBD) and tetrahydrocannabinol (THC) responding to fertilization treatments (Table 4).
Table 4.
CBD and THC concentrations (%) and accumulation (mg plant−1) in inflorescences under different N, P, and K fertilization regimes.
The percentage of CBD increased progressively with higher nutrient doses. Plants grown without fertilization had a CBD concentration of 87.3%, whereas the highest concentration (95.3%) was recorded in the treatment receiving 7.5 g N, 4.5 g P, and 7.5 g K per plant. In contrast, THC concentration showed an inverse pattern: the highest value (10.0%) was found in the unfertilized control, while the lowest (2.8%) occurred at the highest combined nutrient supply. These results suggest a nutrient-mediated shift in the cannabinoid biosynthetic pathway that favors CBD accumulation over THC under conditions of improved fertility.
In terms of total cannabinoid accumulation per plant, the treatment with 5 g N, 2 g P, and 3 g K per plant yielded the highest values: 520.2 mg of CBD and 34.9 mg of THC per plant. The lowest accumulation was recorded in plants that received the highest nutrient doses (10 g N, 6 g P, and 6 g K per plant), with only 47.9 mg of CBD and 2.2 mg of THC per plant. Intermediate doses of fertilization resulted in correspondingly intermediate levels of both cannabinoids. These findings suggest that while moderate nutrient availability enhances cannabinoid biosynthesis, excessive fertilization may lead to a reduction in both concentration and total yield, possibly due to physiological stress or nutrient imbalances affecting secondary metabolism.
3.5. Nutrient Balance Within the Growing Substrate
The analysis of nutrient balances in the substrate revealed contrasting patterns depending on the fertilization treatment (Table 5). For nitrogen, both positive and negative balances were observed. Treatments D2 T1, D2 T2, D3 T1, and D3 T2 showed residual nitrogen in the substrate at the end of the cultivation cycle, suggesting possible saturation or limited uptake efficiency at higher N doses. In contrast, other treatments exhibited net nitrogen depletion, indicating effective absorption and utilization by the plants. Phosphorus balance was consistently negative in all fertilized treatments, except the unfertilized control (T0), which retained residual P. This widespread P depletion suggests a strong demand for this macronutrient during the crop cycle, particularly during reproductive development, with no evidence of saturation or over-application even at the highest P doses. Potassium presented more variable responses. A positive K balance was observed only in treatment D1 T2, where moderate K doses were combined with increased P during the reproductive stage. All other treatments showed negative balances, reflecting significant removal of K from the substrate, consistent with the high K concentrations detected in metabolically active organs such as leaves and inflorescences.
Table 5.
Nutrient balance (mg plant−1) in the substrate at the end of the Cannabis sativa L. cultivation cycle.
4. Discussion
4.1. Biomass Accumulation and Partitioning
Our study demonstrated that nitrogen, phosphorus, and potassium fertilization significantly influenced the partitioning of dry matter among plant organs. However, no significant differences were observed among treatments in the harvest index (HI), suggesting a relatively stable allocation of biomass to reproductive structures despite varying nutrient availability.
These results indicate that while nutrient supply affects total biomass production and organ-specific distribution, the proportion of biomass allocated to inflorescences (i.e., the HI) remains notably consistent across a wide range of fertilization regimes. This consistency supports the hypothesis that the harvest index is a robust agronomic trait in C. sativa, largely unaffected by changes in nutritional inputs.
Comparable findings have been reported in previous studies. For example, ref. [11], working with a high-CBD cultivar and three phosphorus levels (25, 50, and 75 mg P L−1) in a controlled substrate-based system, found no significant effect of phosphorus fertilization on floral biomass or harvest index, which averaged at 65% across treatments [11]. Similarly, ref. [13,14], who assessed phosphorus concentrations exceeding typical recommendations for other crops (15, 30, 45, 60, and 90 mg L−1) under hydroponic conditions in a high-CBD cultivar, also reported no significant differences in HI or inflorescence biomass. Ref. [14], using a high-CBD cultivar under controlled substrate conditions with increasing doses of mineral and organic nitrogen, observed that inflorescence dry matter constituted a substantial proportion of total plant biomass, with harvest indices of 53.5% and 55.7% for organic and mineral fertilization, respectively; however, these differences were not statistically significant.
In contrast, ref. [15] reported an increase in HI with higher potassium concentrations (75, 113, and 150 mg L−1) in a high-THC cultivar grown in an aquaponic system. These contrasting results highlight the potential influence of genotype and cultivation system on HI responses to fertilization.
4.1.1. Nitrogen and Biomass
In our experiments, moderate nitrogen fertilization significantly enhanced total plant biomass and inflorescence yield, while excessive nitrogen doses led to reduced growth or no additional gains. This demonstrates a dose-dependent response, wherein optimal nitrogen levels promote biomass accumulation, but supra-optimal concentrations may inhibit plant development.
This pattern is consistent with the findings of [14], who reported progressive increases in total and inflorescence biomass in a high-CBD genotype grown under controlled conditions in substrate, with increasing nitrogen concentrations ranging from 80 to 240 mg N L−1. CBD:THC-balanced cultivars have also been examined to assess their physiological and productive responses to nutrient availability. Ref. [7] found that both low and high nitrogen doses negatively affected plant development, with optimal vegetative biomass observed at 160 mg N L−1 in a CBD:THC-balanced cultivar grown under controlled conditions in a perlite-based substrate. In a subsequent study, the same authors reported that inflorescence yield increased up to 160 mg N L−1, while leaf biomass continued to rise up to 320 mg N L−1, and root and stem biomass peaked at 80 mg N L−1 [10].
Studies on THC-dominant genotypes have revealed similar trends. Ref. [9], working under hydroponic conditions, observed that dry inflorescence biomass increased with nitrogen and phosphorus supply, up to 194 mg N L−1 and 59 mg P L−1, respectively. Taken together, our results reinforce the consensus that nitrogen availability is a critical determinant of biomass accumulation in C. sativa, with clearly defined thresholds for optimal fertilization.
4.1.2. Phosphorus and Biomass
In our study, phosphorus fertilization showed a limited impact on biomass accumulation and floral yield across tested concentrations. No significant differences were detected among P treatments, indicating that phosphorus requirements were likely met at lower application rates.
These results concur with [11], who reported no significant effects of phosphorus on floral dry mass in a high-CBD cultivar grown in a growth chamber and substrate, and [13], who observed no significant changes in inflorescence biomass in hydroponic systems over a range of P doses. Ref. [16] evaluated a high-CBD C. sativa cultivar grown in a peat–perlite substrate under controlled conditions, testing different phosphorus concentrations (3.75–30.0 mg·L−1) using a modified Hoagland’s solution and found that inflorescence biomass increased at 22.5 mg·L−1 P compared to lower doses, though it was not significantly different from intermediate and higher concentrations. Ref. [8] observed that biomass accumulation in balanced and THC-rich genotypes increased with P supply up to 30 mg L−1, with no additional gains at higher doses.
Together, the evidence indicates that phosphorus sufficiency in C. sativa L. can be achieved with relatively low inputs, and excessive fertilization does not further enhance biomass.
4.1.3. Potassium and Biomass
Our findings indicate that moderate potassium fertilization enhances biomass accumulation in both vegetative and reproductive organs of C. sativa. However, higher potassium levels did not result in further increases, suggesting the presence of a physiological saturation threshold beyond which additional K supplementation does not confer extra benefits.
Potassium nutrition has also been examined in high-CBD genotypes. For example, ref. [17] evaluated three concentrations of K2SO4 (11, 43, and 129 ppm) under controlled conditions in a substrate-based system. They observed that shoot biomass and stem diameter were positively influenced when slow-release potassium fertilizer was applied in conjunction with growth-promoting microorganisms. Root biomass, however, remained unaffected.
In a similar context, ref. [18] reported that in a balanced chemotype (“RM”) grown under controlled substrate conditions, biomass of leaves, stems, and roots increased with potassium levels up to 175 ppm but declined at higher concentrations. Conversely, in a THC-dominant genotype (“DQ”), the lowest biomass was recorded at 15 ppm, followed by a progressive increase up to 240 ppm.
Building on these results, ref. [19], using the same genotypes and cultivation systems under short photoperiods, showed that limited potassium availability (15 mg L−1) restricted organ development. While inflorescence biomass remained stable across the range of 60 to 240 mg L−1, root and stem biomass responded positively to higher potassium levels in both genotypes.
In a different system, ref. [15] assessed potassium supplementation (75, 113, and 150 mg L−1) in an aquaponic setup and found that increasing potassium concentrations improved both inflorescence yield and harvest index in a THC-rich cultivar.
In summary, these findings collectively demonstrate that optimizing potassium nutrition is essential to promote biomass accumulation in C. sativa across multiple organs. They also reveal that exceeding a certain threshold does not yield further physiological benefits and may lead to inefficient resource use. This underscores the importance of tailoring potassium inputs to meet plant demands without over-fertilization, thereby enhancing both productivity and sustainability.
4.2. Nutrient Concentrations in C. sativa Organs
The accumulation of nitrogen, phosphorus, and potassium in plant tissues was strongly influenced by both external nutrient availability and the applied doses. Although nutrient concentrations increased with fertilization, the extent and distribution patterns varied among organs, reflecting differences in their physiological roles and nutritional requirements.
Nitrogen levels rose steadily in roots, stems, leaves, and inflorescences as nitrogen supply increased (Figure 4; Table 2). This response is consistent with findings by [7], who observed increased nitrogen content in foliage, roots, and stems during the vegetative stage when higher nitrogen concentrations were applied to the nutrient solution. As expected, leaves—being the primary sites of photosynthesis—accumulated considerable amounts of nitrogen. Notably, inflorescences also exhibited elevated nitrogen concentrations under high nitrogen availability, confirming their role as major nutrient sinks during the reproductive phase [10].
In contrast, phosphorus exhibited a distinct accumulation pattern. Root tissues showed the highest phosphorus content, particularly at elevated application rates. This distribution likely reflects the limited mobility of phosphorus in the phloem and its preferential storage in root cortical cells as globular deposits [20]. Nonetheless, phosphorus concentrations also increased in leaves and inflorescences with fertilization, reaching high levels even at moderate doses. Similar trends were reported by [13], who found that leaf phosphorus content doubled and inflorescence phosphorus rose by 70% when external supply was increased from 15 to 90 mg L−1. Additionally, studies on industrial hemp have indicated that 70–75% of absorbed phosphorus may accumulate in stem tissues [21], underscoring the influence of genotype and cultivation system on phosphorus distribution.
Potassium accumulation was highest in leaves, as observed in the present study and in line with previous research [19] reported a sharp increase in leaf potassium concentrations in response to potassium fertilization in both balanced and THC-dominant genotypes. Similarly, ref. [22] found that nitrogen and potassium primarily accumulated in leaves and inflorescences, while phosphorus was more concentrated in floral bracts. These patterns align with potassium’s well-established physiological roles in photosynthesis, stomatal regulation, and enzyme activation—functions particularly relevant in foliar and reproductive tissues.
4.3. Cannabinoids
4.3.1. Effect of Nitrogen on CBD and THC Concentration and Accumulation (mg Plant−1)
Nitrogen availability exerted a significant influence on the concentration of the primary phytocannabinoids—CBD and THC—in the CBD-dominant C. sativa cultivar evaluated in this study. As nitrogen supply increased, CBD concentration in the inflorescences rose, while THC concentration declined. This inverse relationship suggests that nitrogen may alter the metabolic flux within the cannabinoid biosynthetic pathway, favoring the production and accumulation of CBD over THC under higher nitrogen availability (Table 3).
These results support the hypothesis that nutrient supply can modulate secondary metabolism in C. sativa, potentially through mechanisms involving changes in gene expression or enzymatic activity within the cannabinoid biosynthetic network. However, evidence from the literature shows contrasting responses, indicating that the effects of nitrogen on cannabinoid composition are not consistent and may be influenced by factors such as genotype, cultivation system, developmental stage, and the chemical form of nitrogen applied.
For instance, ref. [14] observed that increasing nitrogen supply from 80 to 240 mg N L−1 under controlled conditions led to a reduction in CBD concentration at the highest dose (4.98%), compared to intermediate (5.36%) and low (5.29%) treatments. Similarly, ref. [23], in a field study, found that CBD levels were highest without fertilization and declined progressively with increasing nitrogen rates, whereas THC concentrations showed a positive correlation with nitrogen supply. Ref. [24] reported a quadratic response to nitrogen fertilization, with CBD and THC concentrations peaking at 115 and 116 kg N ha−1, respectively, before declining at higher doses [24]. In contrast, ref. [25] did not detect significant effects of nitrogen fertilization on cannabinoid concentrations in high-CBD cultivars under field conditions.
Ref. [10] further demonstrated bell-shaped response curves for THC, CBD, and CBN concentrations in both balanced and THC-rich genotypes, with maximum cannabinoid levels observed at 160 mg N L−1, followed by significant declines at both suboptimal and excessive nitrogen doses. In addition, their evaluation of nitrogen sources revealed that increasing the proportion of ammonium (NH4+) in the nutrient solution strongly reduced THC concentrations, particularly under 100% NH4+ nutrition. Although CBD levels were also negatively affected by ammonium-dominant conditions, the impact was less pronounced [26]. Collectively, these findings indicate that nitrogen availability influences not only biomass accumulation and yield, but also cannabinoid composition, likely through complex interactions involving carbon–nitrogen balance, hormonal signaling, and transcriptional regulation—processes that remain only partially understood.
Beyond cannabinoid concentration, nitrogen availability also had a clear impact on total cannabinoid accumulation per plant. In our study, both CBD and THC yields (expressed in mg plant−1) followed a non-linear trend, with the highest values obtained under moderate nitrogen supply. Specifically, the treatment with 5 g N, 2 g P, and 3 g K per plant resulted in maximum accumulation of CBD (520.2 mg plant−1) and THC (34.9 mg plant−1). In contrast, plants that received no fertilization or the highest nitrogen dose (10 g N plant−1) produced significantly lower amounts of cannabinoids (Table 3).
This response suggests a dual role for nitrogen: at optimal levels, it supports vegetative growth and reproductive development, thereby enhancing cannabinoid production. However, excessive nitrogen may suppress secondary metabolism, potentially due to metabolic shifts toward primary growth, competition for carbon skeletons, or feedback inhibition of key biosynthetic enzymes. Additional factors such as physiological stress, reduced harvest index, or accelerated senescence of reproductive organs under nutrient oversupply may also contribute to lower cannabinoid accumulation at high nitrogen doses.
These findings contrast with those of [14], who reported a continuous increase in CBD yield with rising nitrogen supply (80, 160, and 240 mg N L−1), reaching up to 1450 mg plant−1 at the highest dose under controlled conditions. Similarly, various field trials have shown a positive response of CBD yield to nitrogen fertilization, whether in a linear fashion [21,23,24] or according to a quadratic model with an optimal range between 130 and 200 kg N ha−1 [27]. Such discrepancies are likely related to genotypic variability, cultivation methods (e.g., soil-based vs. soilless), environmental conditions, and differences in fertilization regimes (e.g., timing, frequency, and nitrogen form).
In our study, the decline in cannabinoid yield at the highest nitrogen level likely reflects a combination of physiological imbalances and reduced allocation to reproductive structures. These results highlight the necessity of establishing cultivar-specific nitrogen thresholds to maximize both vegetative performance and cannabinoid productivity in C. sativa.
4.3.2. Effect of Phosphorus on CBD and THC Concentration
The role of phosphorus in regulating cannabinoid concentrations remains uncertain, as current evidence presents mixed outcomes. In the present study, phosphorus availability influenced both CBD and THC concentrations; however, no clear dose-dependent pattern was observed across the tested range. These results suggest that the impact of phosphorus on cannabinoid biosynthesis may be limited or highly context-dependent, potentially mediated by interactions with other nutrients, environmental factors, or the plant’s developmental stage.
This interpretation is supported by findings from [11], who reported no significant effect of phosphorus fertilization on CBD or THC concentrations in a high-CBD genotype grown under controlled conditions. Similarly, ref. [13], working in a hydroponic system, observed that increasing phosphorus levels from 15 to 90 mg L−1 had no measurable effect on cannabinoid concentrations. Ref. [22] also found no significant changes in THC or CBD content when phosphorus was applied alone or in combination with nitrogen and potassium in a greenhouse setting.
In contrast, ref. [8] reported a significant reduction in the concentrations of Δ9-tetrahydrocannabinolic acid (THCA) and cannabidiolic acid (CBDA) in the inflorescences of THC-rich and balanced genotypes when phosphorus supply exceeded 5 mg L−1 under controlled conditions. The authors attributed this decline not to a direct inhibition of cannabinoid biosynthesis, but rather to a dilution effect caused by increased biomass accumulation.
Phosphorus may influence cannabinoid concentrations primarily through indirect mechanisms. By affecting vegetative and reproductive growth—such as altering biomass allocation and sink strength—phosphorus may shape cannabinoid profiles without directly regulating gene expression or enzyme activity in the biosynthetic pathway. To clarify these relationships, future research should incorporate transcriptomic, metabolomic, or enzymatic profiling to better understand the physiological and molecular mechanisms linking phosphorus availability to cannabinoid production in C. sativa.
4.3.3. Effect of Potassium on CBD and THC Concentration
In this study, potassium fertilization exerted a limited and inconsistent effect on cannabinoid concentrations in the inflorescences. Although minor variations in CBD and THC percentages were detected among treatments, these differences were not statistically significant and lacked the consistency observed in response to nitrogen fertilization. This suggests that, despite potassium’s fundamental role in plant physiological processes, it may not be a key regulatory factor in cannabinoid biosynthesis within the concentration range tested (Table 3).
These findings align with previous research. For example, ref. [23] reported that increasing potassium application in a high-CBD cultivar under field conditions had no significant impact on CBD yield or cannabinoid concentrations. Likewise, ref. [19] found no significant changes in CBD or THC levels in either THC-rich or balanced chemotypes cultivated under controlled conditions, even when potassium availability varied widely from 15 to 240 mg·L−1 [19].
Nevertheless, some studies have reported divergent outcomes. Ref. [17] observed that the use of a slow-release potassium fertilizer enriched with plant growth-promoting microorganisms increased THC concentrations and significantly reduced CBD levels in a CBD-dominant cultivar grown under tropical conditions. Conversely, conventional potassium fertilization, particularly at 129 ppm, promoted CBD accumulation over THC. These contrasting results suggest that not only potassium dose, but also formulation, release dynamics, and mode of application may influence cannabinoid composition.
Potassium on secondary metabolism in C. sativa are highly context-dependent, potentially influenced by interactions with other nutrients, microbial communities, or environmental factors such as temperature, light intensity, and substrate characteristics. Within the parameters of the present study, however, potassium supply had a relatively minor influence on the relative concentrations of CBD and THC, suggesting that K availability is not a primary determinant of cannabinoid biosynthetic activity under the tested conditions.
4.3.4. Effect of Phosphorus and Potassium on Total CBD and THC Accumulation (mg Plant−1)
The effects of phosphorus and potassium on total cannabinoid accumulation per plant were less consistent and less pronounced than those observed for nitrogen, although certain patterns did emerge. In the present study, intermediate application rates of phosphorus (2–3 g plant−1) and potassium (3–5 g plant−1) produced the highest CBD and THC yields. In contrast, both nutrient omission and excessive fertilization were associated with reduced cannabinoid accumulation (Table 3).
These results are partially consistent with those of [8], who reported that increasing phosphorus availability enhanced total cannabinoid content (CBD + THC) in both THC-rich and balanced chemotypes cultivated under controlled conditions. This suggests that phosphorus may contribute to increased sink strength or enhanced biosynthetic activity in the inflorescences, although such effects likely depend on the balance between vegetative growth and reproductive resource allocation.
In contrast, the impact of potassium fertilization on cannabinoid yield has been more varied, particularly in field-based studies. For example, James et al. (2023), working with a CBD-rich cultivar, found no significant relationship between potassium dose and CBD yield per hectare [24]. Similarly, ref. [9] observed that modifying the NPK ratio in hydroponic nutrient solutions had no effect on THC concentrations or total cannabinoid yield in THC-dominant cultivars. These discrepancies may be attributed to variation in fertilizer formulation, application methods and timing, genotype-specific responses, or environmental factors such as light intensity, temperature, and substrate properties.
In our study, the highest phosphorus and potassium treatments (6 g plant−1 each) did not improve cannabinoid production; instead, they were associated with reductions in both inflorescence biomass and cannabinoid concentration. This finding supports the hypothesis that excessive macronutrient supply may negatively affect secondary metabolism, either through dilution effects linked to rapid biomass accumulation or through stress-induced physiological responses that downregulate biosynthetic pathways.
While sufficient phosphorus and potassium availability is necessary to support cannabinoid biosynthesis, over-fertilization with either nutrient can be detrimental, diminishing both biomass production and cannabinoid yield. These findings underscore the importance of optimizing macronutrient doses in the cultivation of high-CBD C. sativa to maximize phytochemical output while maintaining plant health and resource use efficiency.
4.4. Nutrient Balance
The nutrient balance analysis revealed distinct patterns associated with the type and rate of fertilization, offering valuable insights into nutrient demand, uptake efficiency, and potential over- or undersupply throughout the crop cycle (Table 4). Phosphorus consistently exhibited a negative balance across all fertilized treatments, indicating substantial uptake by the plant with no evidence of substrate saturation. This pattern aligns with the elevated phosphorus concentrations observed in leaves and inflorescences, reinforcing the role of these organs as principal sinks for phosphorus during the reproductive phase. The absence of positive phosphorus balances—even at the highest application rates—suggests a pronounced demand for this element in C. sativa, emphasizing the need to monitor its availability closely, especially in prolonged or successive cultivation cycles, to prevent nutrient depletion.
In contrast, nitrogen showed both positive and negative balances depending on the treatment. Surpluses were particularly evident in the treatments receiving the highest nitrogen inputs (e.g., D2 T1, D2 T2, D3 T1, D3 T2), pointing to reduced uptake efficiency or possible substrate saturation. This diminished efficiency could help explain the declines observed in both biomass production and cannabinoid yield under excessive nitrogen supply, as exemplified by treatment D3 T2. These outcomes are consistent with prior reports in Cannabis and other crops, where over-fertilization is associated with reduced nitrogen use efficiency (NUE), potentially impairing reproductive development and compromising the biosynthesis of secondary metabolites [19,24].
Potassium balances were predominantly negative, except in treatment D1 T2. The substantial removal of potassium from the substrate is consistent with its high accumulation in leaves and inflorescences—tissues known for their intense metabolic activity and osmoregulatory roles. These results underscore the necessity of ensuring adequate potassium availability during the peak reproductive phase to support cannabinoid biosynthesis, metabolite transport, and overall physiological function.
To our knowledge, this is among the first studies to report nutrient balance data for C. sativa grown under controlled environmental conditions, thereby providing a reference framework for future optimization strategies. Nonetheless, these findings should be interpreted with caution, given the current lack of standardized reference values for nutrient balances in this species. Comparative insights may be drawn from other intensive horticultural systems, where negative balances of phosphorus and potassium are commonly reported during flowering, and nitrogen use efficiency typically declines under conditions of high input or substrate saturation [28].
Future studies should aim to integrate nutrient dynamics across phenological stages, incorporating assessments of plant nutrient uptake, substrate retention capacity, and environmental interactions. Such integrative approaches are essential for refining fertilization regimes and improving the sustainability and precision of medicinal cannabis production systems.
4.5. Susceptibility to Fusarium spp.
In the present study, plants subjected to the highest nutrient input regime (D3 T3) experienced complete mortality before reaching the end of the reproductive stage. The symptomatic profile—characterized by stem necrosis, leaf chlorosis, and the emergence of mycelial growth from vascular tissues (Figure 2)—was consistent with vascular wilt caused by Fusarium spp. These observations suggest that excessive fertilization may predispose C. sativa to infections by soil-borne fungal pathogens.
The link between elevated nutrient availability—particularly nitrogen—and increased susceptibility to root and vascular pathogens is well established; however, this is the first report of such an association in C. sativa. Ref. [29] demonstrated that high nitrogen levels can intensify the severity of fungal diseases, including Fusarium-induced wilts, by inducing physiological and biochemical alterations in plant tissues that enhance pathogen colonization. Beyond host-level changes, nutrient oversupply can disrupt the composition and functional diversity of the rhizosphere microbiome, diminishing populations of beneficial microorganisms and fostering conditions that favor pathogenic proliferation [30].
Additional support for this hypothesis comes from studies showing that over-fertilization can lead to the accumulation of nitrogen-rich metabolites in plant tissues, which may serve as substrates for hemibiotrophic and necrotrophic pathogens such as Fusarium spp. [29]. The impact of nitrogen on disease development varies depending on the trophic strategy of the pathogen. According to [31], obligate biotrophs tend to exhibit heightened virulence under high nitrogen regimes, while facultative pathogens may display reduced aggressiveness under similar conditions.
Other macronutrients also play important roles in modulating disease resistance. Potassium has been reported to enhance plant defense responses up to a certain physiological threshold, beyond which no additional protective effects are observed. In contrast, phosphorus exhibits more variable effects, with its influence on disease resistance being highly context-dependent and inconsistent across different crop–pathogen systems [31].
Moreover, the chemical form of nitrogen supplied is a critical factor in shaping plant susceptibility. Nitrate-based (NO3−) nutrition is generally associated with the activation of defense-related pathways, whereas ammonium-based (NH4+) fertilization has been linked to increased disease susceptibility [32]. For example, in banana cultivation, elevated ammonium inputs have been shown to exacerbate Fusarium wilt by disrupting the rhizosphere microbial community, inducing plant stress responses, and suppressing immune signaling pathways [33]. However, the relationship between nitrogen nutrition and disease resistance is not universally consistent. In tomato, both increases and decreases in susceptibility to Fusarium oxysporum have been reported, depending on the nitrogen source, timing of application, and plant genotype [34].
Within the context of C. sativa cultivation, these findings underscore the importance of integrating nutrient management with plant health strategies. Preventing over-fertilization is essential not only for optimizing vegetative growth and cannabinoid yield but also for minimizing the risk of opportunistic infections by pathogens such as Fusarium spp. Future studies should prioritize the investigation of interactions between fertilization practices, rhizosphere microbial dynamics, and immune signaling pathways in C. sativa, with the goal of developing more resilient and sustainable production systems.
It is important to note that the present study was conducted under controlled environmental conditions using a commercial soilless substrate. This approach allowed for precise nutrient management and minimized external variability. However, nutrient dynamics in soil-based or open-field systems may differ significantly due to factors such as soil heterogeneity, organic matter content, cation exchange capacity, microbial biodiversity, and water availability. These variables can substantially influence nutrient uptake efficiency, plant physiological responses, and pathogen susceptibility. Therefore, the conclusions and recommendations presented here are specific to soilless cultivation systems and should be validated under field conditions or alternative production scenarios before being extrapolated to commercial-scale operations.
4.6. Limitations and Future Perspectives
Although this study provides valuable insights into the effects of nitrogen, phosphorus, and potassium fertilization on biomass accumulation and cannabinoid production in C. sativa, several important aspects remain unresolved. Future research should investigate the interactions between nutrient imbalances and biotic stressors—particularly Fusarium spp.—a pathogen of increasing relevance in cannabis cultivation that may interact with plant nutritional status, thereby compromising both productivity and quality.
Moreover, generalized recommendations for potassium supplementation during the reproductive phase warrant critical re-evaluation, as they are not always supported by robust experimental evidence. Effective nutrient management strategies must be grounded in a comprehensive assessment of the substrate’s baseline nutrient composition, along with the specific requirements of each cultivar and developmental stage.
Lastly, further investigations should examine how fertilization regimes can be adjusted to influence cannabinoid profiles—especially the concentration of Δ9-THC in high-CBD cultivars. This is particularly important in the context of regulatory frameworks, where maintaining THC levels below legal thresholds is essential for market compliance in many jurisdictions.
5. Conclusions
This study highlights the intrinsic complexity of nutrient management in C. sativa L., demonstrating that plant responses to fertilization are governed by a multifaceted interplay of factors—including genotype, cultivation environment, and nutrient dosage. Biomass allocation among plant organs, as well as cannabinoid concentration and accumulation, were significantly influenced by the fertilization regime, underscoring the need for cultivar-specific and context-responsive nutrient management strategies.
A particularly notable finding was the relative stability of the harvest index (HI) across treatments, suggesting limited plasticity in biomass partitioning toward reproductive structures. This implies that enhanced vegetative growth does not necessarily translate into proportional increases in floral biomass—an important consideration when selecting genotypes for intensive production systems aimed at maximizing inflorescence yield.
Furthermore, both the absolute amount (mg plant−1) and the concentration (% w/w) of cannabidiol (CBD) emerged as key performance indicators in defining cultivation goals. While increased vegetative vigor can lead to higher total cannabinoid production, CBD concentration may plateau or even decline under high fertilization inputs, likely due to dilution effects, carbon–nutrient imbalances, or feedback inhibition within secondary metabolic pathways.
Our results underscore the importance of designing fertilization strategies aligned with clearly defined production objectives—whether focused on maximizing total biomass, enhancing cannabinoid concentration, or optimizing a balance between both. The integration of agronomic and phytochemical parameters into fertilization planning will be essential for advancing sustainable and high-efficiency cultivation of CBD-rich C. sativa.
In relation to the initial hypotheses, the results of this study provide partial confirmation of both. Fertilization with nitrogen, phosphorus, and potassium significantly influenced plant morphophysiology, particularly in terms of biomass accumulation and cannabinoid content. However, the observed stability of the harvest index suggests that increased vegetative biomass does not necessarily correspond to a higher allocation to reproductive organs. Additionally, nutrient availability was linked not only to phytochemical outcomes, such as CBD content, but also to plant health, as excessive fertilization increased susceptibility to fungal pathogens. These results reinforce the importance of maintaining a balanced nutrient supply to optimize both yield and quality in C. sativa cultivation.
Based on the outcomes of this study, an optimal fertilization range was identified for maximizing both yield and cannabinoid quality in substrate-grown plants under controlled environmental conditions: approximately 5 g nitrogen per plant, 2–3 g phosphorus per plant, and 3–5 g potassium per plant. Nutrient inputs beyond these thresholds failed to enhance productivity or phytochemical performance and were instead associated with increased susceptibility to fungal pathogens—particularly Fusarium spp.—highlighting the potential risks of over-fertilization.
It is essential to note that these recommendations are specific to the controlled-environment, soilless system evaluated in this study. As such, site-specific calibration and validation under diverse cultivation conditions and management systems are necessary before broader commercial implementation.
Supplementary Materials
The following supporting information can be downloaded at: https://www.mdpi.com/article/10.3390/ijpb16030092/s1.
Author Contributions
Conceptualization, M.S., G.B., M.D., and J.M.Z.; methodology, M.S., G.B., M.D., and J.M.Z.; validation, M.S., G.B., M.D., and J.M.Z.; formal analysis, M.S., G.B., M.D., and J.M.Z.; investigation, M.S., G.B., M.D., and J.M.Z.; resources, M.S., G.B., M.D., and J.M.Z.; data curation, M.S., G.B., M.D., and J.M.Z.; writing—original draft preparation, M.S.; writing—review and editing, G.B., M.D., and J.M.Z.; visualization, M.S., G.B., M.D., and J.M.Z.; supervision, G.B. and J.M.Z.; project administration, J.M.Z.; funding acquisition, M.D. and J.M.Z. All authors have read and agreed to the published version of the manuscript.
Funding
This research was funded by the project “Characterization of Cannabis sativa L. germplasm for medicinal use in the province of Santa Fe” financed by ASaCTeI (Project Code: PEIC I+D 2021-175), and by the agreement “Evaluation and development of medicinal cannabis varieties” between CONICET, UNL, and the company ENERSIT (Agreement No. CONVE-2021-90098955-APN-GVT%CONICET).
Data Availability Statement
The raw data supporting the conclusions of this article will be made available by the authors on request.
Conflicts of Interest
The authors declare no conflicts of interest.
References
- Li, H.L. An Archaeological and Historical Account of Cannabis in China. Econ. Bot. 1974, 28, 437–448. [Google Scholar] [CrossRef]
- Abel, E.L. Marihuana: The First Twelve Thousand Years; Springer: New York, NY, USA, 2013. [Google Scholar]
- Pertwee, R. The Diverse CB1 and CB2 Receptor Pharmacology of Three Plant Cannabinoids: Δ9-Tetrahydrocannabinol, Cannabidiol and Δ9-Tetrahydrocannabivarin. Br. J. Pharmacol. 2008, 153, 199–215. [Google Scholar] [CrossRef]
- Devinsky, O.; Cross, J.H.; Laux, L.; Marsh, E.; Miller, I.; Nabbout, R.; Scheffer, I.E.; Thiele, E.A.; Wright, S. Trial of Cannabidiol for Drug-Resistant Seizures in the Dravet Syndrome. N. Engl. J. Med. 2017, 376, 2011–2020. [Google Scholar] [CrossRef]
- Blessing, E.M.; Steenkamp, M.M.; Manzanares, J.; Marmar, C.R. Cannabidiol as a Potential Treatment for Anxiety Disorders. Neurotherapeutics 2015, 12, 825–836. [Google Scholar] [CrossRef]
- Wylie, S.E.; Ristvey, A.G.; Fiorellino, N.M. Fertility Management for Industrial Hemp Production: Current Knowledge and Future Research Needs. GCB Bioenergy 2021, 13, 517–524. [Google Scholar] [CrossRef]
- Saloner, A.; Bernstein, N. Response of Medical Cannabis (Cannabis sativa L.) to Nitrogen Supply under Long Photoperiod. Front. Plant Sci. 2020, 11, 592119. [Google Scholar] [CrossRef] [PubMed]
- Shiponi, S.; Bernstein, N. The Highs and Lows of P Supply in Medical Cannabis: Effects on Cannabinoids, the Ionome, and Morpho-Physiology. Front. Plant Sci. 2021, 12, 657323. [Google Scholar] [CrossRef]
- Bevan, L.; Jones, M.; Zheng, Y. Optimisation of Nitrogen, Phosphorus, and Potassium for Soilless Production of Cannabis sativa in the Flowering Stage Using Response Surface Analysis. Front. Plant Sci. 2021, 12, 764103. [Google Scholar] [CrossRef] [PubMed]
- Saloner, A.; Bernstein, N. Nitrogen Supply Affects Cannabinoid and Terpenoid Profile in Medical Cannabis (Cannabis sativa L.). Ind. Crops Prod. 2021, 167, 113516. [Google Scholar] [CrossRef]
- Westmoreland, F.M.; Bugbee, B. Sustainable Cannabis Nutrition: Elevated Root-Zone Phosphorus Significantly Increases Leachate P and Does Not Improve Yield or Quality. Front. Plant Sci. 2022, 13, 1015652. [Google Scholar] [CrossRef]
- Di Rienzo, J.A.; Casanoves, F.; Balzarini, M.G.; González, L.; Tablada, M.; Robledo, C.W. InfoStat; Versión 2020. Centro de Transferencia InfoStat, FCA, Universidad Nacional de Córdoba: Argentina. Available online: http://www.infostat.com.ar (accessed on 6 June 2025).
- Hershkowitz, J.A.; Westmoreland, F.M.; Bugbee, B. Elevated Root-Zone P and Nutrient Concentration Do Not Increase Yield or Cannabinoids in Medical Cannabis. Front. Plant Sci. 2025, 16, 1433985. [Google Scholar] [CrossRef]
- Massuela, D.C.; Munz, S.; Hartung, J.; Nkebiwe, P.M.; Graeff-Hönninger, S. Cannabis Hunger Games: Nutrient stress induction in flowering stage—Impact of organic and mineral fertilizer levels on biomass, cannabidiol (CBD) yield and nutrient use efficiency. Front. Plant Sci. 2023, 14, 1233232. [Google Scholar] [CrossRef]
- Yep, B.; Zheng, Y. Potassium and micronutrient fertilizer addition in a mock aquaponic system for drug-type Cannabis sativa L. cultivation. Can. J. Plant Sci. 2020, 101, 341–352. [Google Scholar] [CrossRef]
- Cockson, P.; Schroeder-Moreno, M.; Veazie, P.; Barajas, G.; Logan, D.; Davis, M.; Whipker, B.E. Impact of Phosphorus on Cannabis sativa Reproduction, Cannabinoids, and Terpenes. Appl. Sci. 2020, 10, 7875. [Google Scholar] [CrossRef]
- De Prato, L.; Ansari, O.; Hardy, G.E.S.J.; Howieson, J.; O’Hara, G.; Ruthrof, K.X. Morpho-Physiology and Cannabinoid Concentrations of Hemp (Cannabis sativa L.) Are Affected by Potassium Fertilisers and Microbes under Tropical Conditions. Ind. Crops Prod. 2022, 182, 114907. [Google Scholar] [CrossRef]
- Saloner, A.; Sacks, M.M.; Bernstein, N. Response of Medical Cannabis (Cannabis sativa L.) Genotypes K Supply Under Long Photoperiod. Front. Plant Sci. 2019, 10, 1369. [Google Scholar] [CrossRef] [PubMed]
- Saloner, A.; Bernstein, N. Effect of Potassium (K) Supply on Cannabinoids, Terpenoids and Plant Function in Medical Cannabis. Agronomy 2022, 12, 1242. [Google Scholar] [CrossRef]
- Ryan, M.H.; Kaur, P.; Nazeri, N.K.; Clode, P.L.; Keeble-Gagnère, G.; Doolette, A.L.; Smernik, R.J.; Van Aken, O.; Nicol, D.; Maruyama, H.; et al. Globular Structures in Roots Accumulate Phosphorus to Extremely High Concentrations Following Phosphorus Addition. Plant Cell Environ. 2019, 42, 1987–2002. [Google Scholar] [CrossRef] [PubMed]
- Finnan, J.; Burke, B. Potassium Fertilization of Hemp (Cannabis sativa). Ind. Crops Prod. 2013, 41, 419–422. [Google Scholar] [CrossRef]
- Bernstein, N.; Gorelick, J.; Zerahia, R.; Koch, S. Impact of N, P, K, and Humic Acid Supplementation on the Chemical Profile of Medical Cannabis (Cannabis sativa L). Front. Plant Sci. 2019, 10, 736. [Google Scholar] [CrossRef]
- Panday, D.; Acharya, B.S.; Bhusal, N.; Afshar, R.K.; Smith, A.; Ghalehgolabbehbahani, A. Precision Nitrogen Management for Optimal Yield and Cannabinoid Profile in CBD Hemp. Agrosyst. Geosci. Environ. 2024, 8, e70028. [Google Scholar] [CrossRef]
- James, M.S.; Vann, M.C.; Suchoff, D.H.; McGinnis, M.; Whipker, B.E.; Edmisten, K.L.; Gatiboni, L.C. Hemp Yield and Cannabinoid Concentrations under Variable Nitrogen and Potassium Fertilizer Rates. Crop Sci. 2023, 63, 1555–1565. [Google Scholar] [CrossRef]
- Farnisa, M.M.; Miller, G.C.; Solomon, J.K.Q.; Barrios-Masias, F.H. Floral Hemp (Cannabis sativa L.) Responses to Nitrogen Fertilization under Field Conditions in the High Desert. PLoS ONE 2023, 18, e0284537. [Google Scholar] [CrossRef]
- Saloner, A.; Bernstein, N. Nitrogen Source Matters: High NH4/NO3 Ratio Reduces Cannabinoids, Terpenoids, and Yield in Medical Cannabis. Front. Plant Sci. 2022, 13, 830224. [Google Scholar] [CrossRef]
- Atoloye, I.A.; Adesina, I.; Shahbazi, A.; Bhowmik, A. Response of cannabidiol hemp (Cannabis sativa L.) varieties grown in the southeastern United States to nitrogen fertilization. Open Agric. 2022, 7, 373–381. [Google Scholar] [CrossRef]
- Rathke, G.W.; Behrens, T.; Diepenbrock, W. Integrated nitrogen management strategies to improve seed yield, oil content and nitrogen efficiency of winter oilseed rape (Brassica napus L.): A review. Agric. Ecosyst. Environ. 2006, 117, 80–108. [Google Scholar] [CrossRef]
- Veresoglou, S.D.; Barto, E.K.; Menexes, G.; Rillig, M.C. Fertilization affects severity of disease caused by fungal plant pathogens. Plant Pathol. 2013, 62, 961–969. [Google Scholar] [CrossRef]
- Yang, L.; Han, W.; Tan, B.; Wu, Y.; Li, S.; Yi, Y. Effects of Nutrient Accumulation and Microbial Community Changes on Tomato Fusarium Wilt Disease in Greenhouse Soil. Sustainability 2024, 16, 7756. [Google Scholar] [CrossRef]
- Dordas, C. Role of nutrients in controlling plant diseases in sustainable agriculture: A review. Agron. Sustain. Dev. 2008, 28, 33–46. [Google Scholar] [CrossRef]
- Mur, L.A.J.; Simpson, C.; Kumari, A.; Gupta, A.K.; Gupta, K.J. Moving nitrogen to the centre of plant defence against pathogens. Ann. Bot. 2017, 119, 703–709. [Google Scholar] [CrossRef]
- Orr, R.; Dennis, P.G.; Wong, Y.; Browne, D.J.; Cooper, M.; Birt, H.W.G.; Nelson, P.N. Nitrogen fertilizer rate but not form affects the severity of Fusarium wilt in banana (Fusarium oxysporum f. sp. cubense). Front. Plant Sci. 2022, 13, 907819. [Google Scholar] [CrossRef] [PubMed]
- Hoffland, E.; Jeger, M.J.; van Beusichem, M.L. Effect of nitrogen supply rate on disease resistance in tomato depends on the pathogen. Plant Soil 2000, 218, 239–247. [Google Scholar] [CrossRef]
Disclaimer/Publisher’s Note: The statements, opinions and data contained in all publications are solely those of the individual author(s) and contributor(s) and not of MDPI and/or the editor(s). MDPI and/or the editor(s) disclaim responsibility for any injury to people or property resulting from any ideas, methods, instructions or products referred to in the content. |
© 2025 by the authors. Licensee MDPI, Basel, Switzerland. This article is an open access article distributed under the terms and conditions of the Creative Commons Attribution (CC BY) license (https://creativecommons.org/licenses/by/4.0/).