Article

Salinity-Induced VOC Modulation and Physiological Adaptations in Adenosma indiana

by
Jinnawat Manasathien
1,
Woraporn Laojinda
2 and
Piyanut Khanema
2,3,*
1
Program of Biology, Faculty of Science and Technology, Nakhon Ratchasima Rajabhat University, Nakhon Ratchasima 30000, Thailand
2
Department of Biology, Faculty of Science, Mahasarakham University, Maha Sarakham 44150, Thailand
3
Isan Saline Soil Research Unit (ISSRU), Faculty of Science, Mahasarakham University, Maha Sarakham 44150, Thailand
*
Author to whom correspondence should be addressed.
Int. J. Plant Biol. 2025, 16(1), 36; https://doi.org/10.3390/ijpb16010036
Submission received: 21 February 2025 / Revised: 12 March 2025 / Accepted: 15 March 2025 / Published: 19 March 2025

Abstract

:
Saline environments shape plant metabolism, driving ecological and biochemical adaptations. This study investigated the impact of salinity on Adenosma indiana (Indian scent-wort), a medicinal herb known for its volatile organic compounds (VOCs) and anti-inflammatory and antimicrobial properties, to elucidate its adaptive strategies. During the flowering stage, samples were collected from four saline microhabitats in Kalasin Province, Thailand. We analyzed soil properties, plant growth, photosynthetic pigments, compatible solutes (anthocyanins, proline, total sugars), and elemental concentrations (K, Na, Ca, Mg) across different tissues. Results showed that A. indiana maintained stable growth while enhancing chlorophyll and β-carotene levels under increasing salinity. GC-MS identified 47 VOCs, including 3-cyclopenten-1-one (first reported in this species) and β-bisabolene, both strongly linked to soil salinity. In low-salinity soils, leaves accumulated high sodium, inducing osmoprotectants (proline, total sugars) and VOCs (D-limonene, α-pinene, terpinolene, 1-octen-3-ol) in peltate glandular trichomes. Conversely, in high-salinity soils, lower leaf sodium levels were associated with increased β-bisabolene and β-caryophyllene production, suggesting distinct biochemical pathways. These findings reveal salinity-driven VOC modulation in A. indiana, highlighting its adaptive potential for medicinal applications in saline environments and its role as a source of salt-tolerant bioactive compounds.

Graphical Abstract

1. Introduction

Plants inhabiting saline environments face significant physiological and metabolic challenges, necessitating specialized adaptations to maintain growth and functionality. Many plants mitigate salt-induced stress by regulating ion homeostasis, enhancing osmotic adjustment, optimizing photosynthetic processes, and increasing the production of secondary metabolites, including volatile organic compounds (VOCs). VOCs play a dual role in enhancing plant resilience to environmental stressors and functioning as bioactive molecules with therapeutic potential [1,2,3]. In medicinal plants, VOCs such as terpenes and ketones contribute to antioxidant, anti-inflammatory, and antimicrobial activities, highlighting their ecological and pharmacological significance [1,4,5].
Adenosma indiana (Lour.) Merr., commonly known as Indian scent-wort, is a Southeast Asian medicinal herb valued for its anti-inflammatory, antimicrobial, and antioxidant properties. These therapeutic effects are attributed to its essential oils, which are rich in bioactive monoterpenes (e.g., α-limonene, fenchone, 1,8-cineole, terpinolene, α-pinene, and piperitenone oxide) and sesquiterpenes (e.g., cedrol, α-caryophyllene, and β-caryophyllene) [6,7,8,9,10]. Traditionally used in herbal medicine and skincare, these oils exhibit potent antioxidant, antibiotic, antiviral, and anti-inflammatory properties, making A. indiana valuable in both traditional and modern medicinal applications [11,12].
Previous studies have shown that A. indiana thrives in saline environments, suggest-ing that salinity may enhance the production of key VOCs, such as D-limonene, which contribute to its medicinal properties [13]. This species has been reported in saline soil zones, particularly in Yang Talat District, Kalasin Province, and Borabue District, Maha Sarakham Province in northeastern Thailand [14,15]. These regions are influenced by rock salt deposits from the Maha Sarakham Formation, where interlacing layers of rock salt and sedimentary rocks contribute to significant soil salinity. In some areas, rock salt infiltrates salt domes, leading to substantial salt deposits on the soil surface [16,17]. This unique geological background creates a challenging environment for plant growth, particularly for salt-sensitive species. However, A. indiana appears to have developed physiological and biochemical adaptations that allow it to persist in these saline conditions. Despite these adaptations, the mechanisms linking salinity to changes in VOC profiles and the potential bioactivity of A. indiana remain poorly understood, highlighting the need for further investigation.
This study explores the adaptive responses of A. indiana to saline microhabitats, emphasizing how soil and plant-accumulated salts affect growth, photosynthetic pigments, compatible solutes, and VOC synthesis within glandular trichomes. The primary aim is to evaluate how salinity influences the plant’s VOC profiles, providing insights into its eco-logical and biochemical adaptations. While some VOCs may hold medicinal significance, this study focuses on understanding the broader relationship between salinity and changes in volatile emissions.

2. Materials and Methods

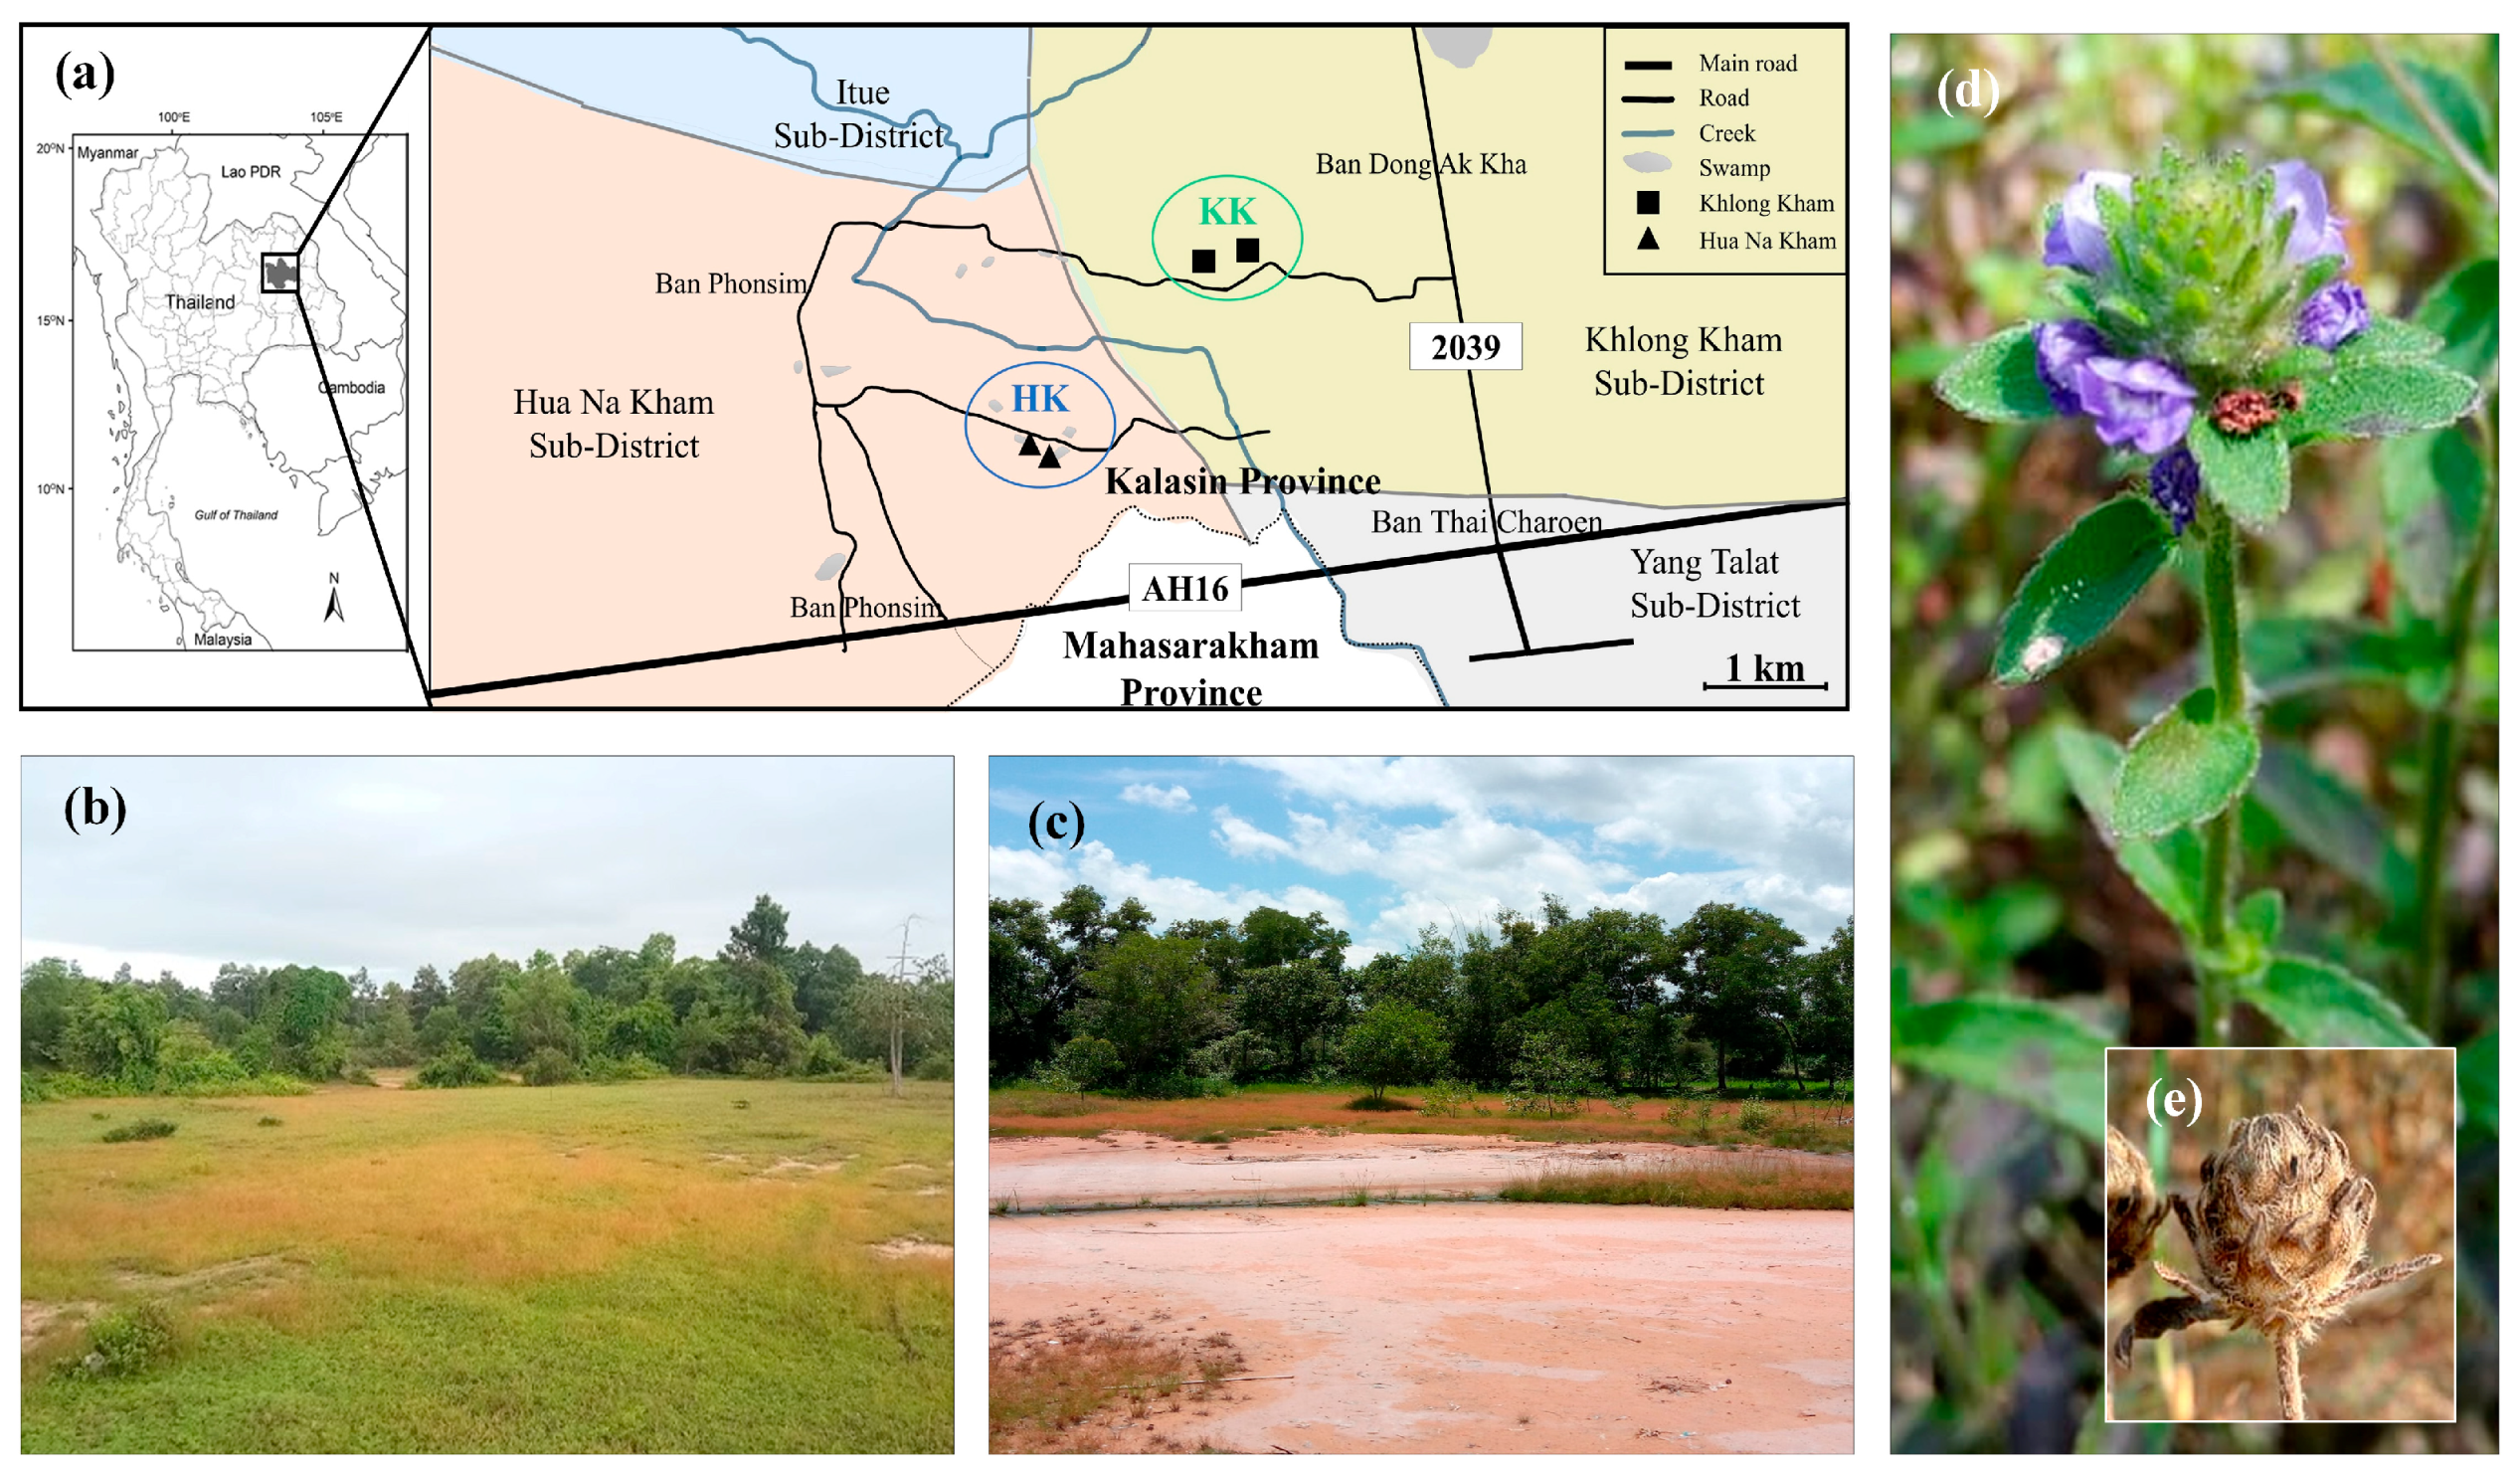
2.1. Study Site Selection and Experimental Design

This study was conducted in February 2024, during the flowering stage of A. indiana, at the previously investigated saline habitats of Khlong Kham (KK) (16°24′19.1″ N, 103°17′10.6″ E) and Hua Na Kham (HK) (16°23′52.4″ N, 103°16′46.5″ E) in Kalasin Province, Thailand (Figure 1). These sites, characterized by slightly to strongly saline soils, have a history of salt boiling and consistent salt precipitation on the soil surface. Each habitat was divided into two sub-sites (KK1, KK2, HK1, and HK2) to capture microenvironmental variability.
Within each sub-site, three 5 × 5 m quadrats were randomly selected to sample soil and plant material. From the seedling stage in July 2023 to flowering in February 2024, the region experienced an average maximum temperature of 34.34 °C and a minimum of 19.29 °C. The average monthly rainfall during this period was 144.12 mm, with the highest recorded rainfall occurring in July (482.20 mm) (data provided by the Upper Northeastern Meteorological Center, Bangkok, Thailand).

2.2. Soil Physicochemical Analysis

In each quadrat, ten soil samples were collected from 0–25 cm depth using a composite sampling method to ensure representative data. Soil moisture content and electrical conductivity of saturated soil extracts (ECe) were measured following the guidelines of the Land Development Department [18,19]. Soil moisture was determined by drying samples at 105 °C to a constant weight. Soil pH and ECe were measured by saturating soil samples with distilled water and obtaining pH and ECe values using a pH meter and EC meter, respectively.
Soil organic matter (SOM) content was assessed using the Walkley–Black method [20] to provide insights into soil fertility. Soil elemental concentrations (K, Na, Ca, and Mg) and the sodium adsorption ratio (SAR) were analyzed according to Land Development Department guidelines [18] and calculated using Equation (1). Exchangeable cations were extracted using ammonium acetate and quantified by atomic absorption spectroscopy (Agilent 200 Series 280FSAA, Agilent Technology Co., Ltd., Santa Clara, CA, USA). Chloride levels were determined using the Mohr titration, following Sheen and Kahler [21].
S A R = N a ( C a + M g ) / 2

2.3. Plant Sample Collection and Preparation

Plant samples were collected from the quadrats and divided into three sections: (i) fresh specimens were prepared for species identification and cataloged at Chulalongkorn University’s Professor Kasin Suvatabhundhu Herbarium (BCU) under the code A 17735 BCU to ensure accurate taxonomic classification; (ii) fresh samples were allocated for measurements of plant growth and elemental concentrations in plant tissues; and (iii) fresh leaves were prepared for analyses of photosynthetic pigments, compatible solutes, glandular trichome morphology and density, and VOCs. For VOC analysis, fresh leaves were dried at 40 °C and stored in airtight containers to preserve volatile compounds until further processing.

2.4. Plant Growth Analysis

To evaluate plant growth, stem height and leaf area were randomly measured, and fresh and dry weights were recorded for each sample to calculate biomass percentage. These metrics provided a basis for assessing growth responses to salinity conditions in each habitat.

2.5. Elemental Concentration Analysis in Plant Tissues

Dried plant samples were separated into roots, stems, leaves, and inflorescences to assess elemental accumulation in response to soil salinity. Each tissue type was digested in a nitric and perchloric acid solution following AOAC Official Method 975.03 [22]. Elemental concentrations were then determined using atomic absorption spectroscopy (Agilent 200 Series 280FSAA), providing insights into the plant’s elemental regulation mechanisms under saline conditions.

2.6. Photosynthetic Pigment Analysis

Photosynthetic pigments, including chlorophyll and β-carotene, were analyzed following the method of Costache et al. [23] to assess plant responses to salinity. Leaf samples were ground and extracted with an 80% acetone solution at a plant-to-solvent ratio 1:50 (w/v). The absorbance of the pigment extract was measured at wavelengths 470, 645, and 662 nm using a spectrophotometer. Pigment concentrations were calculated using the following equations:
Chlorophyll a = 11.75A662 − 2.35A645,
Chlorophyll b = 18.61A645 − 3.96A662,
Total chlorophyll = 7.79A662 + 16.26A645,
β-carotene = (1000A470 − 2.27Chl.a − 81.4Chl.b)/227,

2.7. Compatible Solute Analysis

Compatible solutes, anthocyanins, proline, and total sugar were quantified to evaluate osmotic stress tolerance and antioxidative responses in A. indiana leaves under varying salinity levels. Anthocyanin concentration was determined by the pH differential method according to AOAC Official Method 2005.02 [24], with absorbance readings at 520 and 700 nm. Proline content was measured following the acid ninhydrin method of Bates et al. [25], where samples were reacted with acid ninhydrin and glacial acetic acid, heated, and absorbance was measured at 520 nm. Total sugars were quantified using the phenol-sulfuric acid [26], with absorbance recorded at 490 nm.

2.8. Morphological Characterization and Density Analysis of Glandular Trichomes

To investigate the morphology, density, and index of glandular trichomes on A. indiana leaves, samples from each sub-site were divided into two groups for distinct preparations. The first group was prepared for scanning electron microscopy (SEM; HITACHI TM4000 Plus, Hitachi High-Tech Corporation, Tokyo, Japan) to observe detailed trichome morphology. Dried samples were sputter-coated with a thin layer of gold and examined under SEM to capture high-resolution images of trichome structures.
The second group was prepared for light microscopy, following a protocol similar to our previous study. Briefly, leaf samples were treated with 5% potassium hydroxide and 5% sodium hypochlorite to clear the epidermis, stained with 1% safranin, and dehydrated with ethanol. This allowed visualization of the capitate and peltate trichomes on both the adaxial (upper) and abaxial (lower) surfaces, enabling trichome density and index calculations [27]. The trichome index (%) was calculated as follows:
Trichome index (%) = (T/(T + E)) × 100,
where T is the number of trichome cells mm−2, and E is the number of epidermal cells mm−2.

2.9. VOCs Extraction and Analysis

VOCs in A. indiana leaves were analyzed using headspace solid-phase microextraction (SPME) coupled with gas chromatography-mass spectrometry (GC-MS). Leaf samples (0.2 g) were pre-incubated at 60 °C for 5 min, then extracted with a 50/30 µm DVB/CAR/PDMS SPME fiber at 60 °C for 15 min and desorbed at 250 °C for 5 min.
The analysis was performed on an Agilent 7890A GC (Agilent Technology Co., Ltd., Santa Clara, CA, USA) with an HP-5MS column (30 m × 0.25 mm, 0.25 µm film thickness) and an Agilent 7000B MS (Agilent Technology Co., Ltd., Santa Clara, CA, USA). The carrier gas (helium) flowed at 0.8 mL min−1. The oven program started at 40 °C, increased to 150 °C at 3 °C min−1, and then to 250 °C at 20 °C min−1 with a 5 min hold (total runtime: 46 min). Mass spectrometry was conducted in electron ionization (EI) mode at 70 eV, scanning from 35 to 500 amu. VOCs were identified using the NIST MS Search 2.0 library.

2.10. Statistical Analyses

Data were analyzed using IBM SPSS Statistics version 29.0.0.0 (241). Statistical tests included one-way ANOVA to compare soil properties, morphological traits, photosynthetic pigments, and compatible solutes across the sampling plots. Also, two-way ANOVA was conducted to assess plant elemental concentrations and trichome density by plant parts, followed by Duncan’s Multiple Range Test for post-hoc comparisons (p-value < 0.05). Pearson correlation was used to analyze pairwise associations, while Principal Component Analysis (PCA) explored multivariate correlations between soil and plant variables, including VOCs. Factor loadings in PCA were rotated using the Varimax method with Kaiser normalization. Additionally, K-means clustering was applied to group variables for PCA plotting.

3. Results

3.1. Soil Physicochemical Properties

A one-way ANOVA revealed significant differences (p < 0.001) in all soil physicochemical properties between the KK and HK habitats (Table 1). Soil moisture content was notably higher in HK soils, particularly in HK2, where it was nearly three times greater than in KK soils (F3,32 = 3573.46, p < 0.001). Soil pH in both habitats was slightly acidic, with KK soils exhibiting significantly lower values than HK (F3,32 = 40.77, p < 0.001). SOM was also elevated in HK soils, especially in HK2, where it exceeded KK levels by approximately 1.5 times (F3,32 = 24.46, p < 0.001).
Salinity-related parameters, including ECe, Na, Ca, and SAR, were significantly higher in HK soils (F3,32 = 1528.34 to 20094.46, p < 0.001). Notably, sodium concentrations were highest in HK2 (71.47 mmol kg⁻1), surpassing KK soils by a factor of 5 to 7 (F3,32 = 20144.72, p < 0.001). These findings indicate that HK soils, particularly HK2, exhibit significantly higher moisture, SOM, and salinity-related properties compared to KK soils.

3.2. Plant Growth, Photosynthetic Pigments, and Compatible Solutes

Salinity stress significantly influenced A. indiana biomass (F3,32 = 7.14, p = 0.001) and leaf area (F3,32 = 3.57, p = 0.025), though no significant effect was observed on stem height (Table 2). Photosynthetic pigment concentrations varied significantly across sites (F3,32 = 84.13 to 301.59, p < 0.001), with the highest levels of chlorophyll a, chlorophyll b, total chlorophyll, and β-carotene recorded in HK2. Similarly, the concentrations of leaf-compatible solutes varied significantly among sites (F3,32 = 22.82 to 470.78, p < 0.001), with KK1 exhibiting the highest levels of anthocyanins, proline, and total sugars.

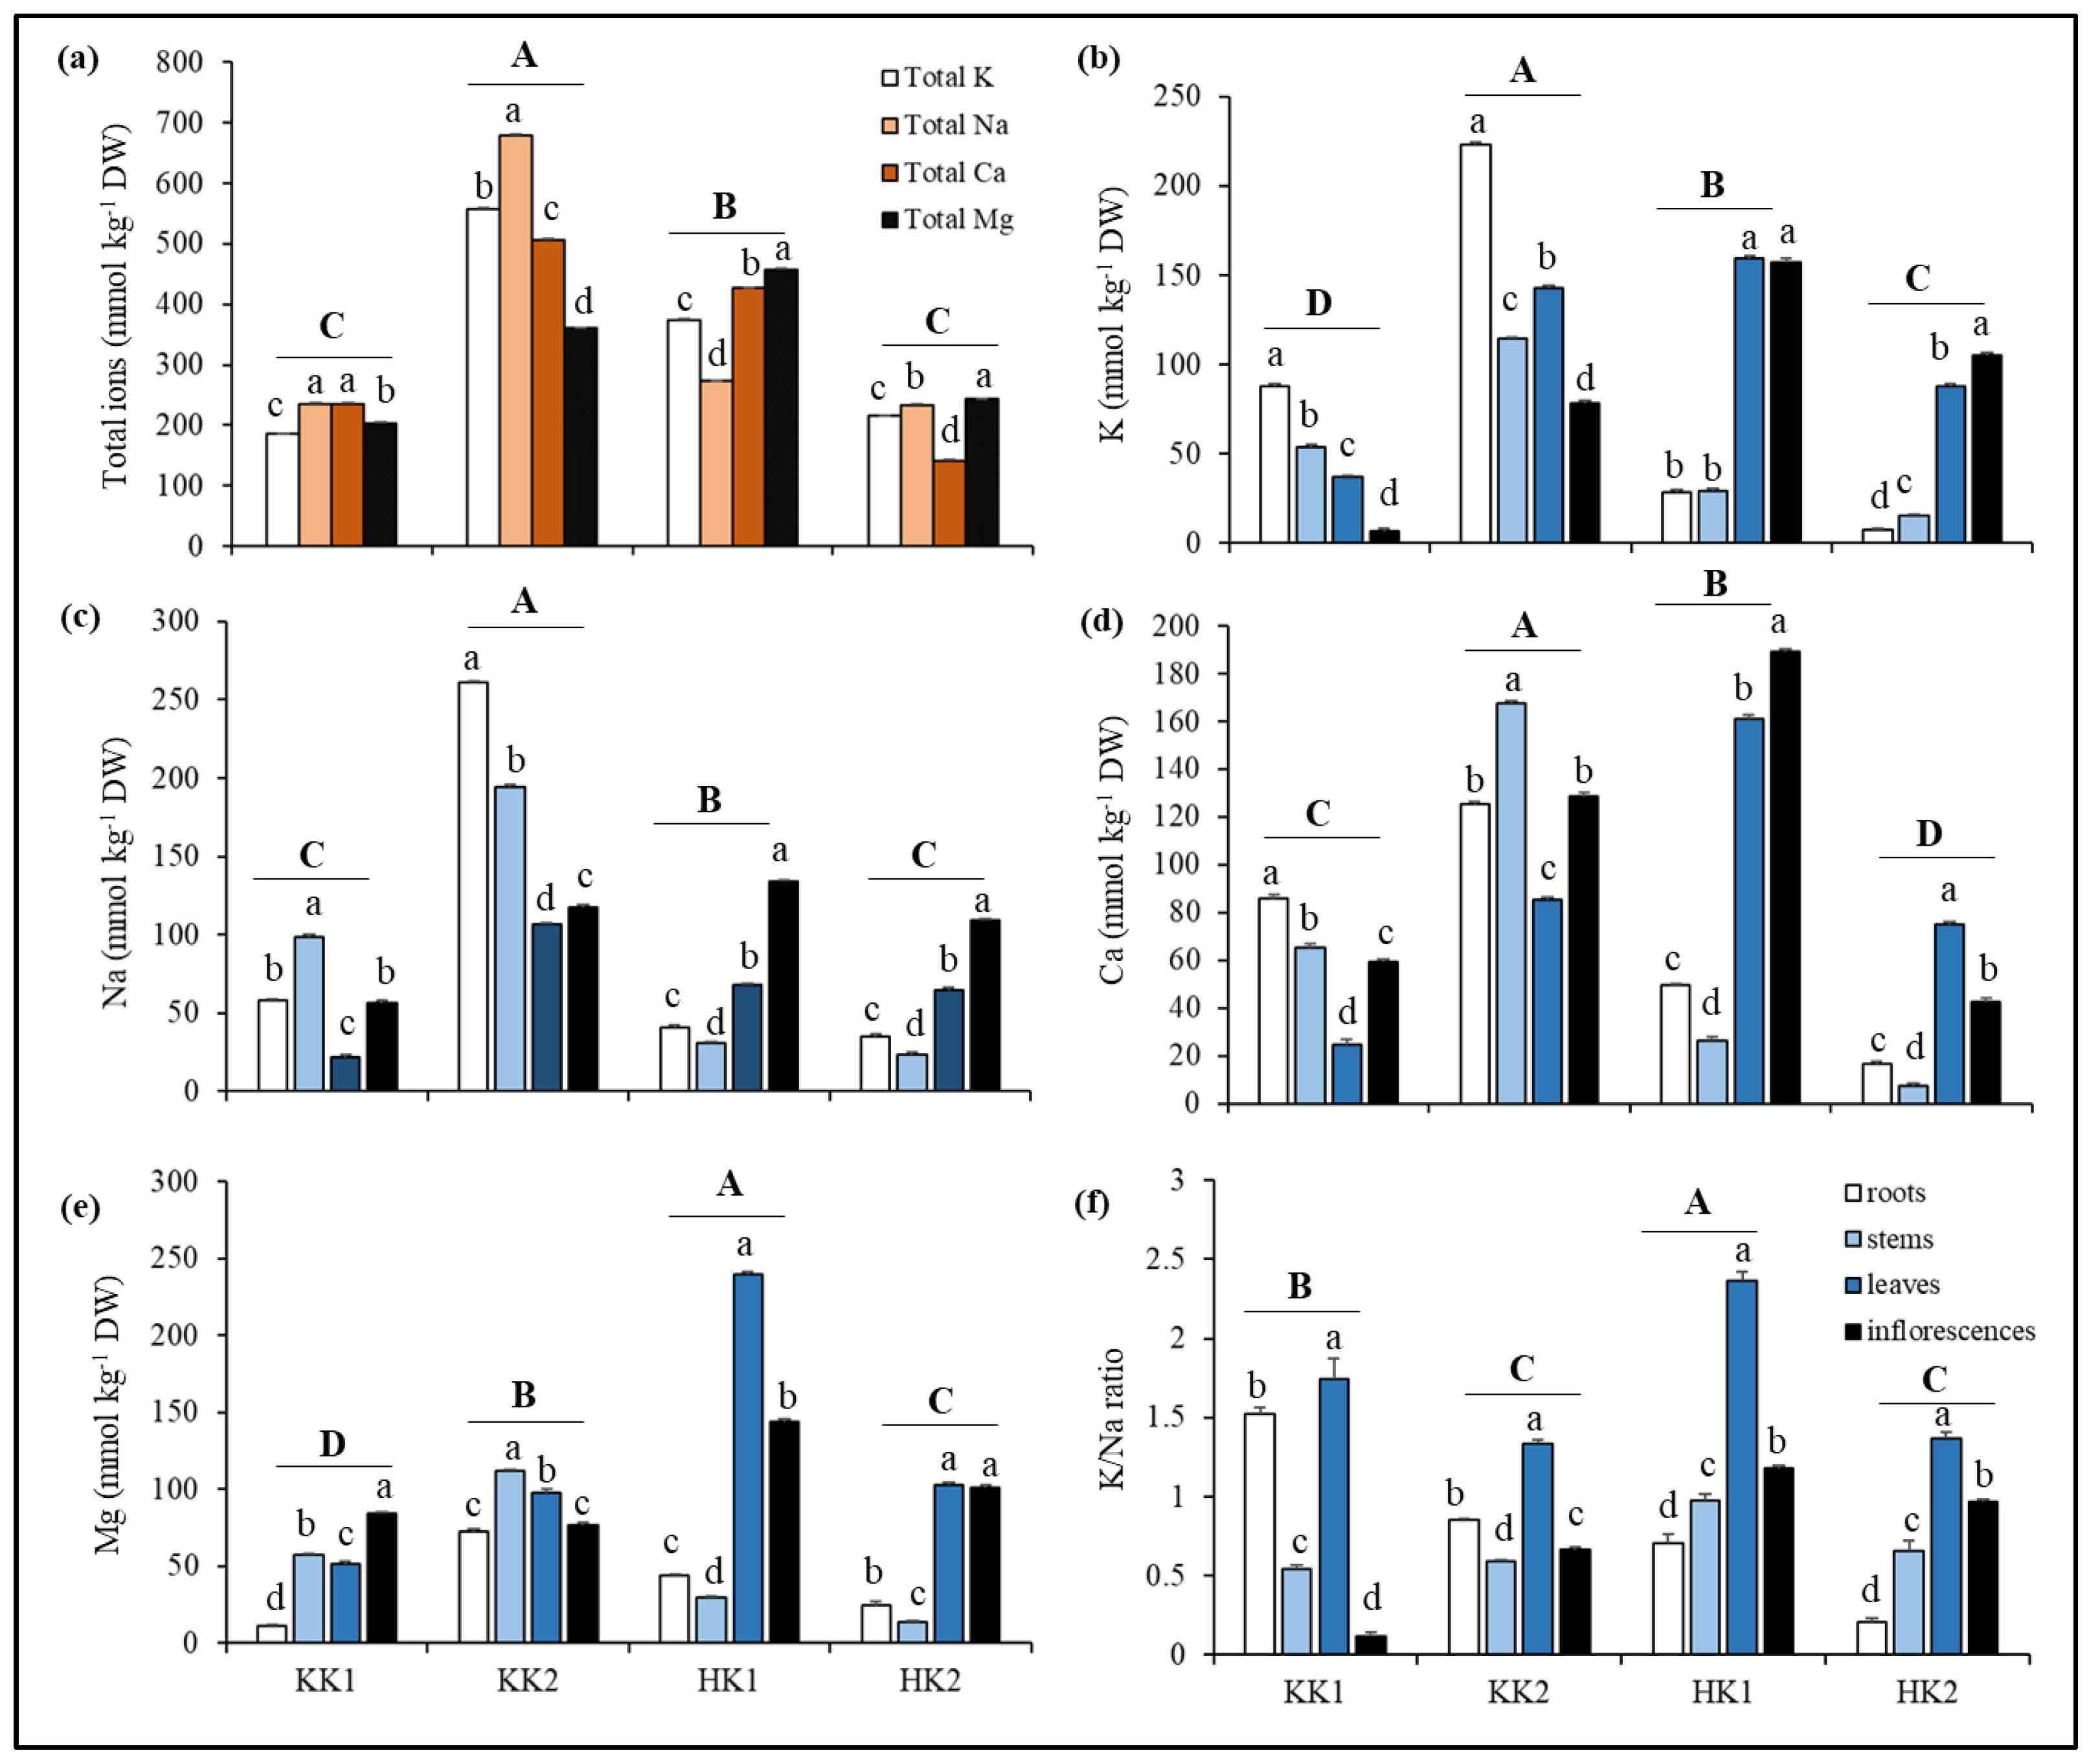
3.3. Salt Elemental Accumulation in Plants

A two-way ANOVA indicated significant variation in elemental concentrations across sites and plant parts, with significant effects of location (F3,128 = 44,352.61, p < 0.001), element type (F3,128 = 503.20, p < 0.001), and their interactions (F9,128 = 4117.68, p < 0.001) (Figure 2a). KK2 plants exhibited the highest accumulation of K (558.32 mmol kg⁻1 DW), Na (679.51 mmol kg⁻1 DW), and Ca (506.55 mmol kg⁻1 DW), whereas HK1 plants had the highest Mg concentration in plant tissues (457.29 mmol kg⁻1 DW).
Potassium concentrations differed significantly by sites and plant parts (F3,128 = 1046.01 to 3893.84, p < 0.001) (Figure 2b). The highest K levels were recorded in KK2 roots (222.84 mmol kg⁻1 DW), whereas the lowest levels were observed in KK1 inflorescences and HK2 roots. Leaves generally contained more K than stems, peaking at 159.67 mmol kg⁻1 DW in HK1.
Sodium concentrations also varied significantly (F3,128 = 658.16 to 6536.40, p < 0.001) (Figure 2c). The highest Na accumulation occurred in KK2 roots (260.73 mmol kg⁻1 DW), while in HK1 and HK2, Na concentrations were greater in inflorescences.
Calcium accumulation was significantly influenced by sites and plant parts (F3,128 = 662.80 to 3724.85, p < 0.001) (Figure 2d). KK plants exhibited higher Ca levels in roots and stems but significantly lower levels in leaves and inflorescences, whereas HK plants showed the opposite trend.
Magnesium concentrations also showed site- and plant part-specific variation (F3,128 = 1563.48 to 3019.03, p < 0.001) (Figure 2e). Leaves and inflorescences generally exhibited higher Mg levels, except in KK2, where distribution was relatively uniform.
The K/Na ratio, a key indicator of salt tolerance, was significantly influenced by sites and plant parts (F3,128 = 88.20 to 400.27, p < 0.001) (Figure 2f). HK1 leaves exhibited the highest K/Na ratio (2.37), indicating superior salt tolerance.

3.4. Glandular Trichome Density

Two types of glandular trichomes were identified in A. indiana leaves: capitate and peltate (Figure 3). Capitate trichomes, similar in size to stomata (10–50 µm), were found on both leaf surfaces, while larger peltate trichomes (90–200 µm) were restricted to the abaxial surface. The highest capitate trichome density was observed on the abaxial surface at KK2 (10.56 mm−2), while the lowest density occurred on the adaxial surface at KK1 (2.11 mm−2). Peltate trichomes, which were confined to the abaxial surface, were most abundant at KK1 (4.78 mm−2). Site, leaf surface, and their interaction significantly influenced trichome density (p < 0.001), though peltate trichome distribution was predominantly determined by leaf surface (F1,64 = 226.78, p < 0.001).

3.5. Leaf VOC Analysis

Headspace SPME GC-MS analysis identified 47 VOCs in A. indiana leaves (Table 3). VOC composition varied across sites, with HK1 and KK1 exhibiting the greatest diversity. Fewer compounds were detected in HK2 and KK2, with four absent from their profiles. Among the six VOC categories, ketones were most abundant, while monoterpenes exhibited the highest diversity. Thirteen VOCs had peak areas exceeding 1%, including α-pinene, D-limonene, terpinolene, fenchone, p-cymen-8-ol, β-elemene, β-caryophyllene, α-caryophyllene, β-bisabolene, chrysanthenone, 3-cyclopenten-1-one, 1-octen-3-ol, and 2-chloro-1-ethyl-5-methoxy-3-methylbenzene.

3.6. Correlation and PCA of Plant–Soil Interactions

Correlation and PCA analyses (Figure 4) revealed significant relationships among soil properties, compatible solutes, sodium contents, glandular trichome density, and the top 13 VOCs in A. indiana. Soil pH correlated positively with fenchone (r = 0.98, p = 0.02), while soil ECe was associated with β-bisabolene (r = 0.96, p = 0.04). Soil potassium showed a perfect positive correlation with p-cymen-8-ol (r = 1.00, p < 0.001). In contrast, soil calcium exhibited a significant negative correlation with α-caryophyllene (r = −0.96, p = 0.04). Proline correlated positively with α-pinene and D-limonene (r = 0.96, p = 0.04) but negatively with β-bisabolene (r = −0.98, p = 0.02). Additionally, plant sodium positively correlated with β-elemene (r = 0.96, p = 0.04), while leaf sodium content exhibited a strong negative correlation with a ketone derivative (r = −0.99, p = 0.01). Glandular trichomes played a key role in VOC modulation, with abaxial peltate trichome density positively associated with D-limonene, terpinolene, α-pinene, and 1-octen-3-ol (r = 0.98–1.00, p ≤ 0.02), indicating their involvement in salinity-induced VOC synthesis.
PCA explained 85.75% of the total variance, categorizing the data into three clusters: (1) Monoterpenes associated with osmoprotectants, abaxial trichomes, and leaf sodium levels; (2) Sesquiterpenes linked to capitate trichomes and plant sodium levels; and (3) Monoterpenoids, a sesquiterpene, a sesquiterpenoid, and a ketone influenced by soil properties. These findings underscore the complex interplay between salinity stress, secondary metabolite production, and plant structural adaptations in A. indiana.

4. Discussion

The soil physicochemical properties at the study sites indicate key differences in moisture, pH, and nutrient availability. According to the USDA Soil Salinity Classification [28], soils with an ECe below 2 dS m−1 are classified as non-saline. Based on this criterion, all study sites (KK1, KK2, HK1, and HK2) fall within the salinity-free category, suggesting that salinity is not a major limiting factor for plant growth in this region. However, differences in sodium and moisture levels across sites may still influence plant physiological responses and secondary metabolism.
The observed pH values (6.66–6.88) indicate slightly acidic soil conditions, likely influenced by organic matter and acidic soil components. Despite the dominance of sodium in HK1 and HK2, the pH did not shift toward alkalinity, likely due to the presence of sodium chloride (NaCl) and sodium sulfate (Na2SO4) instead of sodium carbonate (Na2CO3), which would have caused an increase in pH. Leaching processes and other environmental factors may also contribute to pH regulation in this region.
Potassium is essential for plant growth, with levels below 50 mmol kg⁻1 considered insufficient [29]. Studies in Thailand indicate that sandy soils, particularly in the northeast, often exhibit K deficiency [30]. In this study, all sites had K levels below this threshold, suggesting limited K availability for plant uptake. However, A. indiana maintained stable growth, likely due to its ability to regulate ion homeostasis and adapt to nutrient constraints. These findings highlight the importance of soil management and plant adaptation strategies in saline and low-K environments [29,30].
The physicochemical properties of the soil influence A. indiana’s physiological responses, particularly ion uptake, water retention, and stress tolerance. Given that all sites exhibited potassium levels below the sufficiency threshold, A. indiana likely relies on alternative ion regulation mechanisms to maintain growth. Despite low salinity, sodium accumulation still plays a key role in plant adaptation. To further understand how these soil conditions impact secondary metabolism, we investigated VOC production in A. indiana.
In this study, our primary focus was to assess how VOC production responds to salinity-related factors, including sodium accumulation, osmoprotectants, and glandular trichomes. While plant growth parameters and photosynthetic pigments were also measured, they were not included in the correlation and PCA analyses, as they were not the primary drivers of VOC biosynthesis. Instead, we emphasized physiological and biochemical mechanisms that are directly linked to VOC production. Future studies could explore whether plant growth and photosynthetic pigments play a secondary role in modulating VOC synthesis under varying environmental conditions.
Our observations suggest that VOC production in A. indiana is linked to the activity of peltate trichomes, predominantly found on the abaxial leaf surface. These trichomes serve as the primary site for VOC synthesis, particularly for compounds such as D-limonene and 1-octen-3-ol (Figure 4). In contrast, capitate trichomes, which are present on both leaf surfaces, did not show a strong association with specific VOCs. This functional differentiation underscores the specialization of peltate trichomes in VOC synthesis and their potential role in mitigating environmental stress.
Our study reveals significant effects of salinity on the VOC profiles of A. indiana leaves. We identified 47 VOCs, some of which overlap with, and others diverge from, the 49 VOCs previously reported in A. indiana from Southern China [10]. Among the unique VOCs identified, 3-cyclopenten-1-one, found in high concentrations (34.98–44.04%), appears to play a crucial role in the plant’s response to salinity stress. Similarly, 1-octen-3-ol, a VOC linked to plant defense mechanisms [31], was prominent. Another noteworthy compound, 4,7-dimethyl-benzofuran, previously identified in Radix Paeoniae Rubra [32], has known antibacterial, antimicrobial, antitumor, antidiabetic, and anti-inflammatory properties [33,34]. Other VOCs such as dodecane and 2-cyclohexen-1-one may contribute to structural or protective adaptations in A. indiana under salinity stress [35,36]. Additionally, replicated VOCs such as D-limonene (7.27–21.44%) and fenchone (2.54–6.63%) were abundant and biologically active, playing essential roles in ecological interactions and stress responses [10]. Compounds like β-caryophyllene and α-caryophyllene, known for their anti-inflammatory and antimicrobial properties, further emphasize the pharmacological potential of A. indiana [37,38]. These findings indicate that environmental factors, especially salinity, strongly influence the plant’s biochemical profile, with implications for both ecological adaptation and pharmacological applications.
A strong correlation between VOC profiles and soil salinity suggests that environmental factors can be manipulated to optimize VOC production in A. indiana for medicinal purposes. For instance, D-limonene, which was elevated under low-salinity conditions, has previously been shown to inhibit tumor growth by reducing cyclin D1 expression, a key regulator in cancer progression, and to accumulate in breast tissue to suppress proliferation [39]. Similarly, β-bisabolene, which accounted for 12.85–24.50% of the VOCs in A. indiana (Table 3), was more abundant under high-salinity conditions. Although its pharmacological effects were not the focus of this study, β-bisabolene has demonstrated anti-adipogenic and antibacterial activities in Colquhounia coccinea var. mollis [40]. The presence of these bioactive compounds in salinity-stressed environments underscores the potential of manipulating environmental factors like soil salinity to enhance the production of pharmacologically relevant VOCs. These findings provide a foundation for further research on the relationship between salinity stress and VOC biosynthesis, with potential ecological and medicinal applications.
Salinity stress induces changes in VOC production as part of broader plant defense mechanisms against environmental stressors. In response to sodium chloride stress, many plants increase the production of hydrophilic volatiles while reducing specific terpenoids [41]. A similar response has been observed in Solanum lycopersicum (tomato), where salinity triggers the production of monoterpenes such as (Z)-β-ocimene, 2-carene, and β-phellandrene [42]. These findings align with our study, where salinity-induced changes in VOC production in A. indiana underscore the ecological role of these compounds in plant adaptation to saline environments.
A novel finding in our study is the role of sodium accumulation in activating VOC production. Specifically, monoterpenes such as D-limonene, α-pinene, and terpinolene, along with alcohols like 1-octen-3-ol, were activated in response to sodium accumulation in leaves. Interestingly, plants from low-salinity soils showed higher sodium concentrations in leaves compared to those from high-salinity soils, where VOCs such as 3-cyclopenten-1-one and sesquiterpenes like β-bisabolene responded more strongly. This suggests that sodium dynamics vary across habitats, potentially influencing the VOC profiles in ways that may have ecological or pharmacological significance.
Despite salinity stress, A. indiana maintains biomass, stem height, and K/Na balance, particularly in leaves and inflorescences, even with changes in photosynthetic pigment levels (Table 2). This is consistent with findings in salt-tolerant species, such as wild-type Rudna tomato, which maintains photosynthetic efficiency despite high salinity levels [42]. In A. indiana, sodium compartmentalization in less metabolically active tissues, such as aerial parts, likely helps protect core metabolic processes, allowing the plant to sustain growth and ion homeostasis under salinity stress.
In response to salinity stress, osmotic regulation emerges as the primary defense strategy in A. indiana leaves. This is supported by strong correlations between osmoprotectants such as proline and total sugars and the production of specific VOCs, including D-limonene, α-pinene, terpinolene, and 1-octen-3-ol. In contrast, antioxidants like anthocyanins show weaker correlations with VOC production (Figure 4), suggesting that osmotic adjustments play a more dominant role in maintaining cellular homeostasis under sodium stress.
Proline and sugars function as key osmoprotectants by stabilizing cell membranes, maintaining osmotic balance, and mitigating oxidative damage caused by salt stress [43]. The increased expression of Δ1-pyrroline-5-carboxylate synthase (P5CS) in response to salinity enhances proline biosynthesis, which contributes to osmotic stability while reducing reactive oxygen species (ROS), thereby protecting cellular structures [44]. Although anthocyanins aid in ROS scavenging, their role in A. indiana appears secondary to osmotic regulation, as evidenced by the red-to-violet pigmentation observed in leaves under salinity stress (Figure 1d).
Salinity stress induces significant metabolic shifts, including the accumulation of sugars such as glucose, fructose, and sucrose, which serve as osmoprotectants in many species, including mint [45]. These sugars help maintain osmotic balance, shielding plants from the adverse effects of salt stress. Beyond sugar accumulation, trehalose plays a crucial role by stabilizing cell membranes, reinforcing cell walls, and maintaining ionic homeostasis. It also aids in protein stabilization, scavenges ROS, and upregulates salt-responsive genes, thereby enhancing the plant’s overall salt tolerance [46]. The multifaceted role of trehalose underscores its importance in enabling plants to cope with osmotic and oxidative stress during salinity challenges.
Additionally, elevated calcium levels were observed in response to salt stress, particularly in the leaves and inflorescences of A. indiana at HK sites (Figure 2d). This suggests activation of Salt Overly Sensitive (SOS) pathways, where calcium signaling plays a crucial role in expelling sodium ions (Na⁺) from cells to maintain ionic balance [47]. The involvement of SOS3 and SOS2 in this calcium-mediated response aligns with previous studies [48], though further gene-level research is needed to confirm these findings.

5. Conclusions

Adenosma indiana exhibits resilience to salinity stress, maintaining stable growth through ion homeostasis, particularly by optimizing the K/Na balance. While plant biomass and leaf area showed minor fluctuations, stem height and overall growth remained stable. Photosynthetic pigments, including chlorophyll and β-carotene, increased under higher salinity, suggesting a photoprotective response to oxidative stress, supporting photosynthetic efficiency and energy production.
Salinity modulated VOC emissions, with low-salinity conditions promoting osmoprotectant-driven production of D-limonene, α-pinene, terpinolene, and 1-octen-3-ol, while high-salinity environments enhanced β-bisabolene and β-caryophyllene synthesis. This shift highlights the influence of sodium dynamics on VOC pathways.
Peltate trichomes were crucial in VOC biosynthesis, particularly in producing bioactive monoterpenes. The observed rise in calcium levels under salt stress suggests involvement of the SOS pathway in sodium regulation, warranting further molecular studies.
This study provides novel insights into A. indiana’s ecological adaptations and pharmacological potential, highlighting how salinity shapes VOC profiles. These findings contribute to understanding plant resilience in saline environments and support sustainable applications of VOCs from salt-tolerant medicinal plants.

Author Contributions

Conceptualization, J.M., W.L. and P.K.; methodology, W.L.; validation, J.M.; formal analysis, P.K.; investigation, W.L.; writing—original draft preparation, P.K.; writing—review and editing, W.L. and P.K.; visualization, J.M. All authors have read and agreed to the published version of the manuscript.

Funding

This research project was financially supported by Mahasarakham University.

Data Availability Statement

The raw data supporting the findings of this study are available at Figshare (https://doi.org/10.6084/m9.figshare.28192748) (accessed on 20 February 2025).

Acknowledgments

The authors express their appreciation to the undergraduate students for their valuable assistance in the laboratory.

Conflicts of Interest

The authors declare no conflicts of interest.

Abbreviations

The following abbreviations are used in this manuscript:
ECeElectrical conductivity of saturated soil extract
HKHua Na Kham
KKKhlong Kham
PCAPrincipal Component Analysis
SARSodium adsorption ratio
SOMSoil organic matter
SOSSalt Overly Sensitive
VOCsVolatile organic compounds

References

  1. Chrysargyris, A.; Tzionis, A.; Xylia, P.; Tzortzakis, N. Effects of salinity on tagetes growth, physiology, and shelf life of edible flowers stored in passive modified atmosphere packaging or treated with ethanol. Front. Plant Sci. 2018, 9, 1765. [Google Scholar] [CrossRef]
  2. Negrão, S.; Schmöckel, S.M.; Tester, M. Evaluating physiological responses of plants to salinity stress. Ann. Bot. 2017, 119, 1–11. [Google Scholar] [CrossRef]
  3. Ullah, A.; Li, M.; Noor, J.; Tariq, A.; Liu, Y.; Shi, L. Effects of salinity on photosynthetic traits, ion homeostasis and nitrogen metabolism in wild and cultivated soybean. PeerJ 2019, 7, e8191. [Google Scholar] [CrossRef] [PubMed]
  4. Midzi, J.; Jeffery, D.W.; Baumann, U.; Rogiers, S.; Tyerman, S.D.; Pagay, V. Stress-induced volatile emissions and signaling in inter-plant communication. Plants 2022, 11, 2566. [Google Scholar] [CrossRef] [PubMed]
  5. Nazari, M.; Ghasemi-Soloklui, A.A.; Kordrostami, M.; Abdel Latef, A.A.H. Deciphering the response of medicinal plants to abiotic stressors: A focus on drought and salinity. Plant Stress 2023, 10, 100255. [Google Scholar] [CrossRef]
  6. Dai, D.N.; Thang, T.D.; Thai, T.H.; Ogunwande, I.A. Chemical constituents of leaf essential oils of four Scrophulariaceae species grown in Vietnam. J. Essent. Oil Res. 2015, 27, 481–486. [Google Scholar] [CrossRef]
  7. Ya, Q.K.; Lu, W.J.; Chen, J.Y.; Tan, X. GC-MS analysis of the chemical constituent of volatile oil from Zhuang drug Adenosma indianum (Lour.) Merr. Chin. J. Pharm. Anal. 2011, 31, 544–546. [Google Scholar]
  8. Wang, C.; Zhang, H.; Liu, Q.; Qi, J.; Zhuang, H.; Gou, Y.; Wang, H.; Wang, Y. A review of the aromatic genus Adenosma: Geographical distribution, traditional uses, phytochemistry and biological activities. J. Ethnopharmacol. 2021, 275, 114075. [Google Scholar] [CrossRef]
  9. Yan, H.; Huai-en, W.; Zhi-ying, W.; Yan-fen, X.; Xiao-ling, Y. Chemical constituents and anti-bacterial activity of essential oil from Adenosma indianum. Chin. J. Exp. Tradit. Med. Formulae 2011, 17, 79–82. [Google Scholar]
  10. Zeng, Z.; Meng, C.; Ye, X.; Zeng, Z. Analysis of volatile components of Adenosma indianum (Lour.) Merr. by steam distillation and headspace solid-phase microextraction. J. Chem. 2012, 2013, 545760. [Google Scholar] [CrossRef]
  11. Jennings, M.R.; Parks, R.J. Curcumin as an antiviral agent. Viruses 2020, 12, 1242. [Google Scholar] [CrossRef] [PubMed]
  12. Kashyap, N.; Kumari, A.; Raina, N.; Zakir, F.; Gupta, M. Prospects of essential oil loaded nanosystems for skincare. Phytomed. Plus 2022, 2, 100198. [Google Scholar] [CrossRef]
  13. Laojinda, W.; Khanema, P. Saline soil adaptations of Kratai Cham (Adenosma indianum (Lour.) Merr.): A comprehensive study on life cycle, leaf epidermis, and FTIR analysis of essential oils. Food Agric. Sci. Technol. 2024, 10, 1–6. [Google Scholar]
  14. Yuwaniyama, A. Management of Saline Soil; Land Development Department, Ministry of Agriculture and Cooperatives: Bangkok, Thailand, 2003.
  15. Tokaew, W.; Mokkamol, P. Species diversity of vascular plants in saline soil area at Nongbor Reservoir, Maha Sarakham Province. In Proceedings of the 10th Botanical Conference of Thailand (BCT10), Ubon Ratchathani, Thailand, 16–17 June 2016. [Google Scholar]
  16. Wongsomsak, S. Salinization in Northeast Thailand. Southeast Asian Stud. 1986, 24, 133–153. [Google Scholar]
  17. Arunin, S.; Pongwichian, P. Salt-affected soils and management in Thailand. Bull. Soc. Sea Water Sci. Jpn. 2015, 69, 319–325. [Google Scholar] [CrossRef]
  18. Land Development Department. Handbook of Soil Chemical Analysis; Ministry of Agriculture and Cooperatives: Bangkok, Thailand, 2010.
  19. Land Development Department. Handbook of Soil Physical Analysis; Ministry of Agriculture and Cooperatives: Bangkok, Thailand, 2010.
  20. Walkley, A.; Black, I.A. An examination of the Degtjareff method for determining soil organic matter, and a proposed modification of the chromic acid titration method. Soil Sci. 1934, 37, 29–38. [Google Scholar] [CrossRef]
  21. Sheen, H.T.; Kahler, H.L. Effect of ions on Mohr method for chloride determination. Ind. Eng. Chem. Anal. Ed. 1938, 10, 628–629. [Google Scholar] [CrossRef]
  22. Isaac, R.A. Plants. In Official Methods of Analysis of the Association of Official Analytical Chemists, 15th ed.; Helrich, K., Ed.; Association of Official Analytical Chemists: Arlington, VA, USA, 1990; Volume 1, p. 42. [Google Scholar]
  23. Costache, M.A.; Campeanu, G.; Neata, G. Studies concerning the extraction of chlorophyll and total carotenoids from vegetables. Rom. Biotechnol. Lett. 2012, 17, 7702–7708. [Google Scholar]
  24. Lee, J.; Durst, R.W.; Wrolstad, R.E. Determination of total monomeric anthocyanin pigment content of fruit juices, beverages, natural colorants, and wines by the pH differential method: Collaborative study. J. AOAC Int. 2005, 88, 1269–1278. [Google Scholar] [CrossRef]
  25. Bates, L.S.; Waldren, R.P.; Teare, I.D. Rapid determination of free proline for water-stress studies. Plant Soil 1973, 39, 205–207. [Google Scholar] [CrossRef]
  26. DuBois, M.; Gilles, K.A.; Hamilton, J.K.; Rebers, P.A.; Smith, F. Colorimetric method for determination of sugars and related substances. Anal. Chem. 1956, 28, 350–356. [Google Scholar] [CrossRef]
  27. Dilcher, D.L. Approaches to the identification of angiosperm leaf remains. Bot. Rev. 1974, 40, 1–157. [Google Scholar] [CrossRef]
  28. Richards, L.A. Diagnosis and Improvement of Saline and Alkali Soils; U.S. Department of Agriculture: Washington, DC, USA, 1954; USDA Agricultural Handbook No. 60.
  29. FAO. Plant Nutrition for Food Security: A Guide for Integrated Nutrient Management; FAO Fertilizer and Plant Nutrition Bulletin 16; Food and Agriculture Organization of the United Nations: Rome, Italy, 2006. Available online: https://www.fao.org/3/a0443e/a0443e00.htm (accessed on 9 March 2025).
  30. FAO. Potassium Fertilization for Crop Growth in Sandy Soils of Northeast Thailand. Available online: https://www.fao.org/4/ag125e/ag125e28.htm (accessed on 10 March 2025).
  31. Tonks, A.J.; Roberts, J.M.; Midthassel, A.; Pope, T. Exploiting volatile organic compounds in crop protection: A systematic review of 1-octen-3-ol and 3-octanone. Ann. Appl. Biol. 2023, 183, 121–134. [Google Scholar] [CrossRef]
  32. Li, X.; Lan, Z.; Liang, Y. Analysis of volatile chemical components of Radix Paeoniae Rubra by gas chromatography-mass spectrometry and chemometric resolution. J. Cent. South Univ. Technol. 2007, 14, 57–61. [Google Scholar] [CrossRef]
  33. Heravi, M.M.; Zadsirjan, V.; Hamidi, H.; Tabar Amiri, P.H. Total synthesis of natural products containing benzofuran rings. RSC Adv. 2017, 7, 24470–24521. [Google Scholar] [CrossRef]
  34. Khatana, K.; Gupta, A. An update on natural occurrence and biological activity of benzofurans. Acta Sci. Med. Sci. 2020, 4, 114–123. [Google Scholar] [CrossRef]
  35. Jishma, P.; Hussain, N.; Chellappan, R.; Rajendran, R.; Mathew, J.; Radhakrishnan, E.K. Strain-specific variation in plant growth promoting volatile organic compounds production by five different Pseudomonas spp. as confirmed by response of Vigna radiata seedlings. J. Appl. Microbiol. 2017, 123, 204–216. [Google Scholar] [CrossRef]
  36. Kalstabakken, K.A.; Harned, A.M. Asymmetric transformations of achiral 2,5-cyclohexadienones. Tetrahedron 2014, 70, 9571–9585. [Google Scholar] [CrossRef]
  37. Bina, F.; Soleymani, S.; Toliat, T.; Hajimahmoodi, M.; Tabarrai, M.; Abdollahi, M.; Rahimi, R. Plant-derived medicines for treatment of endometriosis: A comprehensive review of molecular mechanisms. Pharmacol. Res. 2019, 139, 76–90. [Google Scholar] [CrossRef]
  38. Paula-Freire, L.I.G.; Andersen, M.L.; Gama, V.S.; Molska, G.R.; Carlini, E.L.A. The oral administration of trans-caryophyllene attenuates acute and chronic pain in mice. Phytomedicine 2014, 21, 356–362. [Google Scholar] [CrossRef]
  39. Chebet, J.J.; Ehiri, J.E.; McClelland, D.J.; Taren, D.; Hakim, I.A. Effect of d-limonene and its derivatives on breast cancer in human trials: A scoping review and narrative synthesis. BMC Cancer 2021, 21, 902. [Google Scholar] [CrossRef]
  40. Li, D.-S.; Shi, L.-L.; Guo, K.; Luo, S.-H.; Liu, Y.-C.; Chen, Y.-G.; Liu, Y.; Li, S.-H. A new sesquiterpene synthase catalyzing the formation of (R)-β-bisabolene from medicinal plant Colquhounia coccinea var. mollis and its anti-adipogenic and antibacterial activities. Phytochem 2023, 211, 113681. [Google Scholar] [CrossRef] [PubMed]
  41. Saberi Riseh, R.; Ebrahimi-Zarandi, M.; Tamanadar, E.; Moradi Pour, M.; Thakur, V.K. Salinity stress: Toward sustainable plant strategies and using plant growth-promoting rhizobacteria encapsulation for reducing it. Sustainability 2021, 13, 12758. [Google Scholar] [CrossRef]
  42. Tomescu, D.; Şumălan, R.; Copolovici, L.; Copolovici, D. The influence of soil salinity on volatile organic compounds emission and photosynthetic parameters of Solanum lycopersicum L. varieties. Open Life Sci. 2017, 12, 135–142. [Google Scholar] [CrossRef]
  43. Mohammadi Alagoz, S.; Asgari Lajayer, B.; Ghorbanpour, M. Proline and soluble carbohydrates biosynthesis and their roles in plants under abiotic stresses. In Plant Stress Mitigators; Ghorbanpour, M., Shahid, M.A., Eds.; Elsevier: Amsterdam, The Netherlands, 2023; pp. 169–185. [Google Scholar] [CrossRef]
  44. Yang, D.; Ni, R.; Yang, S.; Pu, Y.; Qian, M.; Yang, Y.; Yang, Y. Functional characterization of the Stipa purpurea P5CS gene under drought stress conditions. Int. J. Mol. Sci. 2021, 22, 9599. [Google Scholar] [CrossRef]
  45. Kumar, D.; Punetha, A.; Chauhan, A.; Suryavanshi, P.; Padalia, R.C.; Kholia, S.; Singh, S. Growth, oil and physiological parameters of three mint species grown under saline stress levels. Physiol. Mol. Biol. Plants 2023, 29, 1061–1072. [Google Scholar] [CrossRef]
  46. Sarkar, A.K.; Sadhukhan, S. Imperative role of trehalose metabolism and trehalose-6-phosphate signaling on salt stress responses in plants. Physiol. Plant. 2022, 174, e13647. [Google Scholar] [CrossRef]
  47. Ketehouli, T.; Idrice Carther, K.F.; Noman, M.; Wang, F.-W.; Li, X.-W.; Li, H.-Y. Adaptation of plants to salt stress: Characterization of Na+ and K+ transporters and role of CBL gene family in regulating salt stress response. Agronomy 2019, 9, 687. [Google Scholar] [CrossRef]
  48. Liu, J.; Zhu, J.-K. A calcium sensor homolog required for plant salt tolerance. Science 1998, 280, 1943–1945. [Google Scholar] [CrossRef]
Figure 1. Study site locations (a) and topographical features of Khlong Kham (KK) (b) and Hua Na Kham (HK) (c), where soil salt is traditionally extracted during the dry season (January–April). Images of Adenosma indiana in fresh (d) and dried forms (e), showing its morphological adaptations. The plant’s inflorescence and fruit development occur from September to February, with inflorescences forming dense, terminal subglobose to shortly cylindrical heads, approximately 1 cm wide and 1–2.5 cm long.
Ijpb 16 00036 g001
Figure 2. Salt elemental contents in an entire plant and different parts of A. indiana: total salt elements in an entire plant (a), potassium (b), sodium (c), calcium (d), magnesium (e), and K/Na ratio (f). Data are presented as means ± S.D.; n = 9. Different uppercase letters denote significant differences between groups, and different lowercase letters denote significant differences within groups at a p-value of <0.05.
Ijpb 16 00036 g002
Figure 3. Distribution of glandular trichomes on the abaxial surface of A. indiana leaves (ad), with capitate trichome densities (e) and indices (f), and peltate trichome densities (g) and indices (h) on both the adaxial and abaxial surfaces. The images, captured using a stereomicroscope (a), compound microscope (b), and SEM (c,d), highlight capitate trichomes (Cap), peltate trichomes (Pel), and stomata (S). Data represent means ± S.D.; n = 9. Different uppercase letters denote significant differences between groups, and different lowercase letters denote significant differences within groups at a p-value of <0.05.
Ijpb 16 00036 g003
Figure 4. Correlation Heat Map and PCA Biplots for the top thirteen VOCs (with >1% peak areas) in A. indiana leaves from KK and HK. Panel (a) shows the correlation heat map, while Panels (b,c) illustrate PCA biplots from the same PCA analysis but are separated for better visualization. Panel (b) focuses on the clustering of VOCs, while Panel (c) highlights soil properties, plant sodium content, compatible solutes, and trichome densities. Key variables analyzed include compatible solutes such as anthocyanins (antho), proline (pro), and total sugars (sug); density of glandular trichomes categorized as abaxial capitate (Lcap), abaxial peltate (Lpel), and adaxial capitate (Ucap); and various soil and plant metrics, encompassing electrical conductivity of saturated soil extract (ECe), soil moisture (moist), pH, sodium adsorption ratio (SAR), soil organic matter (SOM), and soil minerals like calcium (SCa), chloride (SCl), potassium (SK), magnesium (SMg), and sodium (SNa). Sodium content is detailed across different plant parts, including roots (RNa), stems (StNa), leaves (LNa), inflorescences (InNa), and the entire plant (EnNa).
Ijpb 16 00036 g004
Table 1. Soil physicochemical properties in four saline microhabitats.
Soil PropertiesKK1KK2HK1HK2
Moisture (%)7.62 ± 0.15 C 16.54 ± 0.16 D11.47 ± 0.02 B18.96 ± 0.61 A
pH6.66 ± 0.01 D6.76 ± 0.06 C6.83 ± 0.05 B6.88 ± 0.07 A
SOM (%)1.58 ± 0.11 C1.64 ± 0.29 C2.14 ± 0.22 B2.40 ± 0.40 A
ECe (dS m−1)0.51 ± 0.01 D1.06 ± 0.03 C1.13 ± 0.05 B1.71 ± 0.04 A
K (mmol kg−1)1.34 ± 0.01 D1.94 ± 0.01 C13.96 ± 0.18 A6.97 ± 0.17 B
Na (mmol kg−1)15.79 ± 0.03 C10.39 ± 0.52 D51.84 ± 0.02 B71.47 ± 0.26 A
Ca (mmol kg−1)13.41 ± 0.16 B8.98 ± 0.22 D19.68 ± 0.24 A11.66 ± 0.28 C
Mg (mmol kg−1)10.49 ± 0.21 D31.21 ± 0.11 A16.13 ± 0.21 B15.56 ± 0.07 C
Cl (mmol kg−1)10.47 ± 0.99 D29.87 ± 1.42 A20.33 ± 0.42 C22.47 ± 0.70 B
SAR4.57 ± 0.02 C2.32 ± 0.11 D12.25 ± 0.01 B19.37 ± 0.16 A
1 Different uppercase letters in the same row mean significant differences between groups at p-value < 0.05. Data are means ± S.D.; n = 3.
Table 2. Plant growth, photosynthetic pigments, and leaf compatible solutes of A. indiana under different soil salinity levels.
Plant TraitsKK1KK2HK1HK2
Plant growth
Plant biomass (%)27.90 ± 2.43 B 126.83 ± 0.43 B34.11 ± 1.50 A30.18 ± 7.10 B
Stem height (cm)17.50 ± 2.52 A16.37 ± 2.90 A20.10 ± 1.87 A19.23 ± 0.95 A
Leaf area (cm−2)8.67 ± 1.53 B11.67 ± 1.15 A8.67 ± 2.08 B7.33 ± 1.53 B
Photosynthetic pigments (µg g−1)
Chlorophyll a 173.83 ± 8.48 C171.53 ± 3.31 C189.09 ± 1.76 B332.96 ± 5.01 A
Chlorophyll b 120.94 ± 5.50 B129.37 ± 6.43 B94.49 ± 0.99 C187.42 ± 1.38 A
Total chlorophyll294.77 ± 13.94 B300.90 ± 9.73 B283.57 ± 2.73 B520.38 ± 6.23 A
β-carotene177.49 ± 8.87 A133.05 ± 0.96 B103.62 ± 0.73 C186.60 ± 2.23 A
Leaf compatible solutes (µg g−1)
Anthocyanins 250.48 ± 6.68 A60.68 ± 11.12 C63.46 ± 4.42 C166.99 ± 14.56 B
Proline 147.25 ± 4.20 A112.22 ± 18.30 B107.77 ± 4.42 B91.64 ± 15.50 C
Total sugar28.28 ± 0.02 A11.16 ± 0.01 C15.32 ± 0.05 B16.50 ± 0.01 B
1 Different uppercase letters in the same row indicate significant differences between groups at a p-value < 0.05. Data are presented as means ± S.D.; n = 3.
Table 3. Chemical compositions of A. indiana leaf volatiles from two saline habitats analyzed by Headspace SPME GC-MS.
No.Chemical Class & CompoundsKK1KK2HK1HK2
RT (min)Area Sum (%)RT (min)Area Sum (%)RT (min)Area Sum (%)RT (min)Area Sum (%)
Monoterpenes
1α-pinene7.2632.657.1630.717.2620.957.1630.47
2sabinene8.7800.098.6760.038.7770.048.6740.03
3β-pinene9.4790.219.3770.079.4790.059.3800.05
4(+)-4-carene9.7570.089.6510.039.7540.039.6500.02
53-carene10.1300.3110.0230.1210.1310.1110.0230.08
62-carene10.4090.1710.3070.0510.4120.0410.3090.03
7m-cymene10.7420.2110.6480.1110.7410.1210.6470.10
8D-limonene10.95121.4410.8499.1110.9348.4510.8467.27
9β-ocimene11.8500.6611.7440.1811.8510.1111.7460.11
10γ-terpinene12.2110.0612.1040.0212.2090.0212.1040.01
11terpinolene13.4833.33ND 1ND13.4840.97NDND
12verbenone18.7590.2118.7350.2118.7560.2318.7400.09
13carvone20.3710.0920.2970.1220.3600.1720.3040.14
14zingiberene27.4450.1427.3600.2227.4570.1927.3600.23
Monoterpenoids
1cis-β-terpineol12.5550.0512.5110.0312.5530.0412.5220.02
2cis-linalool oxide12.8150.0312.7570.0212.8110.0112.7600.01
3fenchone13.3812.5413.3234.2813.4046.5313.3486.63
4β-linalool14.1040.2714.0540.2114.1020.1914.0540.16
5fenchol14.5500.0714.5060.1114.5500.2614.5090.20
6trans-p-mentha-2,8-dienol14.9010.0614.8560.0514.8940.1414.8580.09
7α-campholenal15.1120.02NDND15.1090.04NDND
8cis-p-mentha-2,8-dien-1-ol15.5240.08NDND15.5410.10NDND
9endo-borneol16.8540.0716.8230.0616.8550.0616.8260.05
10citral17.4050.7317.3600.4717.4111.1017.3680.75
11p-cymen-8-ol17.8301.1417.8321.1917.8471.7817.8451.45
12α-terpineol18.0380.2118.0130.2018.0430.2018.0210.13
Sesquiterpenes
1β-elemene26.7961.2726.7441.6626.8190.9926.7430.81
2β-caryophyllene27.8141.8527.7432.1127.8231.0127.7341.07
3α-caryophyllene29.2086.1729.1687.4529.2194.3229.1645.94
4cis-β-farnesene29.5800.1329.4830.2529.5800.2229.4830.28
5β-selinene30.5050.4130.4260.6830.5130.3830.4340.34
6α-selinene30.8790.3230.7980.5130.8850.2630.7970.24
7β-bisabolene31.61612.8531.62921.0831.67719.6731.65724.50
8β-sesquiphellandrene32.1410.6432.0781.0832.1530.8732.0851.11
9humulene-1,2-epoxide35.2170.5335.1781.1135.2230.9035.1901.69
Sesquiterpenoids
1chrysanthenone24.5421.3424.5351.4424.5531.8424.5341.43
2cinerolone27.0900.4027.0500.6627.1030.4327.0530.56
3caryophyllene oxide34.2190.1834.1730.3034.2220.2534.1720.32
Ketones
1p-mentha-1,8-dien-3-one, (+)-21.5740.0821.5320.1221.5760.1321.5340.11
23-cyclopenten-1-one, 2-hydroxy-3-(3-methyl-2-butenyl)-25.84234.9825.96940.6325.96644.0425.99140.66
Miscellaneous and Diverse Compounds
11-octen-3-olAlcohols9.0611.009.0140.349.0630.409.0170.39
2dodecaneAlkane18.6230.23NDND18.6230.15NDND
3benzofuran, 4,7-dimethyl-Ether18.9750.0718.8860.0818.9720.1018.8820.10
42-allyl-4-methylphenolPhenols19.2360.1319.2010.3219.2390.1919.2080.30
51,4-benzenediol, 2,5-dimethyl-Phenols22.2980.5322.2440.4522.3080.5822.2470.50
62-cyclohexen-1-one, 3,6-dimethyl-6-(1-methylethyl)-Cycloalkanes22.7210.5022.6920.4022.7290.4522.6930.45
7benzene, 2-chloro-1-ethyl-5-methoxy-3-methyl-Aromatic33.8791.4733.8811.7333.8870.8933.8641.08
Total identified classes
Monoterpenes 29.65 10.98 11.48 8.63
Monoterpenoids 5.27 6.62 10.45 9.49
Sesquiterpenes 23.64 34.82 27.72 34.29
Sesquiterpenoids 2.27 3.21 3.17 3.68
Ketones 35.24 41.05 44.42 41.09
Miscellaneous 3.93 3.32 2.76 2.82
Total 100.00 100.00 100.00 100.00
1 ND indicates “Not detected”.
Disclaimer/Publisher’s Note: The statements, opinions and data contained in all publications are solely those of the individual author(s) and contributor(s) and not of MDPI and/or the editor(s). MDPI and/or the editor(s) disclaim responsibility for any injury to people or property resulting from any ideas, methods, instructions or products referred to in the content.

