Abstract
There is limited information on the genetic response of tomato cultivars to pathogens. This study investigated the genetic mechanism of tomato that confers tolerance against Phytophthora infestans (Ph) and Aspergills niger (Asp) infection using different tomato accessions. Also, the study examined the effect of Ph and Asp infection on the morphology and the chromosome number of the infected tomatoes. Thirty tomato seed accessions were grown in a screen house, using a complete randomized design in triplicate, and evaluated for tolerance to both pathogens using a disease severity rating scale of 1 (highly tolerant) to 6 (highly susceptible), while chromosome assessment was performed using Carnoy’s protocol. Morphological data of 28 characteristics were collected using an IPGRI descriptor, while variance components, genetic advance (GA), and heritability were estimated for treated tomatoes and controls using the R statistical program. Accession NHT0254b, which was highly tolerant to Ph (1.00 ± 0.00) and Asp (1.33 ± 0.58), was diploid (2n = 2x = 24). The Ph-treated NHT0343a was moderately susceptible (3.67 ± 2.31), with 2n = 2x = 23, while NGB00711 was moderately susceptible (4.33 ± 1.16) with 2n = 2x = 22 after Asp treatment, indicating aneuploidy. In Ph treatment, cumulative fruit weight (CFW) had the highest environmental variance (1509.57), while number of seeds (NS) showed the highest genotypic variance (8.22). In Asp treatment, NS exhibited the highest genetic advance (2.97), while CFW had the highest phenotypic variance (754.91). Heritability estimates showed that fruit length (63.0%), the size of core (65.0%), and number of chambers (60.0%) were tolerant to Ph, while only fruit length (56.0%) was tolerant to Asp in terms of yield characteristics. Thus, tolerant accessions and traits are recommended for selection and genetic improvement.
1. Introduction
Tomato (Solanum Lycopersicum) is a common vegetable crop that is universally consumed [1]. It is a subtropical and annual plant that belongs to the nightshade family, which has high sunlight and temperature requirements for growth [2,3,4,5]. S. lycopersicum is the most cultivated of the wild relatives of tomato, which include S. juglandifolium, S. chimiewelskii, S. neorickii, S. pimpinellifollium, S. sitiens, S. chilense, S. galapagence, S. ochrantium, S. corneliomuelleri and S. habrochaites [6]. The determinate type of tomato is small and has regulated growth, while the indeterminate species are generally large and have continuous growth [7]. Although different soil types are used in tomato cultivation, sandy loam soil is best because it offers good water drainage [8]. Tomatoes thrive in slightly acidic to neutral soil with a pH range of 6.0 to 7.0 and require abundant nutrients to support growth and maximize productivity.
Tomato fruits have many nutritive components, which include lutein, β-carotene, and lycopene. They have health advantages associated with a reduced cancer rate and diseases of the heart [9,10]. There are many factors causing reduced tomato production, one of which is pathogens that cause diseases in tomato [11]. Oomycetes and fungi are major pathogens that cause the spoilage of tomato [12,13,14,15,16]. Phytophthora infestans (Ph), an oomycete, and Aspergillus niger (Asp), a fungus, cause severe infections in various tomato parts [17,18,19]. The high moisture composition of fruits makes tomatoes prone to attacked by these pathogens, causing lots of health problems for humans [17,20]. Factors such as rain, dew, and irrigation support the germination of oomycete and fungal spores on fruit surfaces, subsequently penetrating the tomato epicarp, while fragile and injured tomato tissues are the major sources of entry by pathogens such as Ph and Asp.
Tomato has a diploid chromosome number of 2n = 2x = 24 [21,22]. Pathogenic organisms utilize various mechanisms to induce chromosomal deletions and duplications, both of which play critical roles in rapid adaptation and evolution in host–pathogen interaction. Chromosomal deletions often result from breakage and rearrangement, leading to the loss of specific genomic regions. These deletions can remove genes that may hinder plant survival under certain environmental conditions or during host–pathogen interactions. Similarly, duplications can amplify beneficial genes, further enhancing plant adaptability [23,24,25]. Together, these genomic changes in plants enable pathogens to evade host defenses and thrive in challenging environments. These pathogens induce chromosomal changes in tomato plants, leading to alterations in gene expression patterns associated with disease tolerance and resistance traits [26,27]. These genomic changes are found to be heritable, suggesting that exposure to these pathogens can influence the genetic architecture of subsequent tomato generations [26,27]. This highlights the potential for pathogen-induced genetic variation to play a role in the evolution of disease tolerance in tomato populations.
Extensive studies have been conducted on the spoilage of tomato by oomycetes and fungi [28,29,30,31,32,33,34,35]. However, information on the genetic tolerance of tomato to Ph and Asp is scarce. The impact of disease tolerance against pathogens such as Trichoderma, Alternaria alternata, A. solani, A. tomatophila, A. linariae, and Septoria lycopersici on the morphological traits of tomatoes, including growth, agronomic characteristics, and yield, has been studied through estimates of heritability, genetic advance, and variance components [36,37,38,39,40,41].
Heritability reflects the proportion of observable variation in traits attributable to genetic factors, helping breeders identify disease-tolerant traits that are genetically inheritable. Genetic advance estimates the potential improvement in these traits over successive generations through selection, indicating the efficiency of breeding programs. Variance components partition the total variation into genetic, environmental, and phenotypic factors, offering insights into the relative influence of genetics versus environmental conditions on trait expression. Together, these metrics are essential for optimizing breeding strategies to enhance disease tolerance in tomatoes while improving key morphological traits, ensuring greater resilience and productivity. The study of the impact of heritability estimates, genetic advance, and components of variance on the tolerance of tomato characteristics to Ph [42,43,44,45,46] is limited to ancestral and wild forms of tomato, like S. pimpinellifolium and S. habrachaites. There is little or no information about the morphological characteristics related to the tolerance of tomato to Ph and Asp infection. This study investigated the genetic response of thirty tomato accessions to Ph and Asp infection and the effect of these pathogens on chromosomes and the aforementioned three metrics, components of variance, heritability, and genetic advance using the morphological characteristics of the infected tomatoes. Tolerant accessions are hypothesized to show distinct morphological and chromosomal stability compared to susceptible accessions, and these differences can serve as a basis for developing strategies to enhance disease tolerance in tomato cultivars.
2. Materials and Methods
2.1. Experimental Location
The experiment was carried out at the screen house of the teaching and research farm of the University of Ibadan, which lies on latitude 7°27′1634.77″ N and longitude 3°53′3214.96″ E at an altitude of 236 m above sea level. The average conditions during the experiment were 35 °C temperature, 26.0% humidity, 1009.0 hPa atmospheric pressure, 18.92% soil moisture, and 12 h and 10 min of daylight. Only tomatoes from the current study were grown in the screen house during the research. The growth of pathogens was overseen and the preparation of inoculum for the experiment was carried out at the Mycology and Biotechnology Laboratory of the Department of Botany, University of Ibadan, all of which are located in the Guinea Savanna of Southwestern Nigeria.
2.2. Planting Materials and Soil Sterilization
Thirty germplasm accessions of tomato seeds were collected from the National Center for Genetic Resources and Biotechnology (NACGRAB) and the National Horticultural Research Institute (NIHORT). We chose thirty accessions to ensure a diverse genetic representation for studying tolerance to Phytophthora infestans (Ph) and Aspergillus species (Asp), balancing practicality and statistical robustness. These accessions were selected from two gene banks based on the availability of viable seeds and their relevance to known tolerance and resistance traits, providing a comprehensive foundation for identifying tolerant traits, while maintaining genetic variability. Top sandy–loamy soil was collected from the teaching and research farm of the University of Ibadan, while sterilization was performed at 100 °C for seven hours as described by Olowe et al., 2018 [47].
The physiochemical parameters of the soil were screened to assess pH (5.6) and contents in terms of organic carbon (2.95 g kg−1), nitrogen (1.45 g kg−1), phosphorus (2.10 mg kg−1), exchangeable potassium (0.32 cmol kg−1), exchangeable calcium (2.15 cmol kg−1), exchangeable magnesium (1.68 cmol kg−1), exchangeable sodium (0.28 cmol kg−1), exchangeable acidity (0.33 cmol kg−1), effective cation exchange capacity (4.46 cmol kg−1), sand (580 g kg−1), silt (236 g kg−1), and clay (184 g kg−1). Soil homogeneity across all samples was ensured by sieving, thoroughly mixing, and evenly portioning into equal weights, with no organic or mineral fertilizers applied. Eight kilograms (8 kg) of the soil was packed into black polythene bags, modified via the methods of Dossoumou et al. (2021) [48], and aseptically transferred to the screen house.
2.3. Experimental Design, Planting of Seeds and Inoculation
The experiment was completely randomized in three biological replicates ensuring 60 cm × 60 cm spacing between rows and columns [49]. Seeds were sterilized for three minutes with 1% sodium hypochlorite solution to effectively eliminate surface contaminants, including bacteria, oomycetes, and fungal spores, while minimizing the risk of damaging seed viability or altering seed coat integrity. This duration ensures a balance between achieving sterility and preserving seed germination potential, which is critical for the success of upstream experiments. Rinsing was performed three times with sterile water, after which drying in a laminar flow hood was conducted for 2 h [50]. Five seeds were planted in each pot, after which thinning to two seedlings per pot was carried out three weeks after germination [50]. The irrigation of plants, weeding, and staking were performed in accordance with methods described by Naika et al. (2019) [51]. Pure cultures of Ph and Asp, isolated from diseased tomatoes obtained from the field, were grown on Potato Dextrose Agar [52]. A spore suspension was prepared for inoculation (0.5 at OD600) by aseptically mixing the spores of each pathogen with sterile water. The root inoculation of plants scarified at the crown was performed with sterile syringes, using 40 mL of each spore suspension at sunset shortly after watering at 45 days post-growth, while control plants were exposed to sterile conditions without inoculation.
2.4. Assessment of Disease Symptoms on the Infected Plants
The plant leaves were assessed for blight symptoms associated with Ph infection and bullseye spots that indicate Asp infection within two weeks of infection. Table 1 below presents the modified severity rating scale for assessing disease symptoms in plants, adopted from Oyewole et al. (2017) [50] and Olowe et al. (2013) [53]. Disease severity in plants was determined by recording the percentage of diseased leaves in relation to the total number of leaves per replicate. Scale ratings were then assigned according to the criteria outlined in Table 1.

Table 1.
Disease severity (%) scale for disease symptoms in plants.
2.5. Root Tip Preparation to Assess the Number of Chromosomes of Infected Tomato Plants
Choosing from the plants treated with Ph and Asp, three representatives of the accessions that were highly tolerant, tolerant, moderately tolerant, moderately susceptible, susceptible, and highly susceptible were selected for chromosome assessment. However, for Ph-infected plants, there were two accessions each that were highly tolerant and tolerant, which resulted in seventeen accessions being selected, including the control. In contrast, for Asp-infected plants, NGB00711 and NGB00710 showed severity levels close to those of the susceptible accessions. Hence, the selection of NGB00711 for chromosome validation allowed for the selection of four moderately susceptible accessions of Asp-infected plants, while no accession showed a highly susceptible response to Asp infection, resulting in a total of fifteen accessions, including the control. Carnoy’s fixative solution was prepared using 96% ethanol and acetic acid in a 3:1 ratio [54,55,56,57]. The root tips of various accessions were collected between the hours of 9am to 10am two weeks post infection and immediately transferred to the fixing solution for 48 h to arrest the cells at the metaphase, which is the visible stage of the chromosome. The washing of the root tips was performed using 70% ethanol. The hydrolyzation of the tips was carried out for 5 min using 18% hydrochloric acid; they were then transferred to microscope slides containing one drop of the fixative solution, where gradual squashing and staining with FLP orcein were performed for 1 h [58,59]. The stained tips were mounted onto microscope slides and coverslips, after which the chromosomes in seven cells at the metaphase stage in each root tip were examined using a fluorescence microscope (Olympus BX51) equipped with a 10× ocular lens at a total magnification of 400×, utilizing a 40× objective lens for initial screening and analysis. For detailed imaging and chromosome counting, a 100× oil immersion objective lens was used to capture images. Cells were selected based on the following criteria: well-spread chromosomes without overlapping, an intact cell structure, high-quality staining with uniform fluorescence, minimal background noise, and sharp focus to ensure accurate visualization and analysis.
2.6. Collection of Morphological Data
Morphological data were collected from treated plants using the following IPGRI (1996) [60] descriptors of tomato for growth, agronomic, and yield characteristics: plant height (PH), number of leaves (NL), leaf length (LL), leaf width (LW), stem girth (SG), sepal length (SL), petal length (PL), stamen length (STL), number of days to first flower bud (NDFFB), number of days to first flower (NDFF), number of flowers (NF), number of inflorescence (NI), number of days to fruit ripening (NDFR), number of fruits (NFS), cumulative fruit weight (CFW), fruit diameter at maturity (FDM), fruit length (FL), fruit width (FW), number of ribs on calyx (NRC), pedicel length (PL), pedicel length from abscission layer (PLAL), size of corky area around pedicel scar (SCAAPS), thickness of pericarp (TP), size of core (SC), number of locules (NLS), number of chambers (NC), and number of seeds (NS). Growth data were recorded weekly in the morning for four weeks after inoculation, while flowering and yield data were collected once after 50% of the plants had reached the flowering and fruiting stages, as specified by the IPGRI descriptor.
2.7. Statistical Analysis
Disease severity was determined by Duncan’s Multiple Range Test (DMRT) using the severity rating (Table 1). The analysis was conducted using the Statistical Package for the Social Sciences (SPSS, Version 26). This approach allowed for the comparison of means to identify significant differences in infection severity across different groups. DMRT provided a more robust and statistically sound approach to determining disease severity, as it accounted for variability within the data and ensured the accurate interpretation of results [61,62]. The data for chromosome count were analyzed using ANOVA, descriptive statistics, and DMRT, while growth, flowering, and yield data were evaluated for environmental variance (EV), genotypic variance (GV), phenotypic variance (PV), environmental component of variance (ECV), genotypic component of variance (GCV), phenotypic component of variance (PCV), heritability (H), genetic advance (GA), and genetic advance as a percentage of mean (GAM) using the R statistical program (version 4.4.0).
3. Results
3.1. Morphological Phenotype/Disease Symptoms of Each Accession After Pathogen Inoculation
The tolerance rating of various tomato accessions to Ph is shown in Table 2. NHT0254b and NHT0343b were highly tolerant. The NGB00699 and NHT0206a accessions were tolerant. Accessions NGB00729, NHT0213, NHT100, NHT0353-1, NHT0199c, NGB00733, and NGB00710 were moderately tolerant. The NGB00739, NHT343a, NHT0226a, NGB00711, and NHT0342a accessions showed moderate susceptibility. The NHT0339a, NHT0366, NHT0347, NGB00749, NHT034a, NHT0216a, NGB00755, and NHT0227c accessions were susceptible, while NHT0355a, NGB00206b, NHT0259a, NGB00713, NGB00734, and NGB00757 were highly susceptible. Figure 1 (left) shows blight lesions on the leaf of the NHT00729 accession after Ph infection.
Table 2.
Morphological phenotype/disease symptoms of each accession after inoculation with Ph.

Figure 1.
(left): Blight lesions on leaf of NHT00729 accession after Ph infection. (right): Brown spots on leaf of NHT0259a accession after Asp infection. Scale bar = 11 cm.
The tolerance rating of various accessions to Asp infection is demonstrated in Table 3. Accessions NHT0254b, NGB00749, NGB00729, NGB00699, NHT0213, NHT0356b, and NHT0199c showed a high level of tolerance. The NHT0347, NGB0206b, NHT70206a, NHT0216a, NHT100, and NHT0226 accessions were tolerant. The NHT0366, NHT0355a, NHT034a, NHT343a, NGB0734, NGB0057, NHT0342a, NGB00755, and NHT0227c accessions showed moderate levels of tolerance. The NHT0339a, NHT0259a, NGB00739, NGB00713, NGB03531, NGB00711, and NGB00710 accessions showed moderate levels of susceptibility, while NGB00733 was susceptible. Figure 1 (right) shows brown spots on the leaf of NHT0259a accession after Asp infection.
Table 3.
Morphological phenotype/disease symptoms of each accession after inoculation with Asp.
3.2. Mean Square Variance of Chromosome Numbers After Ph and Asp Treatment
The mean square variance of chromosome numbers in plants treated with both pathogens is shown in Table 4. There was a significant difference at p ˂ 0.001 between accessions treated with Ph (7.52) and Asp (10.48). The chromosome count after two weeks of treatment with Ph is shown in Table 5. The accessions NHT0254b, NHT0356b, NGB00699, NGB00739, NHT0226a, NHT0339a, NHT0366, NHT0216a, NHT0355a, NHT0259a, and NGB00713, as well as the control accessions, maintained a consistent chromosome number (2n = 2x = 24). The accessions NHT0206a, NHT0199c, and NHT0343a, which had 2n = 2x = 23 chromosomes, along with NGB00733 (2n = 2x = 22) and NH100 (2n = 2x = 20), exhibited chromosomal reductions. The chromosome counts of various accessions after Ph infection are shown in Figure 2.
Table 4.
Mean square variance of chromosome numbers in Ph- and Asp-treated accessions.
Table 5.
The estimated chromosome number of seven cells from selected accessions treated with Ph.
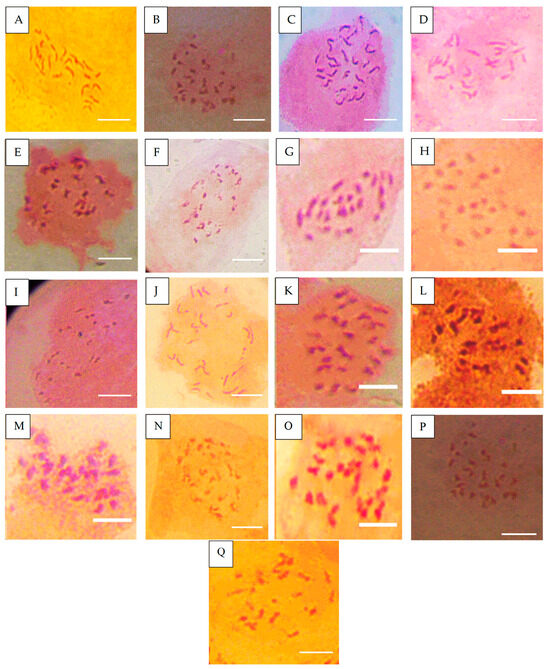
Figure 2.
Chromosome number of accessions after Ph infection. (A) = NHT0254b (24), (B) = NHT0356b (24), (C) = NGB00699 (24), (D) = NHT0206a (22), (E) = NHT100 (20), (F) = NHT0199c (22), (G) = NGB00733 (22), (H) = NGB00739 (24), (I) = NHT0343a (22), (J) = NHT0226a (24), (K) = NHT0339a (24), (L) = NHT0366 (24), (M) = NHT0216a (24), (N) = NHT0355a (24), (O) = NHT0259a (24), (P) = NGB00713 (24), (Q) = control (24), scale bar = 36 µm.
The chromosome counts of Asp-treated plant accessions are revealed in Table 6. The accessions NHT0254b, NHT0366, and NHT034a, as well as the control, maintained a diploid state with a chromosome number of 2n = 2x = 24. The accessions NGB00749, NHT0356b, and NHT0339a exhibited a chromosome number of 2n = 2x = 23, while NGB00739 and NGB00711 had 2n = 2x = 22 chromosomes, and NGB0206b, NHT0216a, NHT0355a, NHT0347, NHT0259a, and NGB00733 each had 2n = 2x = 21 chromosomes. Figure 3 reveals the number of chromosomes observed in various accessions after treatment with Asp.
Table 6.
The estimated chromosome number of seven cells from selected accessions treated with Asp.
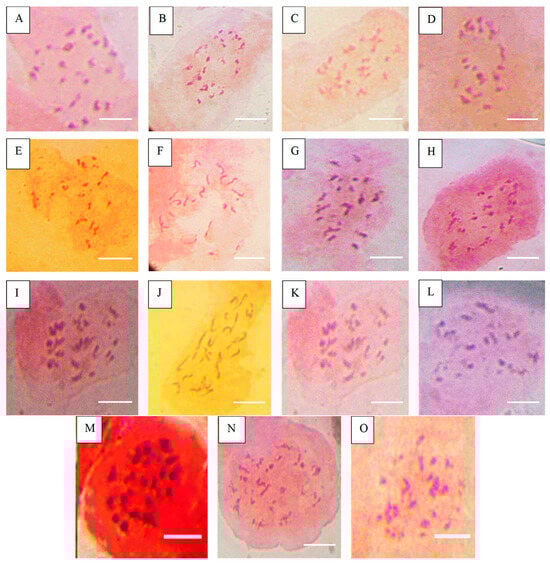
Figure 3.
Chromosome number of accessions after Asp treatment. (A) = NHT0254b (24), (B) = NGB00749 (23), (C) = NHT0356b (23), (D) = NHT0347 (21), (E) = NGB0206b (21), (F) = NHT0216a (21), (G) = NHT0366 (24), (H) = NHT0355a (21), (I) = NHT034a (24), (J) = NHT0339a (23), (K) = NHT0259a (21), (L) = NGB00739 (22), (M) = NGB00711 (22), (N) = NGB00733 (24), (O) = control (24), scale bar = 36 µm.
3.3. Interpretation of Variance Components, Heritability and Genetic Advance in Trait Analysis
When genotypic variance (GV) is higher than both phenotypic variance (PV) and environmental variance (EV), it suggests that the genetic differences between individuals in a population contribute more to the variation in a trait than either the environmental influences or the overall phenotypic expression. If the genotypic coefficient of variance (GCV) is high, it means that the genetic factors play a dominant role in shaping the trait variation. In this case, the genetic differences are responsible for much of the observed variation in the population. A high GCV in a trait indicates that selection based on genetic differences can lead to noticeable improvements in that trait. If the environmental coefficient of variance (ECV) is low, it suggests that environmental factors do not contribute significantly to the variation in the trait. This supports the idea that genotypic variance plays a more significant role compared to environmental factors in determining the trait expression. The phenotypic coefficient of variance (PCV) incorporates both genetic and environmental components, so if PCV is high, it suggests there is substantial total variation in the population. When GCV is higher than ECV, a high PCV indicates that variation observed in the trait is largely due to genetic factors, with environmental influences playing a lesser role.
When heritability (H) is 50% or above, it means that more than half of the variation in the trait is due to genetic factors. In other words, genetics plays a dominant role in the expression of the trait in the population. When heritability is less than 50%, it indicates that less than half of the variation in the trait is due to genetic factors, and environmental factors play a larger role in determining the trait’s expression. Heritability directly affects the genetic advance (GA) expected from selection. When heritability is high, genetic improvement is more efficient, and when it is low, the genetic response to selection will be slower and less impactful. Genetic advance as a percentage of the mean (GAM) quantifies this effect, showing how much the trait can improve relative to its average value over generations. Genetic advance as a percentage of the mean is low when the percentage is less than 10%, moderate when it is 10–20%, and high when it is greater than 20%.
3.4. Variance Components, Genetic Advance, and Heritability of Growth Characteristics of Treated Plants
The results from Table 7 show that growth traits are highly susceptible to Ph, with the EV consistently exceeding the GV, indicating a stronger environmental influence. The high ECV and high PCV for traits like NL further support this susceptibility. Heritability values suggest a significant environmental effect on these traits. GA was low across all traits, with the exception of NL, which exhibited a higher genetic advance. This reinforces the conclusion that genetic improvement was limited, as environmental factors played a dominant role in the phenotypic expression of these traits.
Table 7.
Variance components, GA, and heritability for growth characteristics of Ph-treated plants.
The results in Table 8 indicate that PH was highly susceptible to Asp, with a higher PV compared to GV, suggesting minimal genetic contribution. The dominance of environmental factors is further supported by high EV, high PCV, and low GA. For NL, the pathogen’s effect was more pronounced than that of genetic factors, as indicated by the higher PV than GV, the higher EV, and the strong environmental impact on phenotypic variation. The LL also showed a strong environmental effect, with a higher PV than GV. Similar trends were observed for LW. The SG exhibited a higher PV than GV, indicating that environmental factors played a dominant role.
Table 8.
Variance components, GA, and heritability for growth characteristics of Asp-treated plants.
3.5. Variance Components, Genetic Advance, and Heritability of Agronomic Characteristics of Plants
The results in Table 9 indicate that Ph. had a dominant influence on several traits. For SL and PL, the higher PV compared to GV, along with the high EV, suggest a stronger environmental effect, confirmed by the high PCV and ECV. The low GA and moderate GAM further highlight the significant impact of the pathogen. Similarly, STL also showed a strong environmental influence, with a higher PV than GV and a higher PCV than GCV, indicating that most variation in STL was driven by the pathogen, with low GA and moderate GAM supporting this suggestion. In contrast, traits like NDFFB and NDFF showed greater genetic influence, with higher GV compared to PV and low EV. For NDFFB, the heritability values indicated that genetic factors were the primary drivers of variation, supported by low GA and moderate GAM. The NDFF showed similar trends, with a higher genetic contribution to phenotypic variation, while the environmental effect of Ph. was weaker. For NI and NF, the results demonstrated the dominant environmental effect of Ph., with higher PV than GV and relatively high EV.
Table 9.
Variance components, GA, and heritability of agronomic characteristics of Ph treatments.
The results in Table 10 demonstrate that the pathogen Asp had a stronger influence than genetic factors on several traits. For SL and PL, the higher PV compared to GV and the relatively high EV suggest that Asp had a dominant effect on phenotypic variation. This was further supported by the higher PCV than GCV and the high ECV, with the low GA and moderate GAM reinforcing the pathogen’s impact. Heritability values confirmed that a larger portion of the variance was due to Asp rather than genetic factors. For STL, similar trends were observed, with a high PV and EV, indicating that the pathogen played a dominant role in phenotypic variation, as reflected by a low GA and moderate GAM. The low heritability of STL further confirmed that treatment effects were stronger than genetic contributions. In contrast, for NDFFB, genetic factors had a greater influence, as evidenced by the higher GV than PV and the low EV. Heritability values indicated that most of the variation was genetically controlled, with a smaller contribution from Asp. For NI and NF, the higher PV compared to GV and relatively high EV indicated that Asp had a stronger effect than genetic factors. The higher PCV and ECV values further emphasized the environmental impact. The low heritability of NI and NF confirmed that the pathogen was the dominant influence on these traits, with the low GA and high GAM reinforcing this conclusion.
Table 10.
Variance components, GA, and heritability of agronomic characteristics of Asp treatments.
3.6. Variance Components, Genetic Advance, and Heritability of Yield Characteristics of Plants
The results in Table 11 show that the traits NDFR, NFS, CFW, FDM, FW, NRC, PL, PLAL, SCAAPS, TFW, TP, NLS, and NS were predominantly influenced by pathogen (Ph.) treatment, as indicated by the higher PV and relatively high EV compared to GV. The higher PCV relative to GCV and the high ECV further support the dominance of the treatment effect over genetic factors. Heritability estimates showed that the genetic contribution was lower, with a smaller proportion of the variance attributable to genetic factors, while the treatment effect had a greater influence. Additionally, low GA values confirmed the stronger environmental influence on these traits. These findings align with studies that highlight the role of external treatments in shaping phenotypic expression. In contrast, traits such as FL, SC, and NC were primarily influenced by genetic factors, with higher GV compared to EV and higher GCV relative to ECV. Heritability estimates indicated a stronger genetic influence, with low GA for FL and NC, and moderate GA for SC.
Table 11.
Variance components, GA, and heritability of yield characteristics of Ph-treated plants.
The results in Table 12 reveal that the traits NDFR, NFS, CFW, FDM, FW, NRC, PL, PLAL, SCAAPS, TFW, TP, SC, NLS, NC, and NS were predominantly influenced by Asp, as indicated by the higher PV and environmental variance, while GV was consistently the least contributing factor. The higher PCV, coupled with high ECV and relatively low GCV, further supports the dominance of Asp treatment over genetic factors. Heritability estimates for these traits showed that a smaller proportion of the observed variance was due to genetic factors, with a larger influence from the treatment effect. Low GA was reported across all traits. Additionally, traits such as NDFR, CFW, NRC, PL, and PLAL exhibited low GA and moderate GA for FW, SCAAPS, and NS, while NF, FDM, TFW, TP, SC, NLS, and NC showed high GA, suggesting the stronger environmental influence of Asp treatment on these traits compared to genetic factors. The FL was the only trait strongly influenced by genetic factors, with higher GV and GCV compared to EV and ECV, respectively, indicating a predominant genetic contribution.
Table 12.
Variance components, GA, and heritability of yield characteristics of Asp-treated plants.
4. Discussion
4.1. Genetic Tolerance of Accessions to Ph and Asp
The high tolerance observed in certain accessions to Ph aligns with the findings of Arafa et al. (2017) [63], who reported resistance in the LA1777 accession. Similarly, the tolerance shown by NGB00699 and NHT0206a is consistent with the resistance levels reported for tomato accessions LA1352, LA2855, LA1347, LA1718, and LA1295. The moderate tolerance identified in other accessions correlates with accessions LA1269, LA1578, LA3152 (Ph-2), LA3151 (Ph-2), and LA4286 (Ph-3), which showed moderate resistance. The moderately susceptible accessions noted in this study are comparable to LA2196, while the susceptible accessions observed reflect patterns reported for accessions such as LA1252, LA1772, LA1223, LA1378, LA1367, LA1340, LA0716, LA1674, LA1478, LA1594, LA2646, and LA2009 (Ph-1).
Finally, the highly susceptible accessions correspond to the findings for accessions LA1303, LA1302, LA0751, LA1649, LA0443, LA1586, LA1561, LA0413, LA2147, LA1579, LA1617, LA1633, LA2391, LA3123, LA3161, LA1246, LA0375, LA0114, LA1237, LA1469, LA1256, LA1242, LA1343, LA1935, LA0446, LA2581, LA1333, and super strain B [63]. The tolerance levels observed in various lines are consistent with the findings of Arafa et al. (2017) [63] across similar accessions, confirming the validity of these accessions as benchmarks for tolerance studies. The variations observed in tolerance and susceptibility among the accessions can be attributed to genetic backgrounds. This highlights the significant role that genetic factors play in determining the response of accessions to pathogens, with tolerant accessions likely carrying specific genetic traits that confer tolerance, while susceptible ones may lack these protective genetic factors. Therefore, the genetic makeup of each accession is a critical determinant of its ability to cope with pathogen stress. The classification of tolerance and susceptibility provides a robust framework for identifying promising lines for further breeding programs. However, the variability in susceptibility highlights the importance of selecting tolerant accessions for environments prone to severe stress.
The high level of tolerance observed in Asp-infected accessions aligns with the findings of Aguilar-Gonzalez et al. (2017) [64], who reported a high level of tomato tolerance to Asp under three treatments using essential oil. Similarly, the tolerance noted in certain accessions is consistent with results from a related study utilizing a 3/4M treatment, which revealed 8 out of 20 positive cases following Asp inoculation. Furthermore, the moderately tolerant accessions observed in this study are in agreement with the same study, where a 1/2M concentration of essential oil treatment resulted in a 10 out of 20 infection rate after Asp inoculation. Meanwhile, the susceptible accessions identified correspond with the findings of Sale et al. (2018) [65], who reported susceptibility in Siria and UTC varieties of tomatoes (Solanum lycopersicum). These findings underscore the effectiveness of certain treatments in enhancing tolerance and highlight the variability in response among tomato varieties and lines.
4.2. Chromosomal Deletions After Pathogen Infection
This study demonstrates that the deletion of chromosomes occurs in tomatoes during infection by Phytophthora infestans (Ph) and Aspergillus (Asp), indicating complex host–pathogen interactions and cytological effects. Pathogen infections are shown to induce genomic stress, leading to chromosomal alterations. Ph infection causes the deletion of chromosomes, leading to the loss of host genes related to the genetic traits of resistance/tolerance and reactive oxygen species control, resulting in genomic changes, including deletions in chromosome number, particularly in susceptible tomato accessions [66,67]. Similarly, Asp infections are associated with metabolic disruptions that destabilize genome integrity. Chromosomal instability, such as deletions leading to aneuploidy, may arise as a result of pathogen-induced genomic pressure, weakening the plant’s defense mechanisms [41]. These findings highlight the cytogenetic consequences of pathogen infection and their potential role in modulating plant defense responses.
The chromosomal deletions observed in certain accessions that were treated with Ph differed from the findings of Bal and Abak (2007) [68] and El-Mansy et al. (2021) [69], who reported a diploid chromosome number of 2n = 2x = 24 in untreated tomato roots. These deletions were specifically observed under pathogen stress, indicating that these accessions, unlike the untreated ones, were susceptible to the pathogen. This suggests that Ph may induce chromosomal deletions as part of its infection strategy. Furthermore, the highest chromosome number of 2n = 2x = 26, reported by Bal and Abak (2007) [68] and El-Mansy et al. (2021) [69], was not observed in certain accessions and the control that showed tolerance, which retained the standard diploid chromosome number of 2n = 2x = 24. The discrepancies between the current study and previous findings can likely be attributed to differences in experimental treatments and conditions. However, the presence of the diploid chromosome number in Ph-tolerant accessions is consistent with the findings of Wang et al. (2006) [54], Song et al. (2012) [70], Gerszberg et al. (2015) [71], Singh et al. (2015) [72], Mesquita et al. (2019) [73], and Waiba et al. (2021) [21], supporting the stability of the chromosomal state under normal conditions.
Chromosomal deletions were observed in certain accessions, indicating susceptibility, while other accessions and the control accessions retained a diploid state of 2n = 2x = 24 chromosomes in Asp-treated plants, indicating tolerance. These findings suggest that Asp treatment induces chromosomal deletions in susceptible tomato accessions. The observed chromosomal deletions contrast with reports by Bal and Abak (2007) [68] and El-Mansy et al. (2021) [69], who documented a diploid state of 2n = 2x = 26 chromosomes in tomato. This discrepancy may result from differences in experimental treatments or plant genotypes used across studies. The genomic instability induced by pathogen–host interactions appears to underlie the chromosomal deletions observed in this study, as infections likely disrupt cellular processes critical for maintaining genomic integrity. Conversely, the diploid state observed in tolerant accessions aligns with findings from Brasileiro-Vidal et al. (2009) [74], Pavan et al. (2009) [75], Bhala and Verma (2018) [76], and Brake et al. (2022) [22]. These consistent results reinforce the hypothesis that genomic responses to stressors, including Asp treatment, are accession-specific and highlight the role of Asp in genomic destabilization within susceptible tomato genotypes.
4.3. Variance Components, Heritability, and Genetic Advance of Growth Characteristics
The analysis of growth traits under Ph treatment revealed a strong environmental influence, as indicated by the higher PV and EV compared to GV. This suggests that the growth traits are highly susceptible to pathogen attacks, with environmental factors playing a more prominent role than genetic factors in shaping phenotypic variation. The high ECV further supports this, demonstrating the substantial impact of environmental factors, particularly the pathogen, on the traits studied. The heritability values for these traits were low, reinforcing the conclusion that genetic contributions are minimal, and most of the observed variation was due to the pathogens and the environmental conditions. The low GA across all traits, along with moderate to high GAM for some traits like NL, suggests limited potential for genetic improvement in these growth traits under pathogen stress. This is consistent with findings from Meena et al. (2018) [77], who reported similarly low GA values for PH under pathogen stress. The moderate to high GAM for certain traits further emphasizes the role of environmental effects, suggesting that these traits may respond more readily to environmental manipulations rather than selective breeding for genetic resistance.
Contrastingly, studies like those of Pooja et al. (2022) [78] and Phom et al. (2016) [79] have reported differing levels of genetic contribution to traits such as PH and NL, which may reflect differences in genotypes and treatment conditions across different geographic regions. These discrepancies underscore the complexity of genotype–environment interactions and highlight the challenges of improving these traits genetically under pathogen stress. The high PCV observed in this study for traits like NL and LL, coupled with moderate GCV, contrasts with the results of studies like Yadav et al. (2017) [80], where lower GCV and PCV values were observed. These differences may be due to variations in experimental conditions, such as genotype or pathogen strains, and emphasize the role of environmental factors in shaping trait expression.
This study also revealed the strong environmental effect on traits like LW and SG, which showed a low genetic contribution, as evidenced by the low GV and high PV for these traits. This aligns with the findings of Tripura et al. (2016) [81], who similarly observed a high environmental influence on SG. However, the heritability values for these traits indicated susceptibility to pathogen attacks, in contrast to other studies where genetic resistance was the dominant influence, such as those by Yadav et al. (2017) [80], where LW was predominantly under genetic control. These differences again highlight the importance of considering genotype–environment interactions when assessing the impact of pathogens on phenotypic traits. In summary, the dominance of environmental factors, particularly pathogen treatment, over genetic factors in determining the growth traits studied suggests that improving resistance to pathogens in these traits may require strategies beyond traditional genetic selection. These may include optimizing environmental conditions or breeding to gain increased tolerance to environmental stress. The discrepancies observed between this study and previous research also highlight the influence of experimental variables such as pathogen strains, genotypic diversity, and environmental conditions on phenotypic outcomes.
The results of this study highlight the dominant influence of environmental factors, specifically Asp, on the phenotypic variation in growth traits, particularly PH, NL, LL, LW, and SG. The higher PV compared to GV, along with the high EV and relatively low genetic variance, indicates a stronger environmental influence, consistent with previous studies such as Shah et al. (2022) [82] and Saini et al. (2018) [83]. The high ECV further supports this conclusion, demonstrating that pathogen exposure has a significant impact on the traits observed. For PH and NL, the low GA and moderate GAM observed reinforce the conclusion that these traits are largely influenced by the pathogen treatment rather than genetic factors. The low GA values are consistent with findings by Shah et al. (2022) [82], who also reported minimal genetic contributions to the variation in PH. This suggests that improving these traits through traditional genetic selection may be challenging, as they are more susceptible to environmental factors, particularly pathogens.
Saini et al. (2018) [83] reported the similar dominant impact of environmental factors on NL and LL, where the high PV and EV, coupled with higher PCV than GCV, indicate that the pathogen’s effect predominated. However, there were discrepancies in the genetic influence, as Saini et al. (2018) [83] observed a higher genetic contribution than this study. These differences can likely be attributed to variations in accessions, genotypes, and experimental conditions. The trait LL, in particular, showed a similar trend, with higher PV and EV than GV, indicating that pathogen treatment had the strongest impact on phenotypic variation. While Saini et al. (2018) [83] found a stronger genetic influence on LL, this study’s results point to a more substantial environmental effect, as evidenced by higher PCV relative to GCV and low heritability, suggesting that the majority of the phenotypic variance was attributable to Asp treatment.
For traits like LW and SG, the environmental influence remained dominant, but the genetic contribution was relatively stronger for LW, with GA values reflecting this dominance. This finding is consistent with the results of Saini et al. (2018) [83], who also found genetic factors to be more influential in LW, whereas SG was largely influenced by environmental factors. The discrepancies observed between this study and those of Saini et al. (2018) [83], and Tripura et al. (2016) [81] regarding SG and LW are likely due to differences in the experimental setups, accessions, and pathogen strains used, emphasizing the role of genotype–environment interactions in shaping phenotypic expression. These variations across traits highlight the complexity of genetic–environmental interactions, with pathogen exposure exerting a stronger influence on some traits, while genetic factors play a more prominent role in others. This suggests that the improvement of resistance to pathogens in some traits may require environmental management strategies or breeding for tolerance to environmental stress, rather than focusing solely on genetic selection for resistance genes.
4.4. Variance Components, Heritability, and Genetic Advance of Agronomic Characteristics
The findings from this study highlight the varying contributions of genetic and environmental factors to the phenotypic variation of different traits in response to Ph. infection. For SL, PL, and STL, the results revealed a higher PV compared to GV, alongside substantial EV. This pattern suggests that Ph. had a dominant environmental effect on these traits. The higher PCV compared to GCV, coupled with the high ECV, further supports the conclusion that the pathogen played a significant role in shaping phenotypic outcomes. The low GA and moderate GAM for these traits suggest that genetic improvement for these traits under Ph stress may be limited. Heritability estimates confirmed that the bulk of the phenotypic variation in SL, PL, and STL was driven by the treatment effect rather than genetic factors, consistent with studies highlighting the strong influence of environmental treatments under pathogen stress [46,82].
On the other hand, NDFF and NI exhibited higher genetic variance than environmental variance. The lower EV observed, combined with the higher GV, suggests that these traits were more influenced by genetic factors. The consistent trends of low environmental contributions and high genetic variance emphasize that genetic factors primarily govern the variation observed in these traits. Heritability values indicated that most of the phenotypic variation in NDFF and NI was occurred genetic control, highlighting the role of tolerance genes in shaping these traits. This finding aligns with the work of Singh et al. (2015) [72], who that found genetic factors to play a dominant role in the determination of NDFF under stress conditions, suggesting genetic resilience in these traits.
For NF, the higher PV, along with the relatively high EV, indicates that the pathogen’s environmental influence was stronger than the impact of genetic contributions. The high PCV compared to GCV and the higher ECV observed here also point to the dominant effect of Ph on NF phenotypic variation, which aligns with the findings of Pandey et al. (2018) [46], who similarly reported that environmental factors were the dominant contributor to flower number under pathogen stress. The low heritability and high GAM for NF further suggest that environmental treatments, especially pathogen exposure, had a significant impact on this trait, overshadowing the genetic contributions.
Overall, the contrasting roles of genetic and environmental factors observed across traits reflect the complex interplay between genetics and pathogen-induced stress. For traits like NDFF and NI, genetic factors played a stronger role, while traits such as SL, PL, STL, and NF were more strongly influenced by the pathogen. These findings are consistent with previous studies that emphasized the importance of considering both genetic and environmental components when breeding for disease resistance and tolerance. The variations observed also underscore the influence of experimental conditions, such as pathogen strains, genotypic diversity, and environmental settings, which can modulate the genetic–environmental interactions responsible for phenotypic expression.
In this study, the PV for SL, PL, STL, NDFFB, NI, and NF was predominantly influenced by Asp treatment rather than genetic factors, as indicated by the higher PV compared to GV and the relatively high EV. This suggests that the environmental impact of the pathogen on these traits was stronger than the genetic contributions. For SL and PL, the higher phenotypic coefficients of variation (PCVs) compared to GCVs, along with high ECVs, further emphasized the dominance of the pathogen treatment. Heritability estimates revealed that a large portion of the observed variation in both SL and PL was due to Asp treatment rather than genetic factors, corroborating findings from previous studies on pathogen-induced phenotypic changes under stress conditions [46,82]. The low GA and moderate GAM for these traits reinforced the conclusion that Asp had a stronger influence than genetic factors. These trends are in line with reports that highlight the significant role of environmental factors in modulating phenotypic traits, particularly under pathogen stress.
Similarly, for STL, the higher PV, along with the higher PCV compared to GCV and the relatively high ECV, indicated that the treatment had a more pronounced effect on stamen length than genetic factors. The low heritability for STL suggested that the observed variation was largely driven by the environmental effects of Asp treatment, rather than genetic components. This is consistent with the general understanding of how pathogens can alter plant traits, as also noted by Saini et al. (2018) [83]. Conversely, NDFFB exhibited greater genetic influence, as indicated by lower EV and higher GV. The high heritability for NDFFB indicated that genetic factors were primarily responsible for the variation observed, while treatment effects had a lesser contribution. This supports findings from Singh et al. (2015) [72], who suggested that genetic factors, especially tolerance genes, could dominate in determining flowering time under controlled conditions.
For NI and NF, higher PV relative to GV, along with substantial EV, suggested a stronger environmental impact. The higher PCV and ECV further confirmed the dominant impact of Asp treatment on these traits, with heritability values indicating that a larger proportion of the variance in both traits was environmentally driven. These results align with studies like that of Pandey et al. (2018) [46], which also found that pathogen-induced stress strongly influenced flower development traits in plants. The low GA and high GAM for both NI and NF further supported the notion that Asp treatment had a dominant effect, as genetic improvement under these conditions was limited.
The findings underscore the complex interaction between genetic and environmental factors in shaping plant traits under pathogen stress. While some traits like NDFFB exhibited stronger genetic control, others, such as SL, PL, STL, NI, and NF, were predominantly shaped by the environmental influence of Asp treatment. This highlights the critical role of environmental factors in modulating phenotypic expression, particularly in the context of pathogen interactions, as demonstrated in this study and supported by similar research in the field [46,82,83]. The variation in the impact of genetic and environmental factors across traits emphasizes the need for a multifaceted approach when breeding for pathogen resistance, considering both genetic resilience and environmental conditions.
4.5. Variance Components, Heritability and Genetic Advance of Yield Characteristics
In this study, most of the yield traits were predominantly influenced by Ph treatment rather than genetic factors. This was evidenced by higher PV relative to GV and the consistently high EV. The PCV observed was also greater than the GCV, with ECV being similarly elevated, underscoring the strong environmental influence on these traits. Heritability estimates further confirmed that a larger proportion of the observed variance was attributable to the pathogen treatment rather than genetic factors, reinforcing the conclusion that external environmental influences played a dominant role in driving phenotypic variation. The low GA for these traits further supports the finding that genetic factors contributed minimally to the observed phenotypic differences under pathogen stress, consistent with earlier research highlighting the significant impact of external treatments under stress conditions [46,84].
Conversely, traits such as FL, SC, and NC were primarily influenced by genetic factors, as indicated by higher GV compared to EV and greater GCV relative to ECV. These traits exhibited higher heritability values, suggesting that genetic factors played a larger role in the trait’s expression. The moderate GA observed for SC and low GA seen for FL and NC further emphasized the importance of genetic control over these traits. These findings are consistent with those of Pooja et al. (2022) [78], who also reported a strong genetic influence on FL, highlighting the variability in genetic contributions across different traits.
On the other hand, traits such as NFS, CFW, NS, and NLS were more strongly influenced by the pathogen treatment, as evidenced by low heritability values and higher contributions from environmental variance. This contrasts with findings from Bhandari et al. (2017) [85], who reported a stronger genetic influence on these traits. These discrepancies likely arise from differences in genotypes, accessions, and treatments across the studies, indicating the context-dependent nature of genotype–environment interactions in phenotypic expression. Similarly, FDM, TP, and NLS showed dominant treatment effects in this study, diverging from the conclusions of Pooja et al. (2022) [78], who found genetic factors to be more influential. Likewise, in this study, FW was driven by treatment effects, contrasting with the findings of Somraj et al. (2017) [86], who reported stronger genetic control over this trait. These discrepancies underscore the significant role of experimental conditions, genotypic diversity, and treatment protocols in shaping phenotypic outcomes.
In conclusion, this study highlights the complex interaction between genetic and environmental factors in determining phenotypic traits under pathogen stress. While some traits like FL, SC, and NC were predominantly genetically driven, others such as NDFR, NFS, and NS were more strongly influenced by the pathogen (Ph). These results align with previous research but also reveal how experimental conditions, accessions, and environmental stress can modulate the relative contributions of genetic and treatment effects to shaping plant phenotypes.
In this study, certain traits were predominantly influenced by Asp treatment, as evidenced by higher PV and EV compared to GV. The consistently higher PCV relative to GCV, alongside the higher ECV, further supported the dominance of treatment effects. Additionally, heritability values revealed that a significant portion of phenotypic variation for these traits was driven by the pathogen treatment, with a minimal contribution from genetic factors. The low GA for these traits further corroborated the limited genetic contribution, emphasizing the stronger influence of environmental factors, particularly the pathogen stress, on phenotypic expression. Traits such as NDFR, CFW, NRC, PL, and PLAL also exhibited GAM, which reinforced the conclusion that Asp played a dominant role in determining phenotypic variation. These findings align with previous studies on genotype–environment interactions under pathogen stress, highlighting the pivotal role of environmental conditions in shaping phenotypic outcomes [46,84].
In contrast, traits like FL were strongly influenced by genetic factors, as indicated by the higher GV compared to EV and greater GCV relative to ECV. The heritability of FL further confirmed the predominant genetic influence over this trait, contrasting with other traits that were more strongly affected by pathogen treatment. These observations emphasize the variability in the contributions of genetic and environmental factors across traits. In this study, traits such as NLS were strongly influenced by the pathogen treatment, differs from the findings of Rasheed et al. (2023) [87], who reported genetic dominance. Similarly, traits like TP and CFW showed a higher environmental influence in this study, diverging from findings by Meena et al. (2018) [77], where these traits were attributed to genetic factors. Such differences may arise due to variations in experimental conditions, accessions, and treatments between studies.
The discrepancies in the observed genetic and environmental influences on traits such as NC, FDM, NF, and NS reflect the dynamic interaction between treatment and genetic factors. In this study, these traits were predominantly influenced by pathogen effects, while studies by Meena et al. (2018) [77] and Singh et al. (2015) [72] reported genetic control over traits like NC and NF. Similarly, Aralikatti et al. (2018) [88] found genetic factors to be the primary drivers of NS. These variations underscore the importance of experimental conditions, treatment protocols, and genotype–environment interactions in determining the phenotypic expression of traits under pathogen stress.
In summary, this study demonstrates the significant influence of Asp treatment on most traits, with a few exceptions where genetic factors exerted a stronger influence, such as for FL. The contrasting results with previous studies highlight the complex interplay between genetic and environmental factors, emphasizing the role of experimental context in modulating phenotypic outcomes.
5. Conclusions
This work revealed the tolerance profile of thirty germplasm accessions of tomato to Phytophtora infestans (Ph) and Aspergillus niger (Asp) infections, the effect of these pathogens on chromosomes and variance components, and the genetic advance and heritability of phenotypic characteristics in response to pathogens. This study showed that NHT0254b and NGB00699 showed no chromosomal deletions tolerant to Ph, while NHT0254b, NHT0366, and NHT034a, with a diploid chromosome number, were tolerant to Asp treatment. Plant height, the number of leaves, leaf length, leaf width, and stem girth were susceptible to Ph and Asp during infection. The sepal length, petal length, stamen length, the number of inflorescences, and the number of flowers were susceptible to both microbes, while the number of days to the first flower bud and number of days to the first flower were tolerant. The number of days to fruit ripening, the number of fruits, cumulative fruit weight, fruit diameter at maturity, fruit width, the number of ribs at calyx, pedicel length, pedicel length from abscission layer, the size of the corky area around the pedicel scar, the thickness of the fruit wall, the thickness of the pericarp, the number of locules, and the number of seeds were susceptible to Ph, while fruit length, the size of the core, and number of chambers were tolerant. Fruit length was the only yield characteristic that showed tolerance to Asp infection, while the remaining characteristics were susceptible. Therefore, tolerant germplasm accessions and morphological characteristics that confer tolerance can be selected and improved to prevent the effect of these pathogens on tomato. However, some accessions treated with Ph (NHT0206a, NHT0199c, NGB00733, NHT0366, NHT0355a, NHT0259a and NGB00713) and Asp (NHT0254b, NHT0356b, NHT0366, NHT0355a, NHT0347 and NGB00711) showed the possibility of deviation from the observed disease severity ratings in the long run; further resistance and susceptibility status will be determined in “Molecular expression of Thaumatin-Like-Protein resistant gene 5 in Solanum lycopersicum L. (Tomato) to Phytophthora infestans and Aspergillus niger”.
Author Contributions
Conceptualization, T.M.A. and O.J.O.; methodology, T.M.A. and O.J.O.; software, T.M.A. and O.J.O.; validation, T.M.A., O.J.O. and S.G.J.; formal analysis, T.M.A.; investigation, T.M.A.; resources, T.M.A.; data curation, T.M.A., writing—original draft preparation, T.M.A. and O.J.O.; writing—review and editing, O.J.O. and S.G.J.; visualization, T.M.A., O.J.O. and S.G.J.; supervision, O.J.O. and S.G.J.; project administration, T.M.A. and O.J.O.; funding acquisition, T.M.A. All authors have read and agreed to the published version of the manuscript.
Funding
The research was funded by TETFUND, Nigeria, under grant number TETFUND/2021/PS721/006.
Data Availability Statement
The datasets generated and analyzed in this study are not publicly available due to institutional policies but can be obtained from the corresponding author upon request.
Conflicts of Interest
The authors declare no conflict of interest.
References
- Tejada-Alvarado, J.J.; Meléndez-Mori, J.B.; Vilca-Valqui, N.C.; Neri, J.C.; Ayala-Tocto, R.Y.; Huaman-Huaman, E.; Gill, E.R.A.; Oliva, M.; Goñas, M. Impact of wild solanaceae rootstocks on morphological and physiological response, yield, and fruit quality of tomato (Solanum lycopersicum L.) grown under deficit irrigation conditions. Heliyon 2023, 9, e12755. [Google Scholar] [CrossRef]
- Lee, K.J.; Lee, G.; Ma, K.; Raveendar, S.; Cho, Y.; Lee, J.; Chung, J. Chemical Constitutions and Antioxidant Activities of Tomato Leaf Extracts. Plant Breed. Biotech. 2016, 4, 362–372. [Google Scholar] [CrossRef]
- Vermeiren, J.; Villers, S.L.; Wittemans, L.; Vanlommel, W.; Roy, J.V.; Marien, H.; Coussement, J.R.; Steppe, K. Quantifying the importance of a realistic tomato (Solanum lycopersicum) leaflet shape for 3-D light modelling. Ann. Bot. 2020, 126, 661–670. [Google Scholar] [CrossRef]
- Chikkeri, S.S.; Kumar, S.; Samnotra, R.K.; Loona, D.; Noopur, K. Evaluation of tomato (Solanum lycopersicum L.) genotypes for growth, yield attributes and yield under subtropical region of Jammu. J. Pharm. Innov. 2023, 12, 3036–3038. [Google Scholar]
- Alani, M.A.R.; Elkaaby, E.A.J.; Majeed, W.A.A.; Al-Mandelawy, F.N.; Almaliky, A.K.Q.; Raad, J.M.; Salih, K.S.; Jabbar, N.; Shukor, K. Evaluation of Growth, Yield and some Qualities Characteristics of Two Cherry Tomato (Solanum lycopersicum var. cerasiforme) Cultivars under Plastichouse Conditions. Earth Environ. Sci. 2023, 1225, 012026. [Google Scholar] [CrossRef]
- Gutierrez, E.E.V. An overview of recent studies of tomato (Solanum lycopersicum spp.) from a social, biochemical and genetic perspective on quality parameters. J. Basic Microbiol. 2018, 50, 211–217. [Google Scholar]
- Altemimi, A.; Lakhssassi, N.; Baharlouei, A.; Watson, D.G.; Lightfoot, D.A. Phytochemicals: Extraction, Isolation, and Identification of Bioactive Compounds from Plant Extracts. Plants 2017, 6, 42. [Google Scholar] [CrossRef]
- Tuan, M.H. Agronomic requirement and Production Methods Tomatoes in the Red River Delta of Vietnam. J. Trop. Crop Sci. 2015, 2, 33–38. [Google Scholar]
- Islam, M.M.; Jahan, K.; Sen, A.; Urmi, T.A.; Haque, M.M.; Ali, H.M.; Siddique, M.H.; Murata, Y. Exogenous Application of Calcium Ameliorates Salinity Salt Tolerance of Tomato (Solanum lycopersicum L.) and Enhances Food Quality. Antioxidants 2023, 12, 2–22. [Google Scholar] [CrossRef]
- Ahmed, D.A.E.; Slima, D.F.; Al-Yasi, H.M.; Hassan, L.M.; Gala, T.M. Risk assessment of trace metals in Solanum lycopersicum L. (tomato) grown under wastewater irrigation conditions. Environ. Sci. Pollut. Res. 2023, 30, 42255–42266. [Google Scholar] [CrossRef]
- Arah, I.K.; Ahorbo, G.K.; Anku, E.K.; Ernest, K.K.; Amaglo, H. Postharvest Handling Practices and Treatment Methods for Tomato Handlers in Developing Countries. Adv. Agric. 2016, 1, 6436945. [Google Scholar] [CrossRef]
- Onuorah, S.; Orji, M.U. Fungi Associated with the Spoilage of Post-harvest Tomato Fruits Sold in Major Markets in Awka, Nigeria. Univers. J. Microbiol. Res. 2015, 3, 11–16. [Google Scholar]
- Bello, O.B.; Ullah, H.; Olawuyi, O.; Adebisi, O.; Azeez, A.H.; Owoade, T.A. Microorganisms causing post-harvest tomato (Solanum lycopersicum L.) fruit decay in Nigeria. J. Entomol. Zool. Stud. 2016, 4, 374–377. [Google Scholar]
- Ezikanyi, D.N. Isolation and Identification of Fungi Associated with Postharvest Decay of Lycopersicum esculentum M. sold in Abakaliki, Nigeria. IOSR J. Agric. Vet. Sci. 2016, 9, 87–89. [Google Scholar]
- Sajad, A.M.; Jamaluddin, J.; Abid, H.Q. Fungi Associated with the Spoilage of Post-Harvest Tomato Fruits and Their Frequency of Occurrences in Different Markets of Jabalpur, Madhya-Pradesh, India. Int. J. Curr. Res. Rev. 2017, 9, 12–16. [Google Scholar]
- Lamidi, Y.; Agieni, G.A.; Isreal, O.A. Isolation and Identification of Fungi Associated with Tomato (Lycopersicon esculentum M.) ROT. IOSR. J. Agr. Vet. Sci. 2020, 3, 2617–3131. [Google Scholar]
- Santos, G.G.; Mattos, L.M.; Moretti, C.L. Quality and Occurrence of Mycotoxins in Tomato Products in the Brazilian Market. Enzym. Eng. 2016, 5, 2–7. [Google Scholar] [CrossRef]
- Mekapogu, M.; Jumg, J.A.; Kwon, O.K.; Ahn, M.S.; Song, H.Y.; Jang, S. Recent Progress in Enhancing Fungal Disease Resistance in Ornamental Plants. Int. J. Mol. Sci. 2021, 22, 7956. [Google Scholar] [CrossRef]
- Gwa, V.I.; Lum, A.F. Isolation and identification of fungi associated with fruit rot disease of tomato (Solanum lycopersicum L.) in the Southern Guinea savannah, Nigeria. Int. J. Pathog. Res. 2023, 12, 92–98. [Google Scholar] [CrossRef]
- Agbabiaka, T.O.; Saliu, B.K.; Sule, I.O.; Oyeyiola, G.P.; Odedina, G.F. Microbial Deterioration of Tomato Fruit (Lycopersicon esculentum) Sold in Three Popular Markets in Ilorin, Kwara State, Nigeria. Fountain J. Nat. Appl. Sci. 2020, 4, 10–18. [Google Scholar] [CrossRef]
- Waiba, K.M.; Sharma, P.; Kumar, K.I.; Chauhan, S. Studies of Genetic Variability of Tomato (Solanum lycopersicum L.) Hybrids under Protected Environment. Int. J. Bio-Resour. Stress Manag. 2021, 12, 264–270. [Google Scholar] [CrossRef]
- Brake, M.; Al-Qadumii, L.; Hamasha, H.; Migdadi, H.; Awad, A.; Haddad, N.; Sadder, M. Development of SSR Markers Linked to Stress Responsive Genes along Tomato Chromosome 3 (Solanum lycopersicum L.). BioTech 2022, 11, 2–14. [Google Scholar] [CrossRef]
- Fraser, J.A.; Huang, J.C.; Pukkila-Worley, R.; Alspaugh, J.A.; Mitchell, T.G.; Heitman, J. Chromosomal translocation and segmental duplication in Cryptococcus neoformans. Eukaryot. Cell. 2005, 4, 401–406. [Google Scholar] [CrossRef]
- Langner, T.; Harant, A.; Gomez-Luciano, L.B.; Shrestha, R.K.; Malmgren, A.; Latorre, S.M.; Kamoun, S. Genomic rearrangements generate hypervariable mini-chromosomes in host-specific isolates of the blast fungus. PLoS Genet. 2021, 17, e1009386. [Google Scholar] [CrossRef]
- Van Westerhoven, A.C.; Aguilera-Galvez, C.; Nakasato-Tagami, G.; Shi-Kunne, X.; Martinez de la Parte, E.; Chavarro-Carrero, E.; Seidl, M.F. Segmental duplications drive the evolution of accessory regions in a major crop pathogen. New Phytol. 2024, 242, 610–625. [Google Scholar] [CrossRef]
- Kumar, V.; Singh, D.; Gupta, R. Epigenetic responses in tomato (Solanum lycopersicum) under Aspergillus niger infection: DNA methylation dynamics and gene expression profiling. J. Plant Interact. 2021, 16, 100–112. [Google Scholar]
- Zhang, L.; Li, B.; Xu, X.; Chen, Y. Transcriptional profiling of tomato (Solanum lycopersicum) in response to Phytophthora infestans infection reveals key genes involved in disease resistance. Plant Physiol. Biochem. 2022, 172, 1–10. [Google Scholar]
- Abioye, J.; Raymond, J.; Olayemi, I. Spatial distribution and isolation of microbiota associated with spoilage of tomatoes sold in selected Markets in in Nassarawa State, Nigeria. J. Appl. Life Sci. 2021, 24, 10–24. [Google Scholar] [CrossRef]
- Sola, A.O.; Oluwatoyin, I.O.; Samuel, A.O.; John, L.B. Isolation and identification of bacteria and fungi associated with tomatoes. Med. Clin. Res. 2022, 7, 1–11. [Google Scholar]
- Sobowale, A.A.; Omole, I.D.; Olawuyi, O.J. Relationship Among Fungi Associated with Whole and Rotting Solanum lycopersicum L. and Two Capsicum Species from Different Locations. Eur. J. Appl. Physiol. 2022, 10, 73–89. [Google Scholar]
- Danaski, A.I.; Shugaba, A.; Milala, M.A.; Ndirmbula, J.B.; Gidado, A. Isolation, Identification and Pathogenicity Study of the Microbes Causing Tomato Post-Harvest Spoilage in Maiduguri Metropolis, Maiduguri, Nigeria. Nig. J. Bioch. Mol. Bio. 2022, 37, 303–313. [Google Scholar]
- Ya, A.; Ibrahim, B.; Aminu, F.; Ali, M. Incidence of Fungi Associated with the Spoilage of Post-Harvest Decay of Tomato (Lycopersicum esculentum) In Badikko Kaduna. North. Nig. J. Pulm. Dis. Resp. Med. 2022, 3, 1–4. [Google Scholar]
- Sani, A.; Abubakar, M.; Hamisu, A. Fungal pathogens associated with post-harvest deterioration of tomato fruits in Jega Local Government Area, Kebbi, Nigeria. Int. J. Educ. Res. Rev. 2023, 4, 1303–1308. [Google Scholar]
- Akotowanou, O.C.A.; Adjou, E.S.; Kougblenou, S.D.; Akpo, E.; Oluba, A.B.; Ahoussi, E.D.; Yessoufou, A.; Bankole, H.; Sohounhloue, D.C.K. Occurrence of Foodborne Bacteria with Outbreak Potentials and Fungi Associated with Tomato (Solanum lycopersicum L.) in Postharvest. J. Adv. Microbiol. 2023, 23, 7–14. [Google Scholar] [CrossRef]
- Okolo, E.; Abubakar, A. Investigation of the mycoflora of deteriorating tomatoes (Solanum lycopersicum mill.) Sold in Lokoja Markets, Kogi state, Nigeria. Sci. World J. 2023, 18, 597–601. [Google Scholar] [CrossRef]
- Ohlson, E.W.; Foolad, M.R. Genetic analysis of resistance to tomato late blight in Solanum pimpinellifolium accession PI 163245. Plant Breed. 2016, 135, 391–398. [Google Scholar] [CrossRef]
- Bharathkumar, M.V.; Sadashiva, A.T.; Punith, K.R. Combining ability, gene action and heritability analysis for early blight resistance, yield and quality traits in tomato (Solanum lycopersicum L.). J. Appl. Nat. Sci. 2017, 9, 1495–1500. [Google Scholar]
- Kouam, E.B.; Dongmo, J.R.; Djeugap, J.F. Exploring morphological variation in tomato (Solanum lycopersicum): A combined study of disease resistance, genetic divergence and association of characters. Agric. Trop. Subtrop. 2018, 51, 71–82. [Google Scholar] [CrossRef]
- Plouznikoff, k.; Asins, M.J.; De Boulois, H.D.; Carbonell, E.A.; Declerck, S. Genetic analysis of tomato root colonization by arbuscular mycorrhizal fungi. Ann. Bot. 2019, 124, 933–946. [Google Scholar] [CrossRef]
- Rubio, M.B.; De Medeiros, H.A.; Morán-Diez, M.E.; Castillo, P.; Hermosa, R.; Monte, E. A Split-Root Method to Study Systemic and Heritable Traits Induced by Trichoderma in Tomato Plants. In Methods in Rhizosphere Biology Research; Reinhardt, D., Sharma, A., Eds.; Rhizosphere Biology; Springer: Singapore, 2019. [Google Scholar]
- Panthee, D.R.; Pandey, A.; Paudel, R. Multiple Foliar Fungal Disease Management in Tomatoes: A Comprehensive Approach. Int. J. Plant Biol. 2024, 15, 69–93. [Google Scholar] [CrossRef]
- Sullenberger, M.T.; Jia, M.; Gao, S.; Foolad, M.R. Genetic analysis of late blight resistance in Solanum pimpinellifolium accession PI 270441: Heritability and response to selection. Plant Breed. 2018, 137, 89–96. [Google Scholar] [CrossRef]
- Copati, M.G.; Alves, F.M.; Dariva, F.D.; Pessoa, H.P.; Dias, F.O.; Carneiro, P.C.; Nick, C. Resistance of the wild tomato Solanum habrochaites to Phytophthora infestans is governed by a major gene and polygenes. An. Acad. Bras. Ciênc. 2019, 91, e20190149. [Google Scholar] [CrossRef] [PubMed]
- Elafifi, S.T.; Ramadan, W.A.; El-Saady, W.A.; Abdelmalek, P.A. Inheritance of Resistance against Phytophthora Infestans in Wiled Tomato Genotype (Lycopersicon hirsutum l03684). J. Plant Prod. Sci. 2019, 10, 675. [Google Scholar]
- Jia, M.; Foolad, M.R. Genetic analysis of late blight resistance in a new RIL population of tomato derived from LB-resistant Solanum pimpinellifolium accession PI 270443. Plant Breed. 2020, 139, 651–659. [Google Scholar] [CrossRef]
- Pandey, R.P.; Kumar, N.; Mishra, S.P. Study on genetic variability, heritability and genetic advance in tomato (Solanum lycopersicum L Mill.). J. Pharmacogn. Phytochem. 2018, 7, 3387–3389. [Google Scholar]
- Olowe, O.M.; Olawuyi, O.J.; Sobowale, A.A.; Odebode, A.C. Role of arbuscular mycorrhizal fungi as biocontrol agents against Fusarium verticillioides causing ear rot of Zea mays L. (Maize). Curr. Plant Biol. 2018, 15, 30–37. [Google Scholar] [CrossRef]
- Dossoumou, M.E.; Sikirou, R.; Adandonon, A.; Gonroundobou, J.; Baba-Moussa, L. Tomato Hybrid and Local Varieties Screened for Resistance to Bacterial Wilt Caused by Ralstonia solanacearum under Screen House and Field Conditions. Am. J. Plant Sci. 2021, 12, 1222–1235. [Google Scholar] [CrossRef]
- Olawuyi, O.J.; Ajie, V.I. Diverse morphological and molecular patterns of tomato (Solanum lycopersicum Linn.) accessions. Plant Gene. 2023, 34, 100423. [Google Scholar] [CrossRef]
- Oyewole, B.O.; Olawuyi, O.J.; Odebode, A.C.; Abiala, M.A. Influence of Arbuscular Mycorrhiza fungi (AMF) on Drought Tolerance and Charcoal Rot Disease of Cowpea. Biotechnol. Rep. 2017, 14, 8–15. [Google Scholar] [CrossRef]
- Naika, S.; Jeude, J.L.; Goffau, M.; Hilmi, M.; Dam, B. Agrdock. In Cultivation of Tomato; Production, Processing and Marketing; Dam, B.V., Ed.; Digigrafi Press: Wageningen, The Netherlands, 2019; pp. 6–92. [Google Scholar]
- Jonathan, S.G.; Babalola, B.J.; Olawuyi, O.J.; Odebode, J.A.; Ajayi, O.A. Nutritional composition and fungi deterioration of canned tomato products collected from Ibadan, South-western Nigeria. Trop. Plant Res. 2016, 3, 642–648. [Google Scholar] [CrossRef]
- Olowe, O.M.; Odebode, A.C.; Olawuyi, O.J.; Akanmu, A.O. Correlation, Principal Component Analysis and Tolerance of Maize Genotypes to Drought and Diseases in Relation to Growth Traits. Am.-Eurasian J. Agric. Environ. Sci. 2013, 13, 1554–1561. [Google Scholar]
- Wang, Y.; Tang, X.; Cheng, Z.; Mueller, L.; Giovanannoni, J.; Tanksley, S.D. Euchromatin and Pericentromeric Heterochromatin: Comparative Composition in the Tomato Genome. Genetics 2006, 172, 2529–2540. [Google Scholar] [CrossRef] [PubMed]
- Szinay, D. The Development of FISH Tools for Genetic, Phylogenetic and Breeding Studies in Tomato (Solanum lycopersicum); Wageningen University: Wageningen, NL, USA, 2010. [Google Scholar]
- Sarma, S.; Pandey, A.K.; Sharma, K.; Ravi, M.; Sreelakshmi, Y.; Sharma, R. MutS-Homolog2 silencing generates tetraploid meiocytes in tomato (Solanum lycopersicum). Plant Direct. 2017, 1, 1–5. [Google Scholar] [CrossRef]
- Willem, M.J.; Rengs, V.; Schmidt, M.H.W.; Effgen, S.; Le, D.B.; Wang, Y.; Zaidan, M.W.A.; Huetel, B.; Schouten, O.J.; Usadel, B.; et al. A chromosome scale tomato built from complementary PacBio and Nanopore sequences alone reveals extensive linkage drag during breeding. Plant J. 2022, 110, 572–588. [Google Scholar]
- Wahua, C.; Olaleye, S.M. Comparative Taxonomic Studies on Solanum aethiopicum Linn. and Solanum nigrum Linn. (Solanaceae). Greener J. Agric. Sci. 2013, 3, 849–854. [Google Scholar] [CrossRef]
- Ngwe, F.N.; Siljak-Yakovlev, S. Sex Determination in Dioscorea dumetorum: Evidence of Heteromorphic Sex Chromosomes and Sex-Linked NORs. Plants 2023, 12, 228. [Google Scholar] [CrossRef]
- International Plant Genetic Resources Institute (IPGRI). Descriptors for Tomato (Lycopersicon spp.); International Plant Genetic Resources Institute: Rome, Italy, 1996; 44p. [Google Scholar]
- Sauder, D. Examining the Type I Error and Power of 18 Common Post-Hoc Comparison Tests. Graduate Psychology: James Madison University. 2017. Available online: https://commons.lib.jmu.edu/cgi/viewcontent.cgi (accessed on 8 March 2025).
- Awadallah, S.S.I.; Ata, T.E.; Hashem, A.S.; Shetefa, M.F. Influence of Different Stored Grains on Adult Emergence Rates and Weight Loss by the Rice Weevil Sitophilus oryzae (Coleoptera: Curculionidae). J. Plant Prot. Pathol. 2024, 15, 45–49. [Google Scholar] [CrossRef]
- Arafa, R.A.; Moussa, O.M.; Soliman, N.E.; Shirasawa, K.; Kamel, S.M.; Rakha, M.T. Resistance to Phytophthora infestans in tomato wild relatives. Afr. J. Agric. Res. 2017, 12, 2188–2196. [Google Scholar]
- Anguilar-Gonzalez, A.E.; Palou, E.; Lopez-Malo, A. Response of Aspergillus niger Inoculated on Tomatoes Exposed to Vapor Phase Mustard Essential Oil for Short or Long Periods and Sensory Evaluation of Treated Tomatoes. J. Food Qual. 2017, 2017, 4067856. [Google Scholar]
- Sale, A.; Sadiq, M.A.; Abbac, H.M.; Ahmadd, M.; Yuguda, U.A. Variation in Resistance to Fungal Attack among Tomato (Solanum lycopersicum) Fruits Varieties Sold in Gombe Metropolis, Nigeria. Int. J. Appl. Sci. 2018, 39, 139–148. [Google Scholar]
- Ayala-Usma, D.A.; Cárdenas, M.; Guyot, R.; Mares, M.C.D.; Bernal, A.; Muñoz, A.R.; Restrepo, S. A whole genome duplication drives the genome evolution of Phytophthora betacei, a closely related species to Phytophthora infestans. BMC Genom. 2021, 22, 795. [Google Scholar] [CrossRef]
- Liu, C.; Zhang, Y.; Tan, Y.; Zhao, T.; Xu, X.; Yang, H.; Li, J. CRISPR/Cas9-mediated SlMYBS2 mutagenesis reduces tomato resistance to Phytophthora infestans. Int. J. Mol. Sci. 2021, 22, 11423. [Google Scholar] [CrossRef] [PubMed]
- Bal, U.; Abak, K. Haploidy in tomato (Lycopersicon esculentum Mill.):a critical. Rev. Euphytica 2007, 158, 1–9. [Google Scholar] [CrossRef]
- El-Mansy, A.B.; El-Moneim, D.A.; Alshamrami, S.M.; Safhi, F.A.; Abdein, M.A.; Ibrahim, A.A. Genetic Diversity Analysis of Tomato (Solanum lycopersicum L.) with Morphological, Cytological, and Molecular Markers under Heat Stress. Horticulturae 2021, 7, 2–18. [Google Scholar] [CrossRef]
- Song, C.; Guo, J.; Sun, W.; Wang, Y. Whole Genome Duplication of Intra- and Inter-chromosomes in the Tomato Genome. J. Genet. Genom. 2012, 39, 361–368. [Google Scholar] [CrossRef] [PubMed]
- Gerszberg, A.; Hnatuszko-Konka, K.; Kowalczyk, T.; Kononowicz, A.K. Tomato (Solanum lycopersicum L.) in the service of biotechnology. Plant Cell Tissue Organ Cult. 2015, 120, 881–902. [Google Scholar] [CrossRef]
- Singh, N.; Ram, C.N.; Deo, C.; Yadav, G.C.; Singh, D.P. Genetic Variability, Heritability and Genetic Advance in Tomato (Solanum Lycopersicum L.). Plant Archives. 2015, 15, 705–709. [Google Scholar]
- Mesquita, A.T.; Cruz, M.V.R.; Azevedo, A. Chromosome number and genome size diversity in five Solanaceae genome. Caryologia 2019, 7, 0008–7114. [Google Scholar]
- Brasileiro-Vidal, A.C.; Melo-Oliveira, M.B.; Carvalheira, G.M.G.; Guerra, M. Different chromatin fractions of tomato (Solanum lycopersicum, L.) and related species. Micron 2009, 40, 851–859. [Google Scholar] [CrossRef]
- Pavan, S.; Van, H.; Adriaan, W.; Bai, Y. Solanum lycopersicum (Tomato). In Encyclopedia of Life Sciences (ELS); John Wiley & Sons, Ltd.: Chichester, UK, 2009. [Google Scholar]
- Bhala, V.P.; Verma, R.C. Gamma rays induced chromosomal aberrations in tomato (Solanum lycopersicum L.). Chromosome Botany. 2018, 12, 86–90. [Google Scholar] [CrossRef]
- Meena, R.K.; Kumar, S.; Meena, M.L.; Verma, S. Genetic variability, heritability and genetic advance for yield and quality attributes in tomato (Solanum lycopersicum L.). J. Pharmacogn. Phytochem. 2018, 7, 1937–1939. [Google Scholar]
- Pooja, H.M.; Gasti, V.D.; Bhavidoddi, A.; Yashavantakumar, H.K.; Prashantha, A.; Srikantaprasad, D. Genetic variability, heritability and genetic advance in determinate types of tomato (Solanum lycopersicum L.). Pharm. Innov. 2022, 11, 222–225. [Google Scholar]
- Phom, M.; Chaturvedi, H.P.; Kanaujia, S.P. Genetic variability, character association and path coefficient analysis in tomato (Lycopersicon esculentum mill.) Genotypes. Plant Arch. 2016, 15, 519–522. [Google Scholar]
- Yadav, S.; Ameta, K.D.; Sharma, S.K.; Dubey, R.B.; Rathore, R.S.; Kumar, H.; Kapuriya, V.K. Effect of Spacing and Training on Vegetative Growth Characteristics and Yield of Tomato (Solanum lycopersicum L.) Grown in Polyhouse. J. Curr. Microbiol. Appl. Sci. 2017, 6, 1969–1976. [Google Scholar] [CrossRef]
- Tripura, A.; Das, A.; Das, B.; Priya, B.; Sarkar, K.K. Genetic studies of variability, character association and path analysis of yield and its component traits in potato (Solanum tuberosum L.). J. Crop Weed. 2016, 12, 56–63. [Google Scholar]
- Shah, L.R.; Ahmed, N.; Murtaza, I.; Khan, I.; Hussain, K.; Khan, T.; Rashid, R.; Javeed, T.; Khan, S.; Janeesa, N. Genetic studies in tomato (Solanum spp.) under temperate conditions. Pharm. Innov. 2022, 11, 463–465. [Google Scholar]
- Saini, P.; Chauhan, S.S.; Shabnam, A.A.; Chand, L.; Negi, N. Genetic Variability and Trait Association Analysis for Agro-Morphological Markers in Mulberry Genetic Resources from Kashmir, India. Int. J. Curr. Microbiol. Appl. Sci. 2018, 7, 1799–1812. [Google Scholar] [CrossRef]
- Mohamed, S.M.; Ali, E.E.; Mohamed, T.Y. Study of Heritability and Genetic Variabilityamong Different Plant and Fruit Characters of Tomato (Solanum lycopersicon L.). Int. J. Sci. Res. 2012, 1, 55–58. [Google Scholar]
- Bhandari, H.R.; Srivastava, K.; Reddy, G.E. Genetic Variability, Heritability and Genetic Advance for Yield Traits in Tomato (Solanum lycopersicum L.). Int. J. Curr. Microbiol. Appl. Sci. 2017, 6, 4131–4138. [Google Scholar] [CrossRef]
- Somraj, B.; Reddy, R.V.; Reddy, K.R.; Saidaiah, P.; Reddy, M.T. Genetic variability, heritability and genetic advance for yield and quality attributes in heat tolerant exotic lines of tomato (Solanum lycopersicum L.). J. Pharmacogn. Phytochem. 2017, 6, 1956–1960. [Google Scholar]
- Rasheed, A.; Iliya, M.; Khan, T.N.; Mahmood, A.; Riaz, U.; Chattha, M.B.; Najila, A.T.; Kashgry, A.; Hassan, M.U.; Wu, Z.; et al. Study of genetic variability, heritability and genetic advancefor yield related traits in tomato (Solanum lycopersicum Mill). Front. Genet. 2023, 10, 3389. [Google Scholar]
- Aralikatti, O.; Kanwar, S.H.; Chatterjee, S.; Patil, S.; Khanna, A. Genetic variability, heritability and genetic gain for yield and quality traits in tomato (Solanum lycopersicum L.). Int. J. Chem. Stud. 2018, 6, 3095–3098. [Google Scholar]
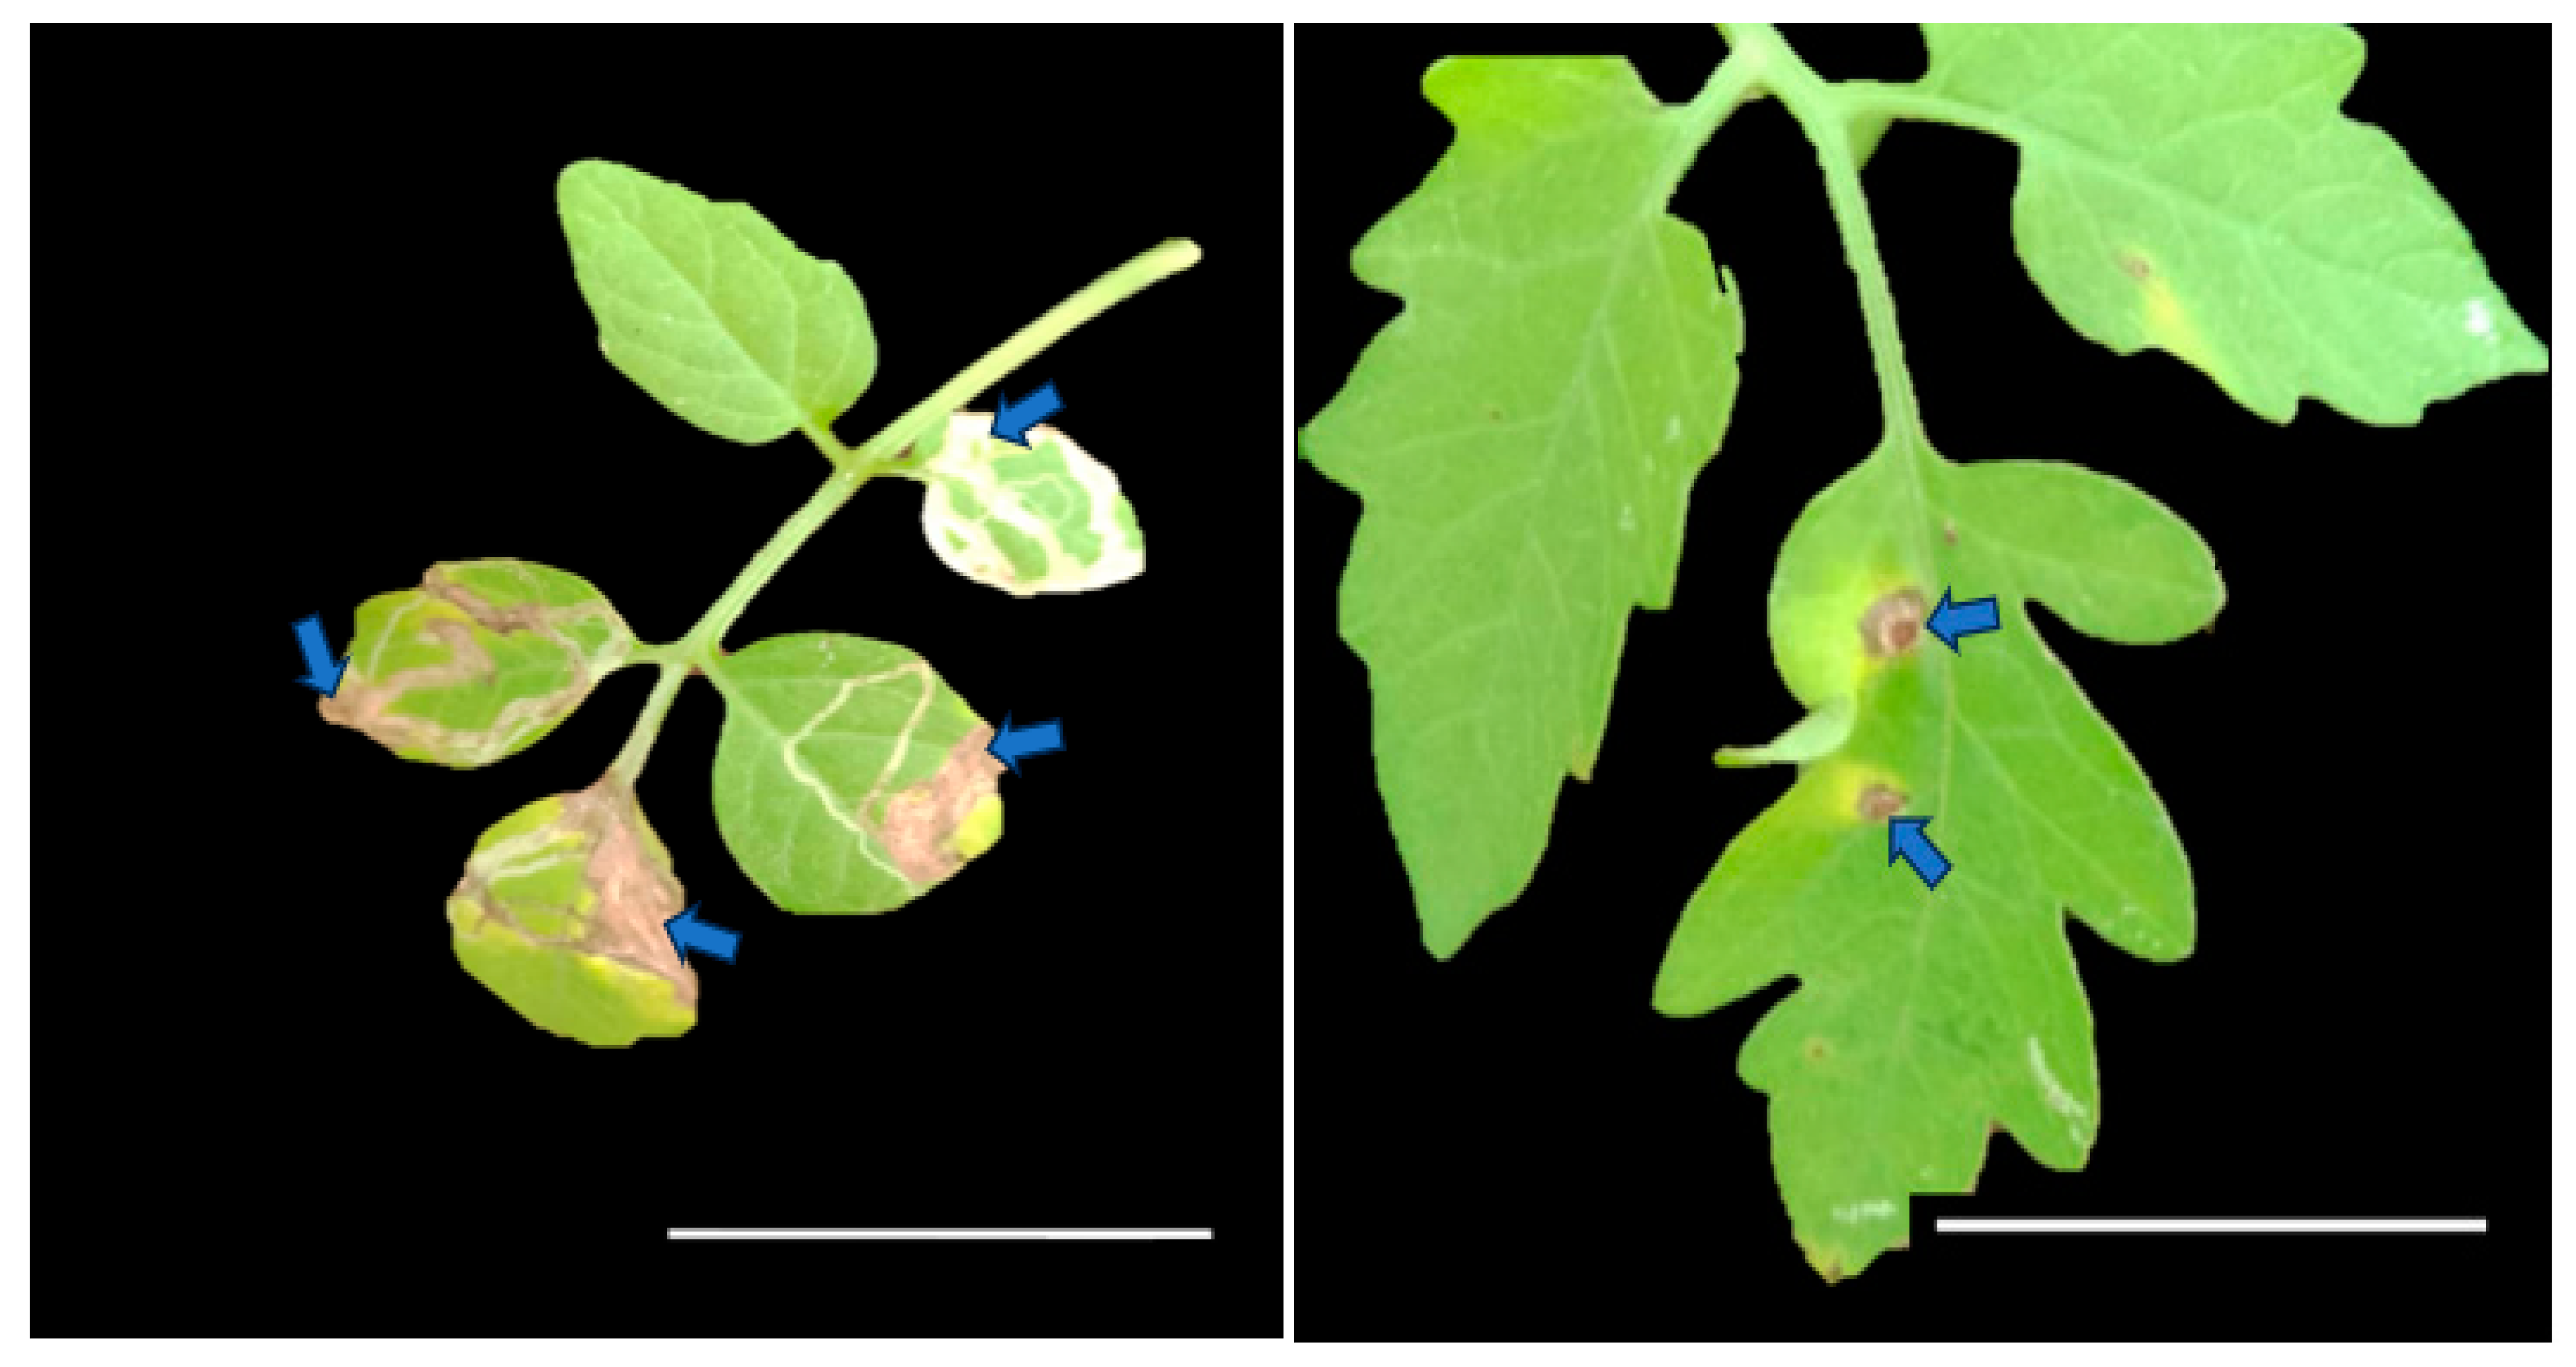
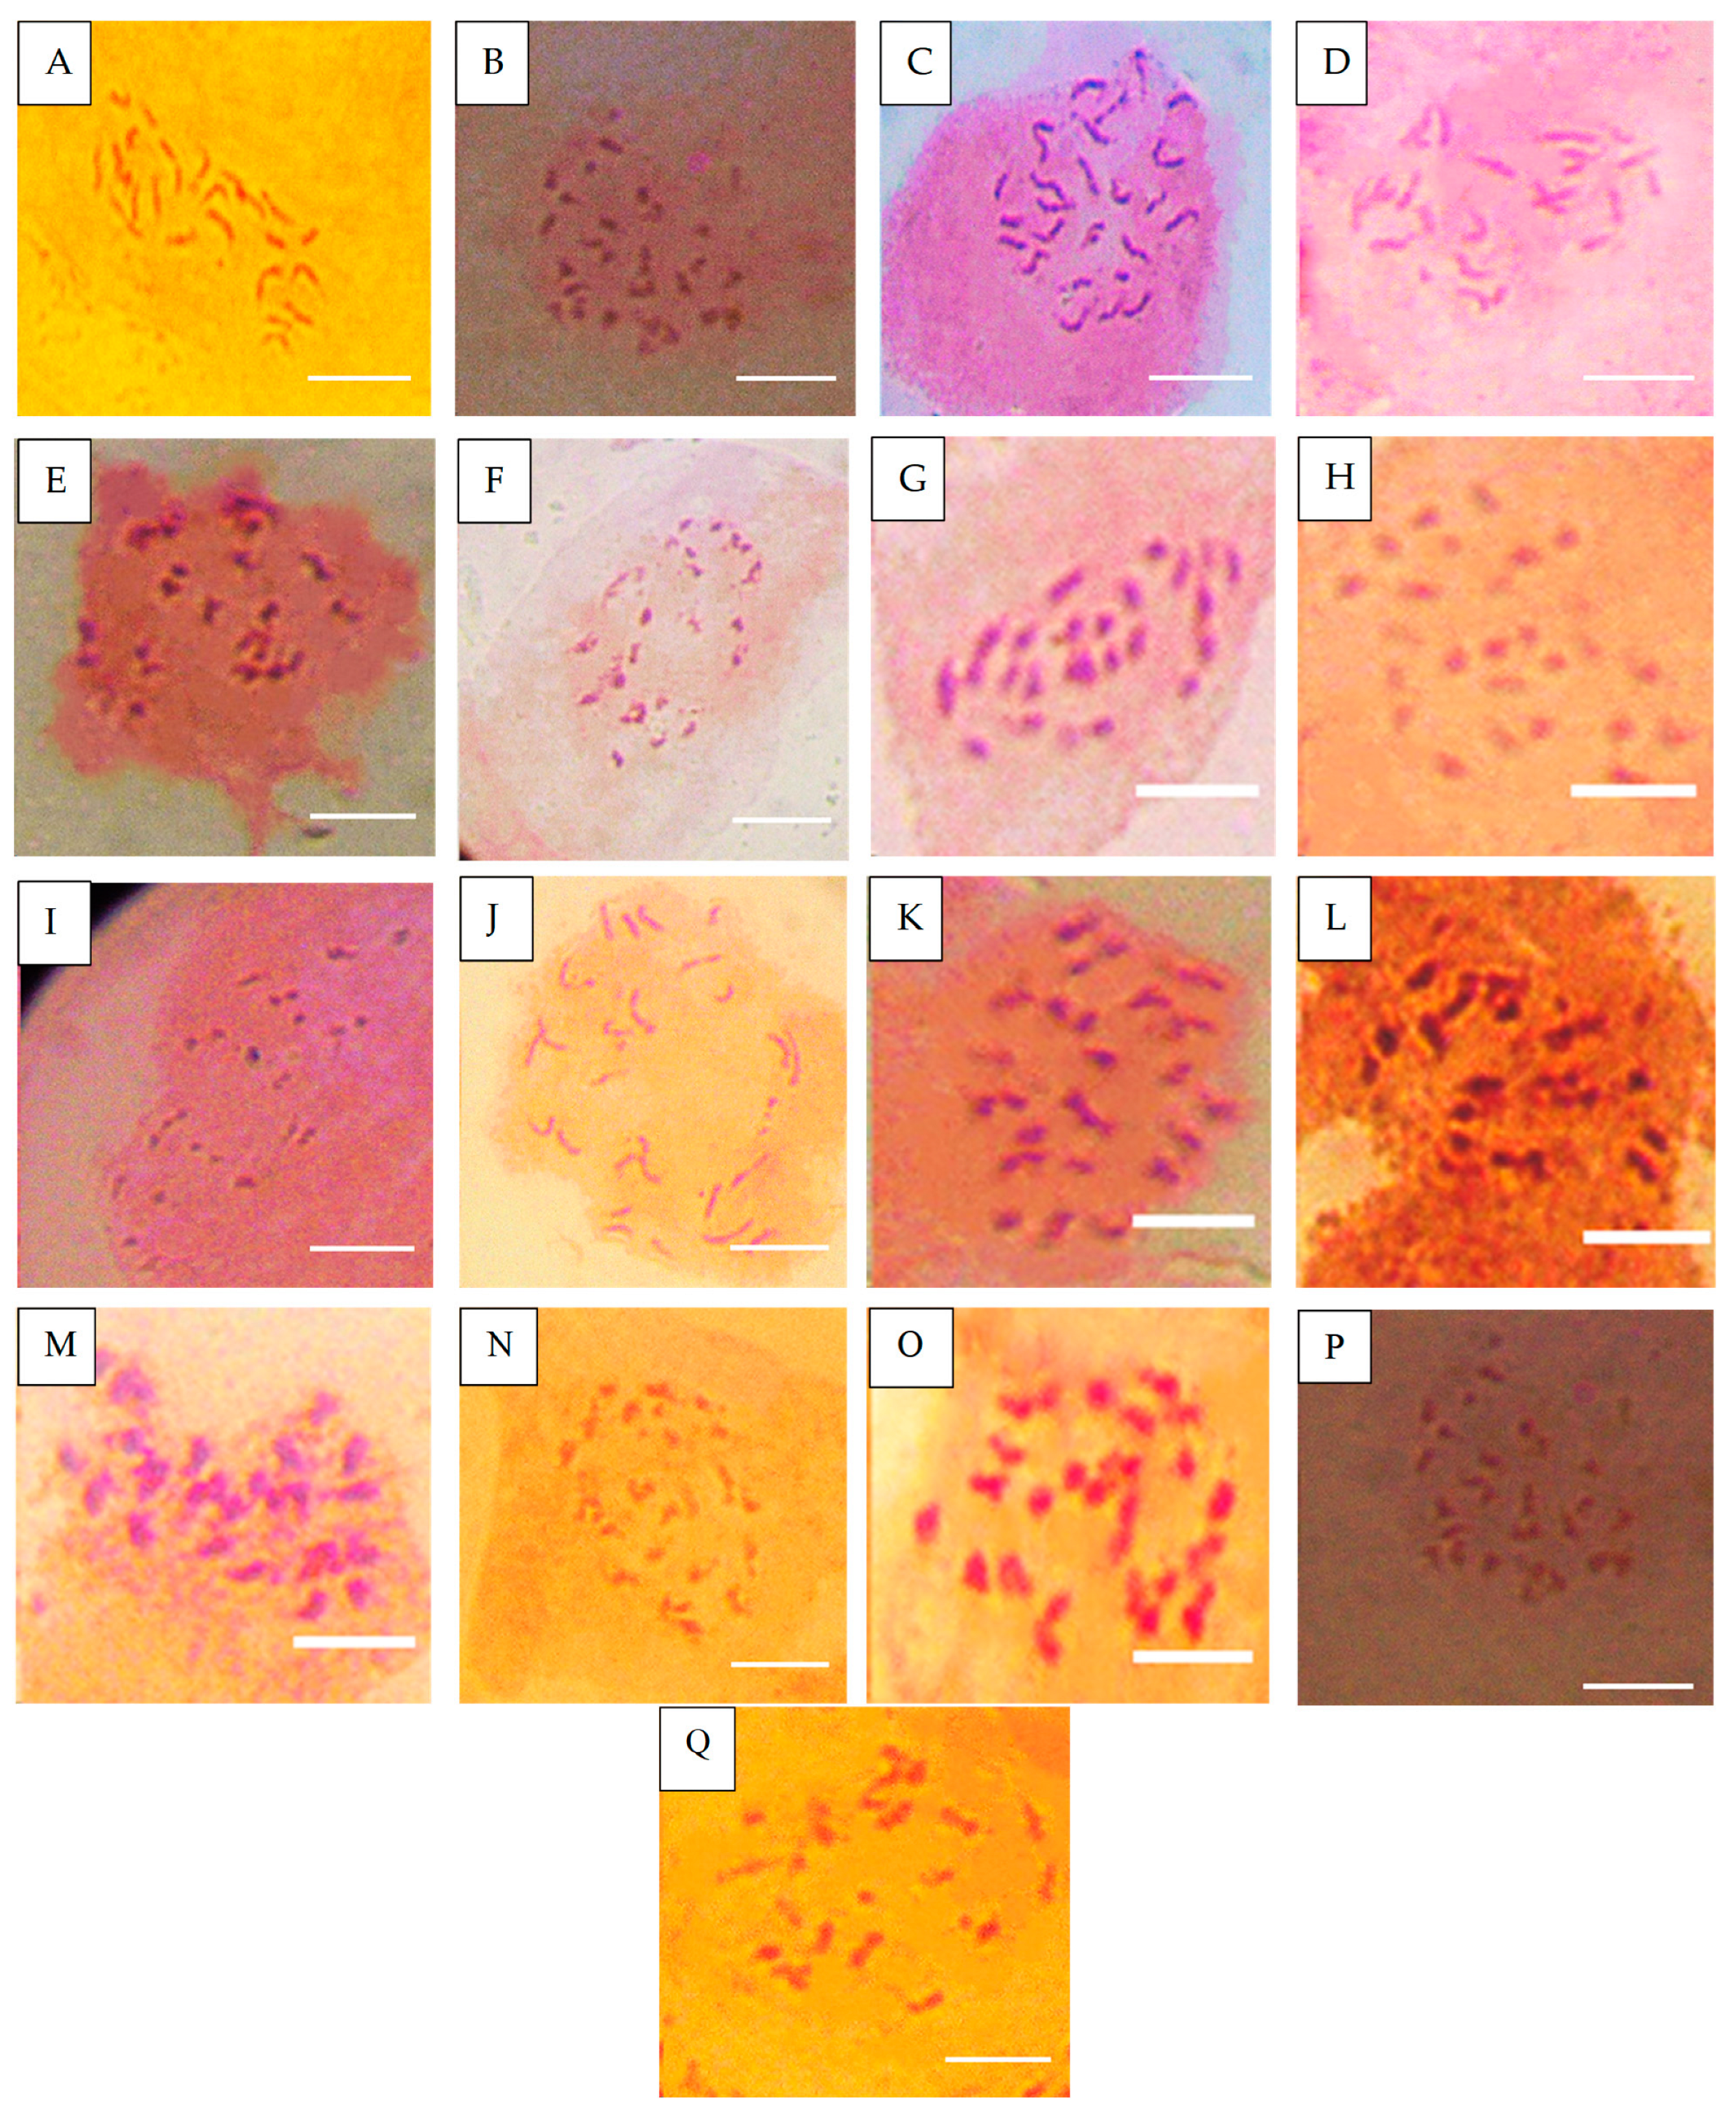

Disclaimer/Publisher’s Note: The statements, opinions and data contained in all publications are solely those of the individual author(s) and contributor(s) and not of MDPI and/or the editor(s). MDPI and/or the editor(s) disclaim responsibility for any injury to people or property resulting from any ideas, methods, instructions or products referred to in the content. |
© 2025 by the authors. Licensee MDPI, Basel, Switzerland. This article is an open access article distributed under the terms and conditions of the Creative Commons Attribution (CC BY) license (https://creativecommons.org/licenses/by/4.0/).