
13C Isotope Discrimination Variation in Guar [Cyamopsis tetragronoloba (L.) Taub.] Under Water-Deficit Conditions

 ,
,
Abstract
1. Introduction
2. Materials and Methods
2.1. Plant Materials
2.2. Experimental Design and Treatments
2.3. Data Collection
2.4. Statistical Analysis
- FB_Index = 100 * (FB_stress/FB_non_stress);
- DB_Index = 100 * (DB_stress/DB_non_stress);
- CI_Index = 100 * (CI_stress/CI_non_stress).
3. Results
3.1. Biomass
3.2. Carbon Isotope Discrimination
3.3. Relationship Between 13C and Aboveground Plant Traits
4. Discussion
5. Conclusions
Supplementary Materials
Author Contributions
Funding
Data Availability Statement
Conflicts of Interest
References
- Chenu, K.; Cooper, M.; Hammer, G.L.; Mathews, K.L.; Dreccer, M.F.; Chapman, S.C. Environment Characterization as an Aid to Wheat Improvement: Interpreting Genotype–Environment Interactions by Modelling Water-Deficit Patterns in North-Eastern Australia. J. Exp. Bot. 2011, 62, 1743–1755. [Google Scholar] [CrossRef] [PubMed]
- Dai, A. Increasing Drought under Global Warming in Observations and Models. Nat. Clim. Change 2012, 3, 52–58. [Google Scholar] [CrossRef]
- Grayson, M. Agriculture and Drought. Nature 2013, 501, S1. [Google Scholar] [CrossRef] [PubMed]
- Bota, J.; Flexas, J.; Medrano, H. Genetic Variability of Photosynthesis and Water Use in Balearic Grapevine Cultivars. Ann. Appl. Biol. 2001, 138, 353–361. [Google Scholar] [CrossRef]
- De Herralde, F.; Savé, R.; Biel, C. Differences in Drought Tolerance in Two Almond Cultivars: ‘Lauranne’ and ‘Masbovera’. Cah. Options Mediter. 2001, 56, 149–154. [Google Scholar]
- Klamkowski, K.; Treder, W. Response to Drought Stress of Three Strawberry Cultivars Grown under Greenhouse Conditions. J. Fruit Ornam. Res. 2008, 16, 179–188. [Google Scholar]
- Tari, I.; Laskay, G.; Takács, Z.; Poór, P. Response of Sorghum to Abiotic Stresses: A Review. J. Agron. Crop Sci. 2013, 199, 264–274. [Google Scholar] [CrossRef]
- Kramer, P. Drought, Stress, and the Origin of Adaptations. Plant Sci. 1981, 17, 7–20. [Google Scholar]
- Górny, A.G. Variation in Utilization Efficiency and Tolerance to Reduced Water and Nitrogen Supply among Wild and Cultivated Barleys. Euphytica 2001, 117, 59–66. [Google Scholar] [CrossRef]
- Boyer, J. Advances in Drought Tolerance in Plants. Adv. Agron. 1996, 56, 187–218. [Google Scholar]
- Gresta, F.; De Luca, A.I.; Strano, A.; Falcone, G.; Santonoceto, C.; Anastasi, U.; Gulisano, G. Economic and Environmental Sustainability Analysis of Guar (Cyamopsis tetragonoloba L.) Farming Process in a Mediterranean Area: Two Case Studies. Ital. J. Agron. 2014, 9, 20–24. [Google Scholar]
- Alexander, W.L.; Bucks, D.A.; Backhaus, R.A. Irrigation Water Management for Guar Seed Production. Agron. J. 1988, 80, 447–453. [Google Scholar] [CrossRef]
- Alshameri, A.; Al-Qurainy, F.; Gaafar, A.R.; Khan, S.; Nadeem, M.; Alansi, S.; Shaikhaldein, H.O.; Salih, A.M. Identification of Differentially Expressed Drought-Responsive Genes in Guar [Cyamopsis tetragonoloba (L.) Taub]. Int. J. Genom. 2020, 2020, 4147615. [Google Scholar] [CrossRef] [PubMed]
- Stafford, R.E.; McMichael, B.L. Effect of Water Stress on Yield Components in Guar. J. Agron. Crop Sci. 1991, 166, 63–68. [Google Scholar] [CrossRef]
- Lotter, D.; Valentine, A.J.; Archer Van Garderen, E.; Tadross, M. Physiological Responses of a Fynbos Legume, Aspalathus Linearis to Drought Stress. S. Afr. J. Bot. 2014, 94, 218–223. [Google Scholar] [CrossRef]
- Meftahizadeh, H.; Ghorbanpour, M.; Asareh, M.H. Comparison of Morphological and Phytochemical Characteristics in Guar (Cyamopsis tetragonoloba L.) Landraces and Cultivars under Different Sowing Dates in an Arid Environment. Ind. Crops Prod. 2019, 140, 111606. [Google Scholar] [CrossRef]
- Malhotra, M.; Sharma, D. Efficiency of Guar Seed Futures Market in India: An Empirical Study. J. Appl. Financ. 2013, 19, 45. [Google Scholar]
- Saeed, M.; Ul Hassan, F.; Shah, Q.A.; Arain, M.A.; Abd El-Hack, M.E.; Alagawany, M.; Dhama, K. Practical Application of Guar (Cyamopsis tetragonoloba L. Taub) Meal in Poultry Nutrition. Adv. Anim. Vet. Sci. 2017, 5, 491–499. [Google Scholar] [CrossRef]
- Singla, S.; Grover, K.; Angadi, S.V.; Schutte, B.; VanLeeuwen, D. Guar Stand Establishment, Physiology, and Yield Responses to Planting Date in Southern New Mexico. Agron. J. 2016, 108, 2289–2300. [Google Scholar] [CrossRef]
- Baath, G.S.; Northup, B.K.; Rocateli, A.C.; Gowda, P.H.; Neel, J.P.S. Forage Potential of Summer Annual Grain Legumes in the Southern Great Plains. Agron. J. 2018, 110, 2198–2210. [Google Scholar] [CrossRef]
- Abidi, N.; Liyanage, S.; Auld, D.; Imel, R.; Norman, L.; Grover, K.; Angadi, S.; Singla, S.; Trostle, C. Challenges and Opportunities for Increasing Guar Production in the United States to Support Unconventional Oil and Gas Production. Hydraul. Fract. Impacts Technol. 2015, 207–226. [Google Scholar]
- Evans, J.; Sharkey, T.; Berry, J.; Farquhar, G. Carbon Isotope Discrimination Measured Concurrently with Gas Exchange to Investigate CO2 Diffusion in Leaves of Higher Plants. Funct. Plant Biol. 1986, 13, 281–292. [Google Scholar] [CrossRef]
- Tabassum, T.; Farooq, M.; Ahmad, R.; Zohaib, A.; Wahid, A.; Shahid, M. Terminal Drought and Seed Priming Improves Drought Tolerance in Wheat. Physiol. Mol. Biol. Plants 2018, 24, 845–856. [Google Scholar] [CrossRef] [PubMed]
- Simard, S.W.; Durall, D.M.; Jones, M.D. Carbon Allocation and Carbon Transfer between Betula Papyrifera and Pseudotsuga Menziesii Seedlings Using a 13C Pulse-Labeling Method. Plant Soil 1997, 191, 41–55. [Google Scholar] [CrossRef]
- Farquhar, G. Carbon Isotope Fractionation and Plant Water-Use Efficiency. Stable Isot. Ecol. Res. 1988, 12, 102–134. [Google Scholar]
- Farquhar, G.; O’Leary, M.; Berry, J. On the Relationship between Carbon Isotope Discrimination and the Intercellular Carbon Dioxide Concentration in Leaves. Aust. J. Plan 1982, 9, 121–137. [Google Scholar] [CrossRef]
- Rebetzke, G.J.; Condon, A.G.; Richards, R.A.; Farquhar, G.D. Selection for Reduced Carbon Isotope Discrimination Increases Aerial Biomass and Grain Yield of Rainfed Bread Wheat. Crop Sci. 2002, 42, 739–745. [Google Scholar] [CrossRef]
- Craig, H. Isotopic Standards for Carbon and Oxygen and Correction Factors for Mass-Spectrometric Analysis of Carbon Dioxide. Geochim. Cosmochim Acta 1957, 12, 133–149. [Google Scholar] [CrossRef]
- Hubick, K. Effects of Nitrogen Source and Water Limitation on Growth, Transpiration Efficiency and Carbon-Isotope Discrimination in Peanut Cultivars. Funct. Plant Biol. 1990, 17, 413–430. [Google Scholar] [CrossRef]
- Knight, J.D.; Livingston, N.J.; Van Kessel, C. Carbon Isotope Discrimination and Water-Use Efficiency of Six Crops Grown under Wet and Dryland Conditions. Plant Cell Env. 1994, 17, 173–179. [Google Scholar] [CrossRef]
- Rytter, R.M. Water Use Efficiency, Carbon Isotope Discrimination and Biomass Production of Two Sugar Beet Varieties Under Well-Watered and Dry Conditions. J. Agron. Crop Sci. 2005, 191, 426–438. [Google Scholar] [CrossRef]
- Pate, J.S.; Dawson, T.E. Assessing the Performance of Woody Plants in Uptake and Utilisation of Carbon, Water and Nutrients: Implications for Designing Agricultural Mimic Systems. Agrofor. Syst. 1999, 45, 245–275. [Google Scholar] [CrossRef]
- Bloch, D.; Hoffmann, C.M.; Märländer, B. Impact of Water Supply on Photosynthesis, Water Use and Carbon Isotope Discrimination of Sugar Beet Genotypes. Eur. J. Agron. 2006, 24, 218–225. [Google Scholar] [CrossRef]
- Canavar, O.; Gotz, K.; Ellmer, F.; Chmielewski, F.; Kaynak, M. Determination of the Relationship between Water Use Efficiency, Carbon Isotope Discrimination and Proline in Sunflower Genotypes under Drought Stress. Aust. J. Crop Sci. 2014, 8, 232–242. [Google Scholar]
- Moghaddam, A.; Raza, A.; Vollmann, J.; Ardakani, M.R.; Wanek, W.; Gollner, G.; Friedel, J.K. Carbon Isotope Discrimination and Water Use Efficiency Relationships of Alfalfa Genotypes under Irrigated and Rain-Fed Organic Farming. Eur. J. Agron. 2013, 50, 82–89. [Google Scholar] [CrossRef]
- Gitz, D.C.; Liu-Gitz, L.; Britz, S.J.; Sullivan, J.H. Ultraviolet-B Effects on Stomatal Density, Water-Use Efficiency, and Stable Carbon Isotope Discrimination in Four Glasshouse-Grown Soybean (Glyicine max) Cultivars. Env. Exp. Bot. 2005, 53, 343–355. [Google Scholar] [CrossRef]
- Adiredjo, A.L.; Navaud, O.; Muños, S.; Langlade, N.B.; Lamaze, T.; Grieu, P. Genetic Control of Water Use Efficiency and Leaf Carbon Isotope Discrimination in Sunflower (Helianthus annuus L.) Subjected to Two Drought Scenarios. PLoS ONE 2014, 9, e101218. [Google Scholar] [CrossRef]
- Stafford, R.E.; Kirby, J.S.; Kinman, M.L.; Lewis, C.R. Registration of Kinman and Esser Guar 1 (Reg. No. 4 to 5). Crop Sci. 1976, 16, 310. [Google Scholar]
- Ray, D.T.; Stafford, R.E. Registration of ‘Santa Cruz’ Guar. Crop Sci. 1985, 25, 1124–1125. [Google Scholar] [CrossRef]
- Stafford, R.E.; Ray, D.T. Registration of Lewis Guar. Crop Sci. 1985, 25, 365. [Google Scholar] [CrossRef]
- Saad, F.F.; El-Mohsen, A.A.A.; Abd, M.A.; Al-Soudan, I.H. Effective Selection Criteria for Evaluating Some Barley Crosses for Water Stress Tolerance. Adv. Agric. Biol. 2014, 2, 112–123. [Google Scholar] [CrossRef]
- Jaleel, C.; Manivannan, P.; Wahid, A. Drought Stress in Plants: A Review on Morphological Characteristics and Pigments Composition. Int. J. Agric. Biol. 2009, 11, 100–105. [Google Scholar]
- Bohnert, H.J.; Jensen, R.G. Strategies for Engineering Water-Stress Tolerance in Plants. Trends Biotechnol. 1996, 14, 89–97. [Google Scholar] [CrossRef]
- Jaleel, C.A.; Manivannan, P.; Sankar, B.; Kishorekumar, A.; Gopi, R.; Somasundaram, R.; Panneerselvam, R. Water Deficit Stress Mitigation by Calcium Chloride in Catharanthus Roseus: Effects on Oxidative Stress, Proline Metabolism and Indole Alkaloid Accumulation. Colloids Surf B Biointerfaces 2007, 60, 110–116. [Google Scholar] [CrossRef]
- Avramova, V.; Abdelgawad, H.; Zhang, Z.; Fotschki, B.; Casadevall, R.; Vergauwen, L.; Knapen, D.; Taleisnik, E.; Guisez, Y.; Asard, H.; et al. Drought Induces Distinct Growth Response, Protection, and Recovery Mechanisms in the Maize Leaf Growth Zone. Plant Physiol. 2015, 169, 1382–1396. [Google Scholar] [CrossRef] [PubMed]
- Zheng-lin, W.; You-zhi, Z. Effects of Exogenous Auxin on Physiological and Biochemical Characteristics of Soybean under PEG Simulated Drought Stress. Hubei Agric. Sci. 2019, 58, 16. [Google Scholar]
- Yordanov, I.; Velikova, V.; Tsonev, T. Plant Responses to Drought and Stress Tolerance. J. Plant Physiol. 2003, 2, 187–206. [Google Scholar]
- Specht, J.E.; Chase, K.; Macrander, M.; Graef, G.L.; Chung, J.; Markwell, J.P.; Germann, M.; Orf, J.H.; Lark, K.G. Soybean Response to Water: A QTL Analysis of Drought Tolerance. Crop Sci. 2001, 41, 493–509. [Google Scholar] [CrossRef]
- Arnau, G.; Monneveux, P.; This, D.; Alegre, L. Photosynthesis of Six Barley Genotypes as Affected by Water Stress. Photosynthetica 1998, 34, 67–76. [Google Scholar] [CrossRef]
- Blum, A.; Mayer, J.; Golan, G. Agronomic and Physiological Assessments of Genotypic Variation for Drought Resistance in Sorghum. Aust. J. Agric. Res. 1989, 40, 49–61. [Google Scholar] [CrossRef]
- Ehleringer, J.R. Carbon Isotope Ratios and Physiological Processes in Aridland Plants. Ecol. Stud. 1989, 68, 41–54. [Google Scholar]
- Kissel, E.; van Asten, P.; Swennen, R.; Lorenzen, J.; Carpentier, S.C. Transpiration Efficiency versus Growth: Exploring the Banana Biodiversity for Drought Tolerance. Sci. Hortic. 2015, 185, 175–182. [Google Scholar] [CrossRef]
- Khan, H.U.R.; Link, W.; Hocking, T.J.; Stoddard, F.L. Evaluation of Physiological Traits for Improving Drought Tolerance in Faba Bean (Vicia faba L.). Plant Soil 2007, 292, 205–217. [Google Scholar] [CrossRef]

| Plant_ID | Origin | Taxonomy |
|---|---|---|
| TX1 | USA | Cyamospsis tetragonoloba (L.) Taub. |
| TX2 | USA | Cyamospsis tetragonoloba (L.) Taub. |
| TX3 | USA | Cyamospsis tetragonoloba (L.) Taub. |
| TX4 | USA | Cyamospsis tetragonoloba (L.) Taub. |
| TX5 | USA | Cyamospsis tetragonoloba (L.) Taub. |
| TX6 | USA | Cyamospsis tetragonoloba (L.) Taub. |
| TX7 | USA | Cyamospsis tetragonoloba (L.) Taub. |
| “Kinman” | USA | Cyamospsis tetragonoloba (L.) Taub. |
| “Lewis” | USA | Cyamospsis tetragonoloba (L.) Taub. |
| “Santa Cruz” | USA | Cyamospsis tetragonoloba (L.) Taub. |
| PI 183400 | India | Cyamospsis tetragonoloba (L.) Taub. |
| PI 275322 | India | Cyamospsis tetragonoloba (L.) Taub. |
| PI 275323 | India | Cyamospsis tetragonoloba (L.) Taub. |
| PI 288389 | India | Cyamospsis tetragonoloba (L.) Taub. |
| PI 288408 | India | Cyamospsis tetragonoloba (L.) Taub. |
| PI 288409 | India | Cyamospsis tetragonoloba (L.) Taub. |
| PI 288425 | India | Cyamospsis tetragonoloba (L.) Taub. |
| PI 288743 | India | Cyamospsis tetragonoloba (L.) Taub. |
| PI 288750 | India | Cyamospsis tetragonoloba (L.) Taub. |
| PI 288754 | India | Cyamospsis tetragonoloba (L.) Taub. |
| PI 288758 | India | Cyamospsis tetragonoloba (L.) Taub. |
| PI 288759 | India | Cyamospsis tetragonoloba (L.) Taub. |
| PI 322775 | India | Cyamospsis tetragonoloba (L.) Taub. |
| PI 323002 | India | Cyamospsis tetragonoloba (L.) Taub. |
| PI 338796 | India | Cyamospsis tetragonoloba (L.) Taub. |
| PI 338811 | India | Cyamospsis tetragonoloba (L.) Taub. |
| PI 338863 | India | Cyamospsis tetragonoloba (L.) Taub. |
| PI 338865 | India | Cyamospsis tetragonoloba (L.) Taub. |
| PI 338870 | India | Cyamospsis tetragonoloba (L.) Taub. |
| PI 340513 | India | Cyamospsis tetragonoloba (L.) Taub. |
| Traits * | Source | DF | Mean Square | F Ratio | Prob > F |
|---|---|---|---|---|---|
| C13_S (‰) ** | Genotype | 26 | 3.16 | 3.02 | 0.001 |
| Error | 38 | 1.05 | |||
| C. Total | 64 | ||||
| DB_S (g) ** | Genotype | 26 | 0.05 | 3.66 | 0.0001 |
| Error | 38 | 0.01 | |||
| C. Total | 64 | ||||
| FB_S (g) ** | Genotype | 26 | 0.8 | 2.74 | 0.0024 |
| Error | 38 | 0.29 | |||
| C. Total | 64 | ||||
| C13_W (‰) | Genotype | 26 | 3.21 | 0.88 | 0.63 |
| Error | 38 | 3.66 | |||
| C. Total | 64 | ||||
| DB_W (g) | Genotype | 26 | 0.1 | 1.51 | 0.1208 |
| Error | 38 | 0.06 | |||
| C. Total | 64 | ||||
| FB_W (g) | Genotype | 26 | 6.06 | 2.03 | 0.0226 |
| Error | 38 | 2.98 | |||
| C. Total | 64 | ||||
| C13_I | Genotype | 26 | 62.92 | 1.21 | 0.2897 |
| Error | 38 | 51.93 | |||
| C. Total | 64 | ||||
| DB_I | Genotype | 26 | 315.25 | 1.13 | 0.3609 |
| Error | 38 | 279.46 | |||
| C. Total | 64 | ||||
| FB_I ** | Genotype | 26 | 703.34 | 2.64 | 0.0032 |
| Error | 38 | 266.9 | |||
| C. Total | 64 |
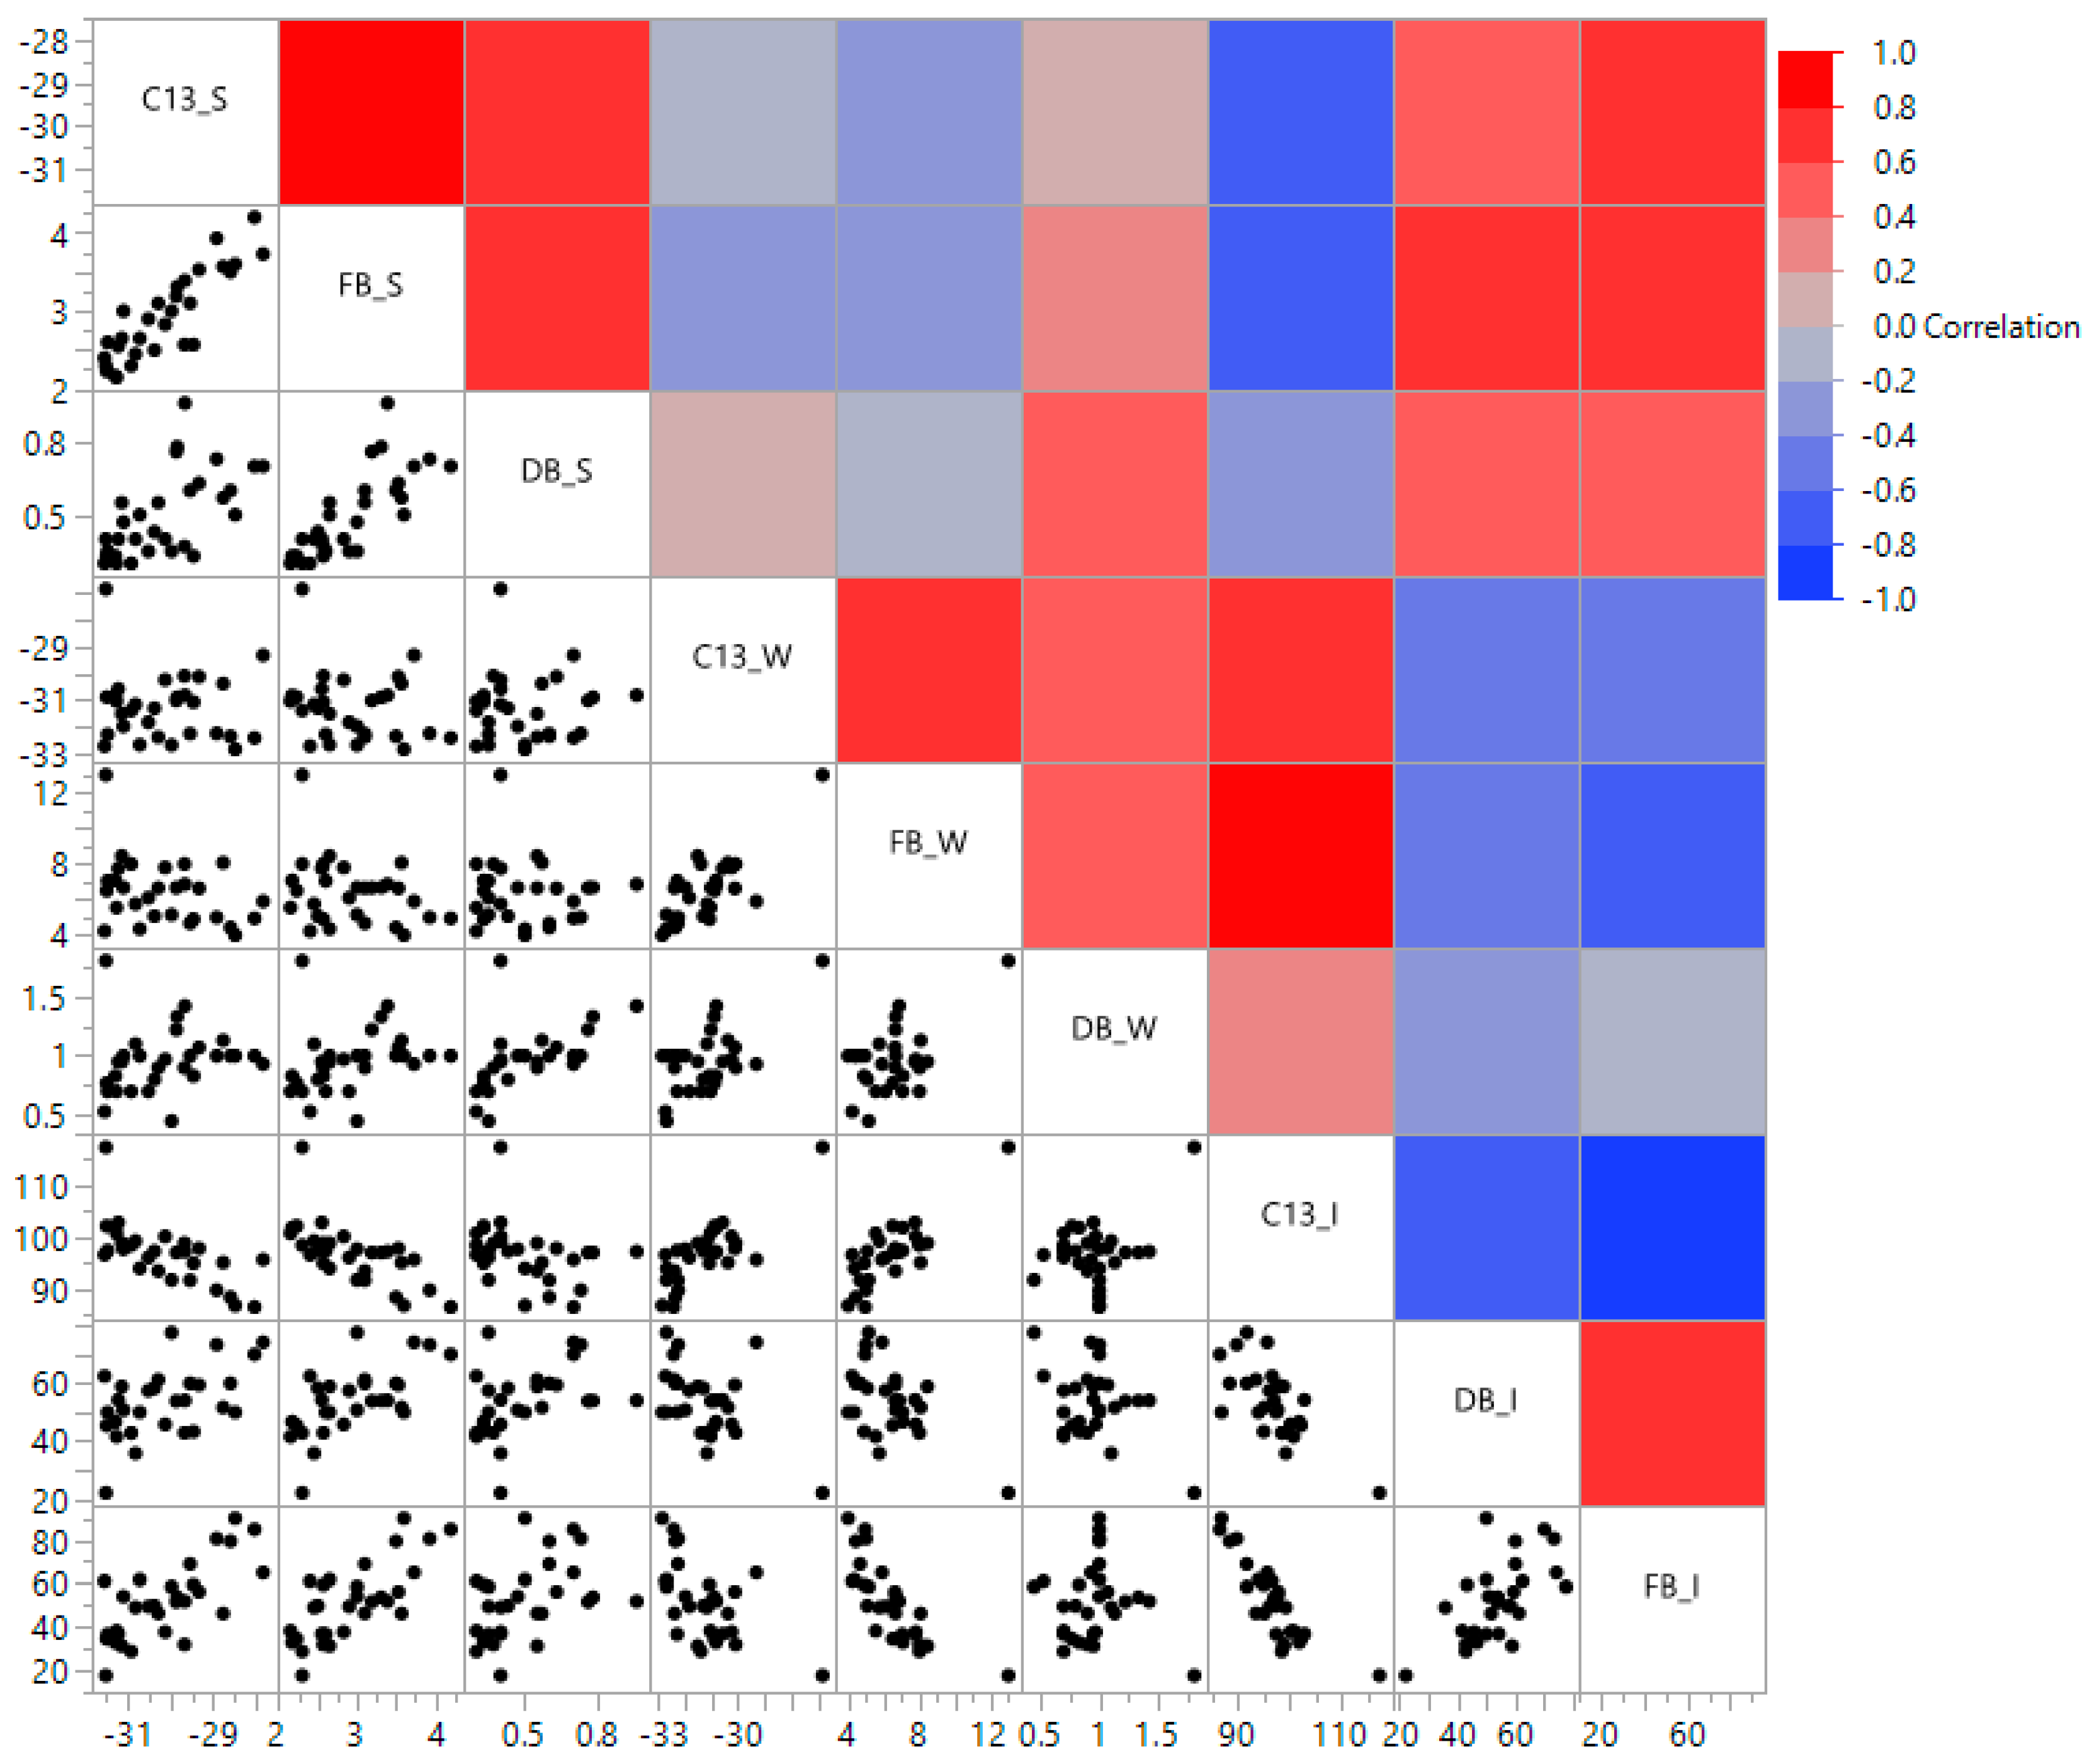
| Traits ** | C13_S | DB_S | FB_S | C13_W | DB_W | FB_W | C13_I | DB_I | FB_I |
|---|---|---|---|---|---|---|---|---|---|
| C13_S | − | − | − | − | − | − | − | − | − |
| DB_S | 0.68 * | − | − | − | − | − | − | − | − |
| FB_S | 0.7 | 0.82 | − | − | − | − | − | − | − |
| C13_W | 0 | −0.03 | −0.13 | − | − | − | − | − | − |
| DB_W | 0.15 | 0.38 | 0.27 | 0.61 | − | − | − | − | − |
| FB_W | −0.24 | −0.06 | −0.12 | 0.74 | 0.58 | − | − | − | − |
| C13_I | −0.59 | −0.41 | −0.51 | 0.81 | 0.42 | 0.74 | − | − | − |
| DB_I | 0.47 | 0.54 | 0.47 | −0.51 | −0.52 | −0.49 | −0.69 | − | − |
| FB_I | 0.56 | 0.49 | 0.65 | −0.57 | −0.12 | −0.77 | −0.78 | 0.52 | − |
Disclaimer/Publisher’s Note: The statements, opinions and data contained in all publications are solely those of the individual author(s) and contributor(s) and not of MDPI and/or the editor(s). MDPI and/or the editor(s) disclaim responsibility for any injury to people or property resulting from any ideas, methods, instructions or products referred to in the content. |
© 2025 by the authors. Licensee MDPI, Basel, Switzerland. This article is an open access article distributed under the terms and conditions of the Creative Commons Attribution (CC BY) license (https://creativecommons.org/licenses/by/4.0/).
Share and Cite
Manley, A.; Ravelombola, W.; Adams, C.; Shrestha, R.; Hinson, P.; Trostle, C. 13C Isotope Discrimination Variation in Guar [Cyamopsis tetragronoloba (L.) Taub.] Under Water-Deficit Conditions. Int. J. Plant Biol. 2025, 16, 31. https://doi.org/10.3390/ijpb16010031
Manley A, Ravelombola W, Adams C, Shrestha R, Hinson P, Trostle C. 13C Isotope Discrimination Variation in Guar [Cyamopsis tetragronoloba (L.) Taub.] Under Water-Deficit Conditions. International Journal of Plant Biology. 2025; 16(1):31. https://doi.org/10.3390/ijpb16010031
Chicago/Turabian StyleManley, Aurora, Waltram Ravelombola, Curtis Adams, Rajan Shrestha, Philip Hinson, and Calvin Trostle. 2025. "13C Isotope Discrimination Variation in Guar [Cyamopsis tetragronoloba (L.) Taub.] Under Water-Deficit Conditions" International Journal of Plant Biology 16, no. 1: 31. https://doi.org/10.3390/ijpb16010031
APA StyleManley, A., Ravelombola, W., Adams, C., Shrestha, R., Hinson, P., & Trostle, C. (2025). 13C Isotope Discrimination Variation in Guar [Cyamopsis tetragronoloba (L.) Taub.] Under Water-Deficit Conditions. International Journal of Plant Biology, 16(1), 31. https://doi.org/10.3390/ijpb16010031