Article

Hierarchical Risk Profiles in Tuberculosis Treatment Outcomes: The Role of Drug Resistance, Age, and Socio-Economic Factors


1
TB Research Group, School of Pathology, Faculty of Medicine and Health Sciences, Walter Sisulu University, Mthatha 5099, South Africa
2
Walter Sisulu Institute for Clinical Governance, Healthcare Administration, School of Public Health, Faculty of Medicine and Health Sciences, Walter Sisulu University, Mthatha 5099, South Africa
*
Author to whom correspondence should be addressed.
Microbiol. Res. 2026, 17(2), 42; https://doi.org/10.3390/microbiolres17020042

Submission received: 21 December 2025 / Revised: 5 February 2026 / Accepted: 10 February 2026 / Published: 14 February 2026

Abstract

Background: Tuberculosis (TB) outcomes remain suboptimal in high-burden, resource-constrained settings. Clinical and socio-economic factors contribute to loss to follow-up, failure, and mortality, yet their relative importance remains underexplored. Methods: We analyzed a retrospective cohort of patients treated for pulmonary TB in the Eastern Cape, South Africa. Treatment outcomes were dichotomized as success (cured or treatment completed) versus unsuccessful (loss to follow-up, failure, or death), excluding transfers and patients still on treatment. Predictors included age, gender, income, occupation, comorbidities, HIV status, previous treatment history, patient category, and drug resistance status. Regularized logistic regression was used to estimate odds ratios, while the best decision tree model was applied to identify hierarchical risk profiles. Results: Logistic regression demonstrated high accuracy (86%) and identified drug susceptibility, age, income stability, and comorbidity burden as the strongest predictors of treatment success. The decision tree achieved lower accuracy (65%) but improved detection of unsuccessful outcomes, highlighting a clear hierarchy of risk: (1) drug resistance status, (2) age, (3) income source, and (4) comorbidities. Patients with drug-resistant TB, older age, no income or reliance on grants, and coexisting conditions were at the highest risk of poor outcomes. Conclusions: Drug resistance, age, income, and comorbidity burden shape a hierarchical risk profile for TB treatment outcomes in rural South Africa. Logistic regression offered robust overall classification, while the decision tree provided transparent stratification of at-risk groups. These findings underscore the need for integrated clinical and socio-economic support strategies to improve outcomes in high-burden settings.

1. Introduction

Tuberculosis (TB) remains a leading infectious killer worldwide. In 2023, an estimated 10.8 million people fell ill with TB and 1.25 million died (including 161,000 among people living with HIV), with the WHO African Region contributing roughly a quarter of global incident disease [1,2]. Within this framework, the WHO treatment outcome classification—cured, treatment completed (together “treatment success”), treatment failure, died, lost to follow-up (LTFU), and not evaluated—provides a focal point for program performance and patient prognosis across drug-susceptible (DS-TB) and drug-resistant TB (DR-TB) cohorts. TB continues to pose a significant public health challenge, particularly in high-burden countries such as South Africa, where treatment success rates remain below the World Health Organization (WHO) target of 85% [3]. South Africa remains one of the countries with the highest burden of TB globally, with an estimated 468 new TB cases per 100,000 population, reflecting one of the highest national TB incidence rates in the world [4,5]. Concurrently, the HIV epidemic in South Africa persists at a high level; in 2025, an estimated 8.15 million people in South Africa were living with HIV, accounting for approximately 12.9% of the total population and approximately 170,000 incident HIV infections [6,7]. The intersection of these two epidemics, often referred to as a syndemic [8], is particularly pronounced: people living with HIV have a greatly increased risk of progression to active TB, and HIV co-infection remains a major driver of TB incidence and adverse outcomes in the country [9,10,11].
TB control in South Africa is implemented through the National Tuberculosis Program (NTP), which operates within a decentralized public health system and is aligned with the WHO End TB Strategy, with TB services delivered primarily through primary healthcare facilities and district hospitals, with free access to diagnosis, treatment, and follow-up care. The TB strategic plan, 2023–2028, emphasizes person-centered and family-centered care, thus moving the program closer towards community-based care [12]. The plan rolled out strategic objectives to move towards a vision for 2028 that sees TB as a priority across all sectors, with people with TB being given rapid access to high-quality diagnostics, treatment, and support. Despite the well-established control infrastructure, South Africa continues to experience a high TB burden, with particularly poor outcomes observed among patients with DR-TB, TB–HIV co-infection, and other comorbid conditions. Provinces such as the Eastern Cape are disproportionately affected, reflecting persistent socio-economic vulnerabilities, including poverty, unemployment, limited educational attainment, and barriers to sustained healthcare access.
Despite widespread implementation of directly observed therapy (DOT) and community-based support programs, treatment failures, mortality, and LTFU persist [13]. Understanding the determinants of these outcomes is essential for tailoring interventions that are both clinically effective and socially responsive. Previous research has highlighted the adverse impact of DR-TB, HIV co-infection, and advanced age on treatment outcomes [14]. At the same time, socio-economic vulnerabilities such as unemployment, low income, and unstable living conditions undermine adherence and continuity of care [15]. Yet, the interaction between these clinical and social risk factors is complex and often under-analyzed, particularly in rural contexts where resources are limited and health systems face additional barriers [16]. Conventional regression models are widely used to identify independent predictors of treatment outcomes, offering robust estimates of association. However, they often fail to capture the hierarchical or interactive nature of risks [17]. In contrast, machine learning approaches such as decision trees provide interpretable pathways that show how combinations of patient characteristics influence outcomes [18]. Integrating these methods offers a more balanced understanding of both individual and structural determinants of TB success and failure. In this study, we examined a cohort of TB patients in the Eastern Cape Province of South Africa using both regularized logistic regression and decision tree modeling. We aimed to identify the central predictors of treatment outcomes and to delineate hierarchical risk profiles that combine clinical and socio-economic determinants.

2. Materials and Methods

2.1. Study Design and Setting

A retrospective cohort analysis was conducted on patients treated for pulmonary tuberculosis (PTB) in the Eastern Cape Province, South Africa. The province has an estimated population of approximately 7.23 million people according to the 2022 national census [19]. In recent surveillance data, the province reported a high TB notification rate of approximately 703 cases per 100,000 population, indicating a substantial ongoing TB burden relative to other South African provinces [20]. The province is a high-burden rural setting with persistent challenges of poverty, limited access to healthcare, and high prevalence of HIV co-infection.

2.2. Study Population

The dataset included patients registered for TB treatment between 2020 and 2024. Eligible participants were adults with bacteriologically or clinically confirmed pulmonary TB. A person who is clinically confirmed with TB refers to someone who is diagnosed with TB and treated on the basis of clinical and/or radiological evidence without bacteriological confirmation. Those excluded were patients who had transferred out, moved away, or remained on treatment at the time of data extraction, as outcomes were not definitive.

2.3. Variables

Outcome: Treatment outcome was classified according to WHO definitions. Patients were grouped as:
Success: These are patients who have been cured or have completed their treatment.
Unsuccessful: These are patients who experienced treatment failure, died during treatment, or were LTFU.

2.4. Data Analysis

Treatment outcomes were dichotomized as successful versus unsuccessful. Patients who were transferred out, moved, or still on treatment were excluded from the modeling. Predictor variables included demographic (age and gender), socio-economic (income and occupation), clinical (HIV status, comorbidities, and TB drug resistance), and behavioral (social history, previous treatment history, and patient category) factors. Regularized logistic regression (L1 penalty, α = 0.1) was employed to address multicollinearity, and odds ratios were reported. In parallel, a decision tree classifier (maximum depth = 4; minimum 20 observations per leaf; class weight-balanced) was fitted to identify non-linear interactions and thresholds. Models were trained on 70% of the dataset and evaluated on a 30% hold-out set, with accuracy, ROC–AUC, confusion matrices, and classification reports generated.

2.5. Statistical Analysis

Data was cleaned through the process of removal of duplicate records, verification of implausible or inconsistent values, standardization of variable coding, and recoding of categorical variables into binary dummy indicators. Records with missing data on key variables were excluded from relevant analyses. Continuous variables (e.g., age) were retained in numeric form. Missing values were minimal (<1% for gender and drug resistance status) and excluded from modeling.
Two complementary modeling approaches were used:
  • Regularized Logistic Regression: We fitted a logistic regression model with L1 (LASSO) penalization to address collinearity and reduce overfitting. Results were expressed as odds ratios (ORs) with exponentiated coefficients. Model performance was evaluated using a 70/30 train–test split, with accuracy and ROC–AUC metrics.
  • Decision Tree Classifier: A classification tree was trained using a maximum depth of 4 and a minimum leaf size of 20, with class weighting to account for outcome imbalance. Feature importance values were extracted, and the tree was visualized to facilitate the interpretation of hierarchical risk profiles. Performance was assessed with accuracy, ROC–AUC, precision, recall, and F1-scores on the test set. Analyses were performed using Python version 3.x (scikit-learn, stats models, and matplotlib).

2.6. Decision Tree Analysis

The decision tree classifier was constructed using the Gini impurity criterion to determine optimal splits at each node. Gini impurity is a standard metric used in classification trees to quantify the degree of class heterogeneity within a node and is defined as 1 − Σ(pi2), where pi represents the proportion of observations belonging to class i. Lower Gini values indicate greater node purity, meaning that observations within the node predominantly belong to a single outcome class. All Gini values presented in the decision tree were generated internally by the fitted model using the training data and were not calculated externally.

3. Results

3.1. Demographic Characteristics of the Study Population

The study included 382 patients with a mean age of 40.3 years (SD, 16.8; range, 6–95 years). Males accounted for 60.2% (n = 230), yielding a male-to-female ratio of 1.5:2. Most patients were new TB cases (81.4%, n = 311), while 15.7% (n = 50) were previously treated, 0.5% (n = 2) were previously treated with second-line drugs (PT2), and 2.4% (n = 9) had an unknown treatment history. This distribution reflects a predominantly young-to-middle-aged, male-leaning cohort, with a substantial minority representing retreatment cases.

3.2. TB Treatment Outcome Predictors

Table 1 presents the odds ratios (ORs) from the regularized logistic regression model. Predictors with ORs greater than 1.0 indicate increased likelihood of treatment success, while ORs below 1.0 indicate reduced likelihood. Social history categories and patient category variables showed high ORs. However, the wide range of ORs reflects model regularization, which penalizes less informative predictors and highlights the most influential ones. In regularized logistic regression, the overall accuracy was 86% (ROC–AUC = 0.66), with high precision and recall for successful outcomes but limited sensitivity for unsuccessful outcomes due to class imbalance. Strong positive predictors of successful outcomes included favorable social history categories and being classified as new patients, while relapse and adverse social histories were associated with lower odds of success. In contrast, the decision tree classifier (depth = 4; class weight-balanced) achieved an accuracy of 65% and ROC–AUC of 0.69, performing better at identifying unsuccessful outcomes. Key predictors driving splits were drug resistance status (DR vs. DS), patient age, income source, and presence of any comorbidity.

3.3. Logistic Regression—Test Set Classification Report

The logistic regression model demonstrated high accuracy (86%) and strong recall for successful outcomes (95%) (Table 2). However, performance for unsuccessful outcomes was limited (recall 18%), reflecting the class imbalance in the dataset. The model therefore reliably identified patients who completed or were cured, but under-detected those who defaulted, failed, or died.

3.4. Decision Tree—Test Set Classification Report

The decision tree achieved 65% accuracy with a ROC–AUC of 0.69. Compared to logistic regression, the tree performed better at identifying unsuccessful outcomes (recall rate of 45%) (Table 3), although with a reduced overall accuracy. This highlights the trade-off between precision for the majority class (success) and improved detection of the minority class (unsuccessful outcomes).

3.5. Decision Tree—Feature Importance

In Table 4, the most critical predictors identified by the decision tree were drug resistance status (DR vs. DS), which was the dominant predictor of treatment outcome. With age, younger patients were more likely to succeed. Regarding income sources, salaried income was associated with treatment success, while no income/grant support predicted poorer outcomes. The presence of any comorbidity slightly reduced the probability of treatment success. Other features contributed minimally to classification.

3.6. Key Predictors—Logistic Regression

The strongest predictors (based on OR thresholds) reinforced findings from the decision tree (Table 5). Social history variables, patient category (e.g., new vs. relapse), and occupation/income measures were associated with increased odds of treatment success. In contrast, specific categories (e.g., no income or unemployment) were protective against success, aligning with the role of socio-economic vulnerability. These results demonstrate consistency between the regression and tree-based models in highlighting both clinical (DR-TB and patient category) and socio-economic (income and occupation) determinants of outcome.
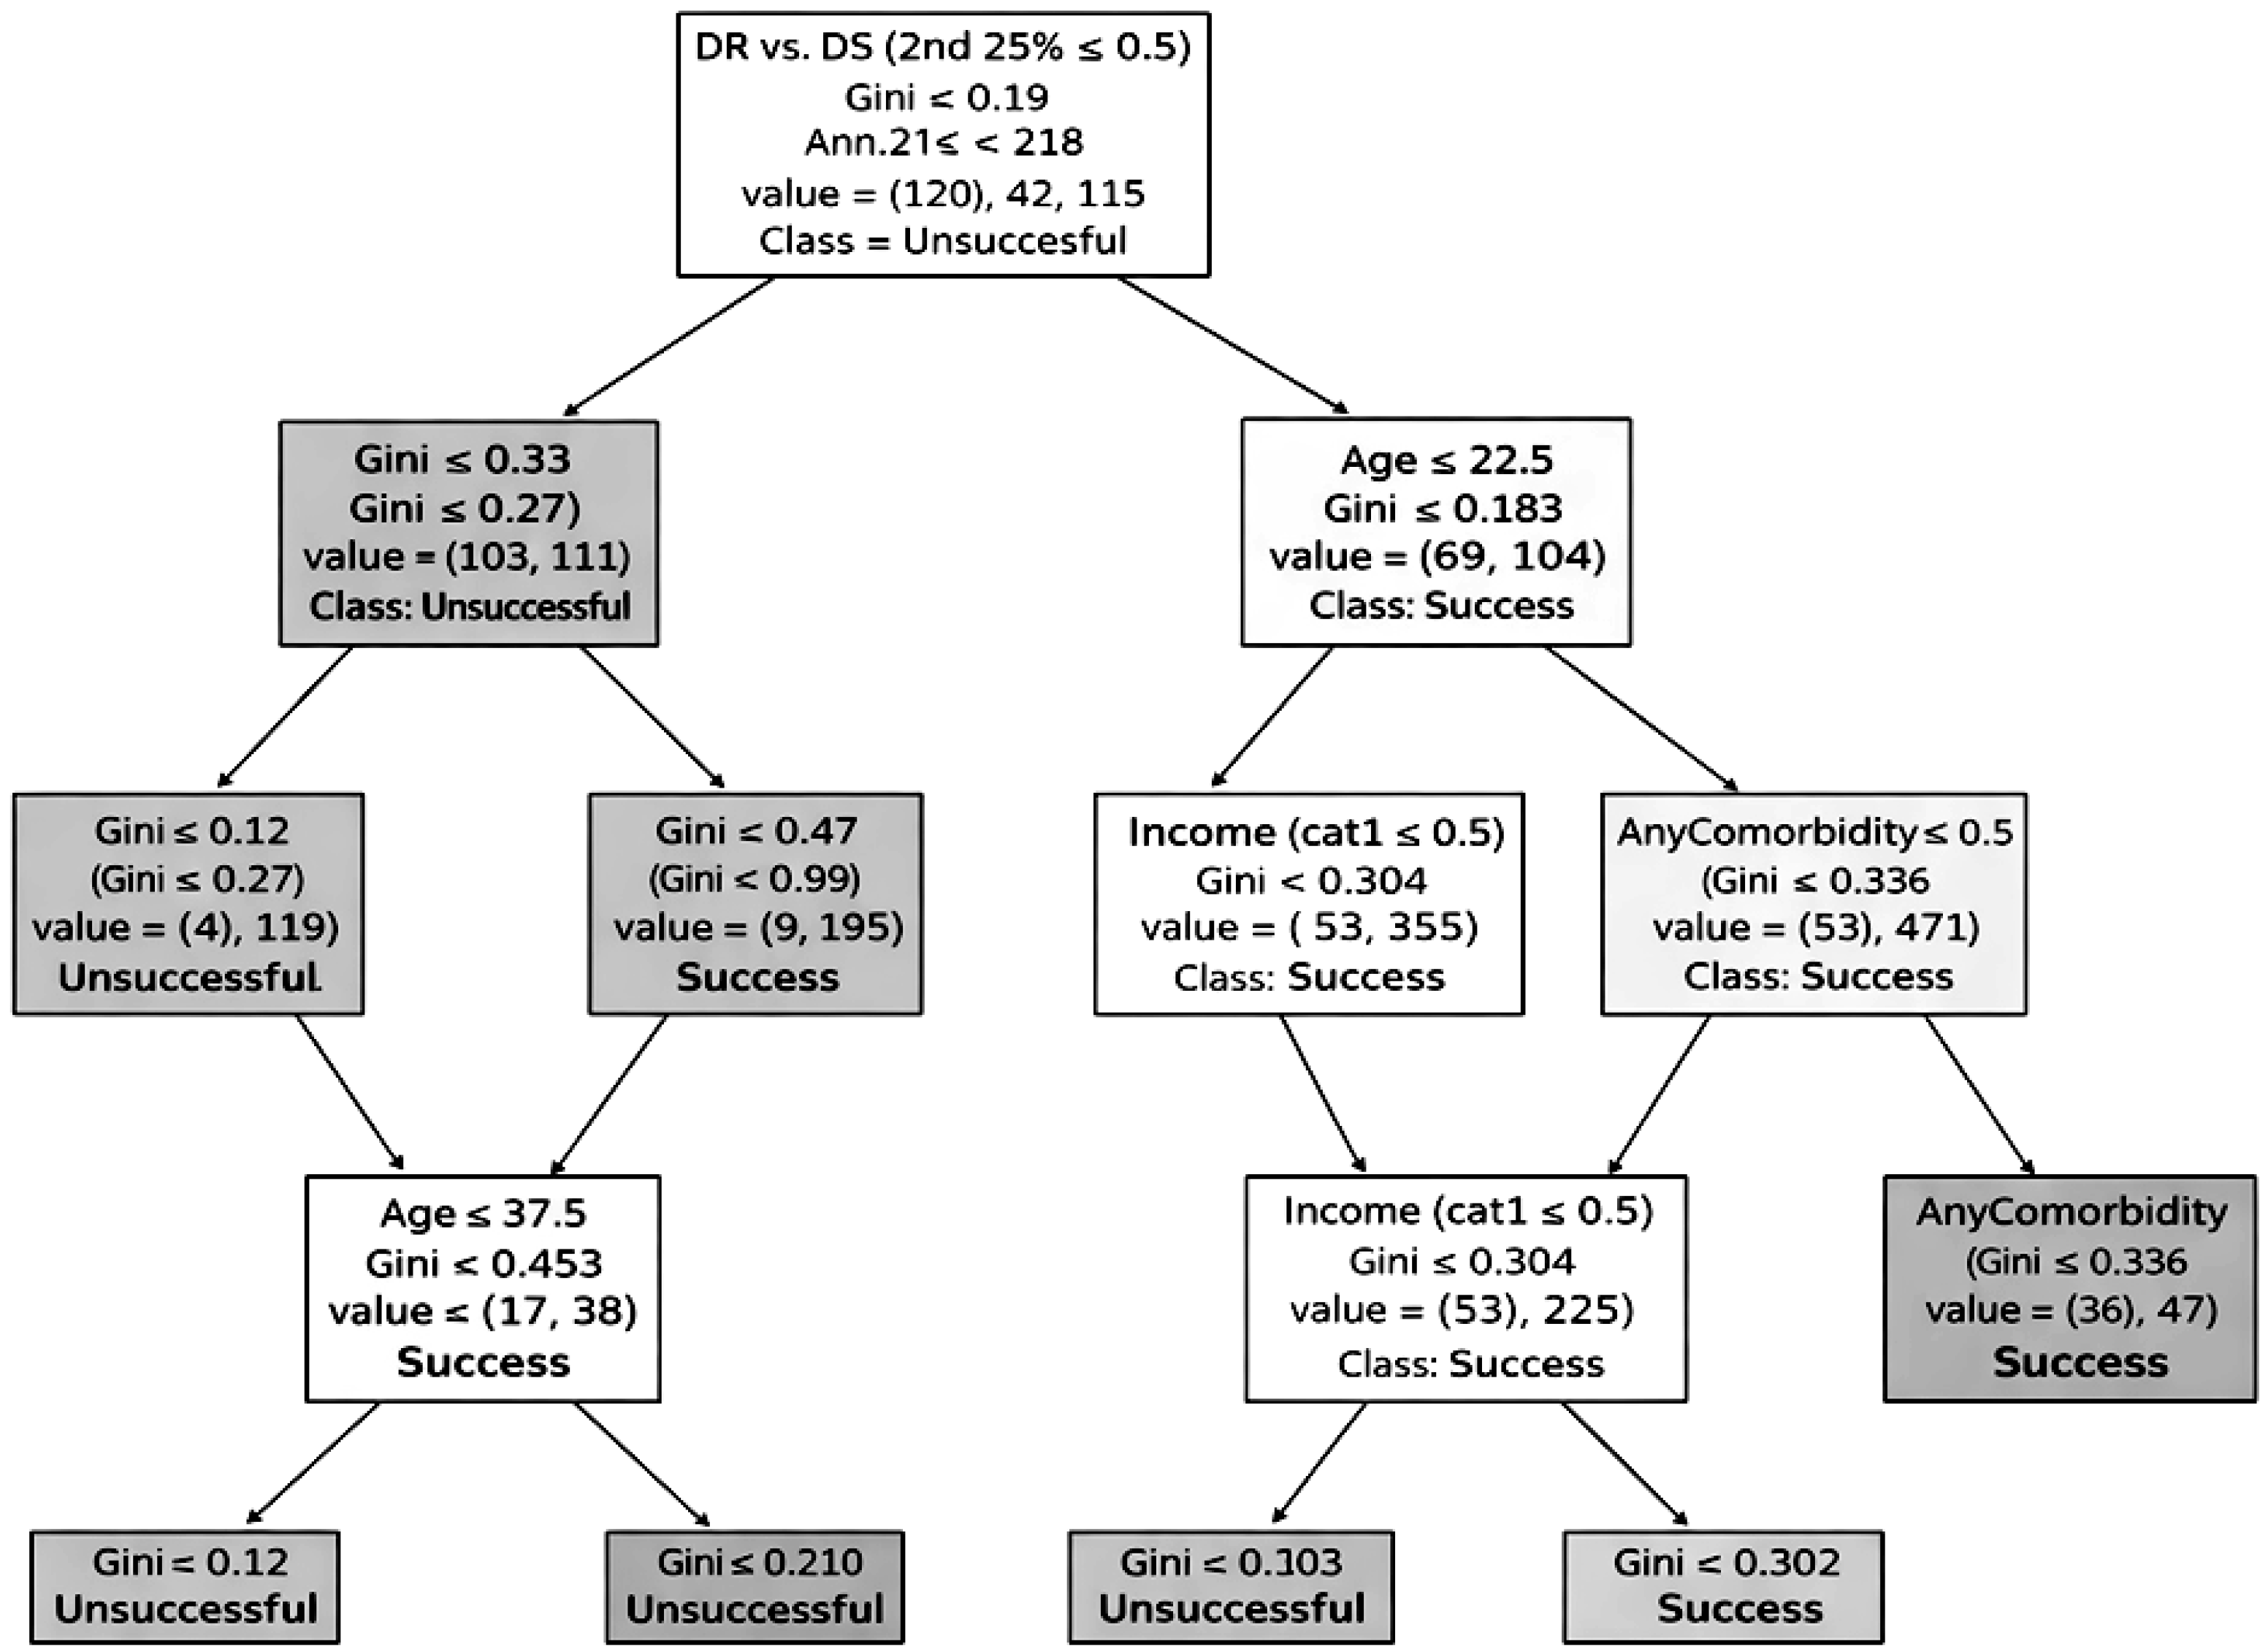
Primary split: Patients with DR-TB were substantially more likely to experience unsuccessful outcomes (LTFU, failure, or death) compared to those with drug-susceptible TB (DS-TB).
Age effect: Among DS-TB patients, a younger age (<40 years) was associated with higher success rates (cure or treatment completion), whereas older age groups showed progressively lower success rates. This reflects the known clinical challenge of comorbidities, frailty, and adherence barriers in older populations.
Socio-economic predictors: For older DS-TB patients, income source further stratified outcomes. Patients reporting salaried or wage income tended to have higher success, while those with no income or dependent on grants had poorer outcomes, highlighting the role of socio-economic security in treatment adherence.
Comorbidities: The presence of any comorbidity (particularly HIV or hypertension/diabetes combinations) appeared in lower branches, modestly reducing the probability of success. However, the impact was minor compared to DR-TB status and age.
Figure 1 provides a visual representation of hierarchical risk pathways for TB treatment outcomes. The tree should be interpreted from top to bottom. The first split represents the most influential predictor, with subsequent splits indicating additional factors that further stratify patient risk. The figure is intended as an interpretive tool to illustrate how combinations of clinical and socio-economic factors interact to shape treatment outcomes, rather than as a standalone predictive model.
The different shades observed across nodes in Figure 1 reflect variations in Gini impurity (node purity) generated by the decision tree algorithm rather than differences in predictors or outcomes themselves. Nodes with lower Gini values, indicating greater homogeneity and higher classification certainty for a given outcome, appear darker, whereas nodes with higher Gini values, indicating greater outcome heterogeneity, appear lighter. This shading is applied uniformly by the model and is independent of the variable used for splitting (e.g., age, income, or comorbidity). Consequently, nodes associated with Any Comorbidity and other downstream splits tend to show lighter shading because they represent secondary risk modifiers with more mixed outcomes, while upstream nodes show stronger separation and lower impurity.

4. Discussion

This study identified drug resistance status, age, income stability, and comorbidity burden as the key factors influencing TB treatment outcomes in a rural South African cohort. Logistic regression achieved high overall accuracy and confirmed strong links between these predictors and treatment success. The decision tree, while somewhat less accurate, offered clearer hierarchical pathways of risk, illustrating that DR-TB, older age, lack of income, and comorbidity sequentially contributed to stratifying patients at the highest risk of failure, death, or loss to follow-up.
The finding that drug resistance status is the most influential predictor is well supported by studies in South Africa and other high-burden settings, where rifampicin-resistant and multidrug-resistant TB (MDR-TB) patients experience lower success rates and higher mortality. Seloma et al. [21] reported poor DR-TB outcomes linked to resistance patterns, previous treatment, and HIV co-infection in Limpopo Province. Similarly, Nxumalo et al. [22] observed that DR-TB, low BMI, and delayed diagnosis were significantly associated with poor outcomes in Eastern Cape rural clinics. These findings align with the decision tree’s first split on DR-TB in this study. Furthermore, Osman et al. [23], using an individual patient-based national electronic TB treatment register of DS-TB in South Africa, reported that older age, male gender, previous TB treatment, and HIV infection (with or without antiretroviral therapy (ART)) were associated with an increased risk of mortality. Bassett et al. [24] reported substantial mortality and LTFU among individuals with TB in a cohort with HIV, consistent with the broader evidence that TB/HIV comorbidity increases mortality risk when care is delayed or disrupted. Furthermore, a systematic review and meta-analysis of studies regarding tuberculosis-associated mortality among co-infected patients, a considerable mortality burden, was reported in people living with HIV, reinforcing HIV as a major risk factor for poor outcomes [25]. Older age and the burden of comorbidities were also significant predictors. Evidence from other African countries such as Ethiopia, Nigeria, and Uganda, as well as from Asia, aligns with our results, indicating that older age, HIV, and other comorbidities predicted mortality among DR-TB patients [26,27,28,29,30]. For DR-TB, coexisting HIV, diabetes, hypertension, and harmful alcohol use further increase the risks of mortality and treatment failure. Evidence from Iran further supports these observations that retreatment status and comorbid conditions such as diabetes and HIV infection substantially worsen outcomes among patients with DR-TB [13]. Our model’s identification of comorbidity burden as a significant risk node supports current evidence emphasizing the need for integrated care for TB patients with chronic diseases. The study’s finding that income stability is an important predictor highlights the critical role of socio-economic vulnerability in TB outcomes. Studies from Ethiopia and Nigeria have demonstrated that socio-economic vulnerability, including poverty, migration, and limited educational attainment, is strongly associated with unfavorable TB outcomes. In particular, spatial analysis carried out in Ethiopia [17] identified clustering of MDR-TB in socio-economically disadvantaged regions, supporting our observation that structural vulnerability remains a key driver of poor treatment outcomes in high-burden contexts. Likewise, Mengesha et al. [31] found that low income, food insecurity, and lack of social support increased the risk of poor treatment outcomes. Socio-economic deprivation has also been linked to worse TB treatment outcomes and higher incidence rates in South Africa and globally [32,33]. Machine learning studies from Uganda and Kenya similarly show that unemployment, food insecurity, and housing instability predict non-adherence and treatment interruption [34,35]. These findings reinforce that social determinants substantially influence TB outcomes and should be considered core components of TB control programs.
At the population level, global modeling studies [3,36,37] have demonstrated that higher levels of socio-economic development including income stability, education, and urbanization are associated with reduced TB incidence. These findings are consistent with our results, which suggest that economic stability may play a protective role against poor treatment outcomes, further emphasizing the influence of upstream social determinants on TB control. In addition, qualitative evidence from India [16] has highlighted the contribution of psychosocial factors, including stigma, treatment burden, and inadequate social support, to poor adherence and treatment failure among patients with DR-TB. These findings provide important contextual support for our observations of socio-economic and psychosocial vulnerability within the study population. Overall, the consistency between our findings and those reported across diverse geographical settings strengthens the validity of the present study and underscores the need for integrated clinical, social, and programmatic interventions to improve TB treatment outcomes in high-burden settings.
Considering the model’s moderate discriminative performance and overall classification accuracy of 65.8%, these findings suggest that the decision tree may be useful for flagging patients at higher risk of unfavorable outcomes, although a proportion of successfully treated patients were misclassified. Logistic regression outperformed the decision tree in predictive accuracy, consistent with the literature, which shows that regression models tend to be more robust and stable. In contrast, tree-based models offer better interpretability but sometimes less precision. Recent modeling studies in China and Southeast Asia have found similar patterns: regression-derived clinical scores achieved high discrimination. At the same time, decision trees provide intuitive pathways that are useful for stratified care planning [38,39]. The decision tree framework uniquely illustrates how socio-economic disadvantage amplifies clinical risks, reinforcing the importance of integrated social and health interventions. Our use of both approaches highlights the complementary value of statistical and machine learning methods in TB prediction research.

4.1. Limitations

Some limitations need to be acknowledged. First, generalizability is limited, as the findings are based on data from selected clinics in the rural Eastern Cape and may not precisely reflect patterns across South Africa’s diverse settings. Secondly, the dataset included relatively few unsuccessful outcomes, which limited sensitivity for poor prognosis in logistic regression and may affect generalizability. Although class weighting improved the performance threefold, imbalance still poses a methodological challenge. The threefold-improved performance was coded broadly, restricting insights into the effects of specific conditions like hypertension or diabetes when combined with HIV. Thirdly, as a retrospective analysis, unmeasured confounders (e.g., adherence and health system barriers) could influence the outcomes.

4.2. Implications for Policy and Practice

These results underscore the need for targeted interventions. The strong influence of drug resistance and comorbidity burden on treatment outcomes suggests that current TB programs may insufficiently differentiate care based on patient risk profiles. This highlights the need for policies that prioritize early risk identification and integrated management of TB with HIV and non-communicable diseases (NCDs), particularly in resource-limited rural settings. The role of income instability emphasizes that social determinants are central to treatment success, indicating a need for policies that integrate social protection into TB programs. The effectiveness of predictive modeling demonstrates the potential value of data-driven decision-making for program planning and resource allocation.

4.3. Recommendations

Based on the study findings, TB programs should implement risk-stratified patient management using key predictors such as drug resistance, age, income stability, and comorbidity burden to identify patients at high risk of poor outcomes early and provide intensified follow-up and support. Strengthening integrated TB–HIV–NCD care is essential, with emphasis on early screening and management of comorbidities. Given the influence of socio-economic vulnerability, social protection interventions should be expanded for patients without stable income to improve adherence and reduce LTFU. In addition, routine TB data systems must be strengthened at the district level to support accurate data capture and enable predictive modeling. Prediction models should be validated and refined across multiple provinces to support scalability and inform the implementation of national TB programs.

5. Conclusions

This study demonstrates that drug resistance, age, income, and comorbidity burden define a hierarchical risk profile for TB treatment outcomes. While logistic regression offers robust overall prediction, decision trees provide an interpretable framework for risk stratification. Integrating socio-economic and clinical support remains essential to improving TB outcomes in high-burden, resource-constrained settings. Integrating risk prediction into TB programs and addressing comorbidities and social needs could significantly improve treatment success and reduce TB-related mortality in rural communities.

Author Contributions

Conceptualization, N.N. and M.C.H.; methodology, M.C.H. and L.M.F.; software, L.M.F. and M.C.H.; validation, L.M.F. and M.C.H.; formal analysis, N.N., L.M.F. and M.C.H.; investigation, N.N. and M.C.H.; resources, T.A. and M.C.H.; data curation, L.M.F., N.D. and M.C.H.; writing—original draft preparation, N.N., L.M.F. and M.C.H.; writing—review and editing, L.M.F., N.D., T.A. and M.C.H.; supervision, M.C.H.; project administration, M.C.H.; funding acquisition, T.A. All authors have read and agreed to the published version of the manuscript.

Funding

This research was funded by the School of Pathology, Faculty of Medicine and Health Sciences. Walter Sisulu University funded Walter Sisulu University, Mthatha, and the APC.

Institutional Review Board Statement

The study was conducted in accordance with the Declaration of Helsinki and approved by the Walter Sisulu University Health Sciences Research Ethics Committee (protocol code WSU.HREC 150/2025 and date of approval 1 July 2025) and Eastern Cape Department of Health (EC_202510_023).

Informed Consent Statement

Not applicable as this study only reviewed patient files. It belongs to retrospective study.

Data Availability Statement

Data can be requested upon reasonable request from the corresponding author.

Acknowledgments

The authors are grateful to the facility managers, healthcare professionals, and data capturers in the healthcare facilities for giving access to patient files. We appreciate the contributions and assistance of the WSU-TB research group mentors and 2025 honors students during data collection.

Conflicts of Interest

The authors declare that they have no conflicts of interest. The funder had no role in the design of the study, in the collection, analysis, or interpretation of data, in the writing of the manuscript, or in the decision to publish the results.

Abbreviations

The following abbreviations are used in this manuscript:
ARTAntiretroviral therapy
DOTDirectly observed treatment
DRTBDrug-resistant tuberculosis
DSTBDrug-sensitive tuberculosis
LTFUDrug-resistant tuberculosis
MDR-TBMultidrug-resistant tuberculosis
NCDNon-communicable disease
NTPNational Tuberculosis Program
ORsOdds ratios
PTBPulmonary TB
PT1Previously treated with first-line anti-TB drugs
PT2Previously treated with second-line anti-TB drugs
WHOWorld Health Organization

References

  1. World Health Organization (WHO). Global Tuberculosis Report; World Health Organization (WHO): Geneva, Switzerland, 2024; Available online: https://iris.who.int/server/api/core/bitstreams/7292c91e-ffb0-4cef-ac39-0200f06961ea/content (accessed on 26 September 2025).
  2. World Health Organization (WHO). Tuberculosis: Fact Sheet (Updated 14 March 2025); WHO: Geneva, Switzerland, 2025. [Google Scholar]
  3. Lei, Y.; Wang, J.; Wang, Y.; Xu, C. Geographical evolutionary pathway of global tuberculosis incidence trends. BMC Public Health 2023, 23, 755. [Google Scholar] [CrossRef]
  4. World Health Organization (WHO) South Africa. Intensifying Efforts to End TB. Available online: https://www.afro.who.int/countries/south-africa/news/south-africa-intensifying-efforts-end-tb (accessed on 19 January 2026).
  5. Holtgrewe, L.M.; Johnson, A.; Nyhan, K.; Boffa, J.; Shenoi, S.V.; Karat, A.S.; Davis, J.L.; Charalambous, S. Burden of tuberculosis in underserved populations in South Africa: A systematic review and meta-analysis. PLoS Glob. Public Health 2024, 4, e0003753. [Google Scholar] [CrossRef]
  6. Venter, F. What’s on the Horizon for HIV? Pharma Game of Thrones. 2025. Available online: https://knowledgehub.health.gov.za/system/files/2025-04/HIV%20update%202025%20for%20AHD%20%20-Francoisventer.pdf (accessed on 19 January 2025).
  7. Statistic South Africa (StasSA) Mid-Year Population Estimates. 2025. Available online: https://www.statssa.gov.za/publications/P0302/P03022025.pdf (accessed on 19 January 2026).
  8. Tanyanyiwa, F.T.; Van Wyk, R.H.; Setswe, K.G. Assessment of the Syndemic Relationship Between Individual, Social, and Structural Determinants of Tuberculosis Among People Living in Johannesburg, South Africa. Int. J. Environ. Res. Public Health 2025, 22, 1272. [Google Scholar] [CrossRef]
  9. Emegano, D.I.; Duwa, B.B.; Usman, A.G.; Ahmad, H.; Ozsahin, D.U.; Askar, S. A comparative study on TB incidence and HIVTB coinfection using machine learning models on WHO global TB dataset. Sci. Rep. 2025, 15, 13690. [Google Scholar] [CrossRef]
  10. Jadhav, S.; Nair, A.; Mahajan, P.; Nema, V. The crosstalk between HIV-TB co-infection and associated resistance in the Indian population. Venereology 2024, 3, 183–198. [Google Scholar] [CrossRef]
  11. Olivier, C.; Luies, L. WHO goals and beyond: Managing HIV/TB Co-infection in South Africa. SN Compr. Clin. Med. 2023, 5, 251. [Google Scholar] [CrossRef]
  12. National Department of Health. TB Strategic Plan: 2023–2028 South African National TB Program. Available online: https://tbthinktank.org/wp-content/uploads/2024/05/National-TB-Program-Strategic-Plan-2023-2028.pdf (accessed on 21 January 2026).
  13. Daneshi, S.; Mehni, E.B.; Kamali, M.; Barfar, E.; Barahouei, F.B.; Hushmandi, K.; Raesi, R. Prevalence and contributing factors of drug-resistant tuberculosis (DR-TB) in Iran: A systematic review. BMC Infect. Dis. 2025, 25, 1004. [Google Scholar] [CrossRef]
  14. Tusho, A.R.; Mokoboto-Zwane, S.T. Treatment completion of drug-resistant tuberculosis in Ethiopia: A perspective from healthcare users. PLoS Glob. Public Health 2025, 5, e0004110. [Google Scholar] [CrossRef] [PubMed]
  15. Evelina, L.; Adriana, N.; Serghei, C.; Liliya, T. Predictive factors associated with low tuberculosis treatment outcome: A cross-sectional study. Mold. Med. J. 2017, 60, 7–12. [Google Scholar] [CrossRef]
  16. Nagarajan, K.; Kumarsamy, K.; Begum, R.; Panibatla, V.; Reddy, R.; Adepu, R.; Munjattu, J.F.; Sellapan, S.; Arangba, S.; Goswami, A.; et al. A dual perspective of psycho-social barriers and challenges experienced by drug-resistant TB patients and their caregivers through the course of diagnosis and treatment: Findings from a qualitative study in Bengaluru and Hyderabad Districts of South India. Antibiotics 2022, 11, 1586. [Google Scholar] [CrossRef] [PubMed]
  17. Alene, K.A.; Viney, K.; McBryde, E.S.; Clements, A.C. Spatial patterns of multidrug resistant tuberculosis and relationships to socio-economic, demographic and household factors in northwest Ethiopia. PLoS ONE 2017, 12, e0171800. [Google Scholar] [CrossRef]
  18. Balogun, O.S.; Olaleye, S.A.; Mohsin, M.; Toivanen, P. Investigating machine learning methods for tuberculosis risk factors prediction: A comparative analysis and evaluation. In Proceedings of the 37th International Business Information Management Association (IBIMA), Cordoba, Spain, 30–31 May 2021. [Google Scholar]
  19. Statistic South Africa (StasSA) 2023. Available online: https://www.statssa.gov.za/?p=16760 (accessed on 21 January 2026).
  20. National Department of Health National TB Recovery Plan 3.0 April 2024–March 2025. Available online: https://tbthinktank.org/wp-content/uploads/2024/06/TB-Recovery-Plan-3.0-2024-25-ver010624.pdf (accessed on 25 January 2026).
  21. Seloma, N.M.; Makgatho, M.E.; Maimela, E. Evaluation of drug-resistant tuberculosis treatment outcome in Limpopo province, South Africa. Afr. J. Prim. Health Care Fam. Med. 2023, 15, 3764. [Google Scholar] [CrossRef]
  22. Nxumalo, E.L.; Sineke, N.; Dlatu, N.; Apalata, T.; Faye, L.M. Treatment Outcomes of Tuberculosis in the Eastern Cape: Clinical and Socio-Demographic Predictors from Two Rural Clinics. Int. J. Environ. Res. Public Health 2025, 22, 1804. [Google Scholar] [CrossRef]
  23. Osman, M.; van Schalkwyk, C.; Naidoo, P.; Seddon, J.A.; Dunbar, R.; Dlamini, S.S.; Welte, A.; Hesseling, A.C.; Claassens, M.M. Mortality during tuberculosis treatment in South Africa using an 8-year analysis of the national tuberculosis treatment register. Sci. Rep. 2021, 11, 15894. [Google Scholar] [CrossRef]
  24. Bassett, I.V.; Chetty, S.; Wang, B.; Mazibuko, M.; Giddy, J.; Lu, Z.; Walensky, R.P.; Freedberg, K.A.; Losina, E. Loss to follow-up and mortality among HIV-infected people co-infected with TB at ART initiation in Durban, South Africa. JAIDS J. Acquir. Immune Defic. Syndr. 2012, 59, 25–30. [Google Scholar] [CrossRef] [PubMed][Green Version]
  25. Bizuneh, F.K.; Bizuneh, T.K.; Masresha, S.A.; Kidie, A.A.; Arage, M.W.; Sirage, N.; Abate, B.B. Tuberculosis-associated mortality and risk factors for HIV-infected population in Ethiopia: A systematic review and meta-analysis. Front. Public Health 2024, 12, 1386113. [Google Scholar] [CrossRef] [PubMed]
  26. Hiluf, S.B.; Abera, A.; Bahiru, M.; Kassie, B. Determinants of unsuccessful tuberculosis treatment outcome in Southwest Ethiopia regional state public hospitals, 2022: A multi-center case control study. Front. Public Health 2024, 12, 1406211. [Google Scholar] [CrossRef]
  27. Oyefabi, A.M.; West, C.T.; Ameh, S.; Jiya, E.N.; Sadiq, A.; Dauda, H.; Onoh, M. Predictors of Mortality among Drug-Resistant Tuberculosis Patients in Kaduna State, Nigeria. Niger. J. Clin. Pract. 2023, 26, 825–831. [Google Scholar] [CrossRef]
  28. Barteka, G.; Bwayo, D.; Matovu, J.K.; Wanume, B.; Alunyo, J.P.; Sseguya, R.; Masaba, J.P.; Obbo, J.S. Treatment outcomes and predictors of success for multidrug-resistant tuberculosis MDR TB in Ugandan regional referral hospitals. Sci. Rep. 2025, 15, 14144. [Google Scholar] [CrossRef]
  29. Nowiński, A.; Wesołowski, S.; Korzeniewska-Koseła, M. The impact of comorbidities on tuberculosis treatment outcomes in Poland: A national cohort study. Front. Public Health 2023, 11, 1253615. [Google Scholar] [CrossRef] [PubMed]
  30. Teka, D.; Assegid, S.; Ahmed, J.; Debella, A.; Amentie, E.; Wami, G.; Eyeberu, A. Determinants of unsuccessful TB treatment outcomes among patients on directly observed treatment short course in Jimma town health facilities, Southwest Ethiopia: A Case-Control study. Infect. Drug Resist. 2023, 15, 6427–6435. [Google Scholar] [CrossRef] [PubMed]
  31. Mengesha, M.M.; Gebremichael, M.A.; Watumo, D.; Hallström, I.K.; Jerene, D. Poor adult tuberculosis treatment outcome and associated factors in Gibe Woreda, Southern Ethiopia: An institution-based cross-sectional study. PLoS Glob. Public Health 2022, 2, e0000161. [Google Scholar] [CrossRef]
  32. Dlatu, N.; Longo-Mbenza, B.; Apalata, T. Predictors of tuberculosis incidence and the effects of multiple deprivation indices on tuberculosis management in OR Tambo district over 5 years. PLoS ONE 2022, 17, e0264811. [Google Scholar] [CrossRef]
  33. Ngah, V.D.; Rangoanana, M.; Fwemba, I.; Maama, L.; Maphalale, S.; Molete, M.; Ratikoane, R.; Ogunrombi, M.; Daramola, J.; Nyasulu, P.S. Evaluating determinants of treatment outcomes among tuberculosis patients in the mining district of Butha Buthe, Lesotho. IJID Reg. 2023, 6, 62–67. [Google Scholar] [CrossRef] [PubMed]
  34. Gichuhi, H.W.; Magumba, M.; Kumar, M.; Mayega, R.W. A machine learning approach to explore individual risk factors for tuberculosis treatment non-adherence in Mukono district. PLoS Glob. Public Health 2023, 3, e0001466. [Google Scholar] [CrossRef]
  35. Anley, D.T.; Akalu, T.Y.; Dessie, A.M.; Anteneh, R.M.; Zemene, M.A.; Bayih, W.A.; Solomon, Y.; Gebeyehu, N.A.; Kassie, G.A.; Mengstie, M.A.; et al. Prognostication of treatment non-compliance among patients with multidrug-resistant tuberculosis in the course of their follow-up: A logistic regression–based machine learning algorithm. Front. Digit. Health 2023, 5, 1165222. [Google Scholar] [CrossRef]
  36. Xue, Y.; Zhou, J.; Wang, P.; Lan, J.H.; Lian, W.Q.; Fan, Y.Y.; Xu, B.N.; Yin, J.P.; Feng, Z.H.; Zhou, J.; et al. Burden of tuberculosis and its association with socio-economic development status in 204 countries and territories, 1990–2019. Front. Med. 2022, 9, 905245. [Google Scholar] [CrossRef]
  37. Wang, Y.; Liu, X.; Li, Y.; Liu, M.; Wang, Y.; Zhang, H.; Liu, J.; Zhao, Y. Association of urbanization-related factors with tuberculosis incidence among 1992 counties in China from 2005 to 2019: A nationwide observational study. Infect. Dis. Poverty 2025, 14, 30. [Google Scholar] [CrossRef]
  38. Lu, B.; Shi, Y.; Wang, M.; Jin, C.; Liu, C.; Pan, X.; Chen, X. Development of a clinical prediction model for poor treatment outcomes in the intensive phase in patients with initial treatment of pulmonary tuberculosis. Front. Med. 2025, 12, 1472295. [Google Scholar] [CrossRef]
  39. Phat, N.K.; Lee, Y.; Vu, D.H.; Long, N.P.; Park, S. Risk factors for tuberculosis treatment outcomes: A statistical learning-based exploration using the SINAN database with incomplete observations. BMC Med. Inform. Decis. Mak. 2025, 25, 301. [Google Scholar] [CrossRef] [PubMed]
Figure 1. Decision tree.
Microbiolres 17 00042 g001
Table 1. Regularized logistic regression analysis of predictors of tuberculosis treatment success.
PredictorCategory/UnitOR
Drug resistance statusDrug-susceptible vs. drug-resistant6.423
AgePer one-year increase1.013
Any comorbidityYes vs. no3.212
HIV statusHIV-negative vs. HIV-positive3.462
Income sourceNo income vs. salaried income0.624
GenderFemale vs. male0.436
Constant (intercept)0.364
OR: odds ratio. Odds ratios were obtained from an L1-regularized logistic regression model. OR > 1 indicates increased odds of treatment success, whereas OR < 1 indicates reduced odds. The constant (intercept) represents the baseline odds of treatment success when all predictors are at their reference categories.
Table 2. Logistic regression—test set classification report.
ClassPrecisionRecallF1-ScoreSupport
00.3330.1820.23511.000
10.8990.9520.92584.000
accuracy0.8630.8630.8630.863
macro avg0.6160.5670.58095.000
weighted avg0.8330.8630.84595.000
Table 3. Decision tree—test set classification report.
ClassPrecisionRecallF1-ScoreSupport
00.1560.4550.23311.000
10.9050.6790.77684.000
accuracy0.6530.6530.6530.653
macro avg0.5310.5670.50495.000
weighted avg0.8180.6530.71395.000
Table 4. Relative feature importance derived from the decision tree model for tuberculosis treatment outcomes.
PredictorFeature Importance
Drug resistance status (DR vs. DS)0.391
Age0.361
Income source (no income)0.193
Any comorbidity0.055
Social history0.000
Patient category0.000
Previous TB treatment history0.000
Occupation0.000
Gender0.000
HIV status0.000
Table 5. Key predictors of tuberculosis treatment outcomes identified using regularized logistic regression.
PredictorCategory/ComparisonOdds Ratio (OR)
Social historySmoking and drugs vs. none687.006
OccupationPrivate sector vs. unemployed14.707
Patient categoryTreatment failure (TF1) vs. new14.461
Drug resistance statusDrug-susceptible vs. drug-resistant6.423
HIV statusHIV-negative vs. HIV-positive3.462
Any comorbidityYes vs. no3.212
AgePer one-year increase1.013
Income sourceNo income vs. salaried income0.624
GenderFemale vs. male0.436
Constant (intercept)0.364
Odds ratios were estimated using L1-regularized logistic regression. OR > 1 indicates increased odds of treatment success, while OR < 1 indicates reduced odds. The constant (intercept) represents baseline odds of treatment success when all predictors are at their reference categories.
Disclaimer/Publisher’s Note: The statements, opinions and data contained in all publications are solely those of the individual author(s) and contributor(s) and not of MDPI and/or the editor(s). MDPI and/or the editor(s) disclaim responsibility for any injury to people or property resulting from any ideas, methods, instructions or products referred to in the content.