Article

Therapeutic Potential of Clerodendrum glabrum and Gardenia volkensii Acetone Extracts: Antioxidant, Antibacterial, and Anti-Virulence Activities

Department of Biochemistry, Microbiology and Biotechnology, University of Limpopo, Private Bag X1106, Sovenga 0727, South Africa
*
Author to whom correspondence should be addressed.
Microbiol. Res. 2025, 16(6), 129; https://doi.org/10.3390/microbiolres16060129
Submission received: 7 May 2025 / Revised: 9 June 2025 / Accepted: 11 June 2025 / Published: 16 June 2025

Abstract

:
Background/Objectives: Antibiotic-resistant bacteria pose a global health threat, driving the need for alternative treatments. Medicinal plants such as Clerodendrum glabrum and Gardenia volkensii are promising sources of bioactive compounds. This study evaluated the antioxidant, antibacterial, and anti-virulence activities of their acetone extracts, comparing sonication and conventional shaking extraction methods. Methods: Colorimetric methods assessed total polyphenol content. Antioxidant activity was measured using 2,2-Diphenyl-1-picrylhydrazyl (DPPH) radical scavenging and hydrogen peroxide (H2O2) assays. Antibacterial effects against Escherichia coli, Pseudomonas aeruginosa, Staphylococcus aureus, and Streptococcus pyogenes were analysed through broth microdilution, total activity, growth kinetics, and combinational studies. Anti-virulence activity was assessed via biofilm biomass inhibition, metabolic activity and anti-swarming assays. Results: Phenolics were the most abundant phytochemicals, followed by flavonols. C. glabrum exhibited strong antioxidant activity in both DPPH and H2O2 assays. MIC values ranged from 0.16 to 2.5 mg/mL, with the shaken G. volkensii leaf extract showing the highest total activity (575 mL/g) against E. coli. A combination of G. volkensii leaf extract and gentamicin resulted in an additive antibacterial effect. All extracts prevented the formation of biofilm biomass in all tested microorganisms (inhibition > 50%) except for extracts obtained by sonication. The sonicated leaf extract of C. glabrum inhibited initial E. coli attachment. Additionally, the sonicated leaf extract of C. glabrum inhibited P. aeruginosa motility. Conclusions: These findings suggested that a targeted approach based on plant species and extraction methods could improve treatment outcomes against biofilm-associated pathogens. Notably, acetone extracts derived from C. glabrum and G. volkensii exhibit considerable potential as natural sources of antioxidant, antibacterial, and anti-virulence agents effective against nosocomial infections.

1. Introduction

The discovery of antibacterial compounds has revolutionised the treatment of severe infectious diseases, saving countless lives [1]. However, there is an alarming increase in microbial resistance to antimicrobials and a diminishing effectiveness of available treatments for common infections [2]. Antibiotic resistance has now become a formidable challenge within the healthcare system, posing a serious threat to public health. This issue is fuelled by factors like globalisation, excessive antibiotic use in animal farming and aquaculture, the widespread use of potent drugs, and inadequate management of antimicrobial substances [3].
Current estimates show that antibiotic resistance causes 700,000 deaths annually, with projections suggesting up to 10 million lives could be at risk by 2050 if no action is taken [2,4]. This statistic emphasises the diminishing effectiveness of existing antibiotics. For instance, the South African National Department of Health reported that 17% of Staphylococcus aureus are non-susceptible to cloxacillin, 25% of Escherichia coli are non-susceptible to third-generation cephalosporin, and 33% Pseudomonas aeruginosa are non-susceptible to carbapenems and 17% non-susceptible to third- and fourth-generation cephalosporins and piperacillin–tazobactam. The prevalence of extended-spectrum beta-lactamase (ESBL) producing Klebsiella pneumoniae has remained at an average of 70% over the past 5 years (2018–2022) [5].
Biofilm formation is one way that bacteria develop resistance to antimicrobials [6]. Biofilms enhance bacterial growth, antibiotic resistance, immune system evasion, and genetic material transfer, facilitating the spread of drug resistance and harmful traits [7,8]. Bacteria in biofilms can be 100–1000 times more antibiotic-resistant than their free-living forms [1]. Within these biofilms, bacteria adapt to low-oxygen and nutrient-limited environments by altering their metabolism, gene expression, and protein production, leading to reduced metabolic activity and slower cell division [9]. These adaptations make bacteria more resistant to antimicrobial treatments by either deactivating drug targets or reducing the cellular functions that antimicrobials disrupt.
Medicinal plants, deeply rooted in traditional medicine, have long been acknowledged for their diverse bioactive compounds with potential therapeutic properties [10,11,12]. The longstanding utilisation of plants for their antimicrobial properties emphasises their enduring importance in healthcare. These properties, frequently arising from phytochemicals produced during the secondary metabolism of plants, have been instrumental in tackling a range of health conditions [13]. The bioactive phytochemicals found in extracts of medicinal plants possess diverse structural complexities and could potentially exert their therapeutic effects by targeting novel pathways [14].
Clerodendrum glabrum E. Mey. var. glabrum is a small- to medium-sized deciduous plant from the Lamiaceae family that comprises approximately 400–500 species and is native to eastern tropical and southern Africa [15,16]. It is commonly known as glory bower, bag flower, bleeding heart, white cat’s whiskers, or tinder wood [17], its leaf decoction has traditionally been used to treat coughs, colds, sore throats, and related chest complaints, while the roots are used for arthritis treatment [16].
Gardenia volkensii K. Schum is a member of the Rubiaceae family and is recognised by various common names such as bushveld gardenia, sand veld gardenia, savanna gardenia, and Transvaal gardenia [18]. An infusion of the root and stem bark of G. volkensii is administered orally to address respiratory ailments like asthma, chest complaints, colds, pneumonia, sore throat, and tuberculosis [18], while its fruits are used in treating earaches, headaches, malaria, and microbial infections and serve as an emetic [19].
Recent studies on C. glabrum have only reported the cytotoxicity [16], antioxidant, antibacterial, and phytochemical profiles of the extracts obtained from this species [17,20]. Similarly, studies on G. volkensii have also focused on the phytochemical composition, antimicrobial activity, antioxidant activity, and cytotoxicity of the extracts [20,21,22]. Among these studies, Mnisi et al. [21] also examined the anti-virulence activities of G. volkensii, since optimisation of phytochemical extraction is essential in natural product research, particularly for the discovery of bioactive compounds with therapeutic potential [23], these studies explored the use of solvents with varying polarities to improve extraction yields.
Pathogenic bacteria often utilise various virulence factors to cause persistent infections, yet there has been limited research into the anti-virulence potential of drugs, particularly regarding the medicinal plants C. glabrum and G. volkensii, despite their known antibacterial activity. This gap represents a missed opportunity, given the potential of plant-derived compounds as alternative or complementary treatments to conventional antibiotics. Addressing this gap, the current study investigated the in vitro antibacterial, antioxidant, and anti-virulence activities of acetone extracts from the leaves and stems of C. glabrum and G. volkensii, focusing on respiratory biofilm-forming bacterial pathogens while comparing conventional shaking and sonication extraction methods. The findings of this study could offer valuable insights for developing new plant-based strategies to combat biofilm-associated infections, especially in the context of rising antimicrobial resistance.

2. Materials and Methods

2.1. Chemicals and Reagents

The following chemicals and reagents were used: acetone (Merck), Whatman’s No. 1 filter paper (Sigma-Aldrich), methanol (Merck), nutrient broth (LabM), p-iodonitrotetrazolium chloride (Merck), Folin–Ciocalteu reagent (Merck), gallic acid (Merck), quercetin, 2,2-diphenyl-1-picrylhydrazyl (Merck), hydrogen peroxide (Merck), L-ascorbic acid (Merck), ampicillin (Merck), gentamicin (Merck), agar, sodium carbonate (Merck), aluminium chloride (Merck), crystal violet (Sigma-Aldrich), and bacteriological agar (LabM).

2.2. Plant Collection

The medicinal plants used in this study, C. glabrum E. Mey. var. glabrum and G. volkensii K. Schum, were purchased in Weenen (24.1346264° S, 29.1485492° E) in the Limpopo Province from informal medicinal plant traders during late autumn. The different plant parts were dried at room temperature in the absence of sunlight and then ground into powder using a commercial blender. The ground plant materials were then stored in air-tight plastic containers.

2.3. Extraction

An amount of 1 g of the ground plant materials of each plant species was extracted with 10 mL of acetone and filtered into pre-weighed glass vials using Whatman’s No. 1 filter paper. Briefly, two extraction methods were used: the conventional shaking and sonication methods. For conventional shaking extraction, the plant–solvent mixtures were agitated at 200 rpm at 25 °C using an incubator shaker (Labtech model 20.2), whereas for the sonication method, the mixtures were sonicated at 200 W ultrasonic power at 25 °C using a sonicator (Eins-Sci Digital E-UC9-HD-D Ultrasonic Cleaner). Each plant material was subjected to three successive extractions under both methods. The first extraction was carried out for 30 min, followed by 20 min, and lastly 10 min. During each extraction period, the extract was filtered into pre-weighed glass vials using Whatman’s No. 1 filter paper, after which 10 mL aliquots of acetone were added to the same plant material for subsequent extractions. The combined filtrates were placed under a fan to evaporate the solvent. The mass of the extract was determined by subtracting the mass of the pre-weighed vials from the final mass of the vials containing the dried residues following solvent evaporation. All dried extracts were subsequently reconstituted to a final 10 mg/mL concentration with acetone.

2.4. Quantitative Phytochemical Screening

2.4.1. Total Phenolic Content

The phenolic content concentration in acetone extracts of specific plant parts was measured using the Folin–Ciocalteu reagent (Merck, Modderfontein, South Africa) method, originally described by Tambe and Bhambar [24]. Gallic acid (Merck, Modderfontein, South Africa) was used as a standard (0.625–1 mg/mL). The absorbance of both the test and standard solutions was determined against a reagent blank at a wavelength of 725 nm using a UV/visible spectrophotometer (Thermo Scientific Genesys 10S, Madison, WI, USA). The total phenolic content was expressed as milligrams of gallic acid equivalents (GAEs) per gram of the extract [24], and the total phenolic content was calculated and determined using a linear regression formula based on a gallic acid calibration standard curve.

2.4.2. Total Flavonoid Content

The total flavonoid content was evaluated using the aluminium chloride colorimetric assay, as documented by Tambe and Bhambar [24]. Quercetin (Merck, Modderfontein, South Africa) was used as a reference standard using a concentration range of 0.625–1 mg/mL. The absorbance of both the test and standard solutions was determined against a reagent blank at a wavelength of 510 nm using a UV/visible spectrophotometer (Thermo Scientific Genesys 10S, Madison, WI, USA). The total flavonoid content was calculated using the formula derived from the quercetin standard curve. The resulting flavonoid content was expressed in milligrams of quercetin equivalents per gram of extract (mg QE/g of extract) [24].

2.4.3. Total Flavonol Content

The total flavonol content was determined by the aluminium chloride colorimetric method outlined by Madjid et al. [25]. Quercetin (Merck, Modderfontein, South Africa) was used to construct the calibration curve using various concentrations (15.63–250 µg/mL). The absorbances were determined against a blank at 425 nm with a UV/visible spectrophotometer (Thermo Scientific Genesys 10S, Madison, WI, USA). The total flavonol content was calculated using a linear regression formula based on a quercetin standard curve. The flavonol content was expressed in milligrams of quercetin equivalents per gram of extract (mg QE/g).

2.4.4. Total Tannin Content

The amount of tannin present was assessed using the Folin–Ciocalteu reagent (Merck, Modderfontein, South Africa) technique as documented by Tambe and Bhambar [24]. Gallic acid (Merck, Modderfontein, South Africa) was used as a standard. The absorbance of both the test samples and standard solutions was measured against a reagent blank at a wavelength of 725 nm using a UV/visible spectrophotometer (Thermo Scientific Genesys 10S, Madison, WI, USA). The total tannin content was ascertained using the formula derived from the gallic acid standard curve, and the tannin content was expressed in milligrams of gallic acid equivalents per gram of extract (mg GAE/g) [24].

2.5. Antioxidant Activity

2.5.1. DPPH Free Radical Scavenging Assay

The free radical scavenging activity was evaluated using the 2,2-diphenyl-1-picrylhydrazyl (DPPH) (Merck, Modderfontein, South Africa) method, originally described by Chigayo et al. [26]. L-Ascorbic acid (Merck, Modderfontein, South Africa) was used as the standard at various concentrations (15.63–250 µg/mL). The control solution was prepared by mixing 1 mL of distilled water and 2 mL of 0.2 mmol/L DPPH. The absorbance of each solution was measured at 517 nm against a blank (mixture of 1 mL acetone and 1 mL 0.2 mmol/L DPPH) using a UV/VIS spectrophotometer (Thermo Scientific Genesys 10S, Madison, WI, USA). The percentage inhibition was calculated using the following formula:
%   s c a v e n g i n g   a c t i v i t y = ( A c A s ) A c × 100
where Ac represents the absorbance of the control solution and As represents the absorbance of the sample containing plant extracts [26].

2.5.2. Hydrogen Peroxide Scavenging Assay

The ability of the plant extracts to scavenge hydrogen peroxide was determined according to the method described by Jayaprakasha et al. [27] with slight modification. A range of concentrations of the plant extracts (15.63–250 µg/mL) was prepared by serial dilution in 0.05 M phosphate buffer at pH 6.6, to a final volume of 1 mL. A parallel series of L-ascorbic acid (Merck, Modderfontein, South Africa) solutions, serving as the standard, were prepared at the same concentration range. To each 1 mL of plant extract or standard solution, 2 mL of 0.043 M hydrogen peroxide (H2O2) prepared in phosphate buffer was added. Subsequently, 2.40 mL of PBS was added to each mixture. The samples were then incubated in the dark at room temperature for 30 min. The control was prepared by combining 2 mL of H2O2 solution with 3.40 mL of phosphate buffer and incubated under identical conditions. Colour controls were prepared in the same manner as the test solutions, but without the addition of H2O2. Phosphate buffer alone was used as the blank. After incubation, the absorbance of each solution was measured at 230 nm using a UV/VIS spectrophotometer (Thermo Scientific Genesys 10S, Madison, USA). The percentage inhibition of H2O2 was quantified using the following formula:
%   r e d u c t i o n   a c t i v i t y = [ A c ( A s A c c ) A c × 100 ,
where Ac is the absorbance of the control, As is the absorbance of the sample, and Acc is the absorbance of the colour control.

2.6. Antibacterial Activity

2.6.1. Preparation of Microorganisms

In this study, we used Biosafety Level 2 strains of Escherichia coli ATCC 25922, Pseudomonas aeruginosa ATCC 27853, and Staphylococcus aureus ATCC 25923, which were procured from Microbiologics®. Additionally, a clinical isolate of Streptococcus pyogenes was obtained from Polokwane Hospital, part of the National Health Laboratory Service (NHLS) in South Africa. Microbial stock cultures were prepared by inoculating a single bacterial colony into 100 mL of sterile nutrient broth (Merck, Modderfontein, South Africa), followed by incubation at 37 °C and agitation at 150 rpm for 18–24 h for bioassays.

2.6.2. Broth Microdilution Assay

The antibacterial efficacy of the plant extracts was assessed by determining the minimum inhibitory concentration against the test microorganism using the broth microdilution method, as previously described by Eloff [28]. Initially, the bacterial cultures were inoculated into sterile broth media to achieve a starting optical density at 600 nm (OD600) of 0.05. The cultures were incubated at 37 °C with agitation at 150 rpm until they reached an OD600 of 0.8–0.9. Following the incubation period, the plant extracts (10 mg/mL) were serially diluted to a final volume of 100 µL using sterile broth. Subsequently, 100 µL of bacterial suspensions containing E. coli, P. aeruginosa, S. aureus, and S. pyogenes were added to the wells of the microtitre plate containing the diluted plant extracts. The final tested concentrations ranged from 0.02 to 2.5 mg/mL. Ampicillin and gentamicin (Merck, Modderfontein, South Africa) were used as positive controls, while acetone was used as the negative control. The microtitre plates were sealed and incubated at 37 °C for 24 h without agitation. After incubation, 0.2% (w/v) p-iodonitrotetrazolium chloride (INT) (Merck, Modderfontein, South Africa) was added to all the wells, and the plates were further incubated for an additional 30 min. INT served as a growth indicator, where the presence of microorganism growth resulted in the reduction of tetrazolium salt, forming pink formazan crystals. The minimum inhibitory concentration (MIC) was identified as the lowest concentration of the plant extract capable of hindering bacterial growth.

2.6.3. Determination of Minimum Bactericidal Concentration (MBC)

The method outlined by Senhaji et al. [29] for determining the minimum bactericidal concentrations (MBCs) of the extracts was adapted with slight modifications. In summary, after determining MIC values, the microtitre plates were incubated for an additional 24 h, bringing the total incubation time to 48 h. Clear wells indicated no microbial growth, and 10 µL of the samples were sub-cultured onto nutrient agar, and this was followed by 24 h of incubation at 37 °C. The MBC was identified as the lowest concentration at which no bacterial growth occurred on the nutrient agar plates.

2.6.4. Total Activity (TA)

The total activities of all the extracts were determined by dividing the mass extracted from 1 g of the plant material by the MIC values [28].

2.6.5. Evaluation of Growth Kinetics During Treatment

The growth kinetics of the test microorganisms were assessed over 24 h in the presence of plant extracts and gentamicin, following the method outlined by Jiang et al. [30]. Overnight cultures were inoculated into 20 mL of nutrient broth containing plant extracts and gentamicin, starting at an OD600 of 0.1. The cultures were incubated at 37 °C in the incubator shaker, and growth was monitored by measuring OD600 at 3 h intervals for the first 12 h, followed by two 6 h intervals to complete the 24 h. The untreated culture served as the positive control, while uninoculated media were used as the negative control.

2.6.6. Combinational Effects

To examine the additive, synergistic, or antagonistic interactions of the crude extracts in relation to antibacterial activity, fractional inhibitory concentration indices (FICIs) were used [31]. Briefly, the MIC values of two plant extracts, A and B, were combined, and the fractional inhibitory concentration (FIC) values of extracts A and B were calculated by dividing the MIC of the combination of extract A and B by the MIC values of each plant extract, respectively. The FICI was determined by adding the FIC value of extract A and extract B. The interactions were described as synergistic (ΣFIC ≤ 0.5), additive (0.5 < ΣFIC ≤ 1.0), indifferent (1.0 < ΣFIC ≤ 4.0), and antagonistic (ΣFIC > 4.0) [31].

2.7. Anti-Virulence Activity

2.7.1. Antibiofilm Activity (Biomass)

The inhibition of initial cell attachment and biofilm formation, as well as the eradication of preformed biofilms by the plant extracts, was assessed using the crystal violet staining assay as previously documented by Sandasi et al. [32]. The bacterial strains were initially screened for their biofilm formation ability.

2.7.2. Inhibition of Initial Cell Attachment

A volume of one hundred microliters from each standardised bacterial culture with an optical density of 0.02 at 600nm (OD600) for E. coli, P. aeruginosa, S. aureus, and S. pyogenes was added into separate flat-bottomed 96-well microtitre plates. The microtitre plates were covered and left to incubate at 37 °C for a duration of 4 h without agitation. After the incubation period, the plates were taken out from the incubator and exposed to 100 µL of acetone extracts. The extracts were administered at various concentrations (MIC, 1 2 MIC, 1 4 MIC, 1 8 MIC) in triplicate. Subsequently, the plates were incubated again at 37 °C for an additional 24 h without agitation. The untreated culture was used as the control. Following incubation, the biomass was evaluated using the crystal violet staining assay [2,32].

2.7.3. Eradication of Preformed Biofilms

For the eradication of the preformed biofilm, a similar method was employed as stated above. However, the plates were incubated for a duration of 24 h prior to the treatment with acetone extracts. Following the treatment, the plates were incubated for 24 h, and the biomass was quantified as stated above [2,32].

2.7.4. Inhibition of Biofilm Formation

The inhibition of biofilm formation was assessed similarly as stipulated on the inhibition of initial cell attachment but with modifications. The bacterial culture was added to the acetone extracts at the same time and then incubated for 24 h. Following the incubation period, the biofilm biomass was quantified using the crystal violet staining assay [32].

2.7.5. Crystal Violet Staining Assay

The capability of the acetone extracts to inhibit initial cell attachment, eradicate pre-existing biofilms, or inhibit biofilm formation was assessed using the crystal violet assay previously described by Sandasi et al. [32], with modifications. After the incubation duration post-treatment with acetone plant extracts, the plates underwent three washes with sterile distilled water to eliminate any loosely attached or planktonic bacteria. Subsequently, the plates were air-dried and oven-dried at 60 °C for 45 min. Then, each well was stained with 100 µL of a 0.1% crystal violet (Merck, Modderfontein, South Africa) solution and left to incubate at room temperature for 15 min. Following this, the plates were washed thrice with sterile distilled water. In the following step, 100 µL of methanol (Merck, Modderfontein, South Africa) was introduced to the wells to dissolve the crystal violet (destain the wells), after which absorbances were measured at 590 nm utilising a plate reader (Thermo Scientific Multiskan Sky, Waltham, MA, USA). The average absorbance of the samples was calculated, and the biofilm’s inhibition percentage was assessed using the following formula:
%   a n t i b i o f i l m   a c t i v i t y = ( A c A s ) A c × 100 ,
where Ac is the absorbance of the control and As represents the absorbance of the sample.

2.7.6. Evaluation of Metabolic Activity

To assess the metabolic activity of the microorganisms, a similar method, as stated regarding the inhibition of biofilm formation, was employed with some modifications. Following the incubation period, the bacterial culture was carefully discarded. The wells were then washed with phosphate-buffered saline (PBS, pH 7.4) to remove non-adherent cells. Following the washing step, 40 µL of 0.2 mg/mL INT was added to each well. The absorbances of the mixtures were measured at 490 nm with a plate reader (Thermo Scientific Multiskan Sky, Waltham, USA). Metabolic activity was calculated using the equation as used in the crystal violet staining assay.

2.7.7. Antimotility Activity

The antimotility activity of the plant extracts against E. coli, P. aeruginosa, and S. aureus swarming was evaluated as reported by Caigoy et al. [33]. Swarming soft agar was prepared from nutrient broth (Merck, Modderfontein, South Africa) and 0.5% bacteriological agar (LabM, Manchester, UK). Soft agars containing MIC and ½ MIC levels of the selected plant extracts were spotted with 10 µL of overnight-grown bacterial suspension at the centre. The migration of colonies was measured, and % antimotility activity was measured by the following formula:
%   a n t i m o t i l i t y   a c t i v i t y = ( D c o n t r o l D t r e a t m e n t ) D c o n t r o l × 100
where Dcontrol is the diameter of the control, and Dtreatment is the diameter of the treatment.

2.8. Statistical Analysis

A statistical analysis of differences between the experimental results was performed using two-way analysis of variance (ANOVA), followed by Dunnett’s multiple comparisons test in GraphPad Prism (version 9). Data are expressed as means ± standard deviation, with significance determined at p-values < 0.05 and non-significance at p-values > 0.05. Correlations and heatmaps were generated with GraphPad Prism (version 9).

3. Results

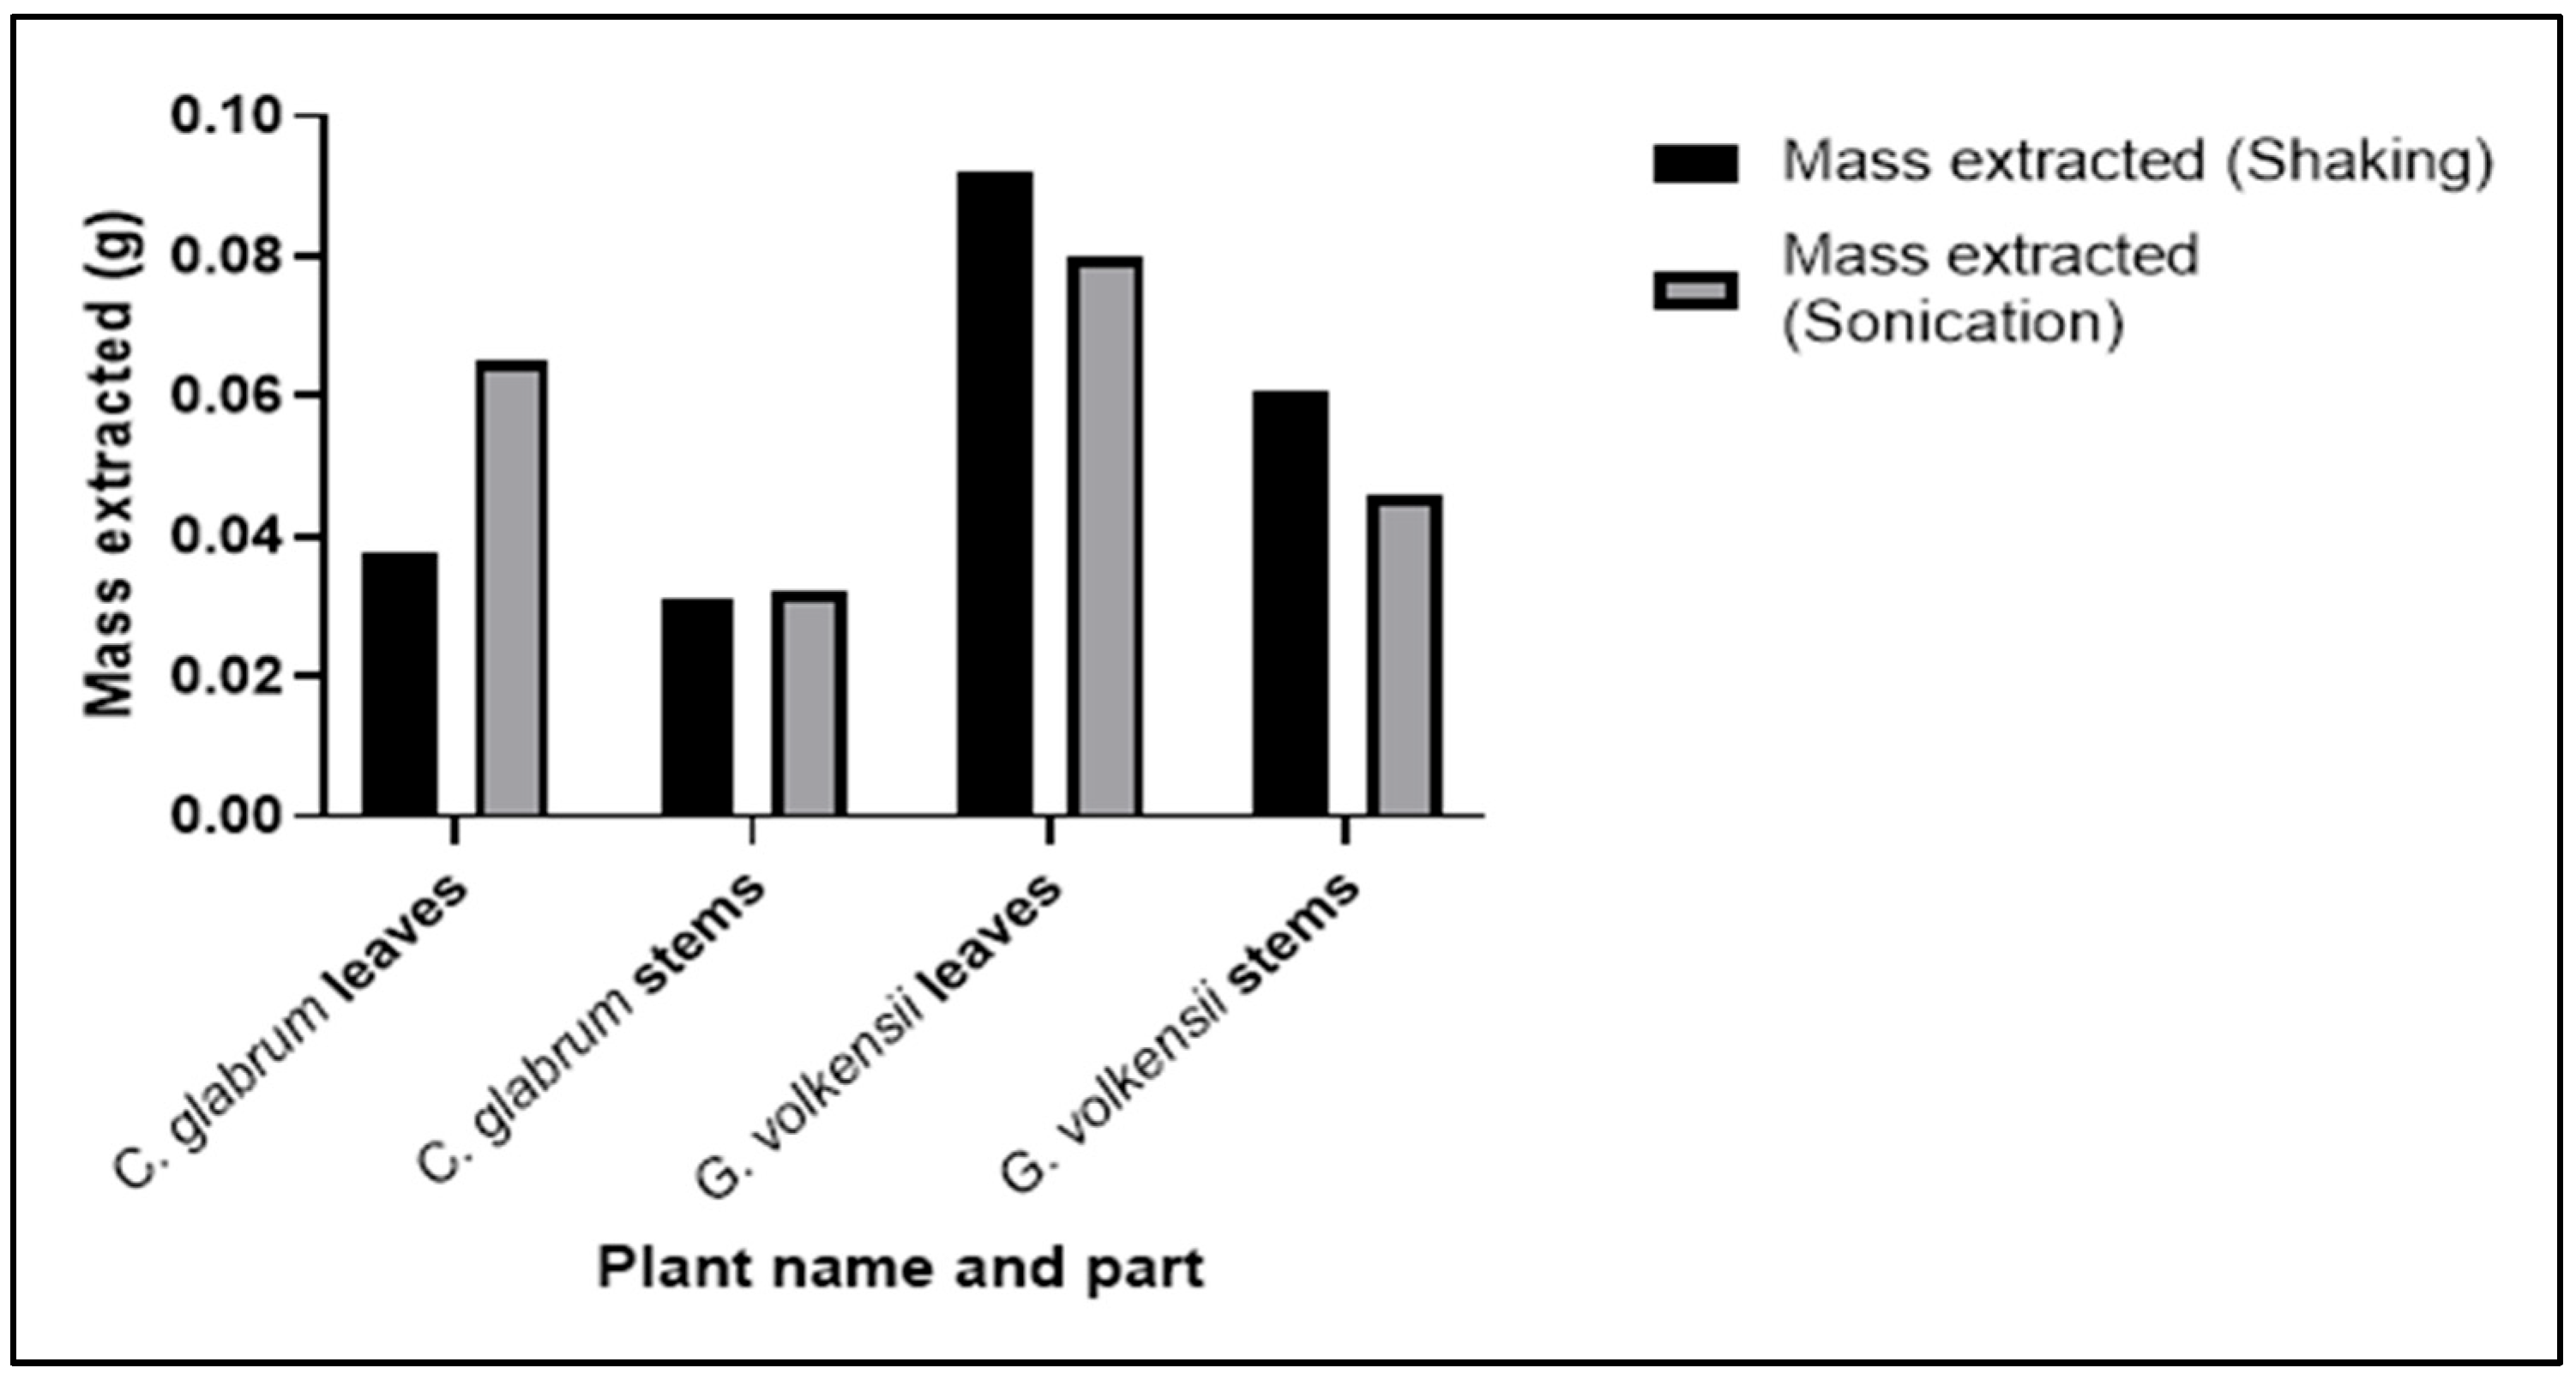
3.1. Extraction of Plant Material

One gram of ground plant material, including the leaves and stems of C. glabrum and G. volkensii, was subjected to acetone extraction (10 mL) using both conventional shaking and sonication methods. The sonication of C. glabrum leaves and stems resulted in significantly higher mass yields compared to conventional shaking (CS). In contrast, CS produced higher extraction yields for G. volkensii. Additionally, for both plants, the leaves exhibited greater extraction yields than the stems (Figure 1).

3.2. Quantitative Phytochemical Analysis

The total flavonoid, flavonol, phenolic, and tannin contents were determined using colorimetric methods, and their quantities (Table 1) were estimated using equations obtained from the calibration curves. Phenolics and flavonols were the most abundant phytochemicals. The leaf extract of C. glabrum had the highest levels of phenolics (125.34 mg GAE/g) and flavonoids (24.52 mg QE/g), while the leaf extract of G. volkensii had the highest flavonols (51.40 mg QE/g), and the stems of C. glabrum had the highest tannin content (55.84 mg GAE/g). The quantities extracted varied depending on the plant part, species, and extraction method. Sonication yielded higher amounts of phenolics and tannins, whereas conventional shaking extracted more flavonols. The total flavonoid contents of C. glabrum extracts were not significantly different across both extraction methods, except for the sonicated leaf extract, which had the highest amount.

3.3. Evaluation of the Antioxidant Activity of the Extracts

3.3.1. Free Radical Scavenging Activity Assay

The plant extracts’ ability to scavenge free radicals was assessed using the DPPH free radical scavenging assay. When the antiradical activities of acetone extracts obtained via sonication and conventional methods were compared (Table 2), the antioxidant activity was found to vary across plant parts, species, and extraction methods. Notably, the stem extracts of C. glabrum and G. volkensii obtained through shaking showed high activity, with EC50 values of 22.84 µg/mL and 32.35 µg/mL, respectively. Meanwhile, the stem extracts of G. volkensii and C. glabrum obtained via sonication had EC50 values of 36.57 µg/mL and 55.97 µg/mL, respectively.

3.3.2. Hydrogen Peroxide Assay

The hydrogen peroxide assay was used to evaluate the reducing capacity of the extracts by measuring the reduction of hydrogen peroxide (H2O2) to water (H2O), as observed at 230 nm. The antioxidant activity of the extracts (Table 2) varied by plant part, species, and extraction method. The leaf extracts of C. glabrum obtained through sonication and shaking displayed notable activity, with EC50 values of 72.40 µg/mL and 131.39 µg/mL, respectively.

3.4. Antibacterial Activity Analysis

The antibacterial activity of the acetone extracts was quantified and expressed as minimum inhibitory concentration (MIC), minimum bactericidal concentration (MBC), and total activity (TA) values against selected bacterial pathogens, as summarised in Table 3. MIC is defined as the lowest concentration of the extract that inhibited bacterial growth. All extracts showed activity against Gram-negative and Gram-positive bacteria, except for the stem extracts of C. glabrum obtained through the shaking method. MIC values for active extracts ranged from 0.16 to 2.5 mg/mL, with the leaf extracts of C. glabrum and G. volkensii extracted by both shaking and sonication showing the best MIC value, 0.16 mg/mL, against E. coli, and the stem extract of G. volkensii (sonication) achieving the same MIC against S. aureus. Ampicillin and gentamicin were used as positive controls.
The MBC is defined as the lowest concentration at which no bacterial growth was observed. MBC values for active extracts ranged from 0.31 to 2.5 mg/mL, with the stem extract of G. volkensii obtained via sonication displaying notable activity against S. aureus with an MBC of 0.31 mg/mL.
The total activity (TA) results revealed that the leaf extracts of G. volkensii obtained via shaking and sonication had the highest total activities, with values of 575 mL/g and 500 mL/g against E. coli, respectively.

3.5. Combinational Studies

The fractional inhibitory concentration index (FICI) was used to assess the effect of combining the plant extracts with each other and with known antibiotics, ampicillin and gentamicin, against E. coli, P. aeruginosa, S. aureus, and S. pyogenes. Only the leaf extracts obtained via sonication were selected due to their notable activity. The interactions between the extracts and the antibiotics are recorded in Table 4. Remarkable activity was observed only against S. aureus, where a combination of G. volkensii leaf extract and gentamicin resulted in an additive interaction. All other combinations displayed antagonistic interactions.

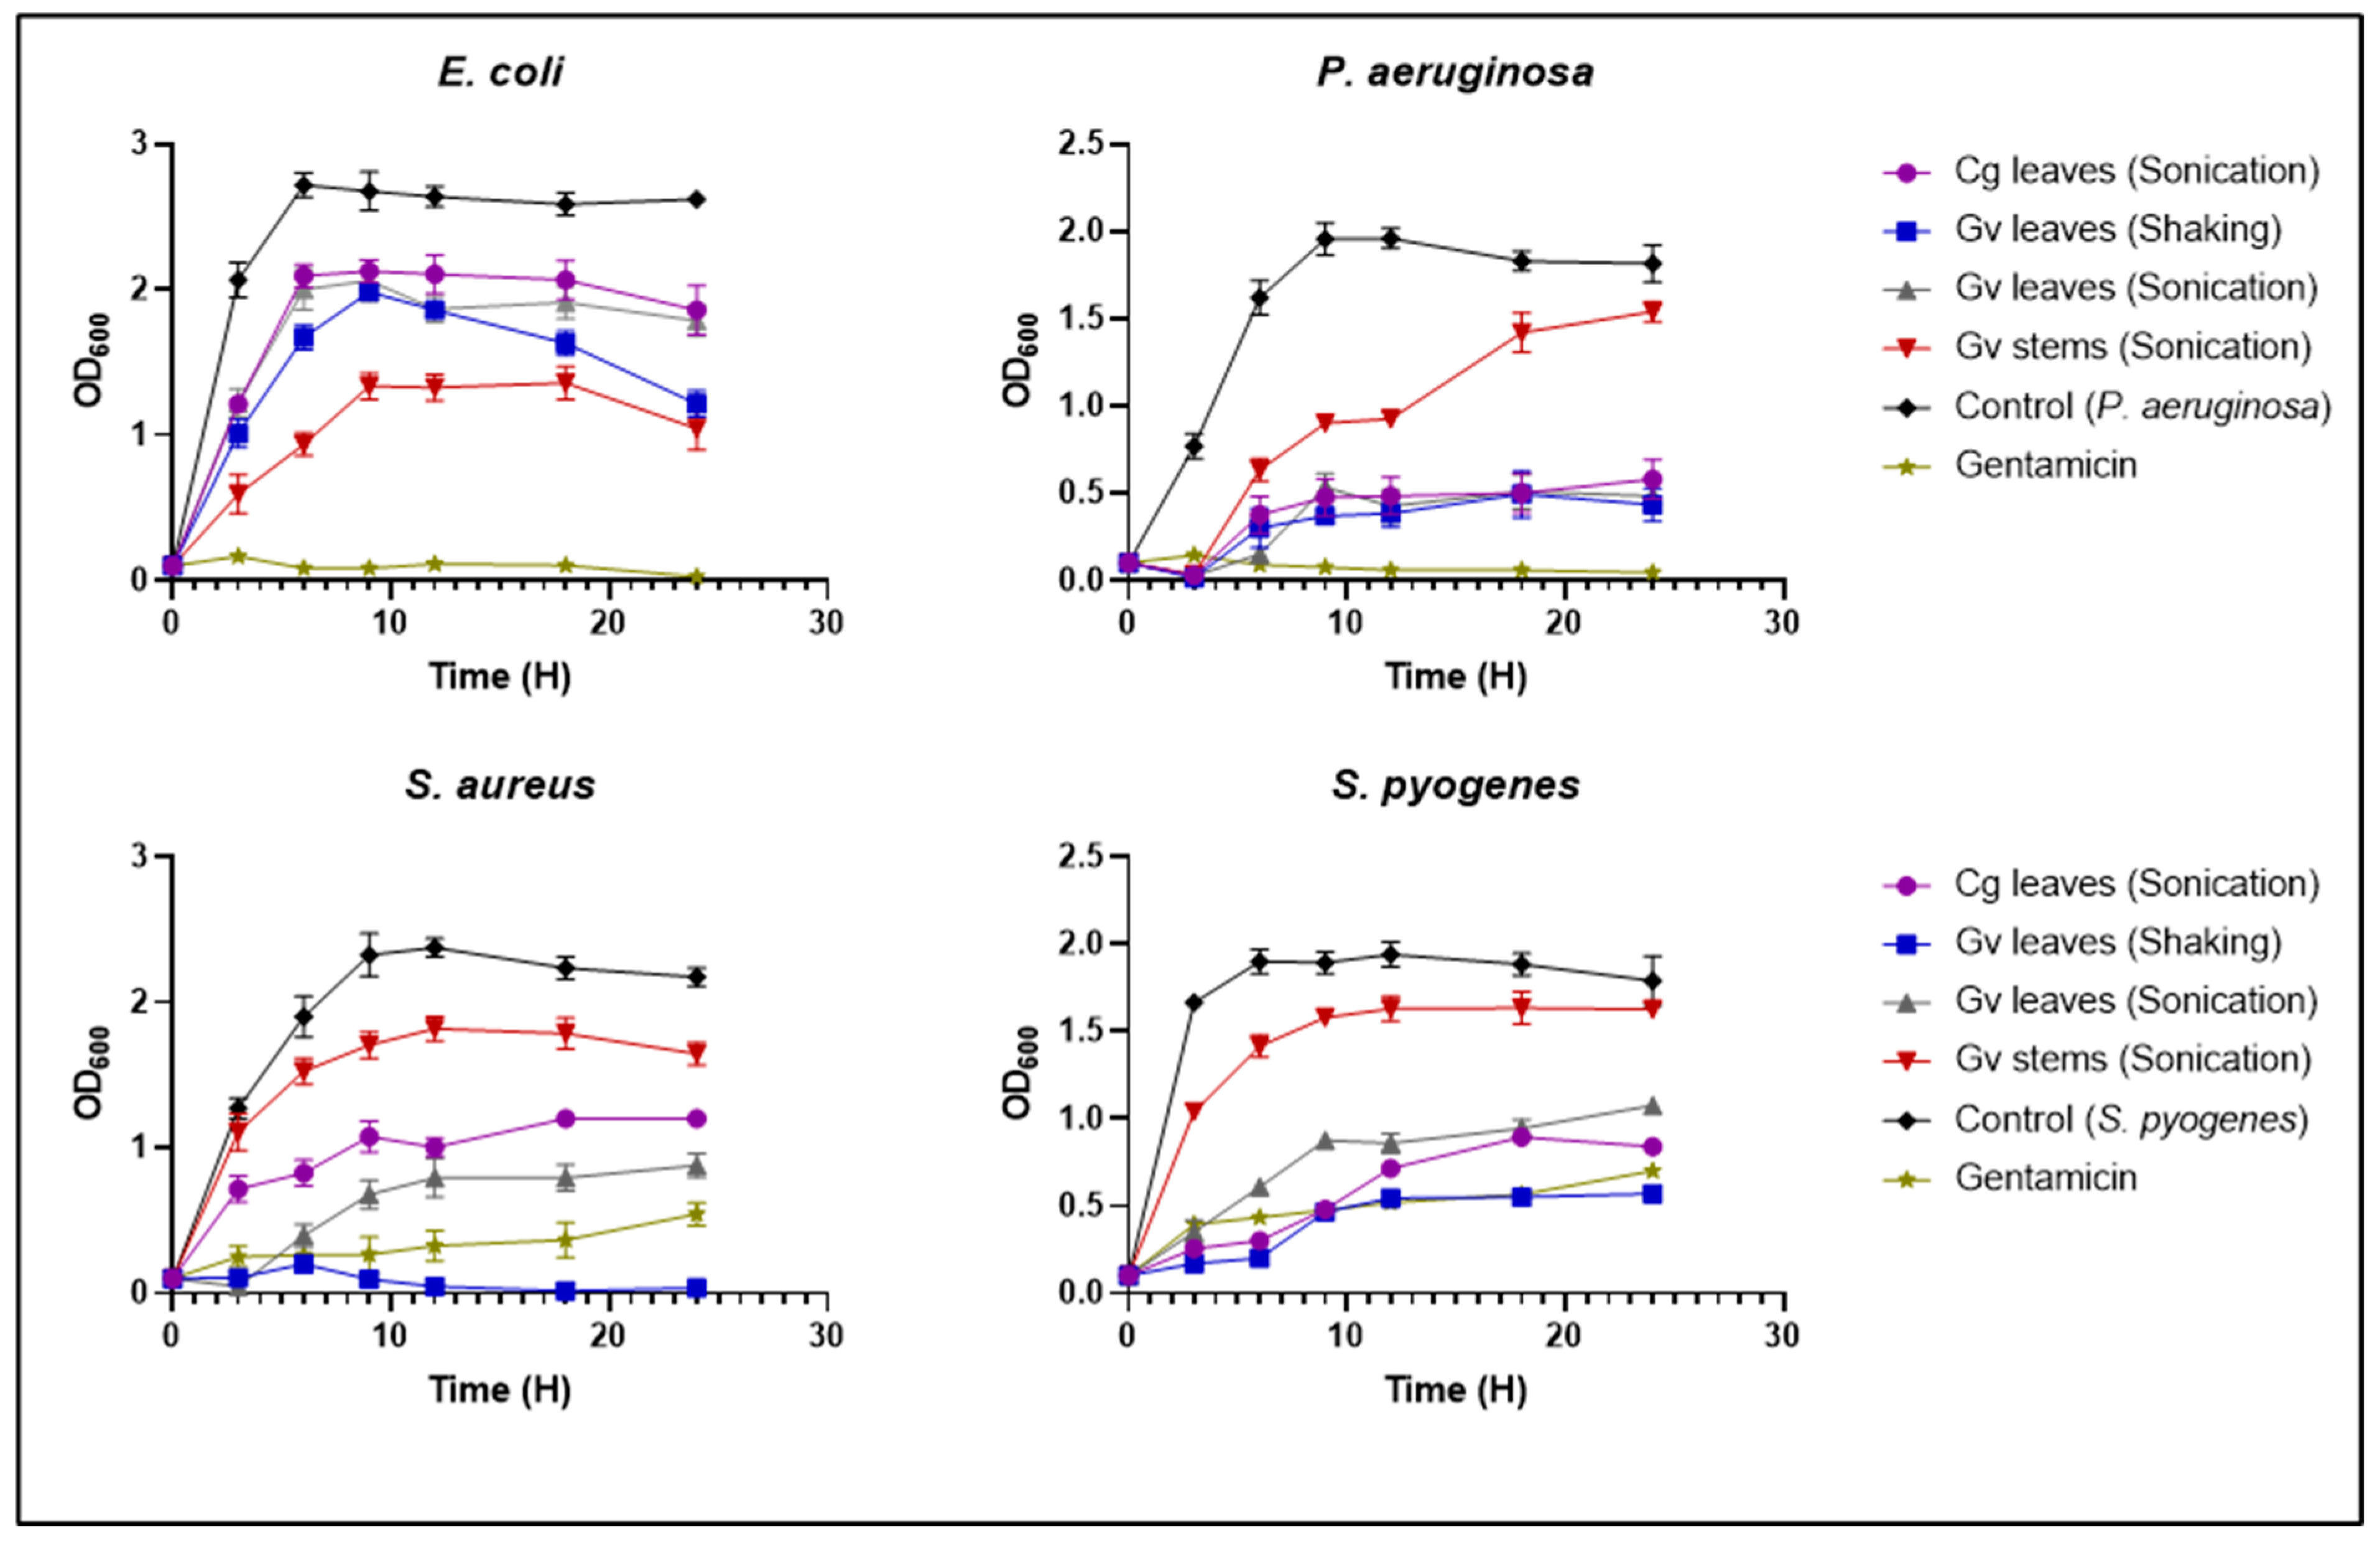
3.6. Growth Kinetics

The extracts’ effect on the test microorganisms’ growth was observed over 24 h (Figure 2). All extracts exhibited bacteriostatic activity against all tested microorganisms. Among them, the leaf extract of G. volkensii obtained through shaking demonstrated the strongest activity against S. aureus, surpassing even gentamicin in efficacy.

3.7. Anti-Virulence Activity Analysis

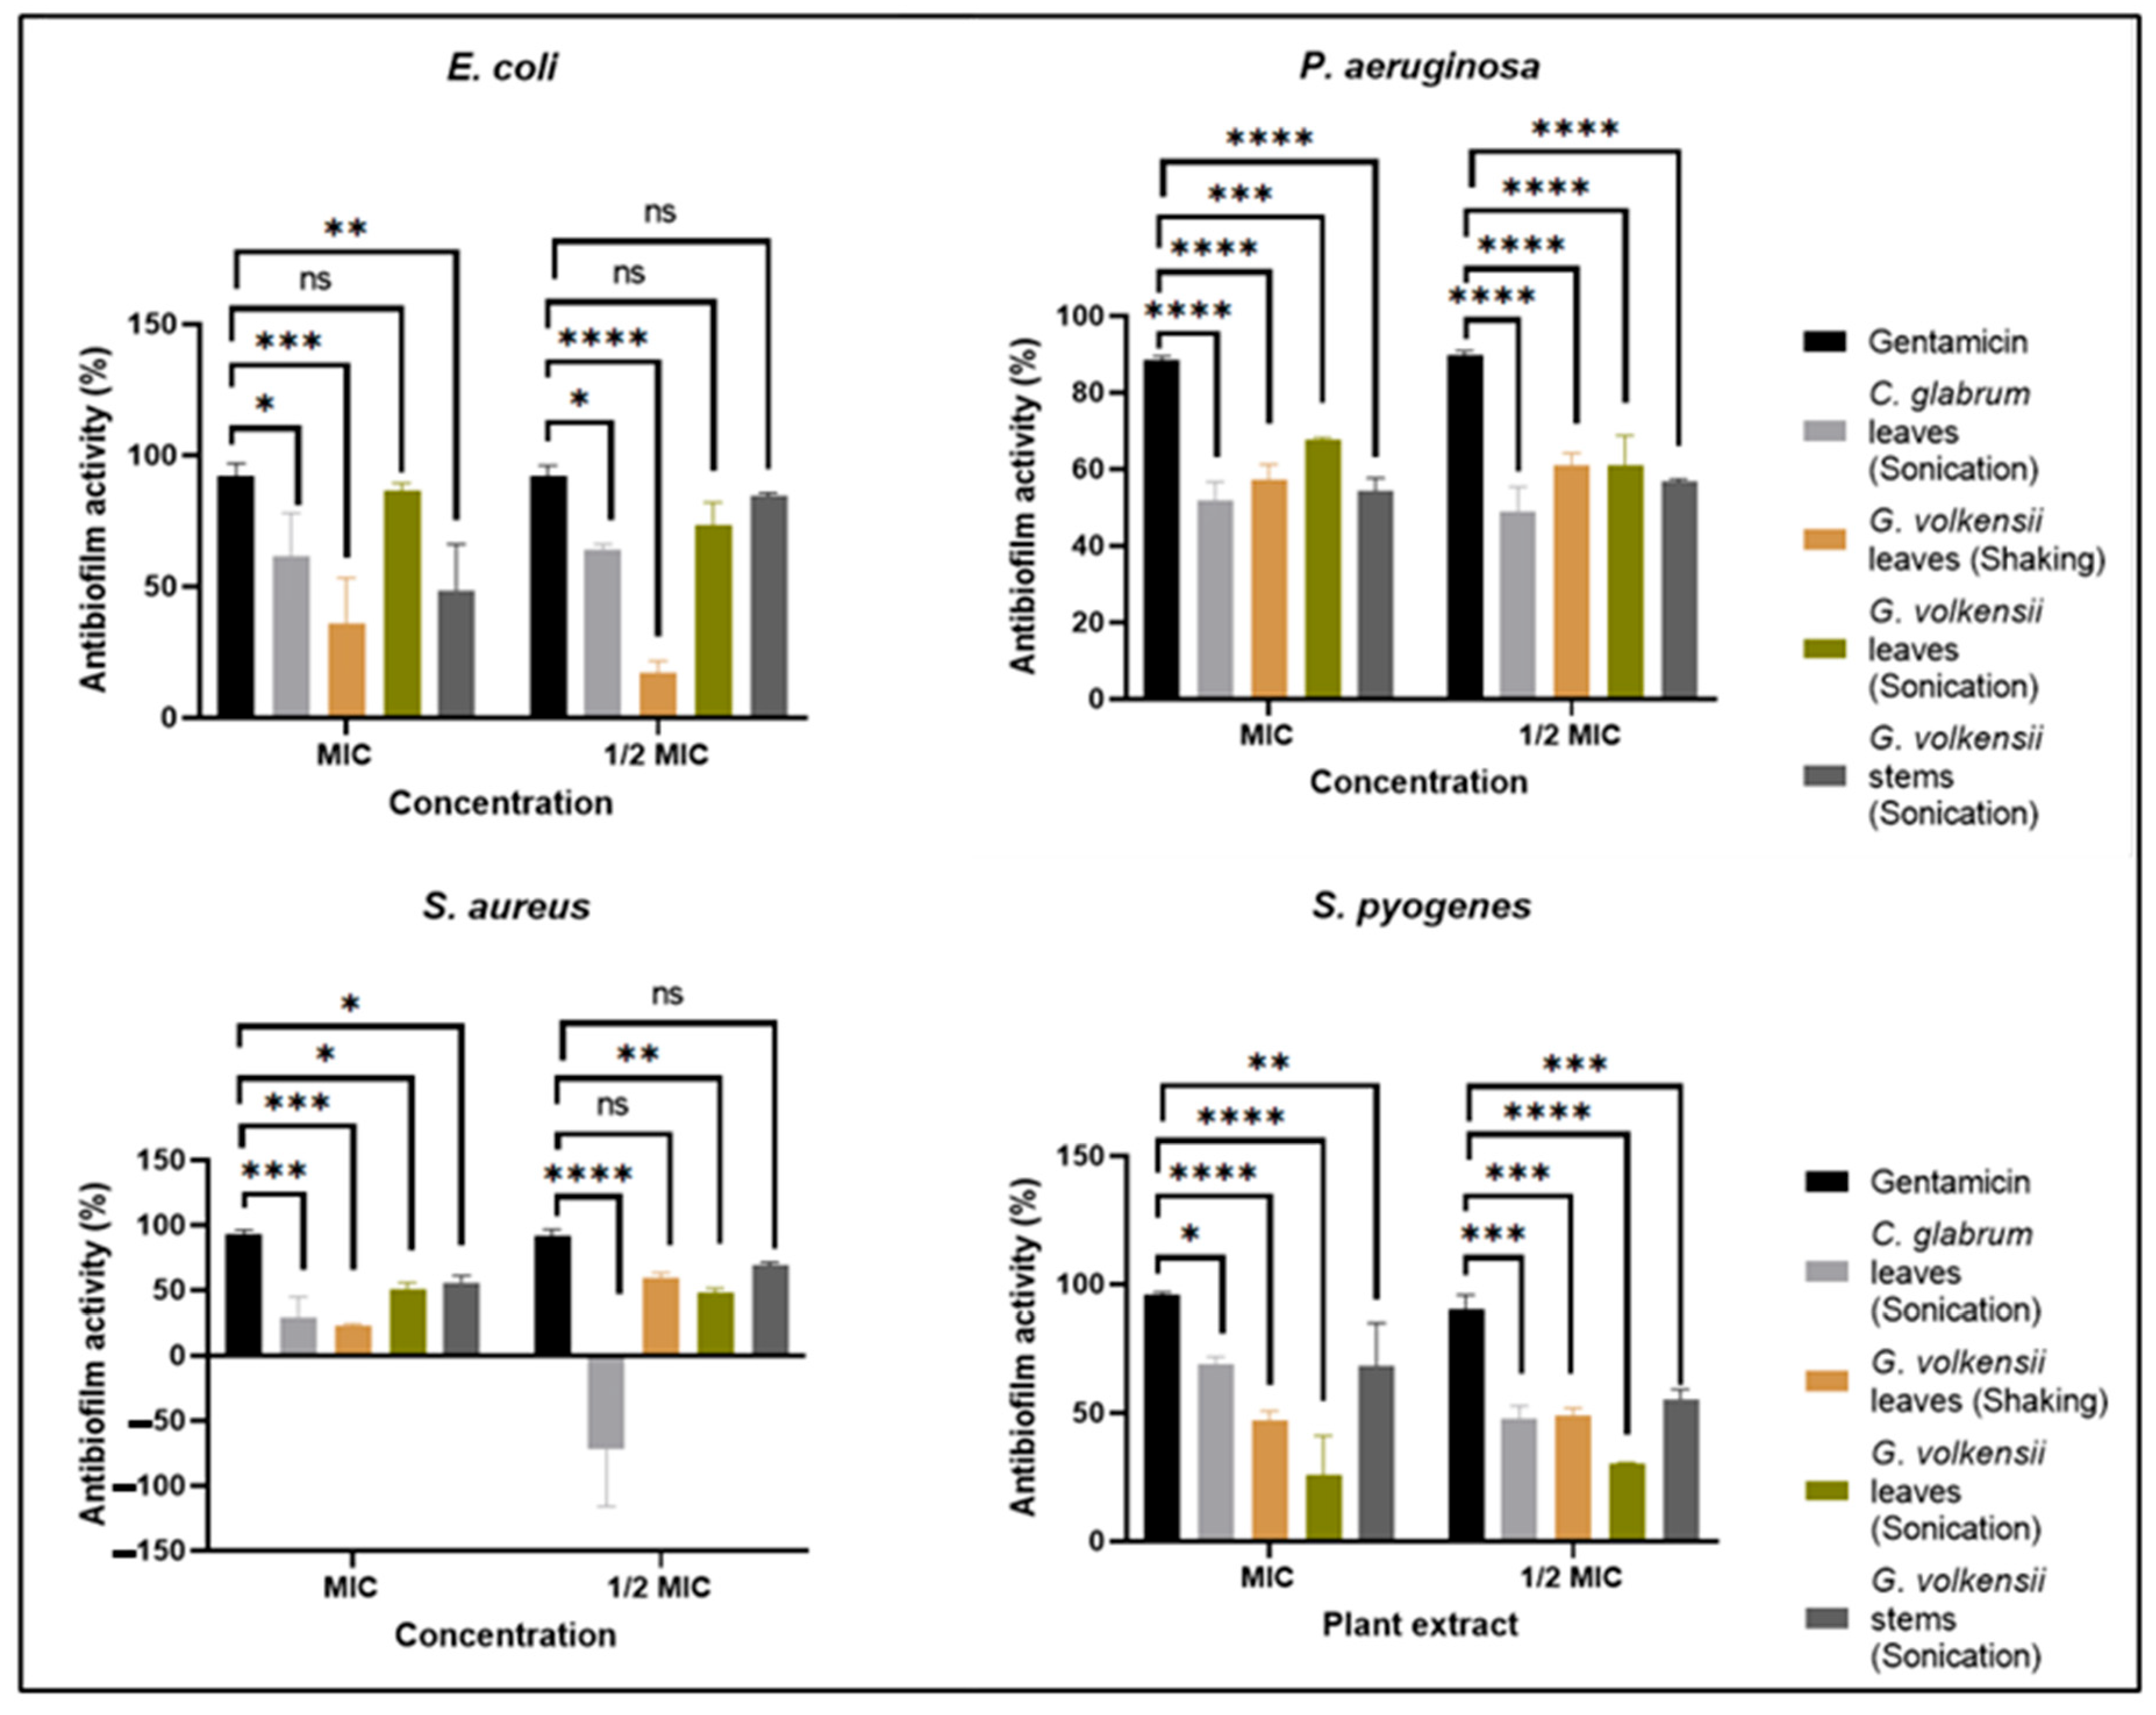
3.7.1. Antibiofilm Biomass Activity

Inhibition of Initial Cell Attachment of the Test Microorganisms

The ability of the acetone extracts to inhibit initial cell attachment, eradicate pre-existing biofilms, or prevent biofilm formation was evaluated using the crystal violet staining assay. Inhibition greater than 50% compared to the untreated control was considered notable. As shown in Figure 3, the acetone leaf extract of C. glabrum obtained through sonication effectively inhibited the initial attachment of E. coli at inhibitory concentration (MIC) and subinhibitory concentration (½ MIC). The positive control, gentamicin, exhibited noteworthy activity against E. coli, S. aureus, and S. pyogenes at both inhibitory and subinhibitory concentrations.

Inhibition of Biofilm Formation of the Test Microorganisms

All plant extracts, as well as the positive control, demonstrated notable activity, inhibiting biofilm formation in all tested microorganisms (Figure 4). However, the C. glabrum leaf extract (sonication) was ineffective against S. aureus, and both the shaken and sonicated leaf extracts of G. volkensii were ineffective against S. pyogenes, with the shaken extract also being ineffective against E. coli biofilm.

Eradication of Preformed Biofilms of the Test Microorganisms

In the eradication of preformed biofilms (Figure 5), P. aeruginosa biofilms were susceptible only to the positive control, gentamicin, at all tested concentrations.

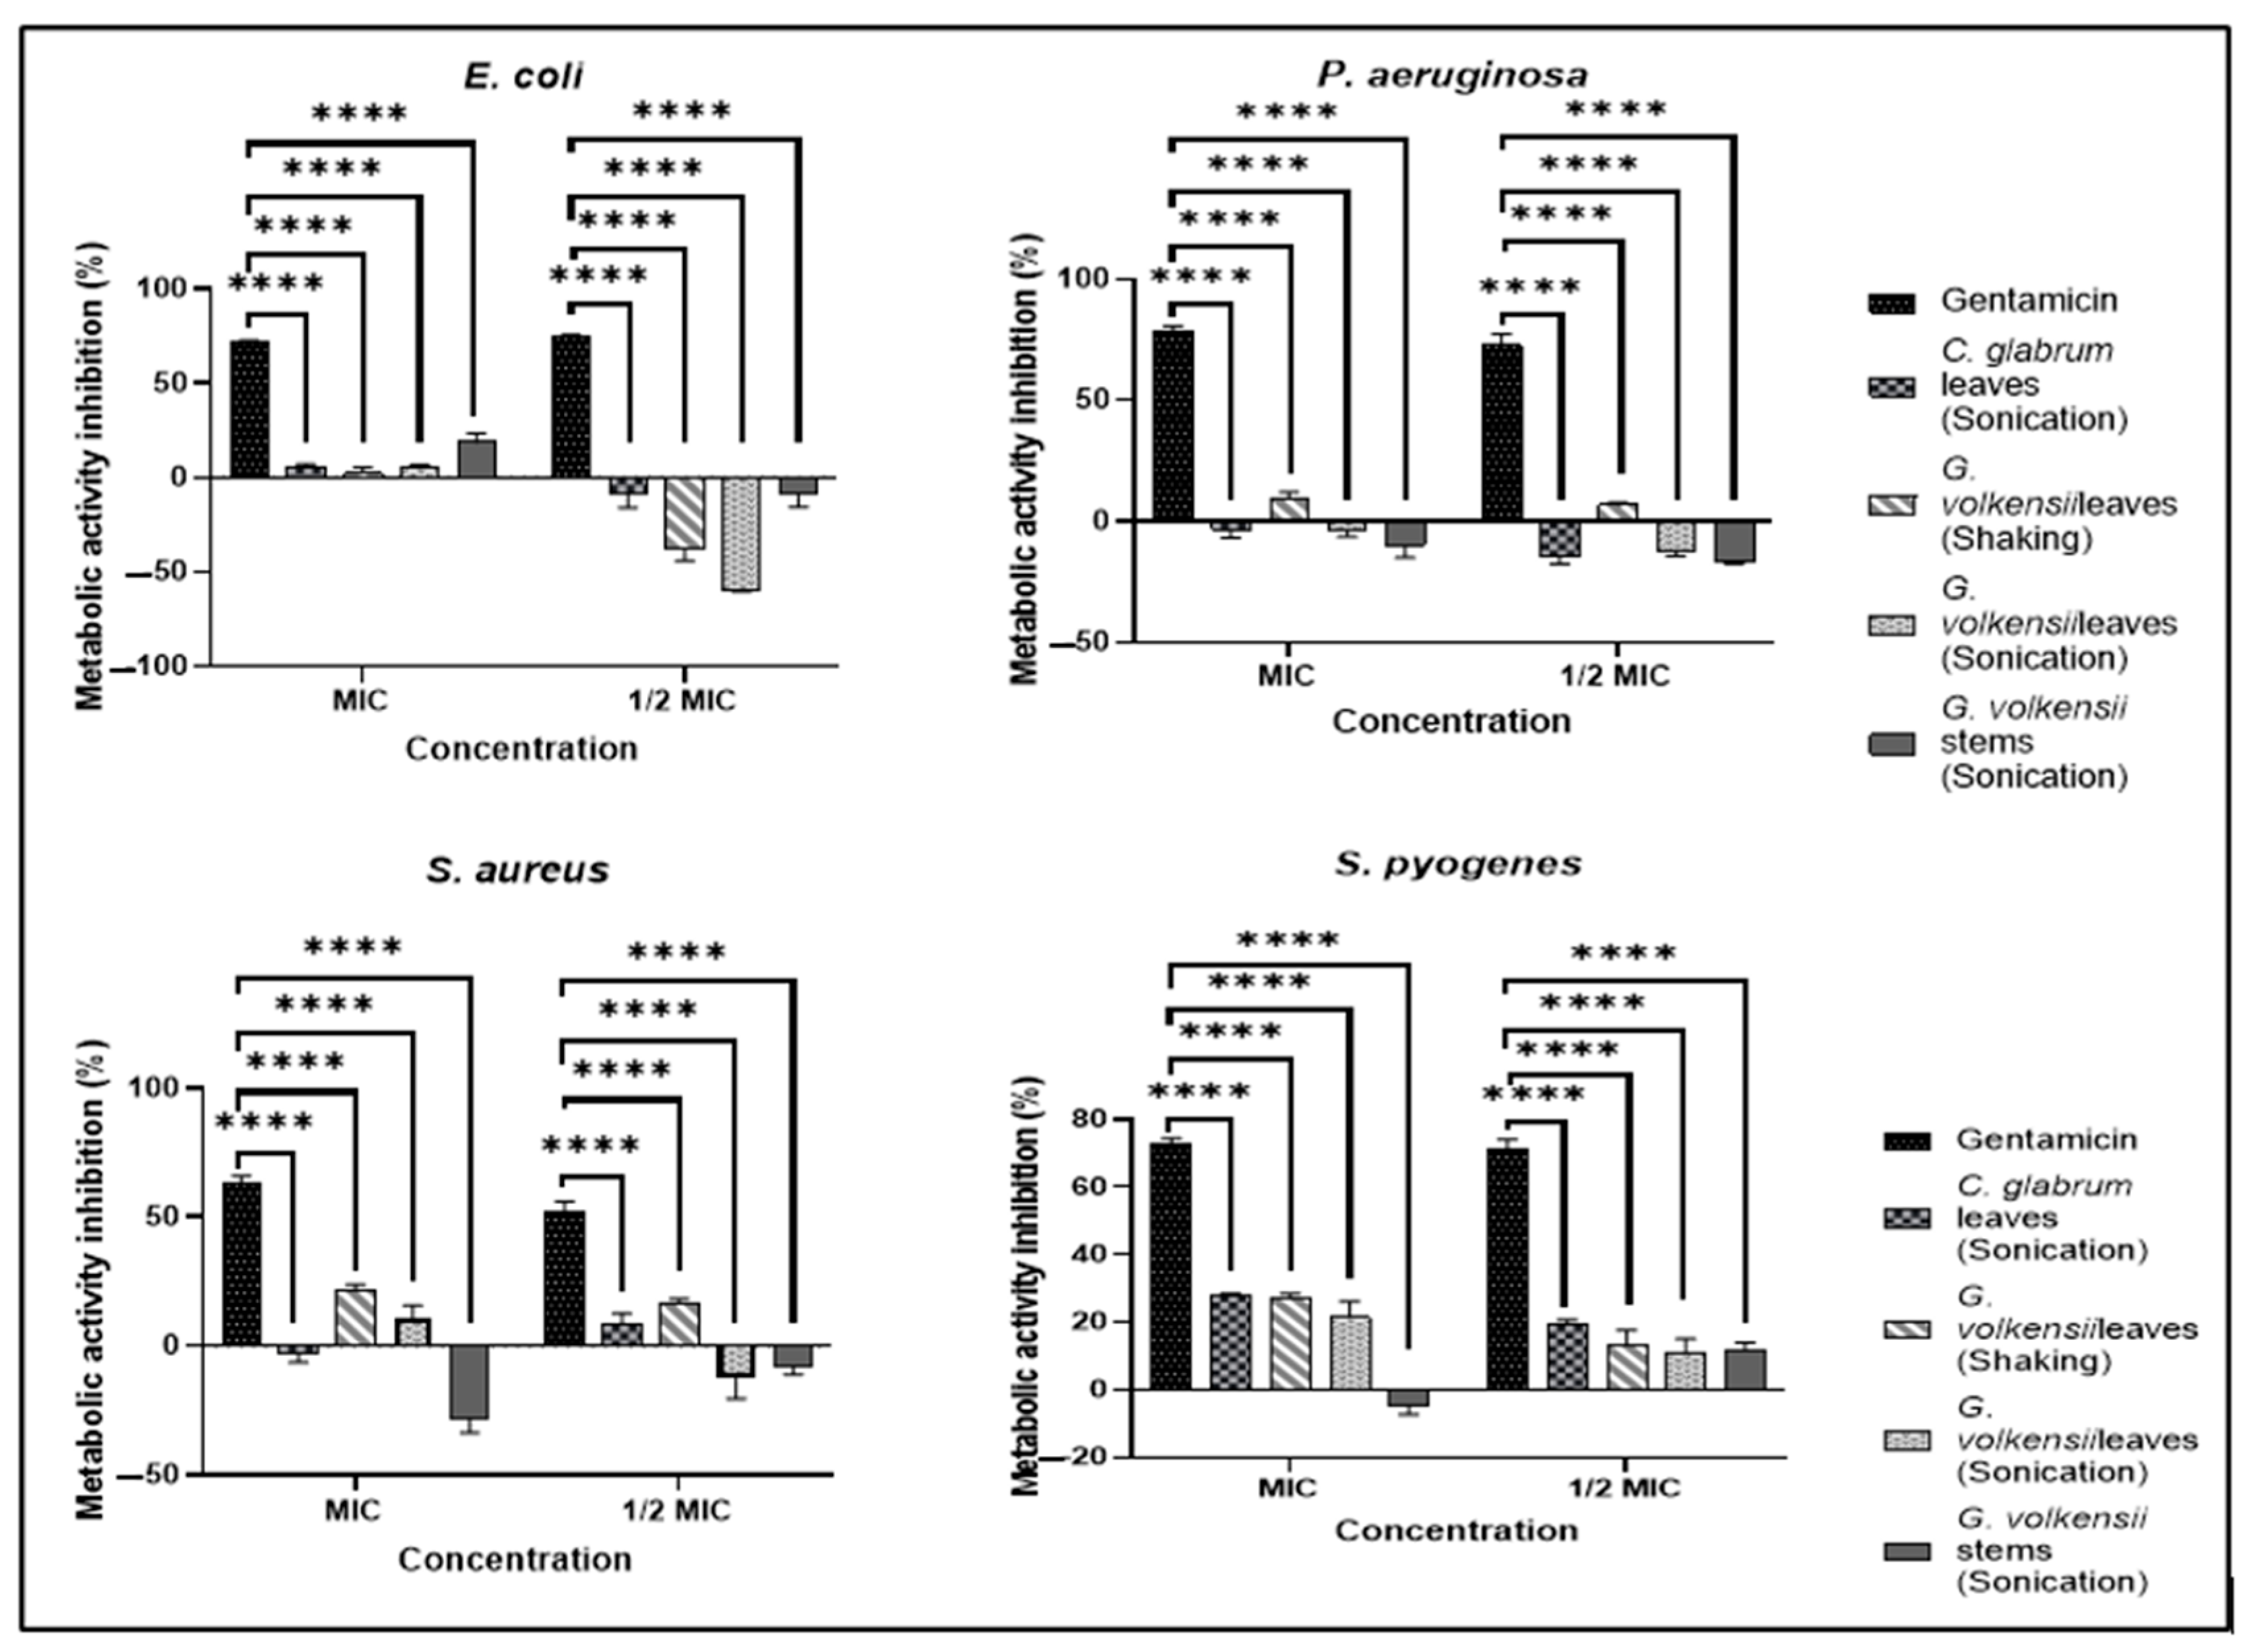
3.7.2. Metabolic Activity

The effect of the acetone extracts on the metabolic activity of the test microorganisms following the 24 h incubation period with the plant extracts was assessed, and the results are displayed in Figure 6. The findings revealed gentamicin significantly inhibited the metabolic activity of all the test microorganisms. The extracts did not have much effect on the metabolism of the microorganisms except for the leaf extract of G. volkensii obtained via sonication, which promoted the metabolism of E. coli by more than 50%.

3.7.3. Antimotility Activity

The inhibition of swarming motility by acetone plant extracts was evaluated against E. coli, P. aeruginosa, and S. aureus (Figure 7 and Table 5). The antimotility activity was determined in comparison to the control, which consisted of motility plates without plant extracts or antibiotics. At 100% MIC and 50% MIC, only the leaf extract of C. glabrum obtained via sonication showed a noteworthy motility inhibition of over 50% (50.09%) against P. aeruginosa at 100% MIC. The leaf extracts of C. glabrum and G. volkensii obtained via sonication, as well as the leaf extract of G. volkensii from shaking, promoted the swarming motility of S. aureus. The positive control, gentamicin, exhibited 100% motility inhibition against E. coli and S. aureus at 100% and 50% MIC. In contrast, gentamicin displayed significant motility inhibition (84.85%) against P. aeruginosa at 100% MIC but had negligible activity (12.66%) at 50% MIC.

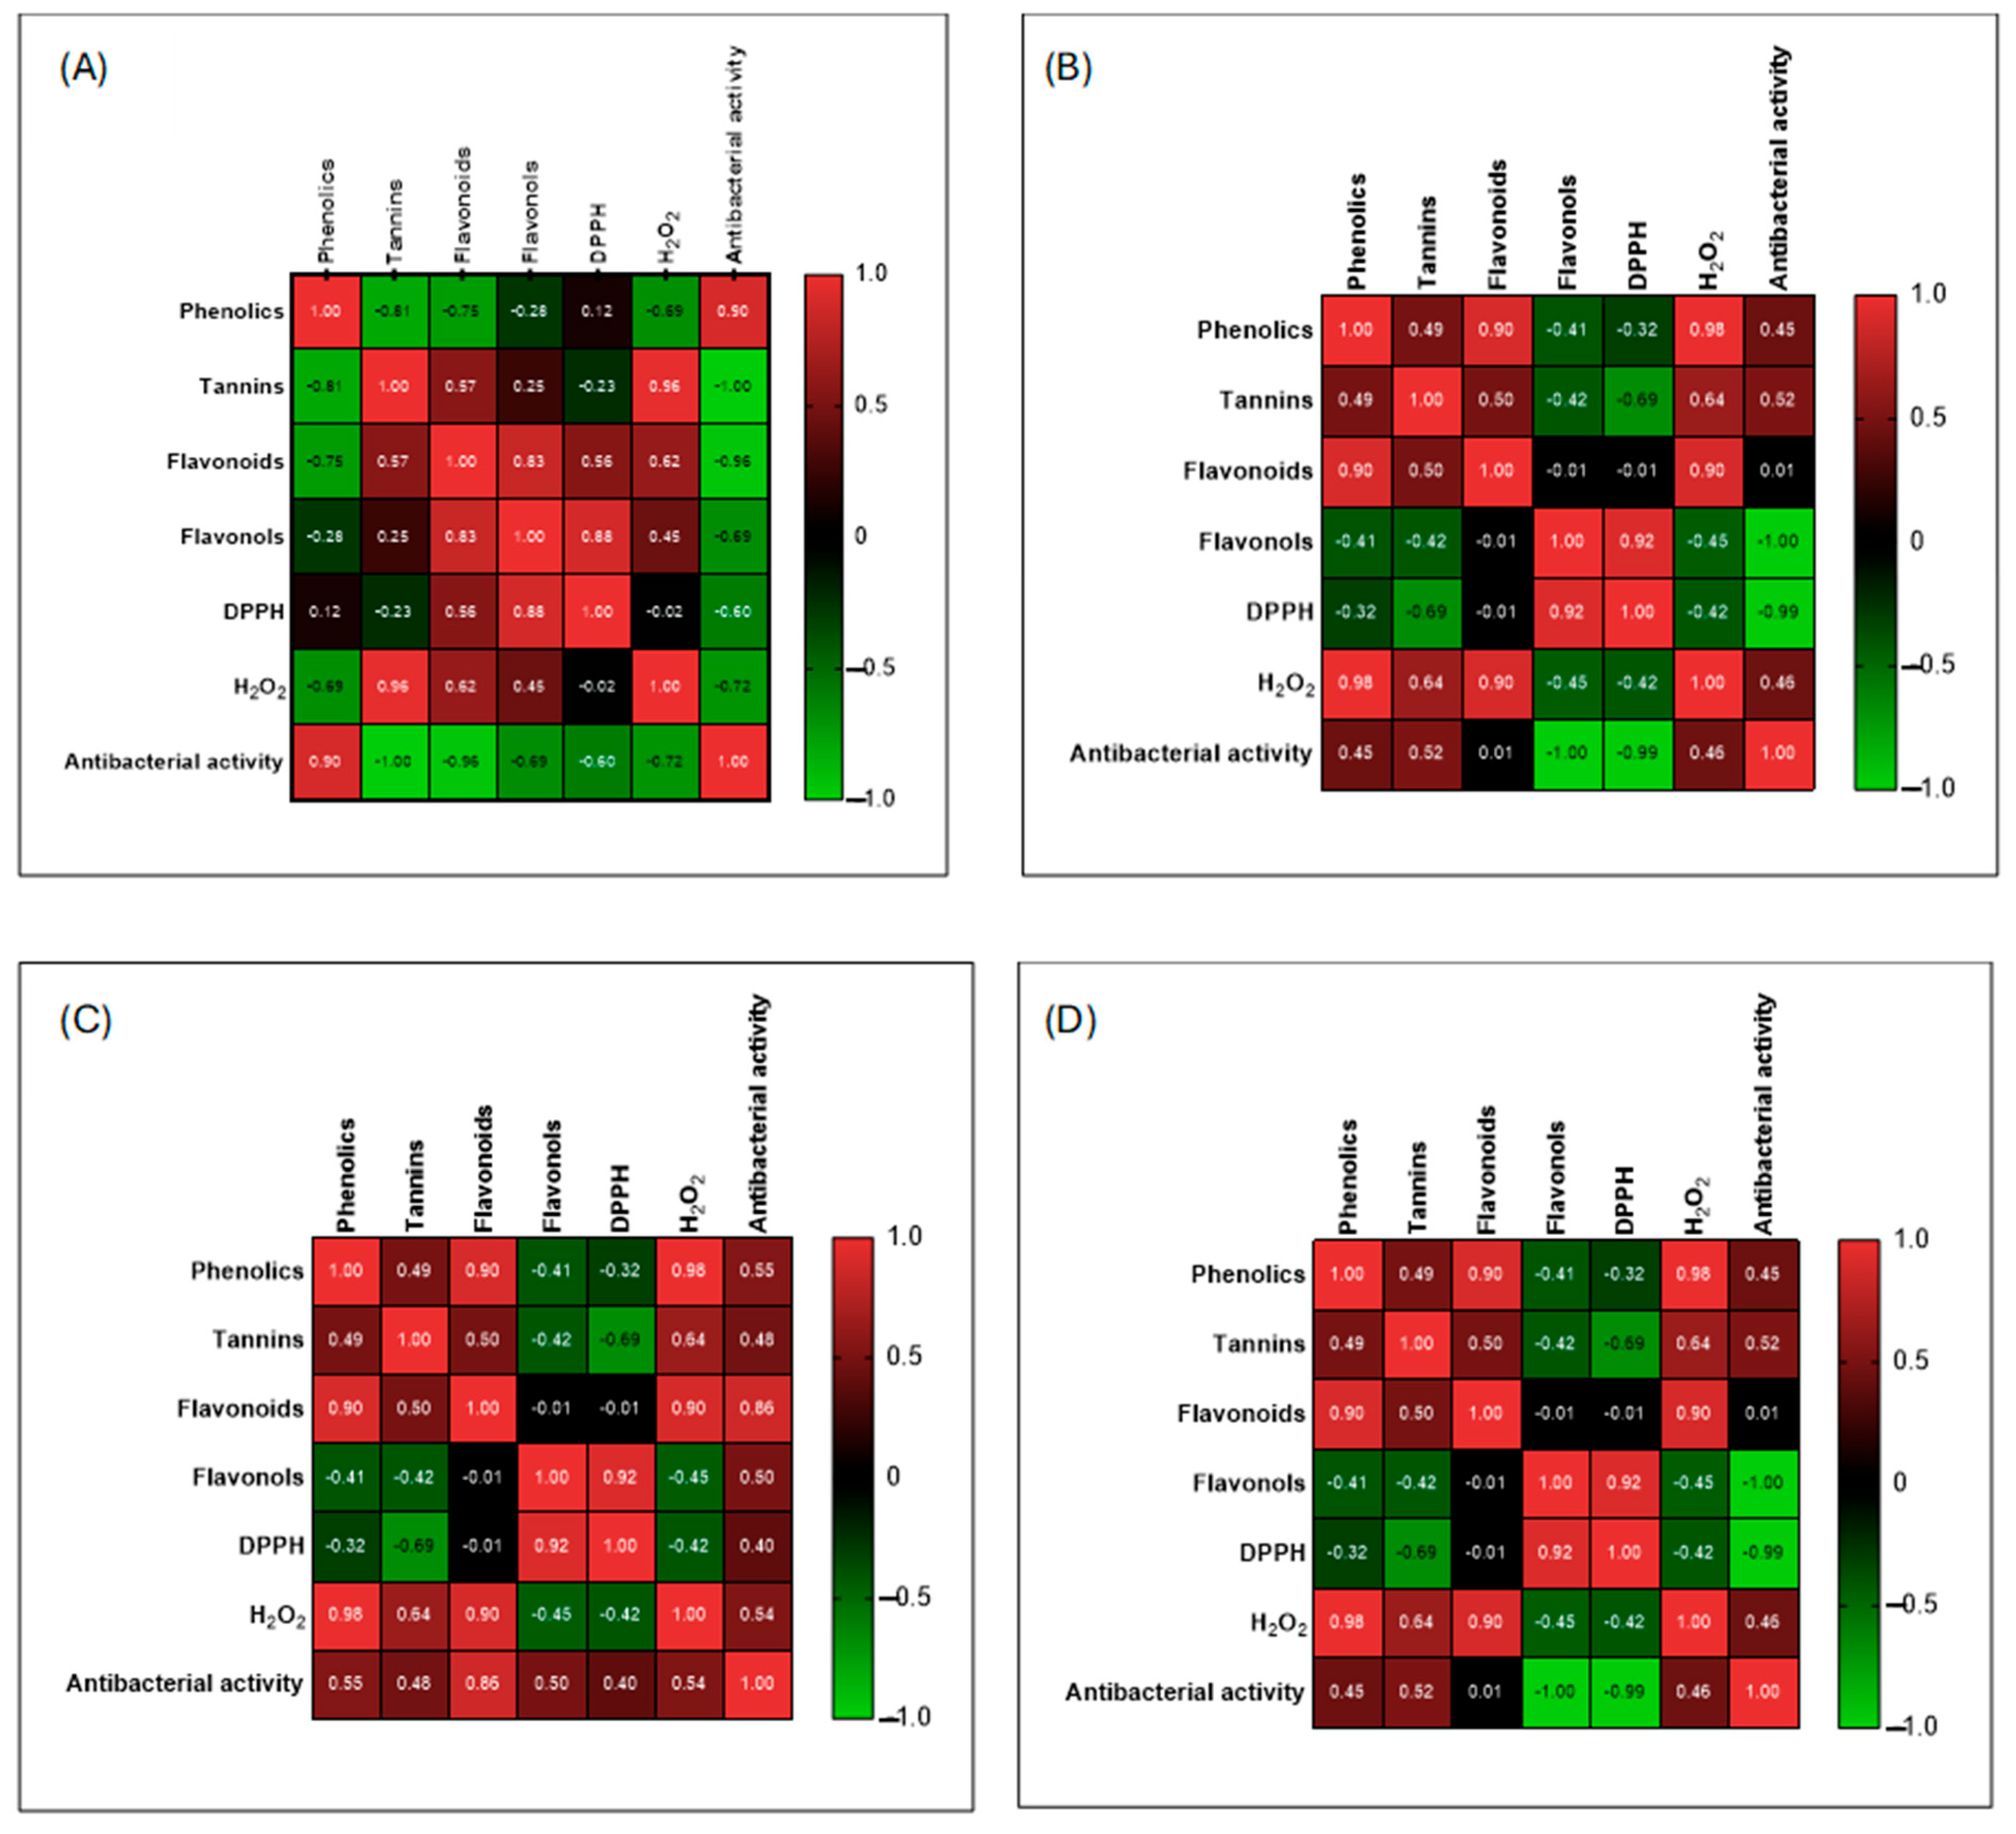
3.8. Pearson Correlation Between Phytochemicals and Biological Activities of the Plant Extracts

The flavonols from the shaken extracts had a significant (p = 0.001) perfect negative linear correlation (r = −1) with antibacterial activity against P. aeruginosa (Figure 8B). A perfect negative linear correlation (r = −1; p = 0.040) was also observed between tannins (obtained via shaking) and antibacterial activity against E. coli (Figure 8A). Furthermore, these tannins displayed a significant strong positive correlation (r = 0.96; p = 0.039) with hydrogen peroxide (H2O2) scavenging activity (Figure 8A). Similarly, the phenolics from the shaken extracts demonstrated a strong positive correlation (r = 0.98; p = 0.017) with the H2O2 antioxidant activity (Figure 8B–D). The flavonoids obtained via sonication had a strong positive correlation with both phenolics (r = 0.96; p = 0.038) and flavonols (r = 0.97; p = 0.028) from sonicated extracts (Figure 9A). Additionally, the phenolics from the sonicated extracts had a significant strong negative linear correlation (r = −0.96; p = 0.044) with the H2O2 activity (Figure 9A).

4. Discussion

Extraction is fundamental in natural product research, as it directly affects yield and bioactivity [23]. The present study compared conventional shaking, a method that uses large solvent volumes and is labour-intensive [34], with ultrasound-assisted extraction (UAE), which uses ultrasound to disrupt cell walls, enhancing solvent penetration and mass transfer [35,36]. Acetone was selected as the solvent due to its broad extraction capabilities, low toxicity, and ease of removal [7,37].
It was observed that sonication yielded a notable higher mass from C. glabrum leaves and stems compared to conventional shaking, whereas for G. volkensii, the opposite was true. This suggests that the optimal extraction method is species-specific. The enhanced mass yield from sonication in C. glabrum could be attributed to its ability to disrupt cell walls more effectively through cavitation, thereby releasing a greater quantity of cellular components. These results support previous reports suggesting that UAE increases extraction yield [35,38]. In contrast, the superior extraction yield achieved with conventional shaking in G. volkensii might indicate that its bioactive compounds are more readily accessible through a gentler agitation extraction process that may be more suitable for the delicate structures of the plant, which could be more prone to degradation under the harsher conditions of sonication.
Another important factor influencing extract yield is the choice of solvent. Solvents vary in polarity and tend to extract compounds with similar polarity [39]. Although acetone is considered an intermediate polar solvent capable of dissolving polar, moderately polar, and non-polar compounds, it is possible that certain phytochemicals present in the plant material were not efficiently extracted due to mismatched polarity. This may have contributed to variations in yield among different plant parts and species. Overall, these findings suggest that crude extract yields are influenced by multiple variables, including the specific plant part used, species differences, solvent polarity, and the extraction technique employed.
Polyphenols are known for their wide range of biological activities. Flavonoids and their subclass flavonols exhibit strong antioxidant, anti-inflammatory, anticancer, and antimicrobial effects [40,41]. Similarly, phenolic compounds and tannins are recognised for their antimicrobial, antioxidant, and anti-inflammatory properties [42,43]. Quantitative analysis of the polyphenols revealed that phenolics were the most abundant phytochemicals, particularly in the leaf extract of C. glabrum, followed by flavonols in the leaves of G. volkensii. Sonication yielded higher amounts of phenolics and tannins, while shaking was more effective for flavonols, suggesting that sonication may be optimal for extracting phenolics and tannins, while shaking is suitable for flavonols. Saifullah et al. [44] also found that UAE was efficient in extracting phenolics in comparison with conventional shaking. Notably, there was no significant differences between the flavonoid contents extracted by both methods, except for the lead extract of C. glabrum where sonication yielded a higher amount of the flavonoids, suggesting a species-specific extraction dynamic.
Antioxidant activity is a complex characteristic that encompasses various mechanisms involving the scavenging of free radicals or the reduction of harmful metal complexes. DPPH free radical scavenging and hydrogen peroxide assays were used to investigate the free radical scavenging ability and the reducing ability of the crude extracts, respectively. The DPPH assay results show that the stem extracts of both species (especially those obtained via shaking) as well as the sonicated leaf extract of C. glabrum had noteworthy antioxidant activity, with lower EC50 values suggesting greater efficacy. This greater efficacy likely stems from the quantified polyphenols. Both the shaken and sonicated leaf extracts of C. glabrum showed notable hydrogen peroxide scavenging activity, with the sonicated extract performing better. Although less effective than L-ascorbic acid, the leaf extract demonstrated strong antioxidant potential, likely due to its high levels of flavonoids, flavonols, phenolics, and tannins, consistent with reports on phenolic-rich extracts [45,46,47].
Importantly, correlation analyses revealed that phenolics obtained via sonication method showed a significant strong negative correlation with hydrogen peroxide scavenging activity, suggesting that when the quantity of phenolics increased, the EC50 value of antioxidant decreased, which is good because the lower the EC50 value, the better the activity. Tannins and phenolics from the shaking method showed a strong positive correlation with hydrogen peroxide scavenging activity, implying that higher concentrations of tannins ultimately led to antagonistic interactions. These results suggest that specific phytochemicals, particularly phenolics, play a more pronounced role in scavenging hydrogen peroxide than DPPH radicals, potentially due to antioxidant specificity, assay conditions, or antagonistic interactions within complex extracts [48,49]. This may be attributed to factors such as antioxidant specificity, experimental conditions [48], and the complexity of the plant extracts, which may lead to antagonism of antioxidant activity [49].
Given the rise of drug-resistant bacteria, identifying new antimicrobials is crucial. In this study, the antimicrobial activity of plant extracts was classified based on their minimum inhibitory concentration (MIC): potent (MIC < 0.1 mg/mL), moderate (0.1–0.625 mg/mL), and weak (MIC > 0.625 mg/mL) [2,50]. The active extracts had MIC values ranging from 0.16 to 2.5 mg/mL. Both the sonicated and shaken acetone extracts showed broad-spectrum antibacterial activity against all the tested bacterial pathogens, except for the shaken stem extract of C. glabrum, which showed no activity even at the highest concentration tested (2.5 mg/mL). This finding is consistent with the results of Matotoka et al. [20], who also reported moderate to low antimicrobial efficacy and broad-spectrum activity for this species against respiratory bacterial pathogens. Notably, the leaf extracts of C. glabrum and G. volkensii, obtained through both shaking and sonication, showed the lowest MIC, 0.16 mg/mL, against E. coli, while the sonicated stem extract of G. volkensii achieved the same MIC against S. aureus, indicating moderate antimicrobial activity.
The bactericidal and bacteriostatic effects of the plant extracts were further investigated. Notably, G. volkensii stem extracts obtained via sonication showed noteworthy bactericidal activity against S. aureus, with an MBC of 0.31 mg/mL, emphasising this plant part’s potential as an antibacterial source. Total activity measures how much a plant extract from 1 g of material can be diluted and still inhibit bacterial growth [51]. To compare antibacterial activity across plants, total activity should be considered alongside MIC and MBC. The total activity of the G. volkensii leaf extracts, obtained via shaking and sonication, was the highest at 575 mL/g and 500 mL/g against E. coli, indicating that extracts from 1 g of plant material remain effective against E. coli when diluted with 575 mL and 500 mL of acetone, respectively.
Growth curve kinetics were conducted to monitor bacterial growth dynamics over time. Only the extracts with noteworthy MIC values were selected. By plotting optical density or viable cell counts at regular intervals, the real-time effect of plant extracts, beyond static endpoint measurements like MIC, can be evaluated. The shaken leaf extract of G. volkensii displayed the best activity against S. aureus and S. pyogenes compared to the other extracts, and the positive control gentamicin highlights its potential as a natural source of antibacterial agents. Treatment of the planktonic bacteria with the extracts generally showed delayed growth and reduced replication rates. This implies that the plant extract might be present at a concentration that does not immediately kill all the bacteria but is high enough to initially hinder their growth. This could be due to the extract interfering with essential bacterial processes. However, over time, the surviving bacteria eventually seem to overcome the initial growth inhibition and resume a normal growth rate. The observed antibacterial activity of the extracts may be attributed to the quantified phytochemicals, like polyphenols, since they have been reported to have strong antibacterial activity [52,53]. Polyphenols have antioxidant, antimicrobial, and antiviral properties [54]. Moreover, antioxidants show antibacterial properties by inhibiting bacterial energy metabolism, disrupting membranes, and interrupting nucleic acid synthesis [55]. Correlation analysis showed that flavonols and tannins had strong negative linear correlations with MIC values for P. aeruginosa and E. coli, respectively, indicating that increasing these compounds improved extract potency.
Combination therapy involves using multiple active compounds to treat a disease [56]. In this study, sonicated leaf extracts were combined with each other and with antibiotics (ampicillin and gentamicin) to assess their effects. This approach can enhance treatment, broaden antibacterial activity, and reduce antibiotic resistance development, as pathogens are less likely to resist agents acting through different mechanisms [12,31].
Notable activity was observed only against S. aureus, where a combination of G. volkensii leaf extract and gentamicin resulted in an additive interaction. This implies that the leaf extract of G. volkensii might have compounds that may be administered with gentamicin and provide increased antibacterial effects. This aligns with the study by Phitaktim et al. [57], where a combination of β-lactams with the phytocompound α-mangostin enhanced the efficacy of β-lactam therapy in β-lactam-resistant bacterial strains. This also shows that phytocompounds may enhance the efficacy of conventional antibiotics. All other combinations displayed antagonistic interactions. The observed additive interaction may have occurred because S. aureus is a Gram-positive bacterium. Gram-positive bacteria have a thick, porous peptidoglycan layer, which allows better antibiotic penetration unlike Gram-negative bacteria, which have an outer membrane that hinders antibiotic penetration. Additionally, the sonicated leaf extract of G. volkensii had the highest amount of flavonols, which are a subclass of flavonoids; flavonoids, with their antioxidant activity, have been reported to enhance antibiotic efficacy and reverse antibiotic resistance in bacteria [58,59] by suppressing energy metabolism, cytoplasmic membrane function, and nucleic acid synthesis [60]. The antagonistic interactions observed between plant extracts and antibiotics could be due to interference in cytoplasmic membrane targeting, which is commonly observed in bioactive compounds from medicinal plants [61,62].
Virulence factors allow pathogens to attach to or penetrate host cells, evade or suppress immune responses, and secure nutrients through ecosystem manipulation [63]. The inhibition of biofilm formation is presented as a percentage of biofilm inhibition, with values less than 50% indicating low activity, while values greater than 50% demonstrate high activity against the bacteria. Negative values indicate an enhancement in biofilm [32].
The antibiofilm assessment revealed that the C. glabrum leaf extract obtained through sonication was highly effective in inhibiting the initial attachment of E. coli, achieving inhibition activity at all tested concentrations. The positive control, gentamicin, showed broad-spectrum activity, significantly inhibiting cell attachment in E. coli, S. aureus, and S. pyogenes. Biofilm formation enhances the pathogenicity and antibiotic resistance of respiratory pathogens [64,65]. In contrast, regarding the eradication of pre-existing biofilms, none of the plant extracts were effective against the biofilms formed by the tested microorganisms, whereas gentamicin showed high activity against P. aeruginosa. All extracts effectively prevented biofilm formation across the tested microorganisms. However, C. glabrum and G. volkensii extracts obtained via the sonication method showed limited effects against S. aureus and S. pyogenes, respectively. Additionally, the shaken leaf extract of G. volkensii displayed limited effects against E. coli biofilm. Overall, these results suggested that acetone leaf extracts of C. glabrum and G. volkensii obtained via sonication and the stem extract of G. volkensii obtained via sonication can be used to inhibit biofilm formation. Furthermore, the stem extract of G. volkensii (sonication) exhibited broad-spectrum antibiofilm activity against all test microorganisms, indicating promising potential for applications in addressing biofilm-related bacterial infections.
Metabolic adaptation is crucial for bacterial pathogenesis [66]; thus, this study also assessed the effects of the extracts on the metabolic activity of the test microorganisms. The results showed that gentamicin significantly suppressed the metabolic activity of all tested microorganisms, confirming its strong antibacterial effect. In contrast, the acetone extracts had minimal effect on microbial metabolism, suggesting limited antibacterial activity under the tested conditions. However, an exception was observed with the leaf extract of G. volkensii obtained via sonication, which enhanced the metabolism of E. coli by over 50%, as indicated by the negative value. This suggests that the extract may have enhanced E. coli metabolism, possibly due to the presence of bioavailable nutrients or compounds that stimulate bacterial growth. These findings highlight the differential effects of plant extracts on bacterial metabolism and emphasise the need for further investigations into the specific components responsible for these interactions.
Bacterial motility, driven by flagella systems, is also crucial for bacterial infection persistence. Swarming motility refers to bacterial movement across a solid surface [67]. In this study, the extracts also inhibited bacterial swarming motility, particularly for P. aeruginosa. The C. glabrum sonicated leaf extract showed 50.09% inhibition of P. aeruginosa motility at MIC, while gentamicin exhibited higher efficacy against E. coli and S. aureus (100% inhibition) and substantial, though variable, activity against P. aeruginosa (84.85% at MIC). However, S. aureus motility was unexpectedly enhanced by both C. glabrum and G. volkensii extracts, highlighting species-specific interactions. This anti-virulence assay reinforces the therapeutic potential of these plant extracts. The inhibition of key virulence traits such as motility and biofilm formation by C. glabrum and G. volkensii suggested that these plants could help prevent infection onset and persistence. However, their nuanced interactions with bacterial systems, such as the enhancement of E. coli metabolism or S. aureus swarming by certain extracts, reflect a biological complexity not typically seen with antibiotics. These findings indicate that such extracts, when carefully selected or used in combination with conventional antibiotics, could reduce the burden of biofilm-related infections and help mitigate antibiotic resistance.

5. Conclusions

This study assessed the phytochemical composition, antioxidant, antibacterial, and anti-virulence activities of C. glabrum and G. volkensii extracts, comparing sonication and shaking extraction methods. Phytochemical yields and bioactivity varied depending on the extraction method, plant part, and plant species. The extracts also showed notable antibacterial activity, particularly against E. coli and S. aureus, with favourable MIC values, highlighting their potential as natural antibacterial agents. In combination with antibiotics, the G. volkensii leaf extract showed an additive effect with gentamicin against S. aureus, suggesting synergy and highlighting the potential for plant compounds to enhance antibiotic efficacy. Anti-virulence testing further revealed that the extracts effectively inhibited biofilm formation and bacterial motility, especially against E. coli and P. aeruginosa. Notably, these effects were species-specific, with C. glabrum showing higher efficacy in inhibiting biofilm formation and P. aeruginosa motility. These findings suggested that a targeted approach based on plant species and extraction methods could improve treatment outcomes against biofilm-associated pathogens. Future research could further elucidate the individual compound profiles responsible for these effects and optimise extraction methods for targeted phytochemical recovery.

Author Contributions

Conceptualisation, P.M. and M.M.M.; methodology, N.S.; formal analysis, M.M.M.; investigation, N.S.; resources, P.M.; data curation, N.S.; writing—original draft preparation, N.S.; writing—review and editing, M.M.M.; supervision, P.M. and M.M.M. All authors have read and agreed to the published version of the manuscript.

Funding

This research was funded by the University of Limpopo (Grant: R624).

Institutional Review Board Statement

Not applicable.

Informed Consent Statement

Not applicable.

Data Availability Statement

The original contributions presented in this study are included in this article.

Acknowledgments

We would like to thank the University of Limpopo and the Antimicrobials and Phytomedicine Group (APMG).

Conflicts of Interest

The authors declare no conflicts of interest.

Abbreviations

ANOVAAnalysis of variance
ATCC American Type Culture Collection
DPPH2,2-Diphenyl-1-picrylhydrazyl
EC50Half maximal effective concentration
ESBLExtended-spectrum beta-lactamase
FICFractional inhibitory concentration
FICIFractional inhibitory concentration index
INTp-Iodonitrotetrazolium chloride
mg GAE/gMilligrams of gallic acid equivalents per gram of extract
mg QE/gMilligrams of quercetin equivalents per gram of extract
MICMinimum inhibitory concentration
MBCMinimum bactericidal concentration
NHLSNational Health Laboratory Service
OD600Optical density at 600 nanometres
TATotal activity

References

  1. Sionov, R.V.; Steinberg, D. Targeting the Holy Triangle of Quorum Sensing, Biofilm Formation, and Antibiotic Resistance in Pathogenic Bacteria. Microorganisms 2022, 10, 1239. [Google Scholar] [CrossRef] [PubMed]
  2. Famuyide, I.M.; Aro, A.O.; Fasina, F.O.; Eloff, J.N.; McGaw, L.J. Antibacterial and antibiofilm activity of acetone leaf extracts of nine under-investigated South African Eugenia and Syzygium (Myrtaceae) species and their selectivity indices. BMC Complement. Altern. Med. 2019, 19, 141. [Google Scholar] [CrossRef] [PubMed]
  3. Vivas, R.; Barbosa, A.A.T.; Dolabela, S.S.; Jain, S. Multidrug-Resistant Bacteria and Alternative Methods to Control Them: An Overview. Microb. Drug Resist. 2019, 25, 890–908. [Google Scholar] [CrossRef] [PubMed]
  4. Uruén, C.; Chopo-Escuin, G.; Tommassen, J.; Mainar-Jaime, R.C.; Arenas, J. Biofilms as Promoters of Bacterial Antibiotic Resistance and Tolerance. Antibiotics 2020, 10, 3. [Google Scholar] [CrossRef]
  5. National Department of Health (South Africa). Surveillance for Antimicrobial Resistance and Consumption of Antibiotics in South Africa 2018–2022; South African AMR Surveillance Report; National Department of Health: Pretoria, South Africa, 2024. [Google Scholar]
  6. Bhandari, S.; Khadayat, K.; Poudel, S.; Shrestha, S.; Shrestha, R.; Devkota, P.; Khanal, S.; Marasini, B.P. Phytochemical analysis of medicinal plants of Nepal and their antibacterial and antibiofilm activities against uropathogenic Escherichia coli. BMC Complement. Med. Ther. 2021, 21, 116. [Google Scholar] [CrossRef]
  7. Uc-Cachón, A.H.; Dzul-Beh, A.; Palma-Pech, G.; Jiménez-Delgadillo, B.; Flores-Guido, J.S.; Gracida-Osorno, C.; Molina-Salinas, G.M. Antibacterial and antibiofilm activities of Mayan medicinal plants against Methicillin-susceptible and -resistant strains of Staphylococcus aureus. J. Ethnopharmacol. 2021, 279, 114369. [Google Scholar] [CrossRef]
  8. Adeyemo, R.O.; Famuyide, I.M.; Dzoyem, J.P.; McGaw, L.J. Anti-Biofilm, Antibacterial, and Anti-Quorum Sensing Activities of Selected South African Plants Traditionally Used to Treat Diarrhoea. Evid. Based Complement. Altern. Med. 2022, 2022, 1307801. [Google Scholar] [CrossRef]
  9. Vestby, L.K.; Grønseth, T.; Simm, R.; Nesse, L.L. Bacterial Biofilm and its Role in the Pathogenesis of Disease. Antibiotics 2020, 9, 59. [Google Scholar] [CrossRef]
  10. Salmerón-Manzano, E.; Garrido-Cardenas, J.A.; Manzano-Agugliaro, F. Worldwide Research Trends on Medicinal Plants. Int. J. Environ. Res. Public Health 2020, 17, 3376. [Google Scholar] [CrossRef]
  11. Kebede, T.; Gadisa, E.; Tufa, A. Antimicrobial activities evaluation and phytochemical screening of some selected medicinal plants: A possible alternative in the treatment of multidrug-resistant microbes. PLoS ONE 2021, 16, e0249253. [Google Scholar] [CrossRef]
  12. Vaou, N.; Stavropoulou, E.; Voidarou, C.; Tsigalou, C.; Bezirtzoglou, E. Towards Advances in Medicinal Plant Antimicrobial Activity: A Review Study on Challenges and Future Perspectives. Microorganisms 2021, 9, 2041. [Google Scholar] [CrossRef] [PubMed]
  13. Manandhar, S.; Luitel, S.; Dahal, R.K. In Vitro Antimicrobial Activity of Some Medicinal Plants against Human Pathogenic Bacteria. J. Trop. Med. 2019, 2019, 1895340. [Google Scholar] [CrossRef] [PubMed]
  14. Calixto, J.B. The role of natural products in modern drug discovery. An. Acad. Bras. Cienc. 2019, 91, e20190105. [Google Scholar] [CrossRef] [PubMed]
  15. Raja, R.R. Medicinally Potential Plants of Labiatae (Lamiaceae) Family: An Overview. Res. J. Med. Plant 2012, 6, 203–213. [Google Scholar] [CrossRef]
  16. Teclegeorgish, Z.W.; Mokgalaka, N.S.; Vukea, N.; de la Mare, J.; Tembu, V.J. Cytotoxicity of triterpenoids from Clerodendrum glabrum against triple-negative breast cancer cells in vitro. S. Afr. J. Bot. 2020, 133, 144–150. [Google Scholar] [CrossRef]
  17. Ogundajo, A.L.; Ashafa, A.O.T. Medicinal properties of Clerodendrum glabrum leaf extracts: Phytochemical constituents, antioxidant, cytotoxicity, and carbohydrate-metabolizing enzyme inhibitory potentials. Comp. Clin. Pathol. 2019, 28, 927–936. [Google Scholar] [CrossRef]
  18. Maroyi, A. Gardenia volkensii K. Schum. (Rubiaceae): Review of Medicinal Uses, Phytochemistry, and Biological Activities. J. Pharm. Nutr. Sci. 2020, 10, 175–181. [Google Scholar] [CrossRef]
  19. Kinuthia, E.W.; Langat, M.K.; Mwangi, E.M.; Cheplogoi, P.K. Constituents of Kenyan Gardenia volkensii. Nat. Prod. Commun. 2012, 7, 13–14. [Google Scholar] [CrossRef]
  20. Matotoka, M.M.; Mashabela, G.T.; Masoko, P. Phytochemical content, antibacterial activity, and antioxidant, anti-inflammatory, and cytotoxic effects of traditional medicinal plants against respiratory tract bacterial pathogens. Evid. Based Complement. Altern. Med. 2023, 2023, 1243438. [Google Scholar] [CrossRef]
  21. Mnisi, T.J.; Matotoka, M.M.; Masoko, P. Antioxidant, antibacterial, and anti-biofilm activities of selected indigenous plant species against nosocomial bacterial pathogens. Lett. Appl. Microbiol. 2024, 77, ovae080. [Google Scholar] [CrossRef]
  22. Wanjiru, K.E. Screening for Antimicrobial Compounds in Gardenia volkensii and Meyna tetraphylla (Rubiaceae). Afribary. Published 17 May 2021. Available online: https://afribary.com/works/screening-for-antimicrobial-compounds-in-gardenia-volkensii-and-meyna-tetraphylla-rubiaceae (accessed on 1 June 2025).
  23. Bitwell, C.; Indra, S.S.; Luke, C.; Kakoma, M.K. A review of modern and conventional extraction techniques and their applications for extracting phytochemicals from plants. Sci. Afr. 2023, 19, e01585. [Google Scholar] [CrossRef]
  24. Tambe, V.D.; Bhambar, R.S. Estimation of total phenol, tannin, alkaloid and flavonoid in Hibiscus tiliaceus Linn. wood extracts. Res. Rev. J. Pharmacogn. Phytochem. 2014, 2, 41–47. [Google Scholar]
  25. Madjid, A.; Amoussa, O.; Sanni, A.; Lagnika, L. Antioxidant activity and total phenolic, flavonoid and flavonol contents of the bark extracts of Acacia ataxacantha. J. Pharmacogn. 2015, 4, 172–178. [Google Scholar]
  26. Chigayo, K.; Mojapelo, P.E.L.; Mnyakeni-Moleele, S.; Misihairabgwi, J.M. Phytochemical and antioxidant properties of different solvent extracts of Kirkia wilmsii tubers. Asian Pac. J. Trop. Biomed. 2016, 6, 1037–1043. [Google Scholar] [CrossRef]
  27. Jayaprakasha, G.K.; Jaganmohan Rao, L.; Sakariah, K.K. Antioxidant activities of flavidin in different in vitro model systems. Bioorg Med. Chem. 2004, 12, 5141–5146. [Google Scholar] [CrossRef]
  28. Eloff, J.N. A Sensitive and Quick Microplate Method to Determine the Minimal Inhibitory Concentration of Plant Extracts for Bacteria. Planta Med. 1998, 64, 711–713. [Google Scholar] [CrossRef]
  29. Senhaji, S.; Lamchouri, F.; Toufik, H. Phytochemical content, antibacterial and antioxidant potential of Anabasis aretioïdes (Chenopodiaceae). Biomed. Res. Int. 2020, 2020, 6152932. [Google Scholar] [CrossRef]
  30. Jiang, T.; He, L.; Zhan, Y.; Zang, S.; Ma, Y.; Zhao, X.; Zhang, C.; Xin, Y. The effect of MSMEG_6402 gene disruption on the cell wall structure of Mycobacterium smegmatis. Microb. Pathog. 2011, 51, 156–160. [Google Scholar] [CrossRef]
  31. van Vuuren, S.; Viljoen, A. Plant-based antimicrobial studies—Methods and approaches to study the interaction between natural products. Planta Med. 2011, 77, 1168–1182. [Google Scholar] [CrossRef]
  32. Sandasi, M.; Leonard, C.M.; Viljoen, A.M. The effect of five common essential oil components on Listeria monocytogenes biofilms. Food Control. 2008, 19, 1070–1075. [Google Scholar] [CrossRef]
  33. Caigoy, J.C.; Xedzro, C.; Kusalaruk, W.; Nakano, H. Antibacterial, antibiofilm, and antimotility signatures of some natural antimicrobials against Vibrio cholerae. FEMS Microbiol. Lett. 2022, 369, fnac076. [Google Scholar] [CrossRef] [PubMed]
  34. Alara, O.R.; Abdurahman, N.H.; Ukaegbu, C.I. Soxhlet extraction of phenolic compounds from Vernonia cinerea leaves and its antioxidant activity. J. Appl. Res. Med. Aromat. Plants 2018, 11, 12–17. [Google Scholar] [CrossRef]
  35. Rutkowska, M.; Namieśnik, J.; Konieczka, P. Ultrasound-Assisted Extraction. In The Application of Green Solvents in Separation Processes; Pena-Pereira, F., Tobiszewski, M., Eds.; Elsevier: Amsterdam, The Netherlands, 2017; pp. 301–324. [Google Scholar] [CrossRef]
  36. Osorio-Tobón, J.F. Recent advances and comparisons of conventional and alternative extraction techniques of phenolic compounds. J. Food Sci. Technol. 2020, 57, 4299–4315. [Google Scholar] [CrossRef] [PubMed]
  37. Shekwa, W.; Maliehe, T.S.; Masoko, P. Antimicrobial, antioxidant, and cytotoxic activities of the leaf and stem extracts of Carissa bispinosa used for dental healthcare. BMC Complement. Med. Ther. 2023, 23, 462. [Google Scholar] [CrossRef] [PubMed]
  38. Ameer, K.; Shahbaz, H.M.; Kwon, J. Green Extraction Methods for Polyphenols from Plant Matrices and Their Byproducts: A Review. Compr. Rev. Food Sci. Food Saf. 2017, 16, 295–315. [Google Scholar] [CrossRef]
  39. Nawaz, H.; Shad, M.A.; Rehman, N.; Andaleeb, H.; Ullah, N. Effect of solvent polarity on extraction yield and antioxidant properties of phytochemicals from bean (Phaseolus vulgaris) seeds. Braz. J. Pharm. Sci. 2020, 56, e17129. [Google Scholar] [CrossRef]
  40. Dias, M.C.; Pinto, D.C.G.A.; Silva, A.M.S. Plant Flavonoids: Chemical Characteristics and Biological Activity. Molecules 2021, 26, 5377. [Google Scholar] [CrossRef]
  41. Hsieh, Y.H.; Hsu, P.H.; Hu, A.; Cheng, Y.J.; Shih, T.L.; Chen, J.J. Synthesis of Flavonols and Assessment of Their Biological Activity as Anticancer Agents. Molecules 2024, 29, 2041. [Google Scholar] [CrossRef]
  42. Zhang, Y.; Cai, P.; Cheng, G.; Zhang, Y. A Brief Review of Phenolic Compounds Identified from Plants: Their Extraction, Analysis, and Biological Activity. Nat. Prod. Commun. 2022, 17, 1934578X211069721. [Google Scholar] [CrossRef]
  43. Fraga-Corral, M.; Otero, P.; Echave, J.; Garcia-Oliveira, P.; Carpena, M.; Jarboui, A.; Nuñez-Estevez, B.; Simal-Gandara, J.; Prieto, M.A. By-Products of Agri-Food Industry as Tannin-Rich Sources: A Review of Tannins’ Biological Activities and Their Potential for Valorization. Foods 2021, 10, 137. [Google Scholar] [CrossRef]
  44. Saifullah, M.; McCullum, R.; McCluskey, A.; Vuong, Q. Comparison of conventional extraction technique with ultrasound assisted extraction on recovery of phenolic compounds from lemon scented tea tree (Leptospermum petersonii) leaves. Heliyon 2020, 6, e03666. [Google Scholar] [CrossRef] [PubMed]
  45. Enke, C.G.; Nagels, L.J. Undetected Components in Natural Mixtures: How Many? What Concentrations? Do They Account for Chemical Noise? What Is Needed to Detect Them? Anal. Chem. 2011, 83, 2539–2546. [Google Scholar] [CrossRef] [PubMed]
  46. Tohma, H.; Gülçin, İ.; Bursal, E.; Gören, A.C.; Alwasel, S.H.; Köksal, E. Antioxidant activity and phenolic compounds of ginger (Zingiber officinale Rosc.) determined by HPLC-MS/MS. J. Food Meas. Charact. 2017, 11, 556–566. [Google Scholar] [CrossRef]
  47. Rahman, M.J.; Ambigaipalan, P.; Shahidi, F. Biological activities of Camelina and Sophia seeds phenolics: Inhibition of LDL oxidation, DNA damage, and pancreatic lipase and α-glucosidase activities. J. Food Sci. 2018, 83, 237–245. [Google Scholar] [CrossRef]
  48. Pabón Baquero, L.C.; Rendón, F.M.R.; Chaparro, G.M.P.; Otálvaro Álvarez, Á.M. Plant Extracts as Antioxidant Additives for Food Industry. In Antioxidants in Foods and Its Applications; Shalaby, E., Azzam, G.M., Eds.; IntechOpen: London, UK, 2018. [Google Scholar] [CrossRef]
  49. de Almada-Vilhena, A.O.; dos Santos, O.V.M.; Machado, M.d.A.; Nagamachi, C.Y.; Pieczarka, J.C. Prospecting Pharmacologically Active Biocompounds from the Amazon Rainforest: In Vitro Approaches, Mechanisms of Action Based on Chemical Structure, and Perspectives on Human Therapeutic Use. Pharmaceuticals 2024, 17, 1449. [Google Scholar] [CrossRef]
  50. Kuete, V. Potential of Cameroonian plants and derived products against microbial infections: A review. Planta Med. 2010, 76, 1479–1491. [Google Scholar] [CrossRef]
  51. Erhabor, R.C.; Erhabor, J.O.; Nkadimeng, S.M.; McGaw, L.J. In vitro antimicrobial, antibiofilm, and antioxidant activities of six South African plants with efficacy against selected foodborne pathogens. S. Afr. J. Bot. 2022, 146, 643. [Google Scholar] [CrossRef]
  52. Othman, L.; Sleiman, A.; Abdel-Massih, R.M. Antimicrobial activity of polyphenols and alkaloids in Middle Eastern plants. Front. Microbiol. 2019, 10, 911. [Google Scholar] [CrossRef]
  53. Abdoulahi, M.I.I.; Yanick, K.M.; Lauve, R.T.; Habibou, H.H.; Sahabi, B.; Abdelkader, A.S.; Boyom, F.F.; Tidjani, I.A.; Borquaye, L.S. Antibacterial activity of eight medicinal plants from the traditional pharmacopoeia of Niger. J. Trop. Med. 2023, 2023, 6120255. [Google Scholar] [CrossRef]
  54. Twaij, B.M.; Hasan, M.N. Bioactive secondary metabolites from plant sources: Types, synthesis, and their therapeutic uses. Int. J. Plant Biol. 2022, 13, 3. [Google Scholar] [CrossRef]
  55. Naqvi, S.A.R.; Nadeem, S.; Komal, S.; Naqvi, S.A.A.; Mubarik, M.S.; Qureshi, S.Y.; Ahmad, S.; Abbas, A.; Zahid, M.; Khan, N.-U.-H.; et al. Antioxidants: Natural Antibiotics; IntechOpen: London, UK, 2019. [Google Scholar] [CrossRef]
  56. Singh, S.K.; Mohammed, A.; Alghamdi, O.A.; Husain, S.M. New approaches for targeting drug resistance through drug combination. In Combination Therapy Against Multidrug Resistance; Wani, M.Y., Ahmad, A., Eds.; Academic Press: Waltham, MA, USA, 2020; pp. 221–246. [Google Scholar]
  57. Phitaktim, S.; Chomnawang, M.; Sirichaiwetchakoon, K.; Dunkhunthod, B.; Hobbs, G.; Eumkeb, G. Synergism and the mechanism of action of the combination of α-mangostin isolated from Garcinia mangostana L. and oxacillin against an oxacillin-resistant Staphylococcus saprophyticus. BMC Microbiol. 2016, 16, 195. [Google Scholar] [CrossRef] [PubMed]
  58. Górniak, I.; Bartoszewski, R.; Króliczewski, J. Comprehensive review of antimicrobial activities of plant flavonoids. Phytochem. Rev. 2019, 18, 241–272. [Google Scholar] [CrossRef]
  59. Biharee, A.; Sharma, A.; Kumar, A.; Jaitak, V. Antimicrobial flavonoids as a potential substitute for overcoming antimicrobial resistance. Fitoterapia 2020, 146, 104720. [Google Scholar] [CrossRef] [PubMed]
  60. Wu, T.; Zang, X.; He, M.; Pan, S.; Xu, X. Structure–Activity Relationship of Flavonoids on Their Anti-Escherichia coli Activity and Inhibition of DNA Gyrase. J. Agric. Food Chem. 2013, 61, 8185–8190. [Google Scholar] [CrossRef]
  61. Saleem, M.; Nazir, M.; Ali, M.S.; Hussain, H.; Lee, Y.S.; Riaz, N.; Jabbar, A. Antimicrobial natural products: An update on future antibiotic drug candidates. Nat. Prod. Rep. 2010, 27, 238–254. [Google Scholar] [CrossRef]
  62. Savoia, D. Plant-derived antimicrobial compounds: Alternatives to antibiotics. Future Microbiol. 2012, 7, 979–990. [Google Scholar] [CrossRef]
  63. Tsolis, R.M.; Bäumler, A.J. Gastrointestinal host-pathogen interaction in the age of microbiome research. Curr. Opin. Microbiol. 2020, 53, 78–89. [Google Scholar] [CrossRef]
  64. Rosenberg, C.R.; Fang, X.; Allison, K.R. Potentiating aminoglycoside antibiotics to reduce their toxic side effects. PLoS ONE 2020, 15, e0237948. [Google Scholar] [CrossRef]
  65. Dubey, A.; Ghosh, N.; Saxena, G.K.; Purohit, D.; Patel, S.; Singh, S. Management implications for neurotoxic effects associated with antibiotic use. NeuroQuantology 2022, 20, 1303–5150. [Google Scholar] [CrossRef]
  66. Bhagwat, A.; Haldar, T.; Kanojiya, P.; Saroj, S.D. Bacterial metabolism in the host and its association with virulence. Virulence 2025, 16, 2459336. [Google Scholar] [CrossRef]
  67. Kearns, D.B. A field guide to bacterial swarming motility. Nat. Rev. Microbiol. 2010, 8, 634–644. [Google Scholar] [CrossRef]
Figure 1. Mass of acetone crude extracts of the stem and leaves using shaking and sonication methods.
Microbiolres 16 00129 g001
Figure 2. The effect of acetone plant extracts on the growth of the test microorganisms over a period of 24 h. OD600, optical density at 600 nm. Cg: C. glabrum; Gv: G. volkensii. Values are presented as mean ± standard deviation (SD).
Microbiolres 16 00129 g002
Figure 3. Inhibition of initial cell attachment by the acetone extracts against both Gram-negative (E. coli and P. aeruginosa) and Gram-positive (S. aureus and S. pyogenes) bacteria. MIC: minimum inhibitory concentration. All values are presented as mean ± standard deviation (SD). Two-way ANOVA coupled with Dunnett’s multiple comparisons test was used to assess the statistical significance of differences. (ns): not significant; (*): p < 0.05; (**): p < 0.01; (***): p < 0.001; (****): p < 0.0001.
Microbiolres 16 00129 g003
Figure 4. Inhibition of biofilm formation by acetone plant extracts against both Gram-negative (E. coli and P. aeruginosa) and Gram-positive (S. aureus and S. pyogenes) bacteria. All values are presented as mean ± standard deviation (SD). MIC: minimum inhibitory concentration. Two-way ANOVA coupled with Dunnett’s multiple comparisons test was used to assess the statistical significance of differences. (ns): not significant; (*): p < 0.05; (**): p < 0.01; (***): p < 0.001; (****): p < 0.0001.
Microbiolres 16 00129 g004
Figure 5. Eradication of the preformed matured biofilm by the acetone extracts against Gram-negative (E. coli and P. aeruginosa) and Gram-positive (S. aureus and S. pyogenes) bacteria. All values are presented as mean ± standard deviation (SD). MIC: minimum inhibitory concentration. Two-way ANOVA coupled with Dunnett’s multiple comparisons test was used to assess the statistical significance of differences. (ns): not significant; (*): p < 0.05; (**): p < 0.01; (***): p < 0.001; (****): p < 0.0001.
Microbiolres 16 00129 g005
Figure 6. The effect of the plant extracts on bacterial metabolism. MIC: minimum inhibitory concentration. All values are presented as mean ± standard deviation (SD). Two-way ANOVA coupled with Dunnett’s multiple comparisons test was used to assess the statistical significance of differences. (****): p < 0.0001.
Microbiolres 16 00129 g006
Figure 7. Swarming motility of E. coli, P. aeruginosa, and S. aureus treated with acetone plant extracts at concentrations equivalent to MIC and ½ MIC. MIC: minimum inhibitory concentration.
Microbiolres 16 00129 g007
Figure 8. Heatmaps displaying the Pearson correlation coefficients between the phytochemicals, antioxidant activity (DPPH and H2O2), and antibacterial activity of shaken acetone extracts of C. glabrum and G. volkensii against E. coli (A), P. aeruginosa (B), S. aureus (C), and S. pyogenes (D). The colour scale shown on the right side of each heatmap shows the range and strength of correlation. r = −1 (green): perfect negative correlation; r = 0 (black): no linear correlation; r = 1 (red): perfect positive correlation.
Microbiolres 16 00129 g008
Figure 9. Heatmaps displaying the Pearson correlation coefficients between the phytochemicals, antioxidant activity (DPPH and H2O2), and antibacterial activity of sonicated acetone extracts of C. glabrum and G. volkensii against E. coli (A), P. aeruginosa (B), S. aureus (C), and S. pyogenes (D). The colour scale shown on the right side of each heatmap shows the range and strength of correlation. R = −1 (green): perfect negative correlation; r = 0 (black): no linear correlation; r = 1 (red): perfect positive correlation.
Microbiolres 16 00129 g009
Table 1. The total phenol, tannin, and flavonoid contents of C. glabrum and G. volkensii.
Total Phenolics (mg GAE/g) Total Tannins (mg GAE/g) Total Flavonoids (mg QE/g) Total Flavonols (mg QE/g)
Extraction Method
Plants Shaking Sonication Shaking Sonication Shaking Sonication Shaking Sonication
C. glabrum leaves29.89 ± 1.72 a 125.34 ± 2.82 e 7.83 ± 0.12 a 34.71 ± 2.72 c 6.17 ± 0.03 a,b24.52 ± 0.06 c 43.31 ± 6.10 a 51.40 ± 3.68 b
C. glabrum stems 27.14 ± 0.42 a 61.45 ± 0.80 d 18.73 ± 0.32 b 55.84 ± 0.39 d 6.86 ± 0.65 a,b5.87 ± 0.12 a 49.08 ± 0.51 a,b 39.12 ± 1.13 a
G. volkensii leaves 35.81 ± 0.36 b38.85 ± 0.88 b,c 7.56 ± 0.35 a 11.35 ± 0.23 a,b 7.41 ± 1.07 b6.26 ± 0.13 a,b61.33 ± 3.99 b,c 40.58 ± 4.06 a
G. volkensii stems 122.50 ± 2.21 e 59.81 ± 0.33 d 18.13 ± 0.13 b 14.53 ± 0.34 a,b 8.69 ± 0.03 b7.15 ± 0.22 a,b43.27 ± 4.02 a 37.62 ± 1.47 a
All values are presented as mean ± standard deviation (SD). mg GAE/g: milligrams of gallic acid equivalents per gram, mg QE/g: milligrams of quercetin equivalents per gram. Values with different superscript letters are significantly different (p < 0.05).
Table 2. Antioxidant activities of the acetone plant extracts extracted using conventional shaking and sonication methods, expressed as half maximal effective concentration (EC50) values.
Free Radical Scavenging ActivityHydrogen Peroxide Assay
EC50 (µg/mL)
Plants Shaking Sonication ShakingSonication
C. glabrum Leaves 800.43 ± 4.32 e61.59 ± 5.41 d131.39 ± 1.99 c72.40 ± 10.48 b
C. glabrum Stems 22.84 ± 1.52 b55.97 ± 1.60 d1140.16 ± 8.52 e2480.61 ± 8.59 g
G. volkensii Leaves 6199.59 ± 1.63 g4750.34 ± 8.02 f454.10 ± 5.53 d3712.43 ± 1.23 h
G. volkensii Stems 32.35 ± 1.83 b36.57 ± 6.11 b,c6920.30 ± 5.06 i1849.97 ± 5.86 f
Positive control
L-Ascorbic acid 0.002 ± 1.10 a45.61 ± 4.47 a
Values are expressed as mean ± standard deviation (SD). ANOVA coupled with Dunnett’s multiple comparisons test was used to assess the statistical significance of differences. Values with different superscript letters are significantly different (p < 0.05).
Table 3. Antibacterial activity of acetone extracts against selected nosocomial pathogens.
Plant ExtractMicroorganismE. coli P. aeruginosa S. aureus S. pyogenes
Extraction MethodMICMBCTAMICMBCTAMICMBCTAMICMBCTA
CgLShaking0.160.63237.501.25-30.400.311.25122.580.632.560.32
Sonication0.160.63406.250.632.5103.170.311.25209.680.632.5103.17
CgSShaking------------
Sonication1.25-25.602.5-12.80 1.25-25.6 1.25-25.60
GvLShaking0.160.63575.000.632.5146.030.631.25146.030.632.5146.03
Sonication0.160.63500.000.311.25258.060.310.63258.060.311.25258.06
GvSShaking0.63-96.831.25-48.800.632.596.830.63-96.83
Sonication0.312.5148.390.312.5148.390.160.31287.500.31-148.39
Antibiotic
Amp 0.125 0.16 0.008 0.008
Gent 0.16 0.004 0.008 0.008
CgL: C. glabrum leaves; CgS: C. glabrum stems; GvL: G. volkensii leaves; GvS: G. volkensii stems; Amp: ampicillin; Gent: gentamicin; (-): no activity; MIC: minimum inhibitory concentration; MBC: minimum bactericidal concentration; TA: total activity.
Table 4. Combinational effects of the leaf extracts (sonicated) on Gram-negative and Gram-positive bacteria.
MIC (mg/)mLFIC(A)FIC(B)FIC IndexInteraction
Gram-negative
E. coliP. aeruginosaE. coliP. aeruginosaE. coliP. aeruginosaE. coliP. aeruginosaE. coliP. aeruginosa
CgGv--------AntagonismAntagonism
CgAmp0.29-1.78-2.28-4.06-AntagonismAntagonism
CgGent-0.16-0.26-51.87-52.13AntagonismAntagonism
GvAmp0.44-1.40-3.48-4.88-AntagonismAntagonism
GvGent--------AntagonismAntagonism
Gram-positive
S. aureusS. pyogenesS. aureusS. pyogenesS. aureusS. pyogenesS. aureusS. pyogenesS. aureusS. pyogenes
CgGv--------AntagonismAntagonism
CgAmp--------AntagonismAntagonism
CgGent0.0210.0200.0660.0322.5632.5312.6292.563IndifferenceIndifference
GvAmp--------AntagonismAntagonism
GvGent0.0050.0100.0350.0330.6561.2810.6911.314AdditivityIndifference
(-): undetected activity; CgGv: C. glabrum leaf extract and G. volkensii leaf extract combination; CgAmp: C. glabrum leaf extract and ampicillin combination; CgGent: C. glabrum leaf extract and gentamicin combination; GvAmp: G. volkensii leaf extract and ampicillin combination; GvGent: G. volkensii leaf extract and gentamicin combination.
Table 5. Swarming motility inhibition percentage of acetone plant extracts against E. coli, P. aeruginosa, S. aureus, and S. pyogenes.
Anti-Swarming Activity
Plant ExtractE. coliP. aeruginosaS. aureus
MIC½ MICMIC½ MICMIC½ MIC
C. glabrum leaves (sonication)20.83 ± 2.9513.54 ± 1.4750.09 ± 0.00 20.68 ± 1.26−23.64 ± 10.295.45 ± 0.00
G. volkensii leaves (shaking)20.83 ± 0.0020.83 ± 11.7947.42 ± 1.2644.74 ± 2.52−12.73 ± 5.14−9.09 ± 10.29
G. volkensii leaves (sonication)16.67 ± 5.8914.58 ± 2.9537.61 ± 2.5226.92 ± 2.52−12.73 ± 5.140.00 ± 12.86
G. volkensii stem (sonication)20.83 ± 11.7920.83 ± 5.8945.63 ± 3.7821.57 ± 5.0412.73 ± 0.0016.36 ± 5.14
Gentamicin100.00 ± 0.00100.00 ± 0.0084.85 ± 1.2612.66 ± 1.26100.00 ± 0.00100.00 ± 0.00
(-): negative values indicate promotion of swarming motility; all values are presented as mean ± standard deviation (SD); MIC: minimum inhibitory concentration.
Disclaimer/Publisher’s Note: The statements, opinions and data contained in all publications are solely those of the individual author(s) and contributor(s) and not of MDPI and/or the editor(s). MDPI and/or the editor(s) disclaim responsibility for any injury to people or property resulting from any ideas, methods, instructions or products referred to in the content.

