Article

Microbial Contamination in Commercial Honey: Insights for Food Safety and Quality Control

by
Felipe Bruxel
1,†,
Ana Maria Geller
2,
Andrei Giacchetto Felice
3,
Jeferson Aloísio Ströher
4,
Anderson Santos de Freitas
5,
Angela Balen
6,
Maria Beatriz Prior Pinto Oliveira
7,* and
Wemerson de Castro Oliveira
2,*,†
1
Department of Chemical Engineering, Federal University of Santa Maria, Santa Maria 97105-900, Brazil
2
Department of Teaching, Research, and Extension, Federal Institute of Education, Science and Technology, Sul-Rio-Grandense, Lajeado 95910-016, Brazil
3
Laboratory of Bioinformatics, Department Tropical Medicine and Infectology, Federal University of Triângulo Mineiro, Uberaba 38025-180, Brazil
4
Institute of Food Science and Technology, Federal University of Rio Grande do Sul, Porto Alegre 91509-900, Brazil
5
Center for Nuclear Energy in Agriculture, University of São Paulo, Piracicaba 13416-000, Brazil
6
Program in Foods of Animal Origin, Federal University of Rio Grande do Sul, Porto Alegre 91509-900, Brazil
7
REQUIMTE/LAQV, Department of Chemical Sciences, Faculty of Pharmacy, University of Porto, 4050-313 Porto, Portugal
*
Authors to whom correspondence should be addressed.
These authors contributed equally to this work.
Microbiol. Res. 2025, 16(6), 128; https://doi.org/10.3390/microbiolres16060128 (registering DOI)
Submission received: 30 April 2025 / Revised: 30 May 2025 / Accepted: 9 June 2025 / Published: 13 June 2025

Abstract

:
Honey is a sugar-rich product produced by Apis mellifera bees, with significant variability in properties due to the influence of geographic and climatic conditions and the predominant flora in the production region. Economically, beekeeping is an activity that generates profit and fulfills environmental and social functions, reinforcing the pillars of sustainability. This study aimed to characterize samples of honey sold in southern Brazil, including physicochemical analyses, the detection of microbiological contaminants with potential impact on human health, and the detailed identification of bacterial composition through the Next-Generation Sequencing (NGS). The present study was divided into five main stages: (1) sample collection; (2) sample fractionation; (3) physicochemical analysis; (4) microbiological analysis; (5) 16S metataxonomy analysis. The physicochemical analyses agreed with the regulated values, indicating the good quality of the honey and the absence of adulteration. The microbiological analyses indicated the absence of Salmonella spp., in addition to a low count of total coliforms. The limits for molds and yeasts were exceeded in three samples, indicating non-compliance with current MERCOSUR legislation. Metabarcoding analysis identified a total of 15,736 OTUs divided into three different genera: Bacillus (41.54%), Lysinnibacillus, and Rossellomorea, all belonging to the Bacillaceae family. Some pathogenic species were identified, namely the Bacillus cereus group and Bacillus pumilus. Our results point to an increased need for surveillance, as honey contamination can lead to public health problems, requiring improvements in legislation and control parameters.

1. Introduction

Honey is a bee product produced by the species Apis mellifera from the collection of nectar and sap from plants, which are subsequently transformed through chemical and physical reactions into a product rich in sugars, such as fructose and glucose, as well as compounds such as organic acids, enzymes, amino acids, and solid particles [1,2]. Honey shows significant variability, such as in color, aroma, flavor, moisture content, sugar composition, and other constituents, with these characteristics being influenced by geographic and climatic conditions and the predominant flora in the production region [3].
The global honey production panorama is led by China, which historically stands out as the world’s leading producer. Between 2013 and 2022, the country achieved an annual average production of 473 thousand tons, corresponding to approximately 25.5% of world production according to data from the Food and Agriculture Organization of the United Nations [4]. Furthermore, in the same period, countries such as Turkey, Iran, Ethiopia, Argentina, the United States of America, Russia, Ukraine, India, and Mexico were among the ten largest honey producers on the global stage.
In Brazil there has been a continuous productivity improvement, with the country’s share of world production rising from 2.09% in 2013 to 3.28% in 2022, placing Brazil among the top ten global honey producers in 2021 and 2022 [4]. Honey production in the Brazilian context has seen significant growth, as there has been a consecutive increase in production over 8 years, starting with a production of 37,859 tons in 2015 and reaching a production of 64,189 tons of honey in 2023, representing an increase of 69.54% [5]. Historically, the Brazilian state with the greatest contribution to honey production in Brazil has been Rio Grande do Sul (RS), which has been the largest producer in the last 4 years (2020–2023) [5]. The state has contributed 15.04% of national production in the last 10 years, going from a production of 5991 tons in 2014 to 9111 tons in 2023, increasing productivity by 52.08% [5].
Beekeeping, associated with honey production, plays a relevant role in the economy, evidenced by its ability to generate profits and boost the market through the commercialization of various products related to beekeeping. According to the Brazilian Institute of Geography and Statistics (IBGE, acronym in Portuguese) [5], in 2023, the production of 64,189 tons of honey generated a revenue of BRL 908 million. In addition to its economic relevance, beekeeping also fulfills environmental and social functions, reinforcing the pillars of sustainability. In the environmental sphere, the contribution of Apis mellifera bees in the pollination process stands out as essential for the preservation of ecosystems, as reported by Wolff and Hung et al. [6,7]. Beekeeping activity also promotes the generation of jobs, both directly, through beekeeping practice, and indirectly, through marketing points [8,9]. In this context, in 2017, 101,797 agricultural establishments with beekeeping activity were registered in Brazil [5].
However, Brazilian beekeeping faces challenges related to technological development and access to information applied in the activity, considering the significant structural heterogeneity present in the beekeeping sector [10]. The implementation of beekeeping practices is improved by the use of new equipment and techniques, which make the activity more efficient, safe, and economically advantageous when the available technologies are correctly applied [11]. The level of technological development in production can directly influence the minimum quality parameters of honey. In Brazil, these parameters are defined by regulatory entities, such as the Ministry of Agriculture and Livestock (MAPA, acronym in Portuguese), through the Technical Regulation for the Identity and Quality of Honey (TRIQ). The National Health Surveillance Agency (ANVISA, acronym in Portuguese) is involved in establishing Maximum Tolerated Limits (MTLs) for contaminants, including metals such as arsenic, cadmium, lead, and copper, to ensure food safety and product compliance with current regulations [12].
Regarding the quality and composition requirements of floral honey established by Normative Instruction n° 11 of 20 October 2000 [13], limits are defined for reducing sugars (minimum of 65 g/100 g), moisture (maximum of 20 g/100 g), apparent sucrose (maximum of 6 g/100 g), water-insoluble solids (maximum of 0.1 g/100 g), ash (maximum of 0.6 g/100 g), diastase activity (minimum of 8 on the Göthe scale), acidity (maximum of 50 mEq/kg), hydroxymethylfurfural (maximum of 60 mg/kg), and the presence of pollen grains. Furthermore, to guarantee the authenticity of the product and identify fraud, analyses are required, such as the Lund reaction (presence of albuminoids), the Fiehe reaction (identifying compounds formed by overheating or addition of syrups), and the Lugol reaction (detection of dextrins and starch) [14,15,16].
Honey has an average moisture content of 17.2%, which, together with its low water activity, hinders the development of microorganisms [17]. Furthermore, substances such as hydrogen peroxide and gluconic acid provide acidity to the product and hinder bacterial growth [18]. However, honey may contain endospore-forming bacteria that are resistant to environmental issues and can cause diseases [19,20], such as species of the following genera: Bacillus, Paenibacillus, Lactococcus, Citrobacter, Pseudomonas, Rummeliibacillus, Brevibacillus, and Lysinibacillus [2,21,22,23,24,25].
Currently, Brazil does not have specific legislation aimed at microbial contamination in honey, but the MERCOSUL Technical Regulation on Honey Identity and Quality (MERCOSUL/GMC/RES n° 15/94) [26] establishes limits for the presence of total coliforms, Salmonella spp., fungi, and yeasts [26]. The microbiological analysis of honey is essential and can be performed using both traditional methods and innovative approaches, such as Next-Generation Sequencing (NGS). This technique allows for the detailed identification of bacterial composition without the need for culturing microorganisms, presenting high sensitivity and accuracy [27]. The objective of this study was to characterize samples of honey sold in southern Brazil, including physical–chemical analyses, the detection of microbiological contaminants with potential impacts on human health, and the detailed identification of the bacterial composition using Next-Generation Sequencing (NGS) techniques.

2. Materials and Methods

2.1. Sample Characterization and Collection

Twelve honey samples were collected from different points of sale in municipalities in the Taquari Valley and Rio Pardo Valley regions, located in the state of Rio Grande do Sul (RS). RS is the southernmost Brazilian state, with 497 municipalities, and has a subtropical climate with average temperatures ranging from 14° Celsius to 22° [28]. After collection, the honey samples were kept in their original packaging and then refrigerated until analysis. The samples were aseptically fractionated for physical–chemical, microbiological, and metabarcoding analyses.

2.2. Characterization of Honey

2.2.1. Physicochemical Analyses

Physicochemical analyses were performed using the protocols described by the Adolfo Lutz Institute [15]. For the Lund reaction analysis, 2 g of the sample was weighed and added to 20 mL of distilled water and 5 mL of 0.5% tannic acid solution (Synth, Diadema, Brazil), for a total volume of 40 mL. After 24 h of standing, the formation of between 0.6 and 3.0 mL of precipitate indicated pure honey [15]. For the Fiehe reaction, 5 g of the sample was weighed and 5 mL of ether (Synth, Diadema, Brazil) was added. The ether layer received 0.5 mL of 1% resorcinol hydrochloride solution (Synth, Diadema, São Paulo, Brazil). An intense red color after 10 min indicated fraud [15]. For analysis with Lugol’s solution, 10 g of the sample was weighed, diluted in 20 mL of distilled water, heated in a boiling electronic water bath (90 °C) (Cap-lab, model BMTB, Mauá, Brazil) for 1 h, and cooled to room temperature. A total of 0.5 mL of Lugol’s solution (Cap-lab, Mauá, Brazil) was added. Reddish-brown to blue coloration indicated adulteration [15].
Free acidity was determined by titration with sodium hydroxide 0.05 mol∙L−1 (Cap-lab, Mauá, Brazil) and pH was measured with a pH meter (Marte, model mb10, Valinhos, Brazil). Insoluble solids were quantified by gravimetry, and moisture was determined by refractometry at 20 °C (Atago, model Master-honey/bx, Ribeirão Preto, Brazil). For ash analysis, ash was incinerated at 550 °C in a muffle furnace (Quimis, model Q318S25T, Diadema, Brazil). The soluble solid content (°Brix) was measured with a portable digital refractometer (Atago, model PAL-Beta 0-85%, Ribeirão Preto, Brazil).

2.2.2. Microbiological Analysis

The quantification of molds and yeasts (CFU/g) was performed according to the [29] ISO 6611-IDF 94:2004 standard. The analysis of the Most Probable Number (MPN) of thermotolerant coliforms at 45 °C (MPN/g) was conducted according to the Compendium of Methods for the Microbiological Examination of Foods [30] (CMMEF, 2015), Chapter 9. The determination of total coliforms (MPN) followed the methodology of the ISO 4831:2006 [31] standard, with results read in MPN/g. The research for Salmonella spp. in 25 g of sample (presence/absence) was carried out according to the methodology of the AOAC International, OMA 2011.03 [32], and ISO 6579-1:2017/Amend.1:2020 [33] standards. The results were expressed as presence or absence. The analysis for the detection of Listeria monocytogenes in 25 g of sample (presence/absence) was conducted according to the AFNOR BIO method-12/11-03/04 [34] and the ISO 11290-1:2017 standard [35]. The quantification of Escherichia coli (MPN/g) was performed according to the ISO 16649-3:2015 [36] standard. The coagulase-positive Staphylococcus count (CFU/g) followed the ISO 6888-1:2021 [37] standard. The samples were subjected to specific isolation, cultivation, and identification procedures, according to established protocols, ensuring the evaluation of the microbiological quality of the honey.

2.2.3. Amplicon Sequencing and 16S Analysis

The profile of the bacterial population present in four randomly selected samples was determined by NGS. The procedures performed follow the protocol developed by the outsourced laboratory and described by Erhardt et al. [38]. The amplification of the genetic material obtained in the analyses was performed using primers for the v3-v4 region of the 16S rRNA gene, 341F with sequence (CCTACGGGRSGCAGCAG) and 806R with sequence (GGACTACHVGGGTWTCTAAT) [39,40].
The libraries were sequenced consecutively using the MiSeq Sequencing System (Illumina Inc., USA), and the sequences were analyzed using the Sentinel pipeline. A 99% identity level was used to define the species. Bacterial DMD analyses were performed using reference databases for the respective 16S rRNA genes from the Sentinel pipeline itself. The results were obtained in operational taxonomic units (OTUs).

2.3. Pangenomic Analysis

2.3.1. Comparative Analysis of Genomes: Phylogenetic Analysis

The construction of the phylogenetic profile was carried out following the steps and descriptions of Erhardt et al. [38]. Multiple alignment was performed using the MEGA X [41], and the genetic tree was generated based on the Neighbor-Joining method and visualized using the FigTree V1.4.4 tool (http://tree.bio.ed.ac.uk/software/figtree/ (accessed on 21 December 2023)).

2.3.2. Complete Reference Genomes for In Silico Analysis and Research of Virulence and Antimicrobial Resistance Genes

The complete genomes of the strains considered as references by the National Center for Biotechnology Information (NCBI) of each of the species identified in this study were downloaded from the RefSeq database [33] in “.fna”, “.gbff” and “.faa” formats in order to perform the in silico prospecting of virulence and antibiotic resistance genes.
PanVita software V1.0 (Pan Virulence and resisTance Analysis) was the tool used to predict antimicrobial resistance genes (ARGs) and virulence genes through comparison with databases such as the CARD (Comprehensive Antibiotic Resistance Database) and VFDB (Virulence Factor Database), as described by Pedroso et al. [42]. For these analyses, we downloaded the reference genomes for each species that showed great similarity in BLAST v.1 (https://blast.ncbi.nlm.nih.gov/, accessed on 27 January 2025) with the 16S sequencing data from our samples, and then the software was used with default parameters [43].

3. Results and Discussion

The results described refer to 12 samples of honey sold in Rio Grande do Sul, where the analyses of the physicochemical properties and microbial count were performed for all samples. Furthermore, four honey samples were arbitrarily selected to perform NGS (metabarcoding) to identify the bacteriome present in the selected samples.

3.1. Physicochemical Profile of Honey

All the analyzed honey samples complied with the acidity limit established by the TRIQ, which establishes a maximum value of 50 mEq/kg [14]. The acidity values ranged from 22.44 mEq/kg to 33.47 mEq/kg, reflecting significant differences in the acid profile present in the honey samples. Bertoldi et al. [44] observed high acidity values in most of the samples analyzed in their study. The high acidity in some samples may be associated with factors related to the intrinsic characteristics of the honey produced in the region [44] and is associated with the influence of the richness and diversity of the bacterial community observed in NGS analyses [25]. Considering that this bee product is derived from flower nectar, it is plausible to suggest that honey has a higher concentration of organic acids in its composition. The importance of acidity is also observed, as it is a fundamental parameter for the microbiological stability of honey, as it influences the inhibition of the growth of microorganisms [45].
The pH of the samples ranged from 4.11 to 4.55, demonstrating an inverse relationship with the acidity values (Table 1). Although pH is not established as a quality parameter in current legislation, its analysis is extremely relevant, since it directly influences the formation of hydroxymethylfurfural and the growth of microorganisms, especially pathogenic ones. These, in general, do not develop in environments with a pH below 4.5 [46]. Therefore, the assessment of pH is an important aspect of ensuring the quality and microbiological safety of honey. To improve the quality of Brazilian honey, MAPA Ordinance No. 795 [47] updates production standards, including processing, traceability and inspection. Although it allows controlled pasteurization as an optional measure to reduce pathogenic microorganisms, it still does not establish specific microbiological limits, as in international regulations. It is therefore urgent that Brazilian policy adopts clear microbiological standards, aligns with global guidelines, and strengthens inspection to guarantee the safety and quality of Brazilian honey.
The moisture content varied between 15.23% and 19.22%, constituting a fundamental parameter for honey stability. According to Brazilian legislation, the moisture content of honey must be less than 21.0%, since values above this limit may favor fermentation processes, compromising the quality and shelf life of the product [14,48,49]. Regarding ash content, the values observed varied from 0.07% to 0.57%, with all samples analyzed following the legislation, which defines a maximum limit of 0.6% [12] (Table 1). High ash content rates may be related to environmental pollution or inadequate practices during collection and processing, such as the presence of impurities [50].
The levels of insoluble solids present in the samples analyzed varied between 0.05% and 0.12%. According to Brazilian legislation, centrifuged honey must present values below 0.1 g/100 g, while pressed honey can reach up to 0.5 g/100 g [14]. Values that exceed these limits may indicate failures during the collection or processing stages, such as deficiencies in filtration or decantation [51]. Regarding the Brix values, which reflect the concentration of soluble solids, a variation of 74.0% to 80.0% was observed, indicating the sugar content present in the honey. Although Brazilian legislation does not establish a specific limit for the Brix value, this parameter is extremely relevant for the evaluation of product quality and stability (Table 1), mainly influencing the richness of fungal communities, as verified by Xiong et al. [25] in their study using NGS. In addition, water activity and color were associated with the diversity of the fungal community.
Finally, Lund’s analyses presented results within the limits established by legislation (having a positive result). The Fiehe and Lugol reactions presented negative results, demonstrating that the honey did not contain substances such as sugar syrup or starch, respectively. This indicated that the honey maintained its natural characteristics, good quality, an absence of adulteration, and showed no evidence of excessive heating or adulteration. These analyses guarantee the authenticity and quality of the honey, detecting adulterations and preserving its properties. In addition, they reinforce consumer confidence, protect producers, and value the product in the market [52,53].

3.2. Microbial Count

The microbiological analyses performed on the samples indicate the absence of pathogenic bacterial species that are harmful to the quality of the honey, such as Salmonella spp. and total coliforms, as required by the MERCOSUL regulation [26] (Table 2). Furthermore, it is possible to note, as shown in Table 2, the negative results for microbiological contaminants such as Listeria, E. coli, thermotolerant coliforms, and Staphylococcus, demonstrating that the honey does not contain such contaminants, in accordance with different studies that evaluate the antibacterial activity of honey [54,55,56].
However, it was observed that seven honey samples showed significant growth of filamentous fungi (molds) and yeasts. Among these, three samples, identified as PMDE, PMNI and PMVA, were in disagreement with the parameters established by the current MERCOSUL legislation [26]. The data for the fungi and yeast counts have very different values, ranging from 10 to 630 CFU, with an average of 102.38 CFU/g, values close to those found by Vázquez [57] when reporting a count of 100 to 160 CFU/g for molds and 120 to 990 CFU/g for yeasts. Furthermore, the study by Iurlina and Fritz [58] presented counts of 0 and 300 CFU/g for fungi and yeasts, with an average value of 34 CFU/g, demonstrating lower values compared to the present study.
Furthermore, factors such as high humidity, moderate temperatures, honey granulation, and increased yeast count were identified as favorable conditions for product fermentation, as highlighted by Pereira [59] and corroborated by Pereira et al. [60]. Oliveira et al. [61] emphasize that contamination by molds and yeasts is reduced when collection is performed hygienically. Thus, the adoption of good hygiene practices is essential to ensuring the quality and extend the shelf life of honey.

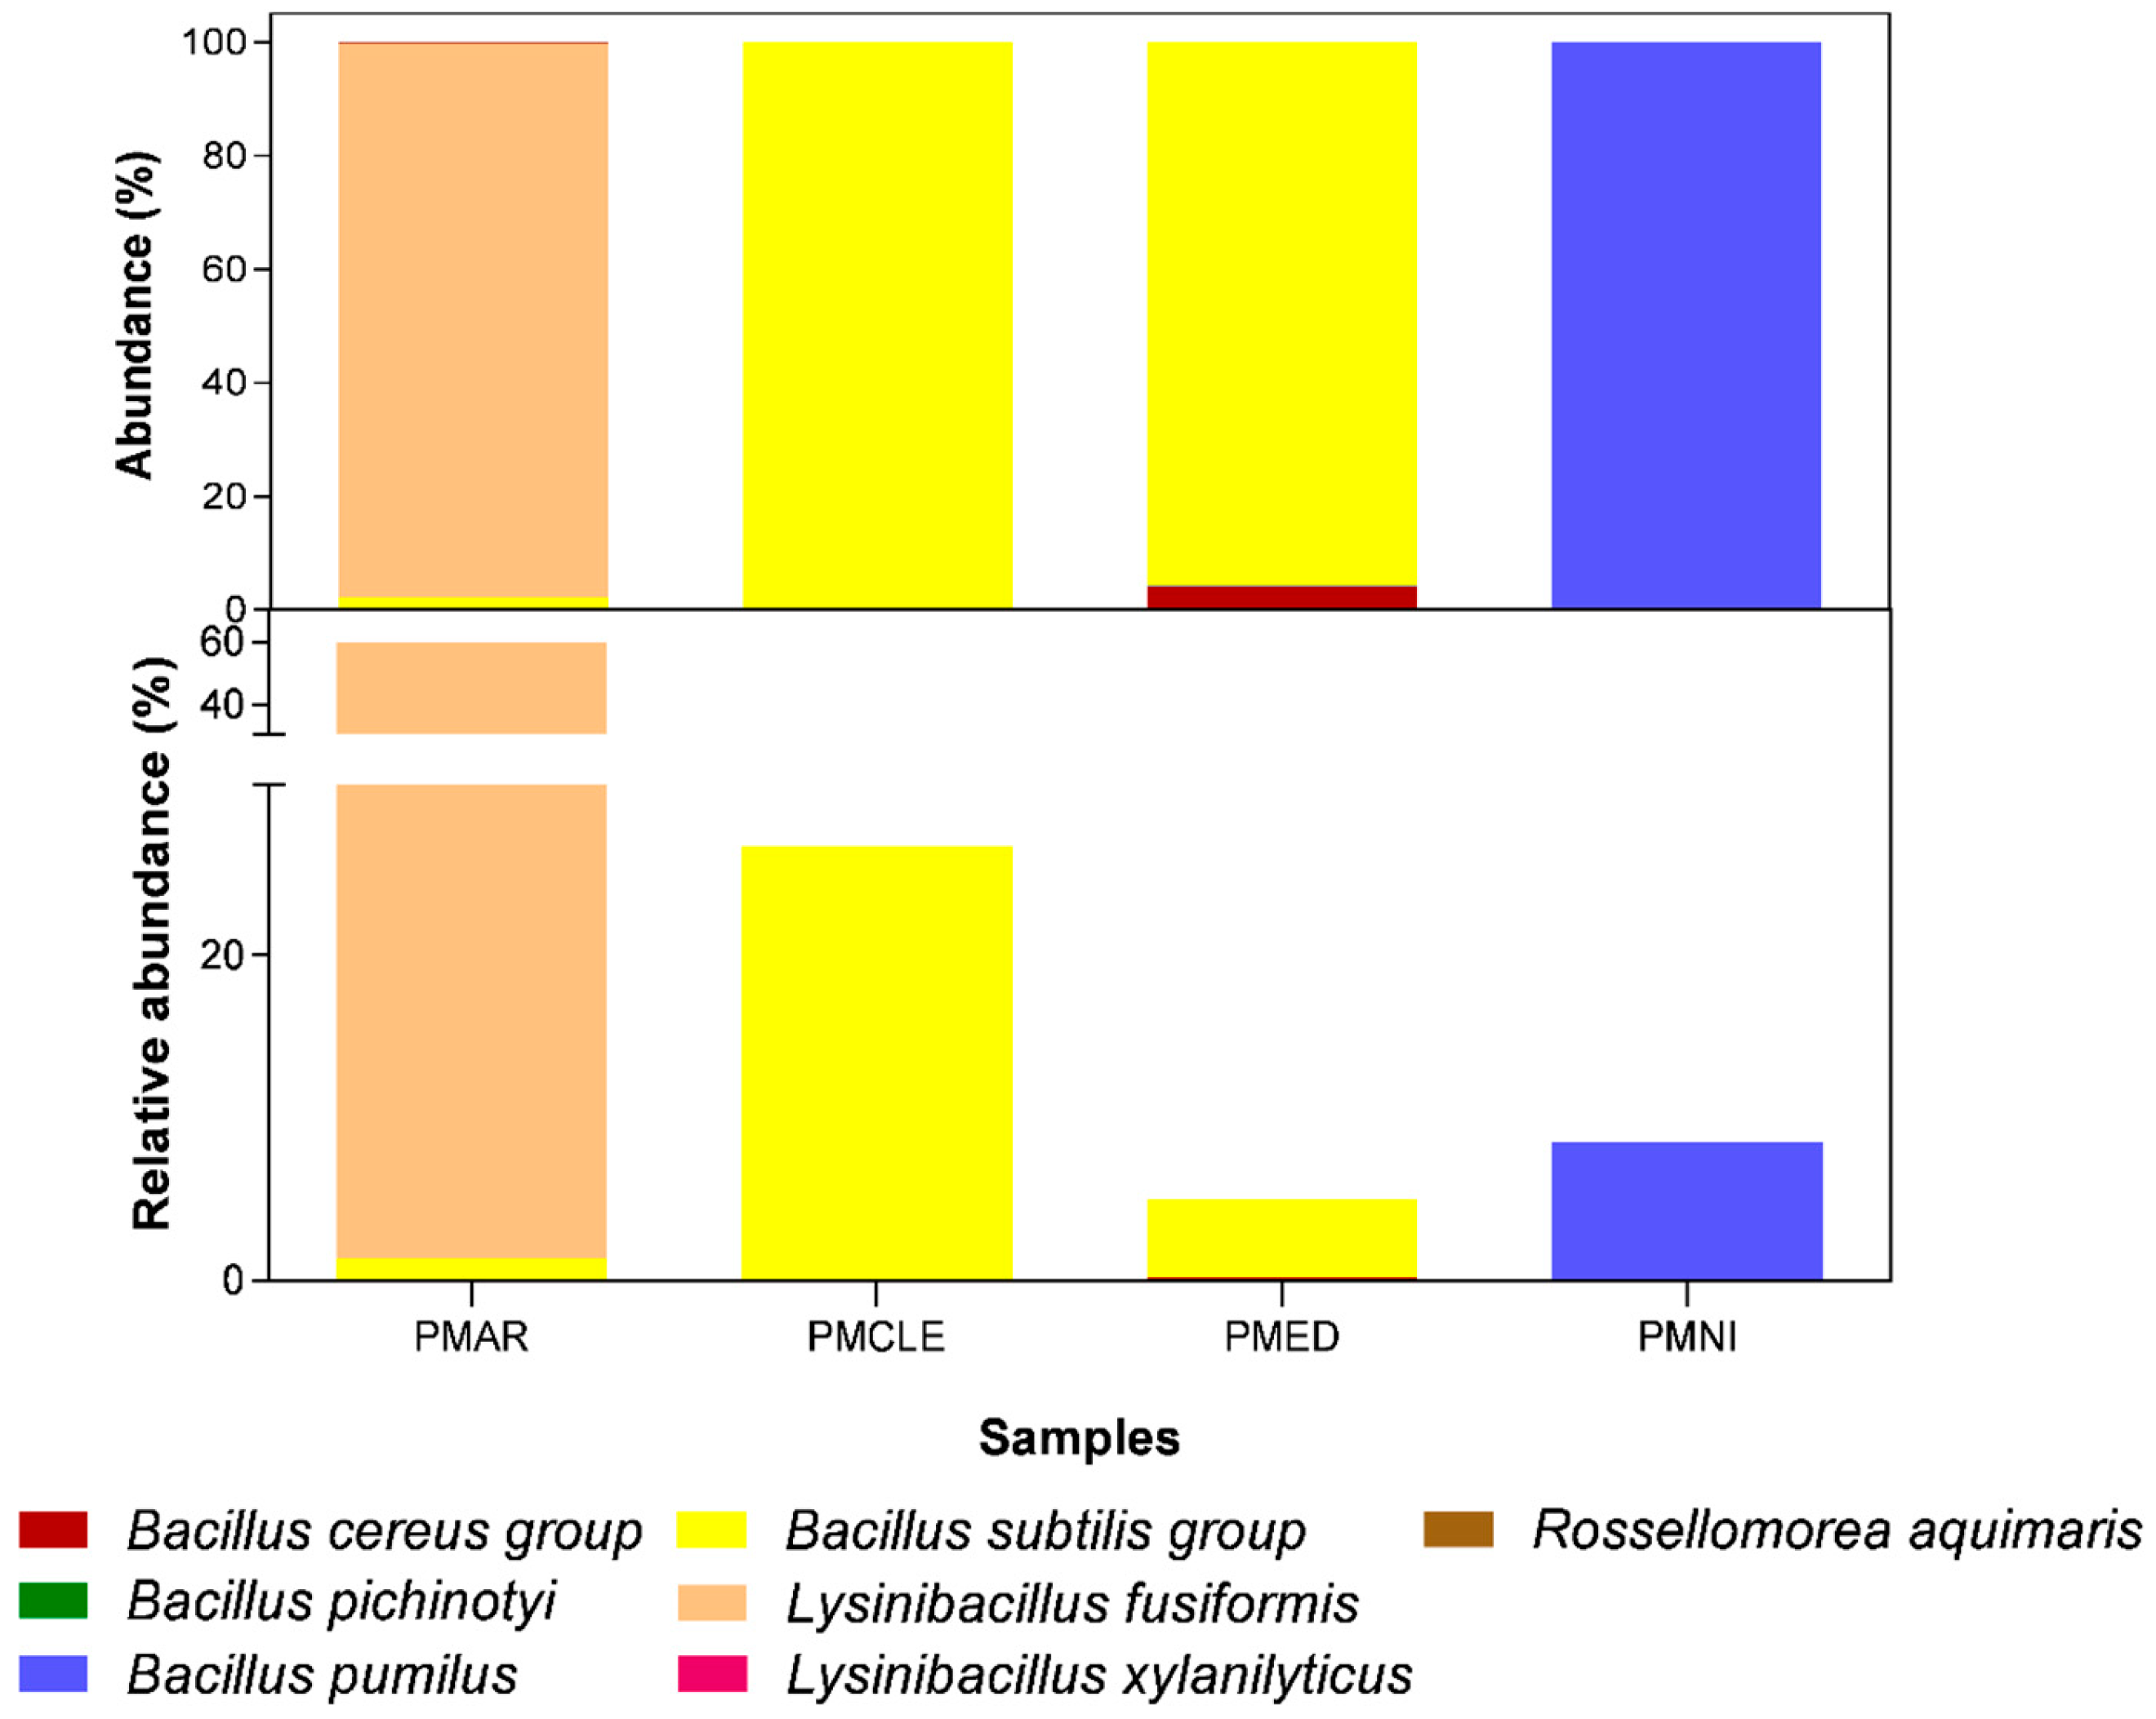
3.3. Bacterial Population Profile in Honey

The bacteriome analysis by metabarcoding, performed on four honey samples acquired in the RS region, identified 15,736 OTUs distributed in three distinct bacterial genera, all belonging to the Bacillaceae family: Bacillus (41.54%), Lysinibacillus (58.40%), and Rossellomorea (0.06%) (Table 3 and Figure 1). Prokaryotic communities present in honey are often characterized by a significant predominance of lactic acid bacteria (LAB), including genera such as Lactobacillus, Lactococcus, Fructobacillus, Streptococcus, and Enterococcus [25,62,63,64]. This LAB enrichment has been particularly associated with the botanical and geographic origin of honey [62]. However, the data obtained in the present study did not reveal the presence of LAB.
The analysis of the PMNI, PMCLE, PMAR, and PMED samples revealed a heterogeneous distribution of the identified bacterial species, with variations in the relative abundance of each species among the samples, namely: Bacillus pumilus, Bacillus subtilis, Bacillus pichinotyi, Bacillus cereus, Lysinibacillus xylanilyticus, Lysinibacillus fusiformis, and Rossellomorea aquimaris (Table 3 and Figure 1). However, Xiong et al. [25], based on NGS analyses of honey, found relatively similar communities. The researchers identified more than 20 bacterial genera in the samples tested, including species of the Bacillus genus.
According to Silva et al. [2], the Bacillus genus contains more than 60 species of Gram-positive bacteria, which are characterized by the formation of rod-shaped endospores. Among the species of the genus, most do not pose a danger in terms of pathogenicity, where the occurrence of diseases associated with the genus is restricted to certain species [2]. Among the pathogenic species found in the literature and identified in our analysis, there is the Bacillus group, especially the species Bacillus cereus and Bacillus pumilus [20,65,66]. These two species were described in the study by Østenvik et al. [67] as sources of possible food poisoning in foods contaminated with water from rivers, where these cytotoxic bacteria can cause contamination risk. Regarding the species Bacillus pumilus, present in three samples and representing 8.54% of the bacteria found in our research, its toxicity was reported in a study developed by From et al. [68] regarding food poisoning in three people, where samples of cooked and reheated rice in a restaurant were demonstrated. Both rice samples were contaminated with high levels of Bacillus pumilus, with approximate levels of 105 colony forming units (CFU) per gram of concentrated rice. It is worth noting that the analysis of the rice samples produced a presence of the bacterium Bacillus cereus of less than 100 CFU per gram [68].
Bacillus cereus is the main pathogen of interest associated with honey, capable of producing enterotoxins under favorable conditions (pH 6.0–8.0; 6–21 °C), requiring the consumption of approximately 107 cells/mL to cause food poisoning [69]. Bovo et al. [70] identified several bacteria in samples of orange blossom and eucalyptus honey by shotgun metagenomics, and in the latter, the presence of Bacillus cereus was detected among the species belonging to the identified bacterial families.
Although Bacillus pumilus has also been associated with toxic episodes [65], its pathogenicity is considered rare. Several species of the Bacillus genus, such as B. amyloliquefaciens, Bacillus subtilis, Bacillus licheniformis, and Bacillus megaterium, have been isolated from honeys with different geographical and botanical origins [22], most of which are considered safe and have biotechnological potential, especially in the production of bacteriocins with antimicrobial action [71].
The Bacillus subtilis group species was the most prevalent, representing 32.7% of the total, with greater abundance in the PMCLE sample (26.7%) and presence also in PMAR (1.3%) and PMED (4.7%). The Bacillus subtilis group bacterium can survive in adverse conditions and environmental stress given its sporulation capacity. Furthermore, its ability to generate genetic differentiation in cell division processes or even the absorption of extracellular DNA shows the strengths of the Bacillus subtilis group bacteria [72,73]. The Lysinibacillus fusiformis species was continuously predominant in the PMAR sample, corresponding to 58.3% of the total abundance of this sample, but was not detected in the others. The Bacillus pumilus species was identified mainly in the PMNI sample (8.5%), with a small presence in PMAR (0.01%), totaling 8.5% of the total. The Bacillus cereus group was detected exclusively in the PMED sample, representing 0.2% of the total. Other species, such as Bacillus pichinotyi (0.06%), Lysinibacillus xylanilyticus (0.08%), and Rossellomorea aquimaris (0.06%), were found only in the PMAR sample in low proportions (Table 3 and Figure 1). As for the genus Rossellomorea, it has Gram-positive or Gram-variable aerobic bacteria that are rod-shaped and endospore-forming [74]. No links between species of the genus Rossellomorea and pathogenic actions have been reported.
The PMAR sample stood out for its greater species diversity, containing six of the seven species identified, in addition to presenting the highest total relative abundance (59.8%). On the other hand, the PMED sample presented the lowest diversity, with only two species detected, and the lowest total relative abundance (5.0%), approximately. The predominance of the Bacillus subtilis group in PMCLE and PMED, as well as the high abundance of Lysinibacillus fusiformis in PMAR, indicate distinct microbial profiles, which may be related to the particular characteristics of each environment or substrate analyzed (Table 3 and Figure 1). According to Ahmed et al. [75], bacteria of the genus Lysinibacillus are Gram-positive, have a rod shape, and demonstrate the formation of ellipsoidal or spherical endospores. During the literature review, no data were found regarding pathogenicity linked to this genus.
These results show marked differences in bacterial composition between samples, suggesting that environmental factors or the specific conditions of each sample may influence the presence and abundance of species, especially for bacteria with pathogenic potential. Furthermore, the presence of these microorganisms may be associated with environmental factors, the honey production process, or the microbiota of the producing bees, aspects that require further investigation for a more detailed understanding of the microbial dynamics in this ecosystem. In addition, it is necessary to improve the legislation and control parameters developed in the country to verify bacterial contamination in honey sold in the national territory.
Figure 2 shows the phylogenetic relationship between the sequences isolated from the samples and those obtained from the NCBI sequence bank. Two main clades can be observed, the first with the grouping of B. cereus sequences (yellow) and the second, with a larger grouping, with the other species (green, blue, and black), showing a genetic distance between the two groups.
Three subclades were formed in the larger cluster, the first (blue) consisting of the species L. fusiformis and L. xylanilyticus, which present genetic proximity and both belong to the bacterial community of the PMAR sample. The second subgroup, marked in green, consists only of sequences of the species B. subtilis from the PMCLE and PMED samples. A separation, within the same subclade, of the bacteria obtained from the PMED sample was observed, evidencing the emergence of a new strain. Interestingly, the sequences of the aforementioned species identified in the PMAR sample grouped separately, forming the black subclade, presenting greater evolutionary similarity with other species. This profile indicates that these isolates are different strains from those found in the PMCLE and PMED samples. The black cluster presented the greatest heterogeneity of species: B. pichinotyi, B. pumilus, B. subtilis, and R. aquimaris.

3.4. Search for Resistance and Virulence Genes in Reference Genomes

Based on the species found, virulence and resistance analyses were carried out to find the genes present and understand the relationship between these species and their potential pathogenicity. For the first cluster map (A) in Figure 3, genes related to the virulence of these bacteria were analyzed. Genes such as clpC, clpP, tufA, and groEL were found in all species analyzed and are related to stress-survival and adherence functions.
In Figure 3A, the relationship (red) between the species (vertically) and each gene found (horizontally) can be observed for the virulence analyses performed against the VFDB database. In B, the relationship (blue) between the species (vertically) and each gene found (horizontally) for resistance analyses performed against the CARD database can be observed. Both the blue and red shades in the figure are representative of the Euclidean similarity distance calculated by the software. In addition, some genes, mainly found in B. cereus and Lysinibacillus, were considered exotoxins, such as cytK, nheA, nheB, nheC, hblA, hblC, hblD, and alo. Most of the other genes were found only in B. cereus and have different functions such as exoenzymes and, above all, genes related to the metabolic and nutritional factors of this organism [78].
As for the second cluster map (B) in Figure 3, we did not find any genes that were present in all the strains, nor did the Rossellomorea aquimaris species show any antimicrobial resistance genes. The species B. cereus and B. subtilis were the ones that showed the most antimicrobial resistance genes, with genes mainly related to antibiotic efflux (blt, lmrB, ykkC, ykkD, bmr and tet(L)) and antibiotic inactivation (mphK, aadK, BcI, BcII, FosB, SatA, and rphB) [79].
Although these databases do not cover all possible types of genes that may be linked to virulence and resistance in these species, this analysis allows us to correlate the findings of these species with our 16S sequencing data. Based on this, we can see that these genes are slightly less present in Bacillus species, such as B. cereus, B. subitilis, and B. pumilus, than in the other two, agreeing with the literature, and that they assume the role of being the most virulent and resistant of the group studied. B. cereus presented most of the genes for both cases studied; this may facilitate the explanation of why these organisms were found to be pathogenic by Jiménez et al. [66] and Krame and Gilbert [80]. In the case of B. pumilus in our analysis, the presence of pumilacidin, found by From et al. [68] and cited above, was not found, but should be taken into account due to the other genes found in the analysis.

4. Conclusions

In summary, this study provides a comprehensive analysis of the physicochemical, microbiological, and bacterial composition characteristics of commercial honey samples from southern Brazil. Physicochemical analyses revealed that all samples complied with established quality standards, indicating their good quality and the absence of adulteration. The honey samples presented acceptable levels of acidity, moisture, ash, and insoluble solids, with no evidence of contamination by substances such as sugar syrups or starch, as confirmed by the Lund, Fiehe, and Lugol reactions. These results reinforce the authenticity and high quality of honey produced in the region, increasing consumer confidence and market value.
Microbiological analyses indicated the absence of pathogenic bacteria and low total coliform counts, in compliance with MERCOSUL regulations. However, three samples exceeded the permitted limits for molds and yeasts, highlighting the need for improvements in hygiene practices during honey collection and processing to prevent microbial contamination and ensure product stability.
The metabarcoding analysis identified a bacterial community composed of the Bacillaceae family, particularly the genera Bacillus, Lysinibacillus, and Rossellomorea. Notably, pathogenic species such as the Bacillus cereus group and Bacillus pumilus were detected, raising concerns about potential public health risks associated with honey consumption. The presence of these bacteria suggests that environmental factors, production practices, or the bee microbiota may influence the microbial composition of honey. Furthermore, in silico analysis of virulence and antimicrobial resistance genes revealed that Bacillus cereus and Bacillus subtilis harbored genes associated with toxin production and antibiotic resistance, which could pose additional health risks.
In conclusion, this study highlights the need for the implementation of advanced molecular techniques, such as NGS, for routine microbial analysis, since traditional methods are focused on specific bacterial species. Future research should focus on understanding the factors that influence microbial contamination in honey and developing strategies to mitigate these risks, thus contributing to the sustainability and growth of the beekeeping sector.

Author Contributions

Conceptualization: F.B., A.M.G. and W.d.C.O.; Data Curation: A.S.d.F. and W.d.C.O.; Formal Analysis: F.B., A.G.F., J.A.S., A.S.d.F., A.B. and W.d.C.O.; Funding Acquisition: A.M.G.; Investigation: F.B., A.M.G., J.A.S., A.B., M.B.P.P.O. and W.d.C.O.; Methodology: F.B., A.M.G., A.G.F., J.A.S., A.S.d.F., A.B. and W.d.C.O.; Project Administration: W.d.C.O.; Resources: A.M.G. and W.d.C.O.; Software: A.G.F. and A.S.d.F.; Supervision: W.d.C.O.; Validation: F.B., A.S.d.F. and W.d.C.O.; Visualization: F.B., A.M.G., A.G.F., J.A.S., A.B., M.B.P.P.O. and W.d.C.O.; Writing—Original Draft: F.B., A.M.G., A.G.F., J.A.S., A.S.d.F. and W.d.C.O.; Writing—Review and Editing: F.B., A.M.G., J.A.S., A.S.d.F., A.B., M.B.P.P.O. and W.d.C.O. All authors have read and agreed to the published version of the manuscript.

Funding

This work was supported by Pró-reitoria de Pesquisa, Inovação e Pós-graduação—PROPESP (IFSul), grant number PE04210621/056, for financial support.

Institutional Review Board Statement

Not applicable.

Informed Consent Statement

Not applicable.

Data Availability Statement

All raw reads were deposited in Sequencing Read Archive (SRA) under the project number PRJNA1276025.

Conflicts of Interest

The authors declare no conflicts of interest.

References

  1. FAO; WHO. Revised Codex Standard for Honey. In Codex Alimentarius; FAO: Rome, Italy, 2001. [Google Scholar]
  2. Silva, M.S.; Rabadzhiev, Y.; Eller, M.R.; Iliev, I.; Ivanova, I.; Santana, W.C. Microorganisms in Honey. Honey Anal. 2017, 500, 233–257. [Google Scholar] [CrossRef]
  3. Escuredo, O.; Dobre, I.; Fernández-González, M.; Seijo, M.C. Contribution of Botanical Origin and Sugar Composition of Honeys on the Crystallization Phenomenon. Food Chem. 2014, 149, 84–90. [Google Scholar] [CrossRef] [PubMed]
  4. FAO. FAOSTAT; Food and Agriculture Organization of the United Nations (FAO): Rome, Italy, 2025. [Google Scholar]
  5. Brasil Tabela 74: Produção de Origem Animal, Por Tipo de Produto. Available online: https://sidra.ibge.gov.br/tabela/74 (accessed on 15 January 2025).
  6. Wolff, L.F. Apicultura Sustentável Na Propriedade Familiar de Base Ecológica. In Embrapa Clima Temperado. Circular Técnica; Embrapa Clima Temperado: Pelotas, Brazil, 2007; Volume 64. [Google Scholar]
  7. Hung, K.-L.J.; Kingston, J.M.; Albrecht, M.; Holway, D.A.; Kohn, J.R. The Worldwide Importance of Honey Bees as Pollinators in Natural Habitats. Proc. R. Soc. B Biol. Sci. 2018, 285, 20172140. [Google Scholar] [CrossRef] [PubMed]
  8. Paxton, R. Conserving Wild Bees. Bee World 1995, 76, 53–55. [Google Scholar] [CrossRef]
  9. Guimarães, N.P. Apicultura, a Ciência Da Longa Vida; Itatiaia Ltda: Belo Horizonte, Brazil, 1989. [Google Scholar]
  10. de Freitas Barbosa, W.; Khan, A.; Silva, L. Technological Level and Profitability Honey Production from Bees (Apis mellifera) in Ceará. Rev. De Econ. E Sociologia Rural 2004, 42, 171–188. [Google Scholar] [CrossRef]
  11. Barbosa, W.d.F.; de Sousa, E.P. Nível Tecnológico e Seus Determinantes Na Apicultura Cearense. Rev. De Política Agrícola 2013, 22, 32–47. [Google Scholar]
  12. Brasil Agência Nacional de Vigilância Sanitária (ANVISA). Instrução Normativa No 160, de 1 de Julho de 2022. Estabelece Os Limites Máximos Tolerados (LMT) de Contaminantes Em Alimentos; Brasil Agência Nacional de Vigilância Sanitária (ANVISA): Brasília, Brazil, 2022.
  13. Brasil. Ministério da Agricultura e Pecuária. Mapa do Leite. Available online: https://www.gov.br/agricultura/pt-br/assuntos/producao-animal/mapa-do-leite/mapa-do-leite (accessed on 1 November 2023).
  14. Brasil Ministério da Agricultura, Pecuária e Abastecimento (MAPA). Instrução Normativa n.° 11, de 20 de Outubro de 2000—Regulamento Técnico de Identidade e Qualidade do Mel; Brasil Ministério da Agricultura, Pecuária e Abastecimento (MAPA): Brasília, Brazil, 2000.
  15. Lutz, I.A. Métodos Físico-Químicos Para Análise de Alimentos; ANVISA: São Paulo, Brazil, 2008; p. 1020. [Google Scholar]
  16. Souza, P.; Pacheco, L.; Souza, L.; Silva Filho, M.; Rosário, A.; Moura Júnior, J.; Tavares, Z.; Negrão, C.; Souza, E.; Silva, A. Ciência e Tecnologia de Alimentos: Pesquisa e Práticas Contemporâneas; Científica Digital: São Paulo, Brazil, 2021; pp. 469–476. [Google Scholar]
  17. White, J.W., Jr.; Subers, M.H.; Schepartz, A.I. Identification of Inhibin, the Antibacterial Factor in Honey, as Hydrogen Peroxide and Its Origin in The Glucose Oxidase System of Honey. Acta Enzym. 1963, 75, 57–70. [Google Scholar]
  18. Malika, N.; Mohamed, F.; Chakib, E.A. Antimicrobial Activities of Natural Honey from Aromatic and Medicinal Plants on Antibio-Resistant Strains of Bacteria. Int. J. Agric. Biol. 2004, 6, 289–293. [Google Scholar]
  19. Wen, Y.; Wang, L.; Jin, Y.; Zhang, J.; Su, L.; Zhang, X.; Zhou, J.; Li, Y. The Microbial Community Dynamics During the Vitex Honey Ripening Process in the Honeycomb. Front. Microbiol. 2017, 8, 1649. [Google Scholar] [CrossRef]
  20. Roxo, I.; Amaral, A.; Portugal, A.; Trovão, J. A Preliminary Metabarcoding Analysis of Portuguese Raw Honeys. Arch. Microbiol. 2023, 205, 386. [Google Scholar] [CrossRef]
  21. Luca, L.; Pauliuc, D.; Oroian, M. Honey Microbiota, Methods for Determining the Microbiological Composition and the Antimicrobial Effect of Honey—A Review. Food Chem. X 2024, 23, 101524. [Google Scholar] [CrossRef]
  22. Sinacori, M.; Francesca, N.; Alfonzo, A.; Cruciata, M.; Sannino, C.; Settanni, L.; Moschetti, G. Cultivable Microorganisms Associated with Honeys of Different Geographical and Botanical Origin. Food Microbiol. 2014, 38, 284–294. [Google Scholar] [CrossRef] [PubMed]
  23. Alippi, A.M.; Abrahamovich, E. HiCrome Bacillus Agar for Presumptive Identification of Bacillus and Related Species Isolated from Honey Samples. Int. J. Food Microbiol. 2019, 305, 108245. [Google Scholar] [CrossRef] [PubMed]
  24. López, A.C.; Alippi, A.M. Feasibility of Using RFLP of PCR-Amplified 16S rRNA Gene(s) for Rapid Differentiation of Isolates of Aerobic Spore-Forming Bacteria from Honey. J. Microbiol. Methods 2019, 165, 105690. [Google Scholar] [CrossRef] [PubMed]
  25. Xiong, Z.R.; Sogin, J.H.; Worobo, R.W. Microbiome Analysis of Raw Honey Reveals Important Factors Influencing the Bacterial and Fungal Communities. Front. Microbiol. 2023, 13, 1099522. [Google Scholar] [CrossRef]
  26. Mercosul. GMC/RES—Regulamento Técnico MERCOSUL de Identidade e Qualidade do Mel; Mercosul: Montevideo, Uruguay, 1994. [Google Scholar]
  27. Bo, J.; Qiongqiong, L.; Zhihua, Z.; Jiali, D.; Feng, Q.; Meicheng, Y. Analysis of Contaminated Microorganisms in Commercial Honey. Shanghai J. Prev. Med. 2022, 34, 77–80. [Google Scholar]
  28. Governo do Estado do Rio Grande do Sul Geografia. Available online: https://estado.rs.gov.br/geografia (accessed on 27 May 2025).
  29. ISO 6611:2004; Milk and Milk Products—Enumeration of Colony-Forming Units of Yeasts and/or Moulds—Colony-Count Technique at 25 °C. International Organization for Standardization (ISO): Geneva, Switzerland, 2004.
  30. Salfinger, Y.; Tortorello, M.L. (Eds.) Compendium of Methods for the Microbiological Examination of Foods; American Public Health Association: Washington, DC, USA, 2015. [Google Scholar]
  31. ISO 4831:2006; Microbiology of Food and Animal Feeding Stuffs—Horizontal Method for the Detection and Enumeration of Coliforms—Most Probable Number Technique. International Organization for Standardization (ISO): Geneva, Switzerland, 2006.
  32. AOAC International. AOAC Official Method 2011.03—Salmonella in Variety of Food. VIDAS® Salmonella; AOAC International: Rockville, MD, USA, 2011. [Google Scholar]
  33. ISO 6579-1:2017; Microbiology of the Food Chain—Horizontal Method for the Detection, Enumeration and Serotyping of Salmonella—Part 1: Detection of Salmonella Spp. International Organization for Standardization (ISO): Geneva, Switzerland, 2020.
  34. Association Française de Normalisation (AFNOR). VIDAS Listeria Monocytogenes II (VIDAS LM02). Ref. 30704 Enrichment Stage at 37 °C, 12/11–03/04; AFNOR: La Plaine Saint-Denis, France, 2010. [Google Scholar]
  35. ISO 11290-1:2017; Microbiology of the Food Chain—Horizontal Method for the Detection and Enumeration of Listeria monocytogenes and of Listeria spp.—Part 1: Detection Method. International Organization for Standardization (ISO): Geneva, Switzerland, 2017.
  36. ISO 16649-3:2015; Microbiology of the Food Chain—Horizontal Method for the Enumeration of Beta-Glucuronidase Positive Escherichia coli—Part 3: Detection and Most Probable Number Technique Using 5-Bromo-4-Chloro-3-Indolyl-β-D-Glucuronide. ISO: Geneva, Switzerland, 2025.
  37. ISO 6888-1:2021; Microbiology of the Food Chain—Horizontal Method for Enumerating Coagulase-Positive Staphylococci (Staphylococcus aureus and Other Species)—Part 1: Method Using Baird-Parker Agar Medium. International Organization for Standardization (ISO): Geneva, Switzerland, 2021.
  38. Erhardt, M.M.; de Castro Oliveira, W.; Fröder, H.; Marques, P.H.; Oliveira, M.B.P.P.; dos Santos Richards, N.S.P. Lactic Bacteria in Artisanal Cheese: Characterization through Metagenomics. Fermentation 2023, 9, 41. [Google Scholar] [CrossRef]
  39. Caporaso, J.G.; Lauber, C.L.; Walters, W.A.; Berg-Lyons, D.; Huntley, J.; Fierer, N.; Owens, S.M.; Betley, J.; Fraser, L.; Bauer, M.; et al. Ultra-High-Throughput Microbial Community Analysis on the Illumina HiSeq and MiSeq Platforms. ISME J. 2012, 6, 1621–1624. [Google Scholar] [CrossRef]
  40. Wang, Y.; Qian, P.-Y. Conservative Fragments in Bacterial 16S rRNA Genes and Primer Design for 16S Ribosomal DNA Amplicons in Metagenomic Studies. PLoS ONE 2009, 4, e7401. [Google Scholar] [CrossRef]
  41. Kumar, S.; Stecher, G.; Li, M.; Knyaz, C.; Tamura, K. MEGA X: Molecular Evolutionary Genetics Analysis across Computing Platforms. Mol. Biol. Evol. 2018, 35, 1547–1549. [Google Scholar] [CrossRef]
  42. Pedroso, M.A.P.; de Castro Oliveira, W.; Felice, A.G.; Cunha, S.C.S.; Oliveira, M.B.P.P.; dos Santos Richards, N.S.P. Pathogenic and Harmful Bacteria in Dairy Technology: Genomic Characterization and Its Correlation with Physicochemical Parameters of Sheep’s Cheese Sold in Southern Brazil. Fermentation 2024, 10, 397. [Google Scholar] [CrossRef]
  43. Rodrigues, D.L.N.; Ariute, J.C.; Rodrigues da Costa, F.M.; Benko-Iseppon, A.M.; Barh, D.; Azevedo, V.; Aburjaile, F. PanViTa: Pan Virulence and resistance Analysis. Front. Bioinform. 2023, 3, 1070406. [Google Scholar] [CrossRef] [PubMed]
  44. Bertoldi, F.C.; dos Reis, V.D.A.; Gonzaga, L.V.; Congro, C.R. Caracterização Físico-Química E Sensorial de Amostras de Mel de Abelhas Africanizadas (Apis mellifera L.) produzidas no pantanal. Evidencia 2007, 7, 63–74. [Google Scholar]
  45. Vieira, T.R.; Noguez, C.S.; dos Santos, M.A.; Wagner, S.A. Caracterização Físico-Química e Botânica Do Mel de Abelhas Sem Ferrão (Meliponini), de Ocorrência No Vale Do Taquari–RS, Objetivando Edição de RTIQ. Res. Soc. Dev. 2023, 12, e29312340846. [Google Scholar] [CrossRef]
  46. da Cruz Antonio, J.; Tiecher, A. Caracterização Físico-Química de Méis Produzidos no Município de Itaqui—RS. In Proceedings of the 5th Simpósio de Segurança Alimentar: Alimentação e Saúde, Bento Gonçalves, Brazil, 26–29 May 2015; pp. 1–4. [Google Scholar]
  47. Brasil Ministério da Agricultura, Pecuária e Abastecimento (MAPA). Portaria n.° 795, de 10 de Maio de 2023—Define as Normas Higiênico Sanitárias e Tecnológicas Para os Estabelecimentos que Elaborem Produtos de Abelhas e Seus Derivados; Brasil Ministério da Agricultura, Pecuária e Abastecimento (MAPA): Brasília, Brazil, 2023.
  48. Cecchi, H.M. Fundamentos Teóricos e Práticos em Análise de Alimentos; Editora da UNICAMP: Campinas, Brazil, 2003; Volume 2, ISBN 85-268-1472-9. [Google Scholar]
  49. Silva, P.A.M. Qualidade dos Produtos da Abelha. In Seminário Nordestino Pecuário, 7th ed.; Federação da Agricultura e Pecuária do Estado do Ceará: Fortaleza, Brazil, 2003; pp. 7–8. [Google Scholar]
  50. Venturini, K.S.; Sarcinelli, M.F.; da Silva, L.C. Características do Mel. In Boletim Técnico da Universidade Federal do Espírito Santo; UFES: Vitória, Brazil, 2007. [Google Scholar]
  51. de Lima da Silva, B. Diagnóstico do Sistema de Producão e Qualidade do Mel de Apis mellifera. Master’s Thesis, Universidade Federal de Viçosa, Viçosa, Brazil, 26 February 2007. [Google Scholar]
  52. Albuquerque, J.C.G.; Sobrinho, M.E.; de Lima Lins, T.C. Análise da Qualidade do Mel de Abelha Comercializado Com e Sem Inspeção na Região de Brasília-DF, Brasil. Semin. Ciênc. Biól. Saúde 2021, 42, 71–80. [Google Scholar] [CrossRef]
  53. Gois, G.C.; Lima, C.A.B.; Silva, L.T.; Evangelista-Rodrigues, A. Composição do Mel de Apis mellifera: Requisitos de qualidade. Acta Vet. Bras. 2013, 7, 137–147. [Google Scholar]
  54. İstanbullugil, F.R.; Taş, N.; Acaröz, U.; Arslan-acaroz, D.; Çakmak, Ö.; Evrenkaya, S.; Gürler, Z. A Review on the Antimicrobial Effect of Honey on Salmonella and Listeria monocytogenes: Recent Studies. Manas J. Agric. Vet. Life Sci. 2023, 13, 210–225. [Google Scholar] [CrossRef]
  55. Almasaudi, S.B.; Al-Nahari, A.A.M.; Abd El-Ghany, E.S.M.; Barbour, E.; Al Muhayawi, S.M.; Al-Jaouni, S.; Azhar, E.; Qari, M.; Qari, Y.A.; Harakeh, S. Antimicrobial Effect of Different Types of Honey on Staphylococcus aureus. Saudi J. Biol. Sci. 2017, 24, 1255–1261. [Google Scholar] [CrossRef]
  56. Al-Ghamdi, S.; Alsulami, T.; Alshamri, G.; Ahmed, M.; Ibrahim, M.; Husain, F.M.; Alameen, A.A.; Fulleros, R.; Elamin, W. Physicochemical Properties of Honey and Honey-Like Foods and Their Impact on E. coli Survival: A comparative study. Food Chem. Adv. 2025, 6, 100891. [Google Scholar] [CrossRef]
  57. Vázquez-Quiñones, C.R.; Moreno-Terrazas, R.; Natividad-Bonifacio, I.; Quiñones-Ramírez, E.I.; Vázquez-Salinas, C. Microbiological Assessment of Honey in México. Rev. Argent. Microbiol. 2018, 50, 75–80. [Google Scholar] [CrossRef]
  58. Iurlina, M.O.; Fritz, R. Characterization of Microorganisms in Argentinean Honeys from Different Sources. Int. J. Food Microbiol. 2005, 105, 297–304. [Google Scholar] [CrossRef]
  59. Pereira, A.P.R. Caracterização de Mel Com Vista à Produção de Hidromel. Master’s Thesis, Instituto Politécnico de Bragança, Escola Superior Agrária de Bragança, Bragança, Portugal, 2008. [Google Scholar]
  60. Pereira, I.A.; Teixeira, F.M.; Finger, R.M.; de Azevedo Souza, M. Microbiological Quality of Honey Market in North-Centre of Rio de Janeiro. Rev. Cienc. Agrovet. 2024, 23. [Google Scholar] [CrossRef]
  61. Oliveira, E.G.; Nascimento, A.R.; Costa, M.C.P.; Monteiro Neto, V. Qualidade microbiológica do mel de tiúba (Melipona Compressipes Fasciculata) Produzido no ESTADO do Maranhão. Hig. Aliment. 2005, 92–99. [Google Scholar]
  62. Balzan, S.; Carraro, L.; Merlanti, R.; Lucatello, L.; Capolongo, F.; Fontana, F.; Novelli, E.; Larini, I.; Vitulo, N.; Cardazzo, B. Microbial Metabarcoding Highlights Different Bacterial and Fungal Populations in Honey Samples from Local Beekeepers and Market in North-Eastern Italy. Int. J. Food Microbiol. 2020, 334, 108806. [Google Scholar] [CrossRef]
  63. Bovo, S.; Utzeri, V.J.; Ribani, A.; Cabbri, R.; Fontanesi, L. Shotgun Sequencing of Honey DNA Can Describe Honey Bee Derived Environmental Signatures and the Honey Bee Hologenome Complexity. Sci. Rep. 2020, 10, 9279. [Google Scholar] [CrossRef]
  64. Jacinto-Castillo, D.F.; Canto, A.; Medina-Medina, L.A.; O’Connor-Sánchez, A. Living in Honey: Bacterial and Fungal Communities in Honey of Sympatric Populations of Apis mellifera and the Stingless Bee Melipona beecheii, in Yucatan, Mexico. Arch. Microbiol. 2022, 204, 718. [Google Scholar] [CrossRef]
  65. Økstad, O.A.; Kolstø, A.-B. Genomics of Bacillus Species. In Genomics of Foodborne Bacterial Pathogens; Wiedmann, M., Zhang, W., Eds.; Springer: New York, NY, 2011; pp. 29–53. ISBN 978-1-4419-7686-4. [Google Scholar]
  66. Jiménez, G.; Urdiain, M.; Cifuentes, A.; López-López, A.; Blanch, A.R.; Tamames, J.; Kämpfer, P.; Kolstø, A.-B.; Ramón, D.; Martínez, J.F.; et al. Description of Bacillus toyonensis sp. nov., a Novel Species of the Bacillus cereus group, and Pairwise Genome Comparisons of the Species of the Group by Means of ANI Calculations. Syst. Appl. Microbiol. 2013, 36, 383–391. [Google Scholar] [CrossRef]
  67. Østensvik, Ø.; From, C.; Heidenreich, B.; O’sullivan, K.; Granum, P. Cytotoxic Bacillus Spp. Belonging to the B. Cereus and B. Subtilis Groups in Norwegian Surface Waters. J. Appl. Microbiol. 2004, 96, 987–993. [Google Scholar] [CrossRef]
  68. From, C.; Hormazabal, V.; Granum, P.E. Food Poisoning Associated with Pumilacidin-Producing Bacillus pumilus in Rice. Int. J. Food Microbiol. 2007, 115, 319–324. [Google Scholar] [CrossRef]
  69. Jay, J.M.; Loessner, M.J.; Golden, D.A. (Eds.) Food Poisoning Caused by Gram-Positive Sporeforming Bacteria. In Modern Food Microbiology; Springer: Boston, MA, USA, 2005; pp. 567–590. ISBN 978-0-387-23413-7. [Google Scholar]
  70. Bovo, S.; Ribani, A.; Utzeri, V.J.; Schiavo, G.; Bertolini, F.; Fontanesi, L. Shotgun Metagenomics of Honey DNA: Evaluation of a Methodological Approach to Describe a Multi-Kingdom Honey Bee Derived Environmental DNA Signature. PLoS ONE 2018, 13, e0205575. [Google Scholar] [CrossRef]
  71. Zhao, X.; Zhou, Z.; Han, Y.; Wang, Z.; Fan, J.; Xiao, H. Isolation and Identification of Antifungal Peptides from Bacillus BH072, a Novel Bacterium Isolated from Honey. Microbiol. Res. 2013, 168, 598–606. [Google Scholar] [CrossRef]
  72. Lopez, D.; Vlamakis, H.; Kolter, R. Generation of Multiple Cell Types in Bacillus subtilis. FEMS Microbiol. Rev. 2008, 33, 152–163. [Google Scholar] [CrossRef] [PubMed]
  73. Kovács, Á.T. Bacillus subtilis . Trends Microbiol. 2019, 27, 724–725. [Google Scholar] [CrossRef] [PubMed]
  74. Gupta, R.S.; Patel, S.; Saini, N.; Chen, S. Robust Demarcation of 17 Distinct Bacillus species Clades, Proposed as Novel Bacillaceae genera, by Phylogenomics and Comparative Genomic Analyses: Description of Robertmurraya kyonggiensis sp. nov. and Proposal for an Emended Genus Bacillus Limiting it Only to the Members of the Subtilis and Cereus Clades of Species. Int. J. Syst. Evol. Microbiol. 2020, 70, 5753–5798. [Google Scholar] [CrossRef]
  75. Ahmed, I.; Yokota, A.; Yamazoe, A.; Fujiwara, T. Proposal of Lysinibacillus boronitolerans gen. nov. sp. nov., and Transfer of Bacillus fusiformis to Lysinibacillus fusiformis comb. nov. and Bacillus sphaericus to Lysinibacillus sphaericus comb. nov. Int. J. Syst. Evol. Microbiol. 2007, 57, 1117–1125. [Google Scholar] [CrossRef]
  76. Saitou, N.; Nei, M. The Neighbor-Joining Method: A New Method for Reconstructing Phylogenetic Trees. Mol. Biol. Evol. 1987, 4, 406–425. [Google Scholar]
  77. Felsenstein, J. Confidence Limits on Phylogenies: An Approach Using the Bootstrap. Evolution 1985, 39, 783–791. [Google Scholar] [CrossRef]
  78. Liu, B.; Zheng, D.; Zhou, S.; Chen, L.; Yang, J. VFDB 2022: A General Classification Scheme for Bacterial Virulence Factors. Nucleic Acids Res. 2022, 50, D912–D917. [Google Scholar] [CrossRef]
  79. Alcock, B.P.; Huynh, W.; Chalil, R.; Smith, K.W.; Raphenya, A.R.; Wlodarski, M.A.; Edalatmand, A.; Petkau, A.; Syed, S.A.; Tsang, K.K. CARD 2023: Expanded Curation, Support for Machine Learning, and Resistome Prediction at the Comprehensive Antibiotic Resistance Database. Nucleic Acids Res. 2023, 51, D690–D699. [Google Scholar] [CrossRef]
  80. Kramer, J.M.; Gilbert, R.J. Bacillus cereus and other Bacillus species. Foodborne Bact. Pathog. 1989, 19, 21–70. [Google Scholar]
Figure 1. The abundance of bacterial species present in samples of honey produced in southern Brazil. The upper graph shows the abundance of species within each sample. The lower graph shows the relative abundance considering the total sum of the OTUs (15,736) of all the samples.
Microbiolres 16 00128 g001
Figure 2. A taxonomic tree of the genera identified in the bacterial microflora of honey produced in southern Brazil. The phylogenetic relationships between the sequences obtained through metagenomic sequencing using the phylogenetic marker located in the V3–V4 region of the 16S rRNA gene. Evolutionary analyses were conducted in MEGA X [41] and visualized graphically in the FigTree software v1. The evolutionary history was inferred using the Neighbor-Joining method [76]. The percentages of replicate trees in which associated taxa clustered in the bootstrap test (5000 replicates) are shown next to the branches. The tree is drawn to scale, with branch lengths in the same units as the evolutionary distances used to infer the phylogenetic tree. The evolutionary distances were computed using the Maximum Composite Likelihood method [77].
Microbiolres 16 00128 g002
Figure 3. Cluster maps of resistance and virulence genes from bacterial genome extracted from sequence bank generated by PanVita software, v1. (A) Resistance and (B) virulence genes.
Microbiolres 16 00128 g003
Table 1. Physicochemical attributes of honey produced in southern Brazil according to limits established by current legislation.
SampleAcidity (mEq/kg)pHHumidity (g/100 g)Ashes (g/100 g)Water-Insoluble Solids (g/100 g)Brix (°B)
PMOR31.45 ± 0.14.16 ± 0.016.73 ± 0.40.20 ± 0.00.12 ± 0.080.0 ± 0.0
PMSA28.85 ± 0.04.28 ± 0.015.23 ± 0.20.09 ± 0.00.06 ± 0.078.0 ± 0.0
PMED29.83 ± 0.04.11 ± 0.017.26 ± 0.70.14 ± 0.00.11 ± 0.076.0 ± 0.0
PMCLE26.55 ± 0.04.22 ± 0.016.69 ± 0.10.24 ± 0.00.08 ± 0.077.0 ± 0.0
PMDE33.47 ± 0.04.11 ± 0.017.88 ± 0.50.57 ± 0.00.08 ± 0.079.0 ± 0.0
PMNI31.15 ± 0.04.16 ± 0.016.90 ± 0.20.15 ± 0.00.06 ± 0.076.0 ± 0.0
PMVA24.90 ± 0.04.55 ± 0.019.22 ± 0.30.07 ± 0.00.08 ± 0.074.0 ± 0.0
PMCL26.16 ± 0.04.28 ± 0.017.77 ± 0.40.16 ± 0.00.05 ± 0.077.0 ± 0.0
PMBE29.32 ± 0.14.41 ± 0.018.43 ± 0.40.35 ± 0.00.07 ± 0.076.0 ± 0.0
PMRO25.48 ± 0.04.21 ± 0.018.45 ± 0.60.28 ± 0.00.08 ± 0.077.3 ± 0.0
PMAR26.54 ± 0.04.39 ± 0.018.90 ± 0.30.40 ± 0.00.06 ± 0.074.0 ± 0.4
PMRI22.44 ± 0.04.41 ± 0.015.72 ± 0.70.33 ± 0.00.10 ± 0.080.0 ± 0.0
Standard (Brasil, 2000)Max. 50-Max. 20Max. 0.6Max. 0.6-
Table 2. Microbiological attributes of honey produced in southern Brazil according to limits established by current legislation.
SampleSalmonella spp. (Absence/
Presence)
Listeria (Absence/
Presence)
E. coli (MPN/g)Molds and Yeasts (CFU/g)Total Coliforms (MPN/g)Thermotolerant Coliforms (MPN/g)S. coag. Positive (CFU/g)
PMORAbsenceAbsence0<1.0 × 101<1.0 × 101<1.0 × 101<1.0 × 101
PMSAAbsenceAbsence033.3 ± 15.6<1.0 × 101<1.0 × 101<1.0 × 101
PMEDAbsenceAbsence0<1.0 × 101<1.0 × 101<1.0 × 101<1.0 × 101
PMCLEAbsenceAbsence0<1.0 × 101<1.0 × 101<1.0 × 101<1.0 × 101
PMDEAbsenceAbsence0263.3 ± 31.1<1.0 × 101<1.0 × 101<1.0 × 101
PMNIAbsenceAbsence0630.0 ± 13.3<1.0 × 101<1.0 × 101<1.0 × 101
PMVAAbsenceAbsence096.7 ± 15.6<1.0 × 101<1.0 × 101<1.0 × 101
PMCLAbsenceAbsence0<1.0 × 101<1.0 × 101<1.0 × 101<1.0 × 101
PMBEAbsenceAbsence043.3 ± 17.8<1.0 × 101<1.0 × 101<1.0 × 101
PMROAbsenceAbsence085.7 ± 2.9<1.0 × 101<1.0 × 101<1.0 × 101
PMARAbsenceAbsence026.3 ± 1.1<1.0 × 101<1.0 × 101<1.0 × 101
PMRIAbsenceAbsence0<1.0 × 101<1.0 × 101<1.0 × 101<1.0 × 101
Table 3. Bacteria detected in honey samples sold in southern Brazil.
PhylumClassOrderFamilyGenusSpeciesAbundance
Relative
Sample
FirmicutesBacilliBacillalesBacillaceaeBacillusBacillus cereus group0.20%PMED
Bacilluspichinotyi0.06%PMAR
Bacillus pumilus8.54%PMED, PMAR, PMNI
Bacillus subtilis group32.73%PMED, PMAR, PMCLE
LysinibacillusLysinibacillusfusiformis58.33%PMAR
Lysinibacillus xylanilyticus0.08%PMAR
RossellomoreaRossellomorea aquimaris0.06%PMAR
Disclaimer/Publisher’s Note: The statements, opinions and data contained in all publications are solely those of the individual author(s) and contributor(s) and not of MDPI and/or the editor(s). MDPI and/or the editor(s) disclaim responsibility for any injury to people or property resulting from any ideas, methods, instructions or products referred to in the content.

