Article

The Effect of Heavy Metals on Microbial Communities in Industrial Soil in the Area of Piekary Śląskie and Bukowno (Poland)

by
Anna Katarzyna Jarosławiecka
* and
Zofia Piotrowska-Seget
Institute of Biology, Biochemistry and Environmental Protection, University of Silesia, Jagiellonska Street 28, 40-032 Katowice, Poland
*
Author to whom correspondence should be addressed.
Microbiol. Res. 2022, 13(3), 626-642; https://doi.org/10.3390/microbiolres13030045
Submission received: 22 July 2022 / Revised: 29 August 2022 / Accepted: 2 September 2022 / Published: 7 September 2022

Abstract

:
The aim of this study was to determine the activity and structure of microbial communities in soils contaminated with heavy metals (HMs). To achieve this goal, soil samples were taken from two contaminated sites (i.e., Piekary Śląskie and Bukowno) in Poland. A wide range of methods were applied, including: total and metal-tolerant culturable bacteria enumeration; microbial community structure analysis using the phospholipid fatty acid method (PLFA); denaturing gradient gel electrophoresis (PCR-DGGE); and metabolic activity using BIOLOG and EcoPlateTM. Our studies showed that HMs negatively affected microbial community structure and activity in polluted soils. Apart from the contamination with HMs, other soil parameters like soil pH and water also impacted microbial community structure and growth. Metal-tolerant bacterial strains were isolated, identified and tested for presence of genes encoding HM tolerance using the polymerase chain reaction (PCR) methodology. Contamination with HMs in the tested areas was found to lead to development of metallotolerant bacteria with multiple tolerances toward Zn, Ni, Cd and Cu. Different genes (e.g., czcA, cadA and nccA) encoding HM efflux pumps were detected within isolated bacteria. Culturable bacteria isolated belonged to Proteobacteria, Actinobacteria and Bacteroidetes genera. Among non-culturable bacteria in soil samples, a significant fraction of the total bacteria and phyla, such as Gemmatimonadetes and Acidobacteria, were found to be present in all studied soils. In addition, bacteria of the Chloroflexi genus was present in soil samples from Piekary Śląskie, while bacteria of the Firmicutes genus were found in soil samples from Bukowno.

1. Introduction

The environmental effects of heavy metals (HMs) have been studied for several years [1,2]. Nevertheless, despite various attempts to lower HM emissions, related environmental contamination remains a serious concern [3] because of their non-biodegradable nature and ability to accumulate in the food chain generating negative effects on human health [4]. As an example, cadmium accumulation in soil can be caused by natural processes, but is mainly the result of anthropogenic activities, including wastewater irrigation, fertilizers, agricultural usage of sewage sludge, smelting and mining [5]. Even microelements (e.g., copper, zinc and nickel) can become toxic to cells if their concentration exceeds cellular requirements [6].
Due to their size, ubiquity and key role in metabolic cycles, microorganisms are considered to be the best indicators of the effects of toxic compounds on soil [7]. The negative impacts of HMs on microbial communities in soil have been reported in several studies [8,9,10,11]. Heavy metals are well-known to lower/inhibit activity of soil enzymes as well as disturb carbon, nitrogen and organic matter transformation and reduce microorganism biodiversity and biomass [6], leading to dominance of specific HM-tolerating microorganisms in soils [12,13,14,15].
Bioremediation using microorganisms and their natural mechanisms responsible for tolerance/resistance to toxic metallic ions like intra and extracellular sequestration, active efflux from cells and reduction of HM ions is considered to be a very promising tool for HM removal/recovery in comparison with the conventional chemical and physical techniques, since it is an environmentally friendly (for example, retention of soil structure and no secondary pollution) and low-cost technique [6]. In particular, microbial biosorbents are very effective in removing contaminants, although other options such as bioleaching or phytoremediation are also available [6,16].
Many researchers are concerned about the environmental impact of untreated polluted areas, and various studies have been conducted to improve this situation and understanding on how microbial communities in areas contaminated with HMs are shaped and function [17,18,19] in order to further develop the optimal and most effective strategy for bioremediation [18,20,21,22].
The area selected for this study is described as a territory of ecological disaster and is located in the industrial region of Southern Poland. Both Mining and Metallurgical Plants ‘Waryński’ in Piekary Śląskie and ‘Bolesław’ in Bukowno were operating for over a century, leading to extensive contamination of soil with various HMs [23,24].
The aim of this study was to (1) determine the effects of HMs and other physicochemical properties of soils on microbial communities in industrial soils with a history of long-term contamination with various HMs; (2) evaluate the actual state of microbial diversity, metabolic activity and structure by culturable and non-culturable methods; (3) isolation and identification of strains potentially useful in bioremediation in this area, including tests on the presence of genes typically involved in HM efflux among those isolated.
The results obtained with this research can contribute to the development of eco-friendly bioremediation technology and monitoring of the environmental effect of soil pollution in this area.

2. Material and Methods

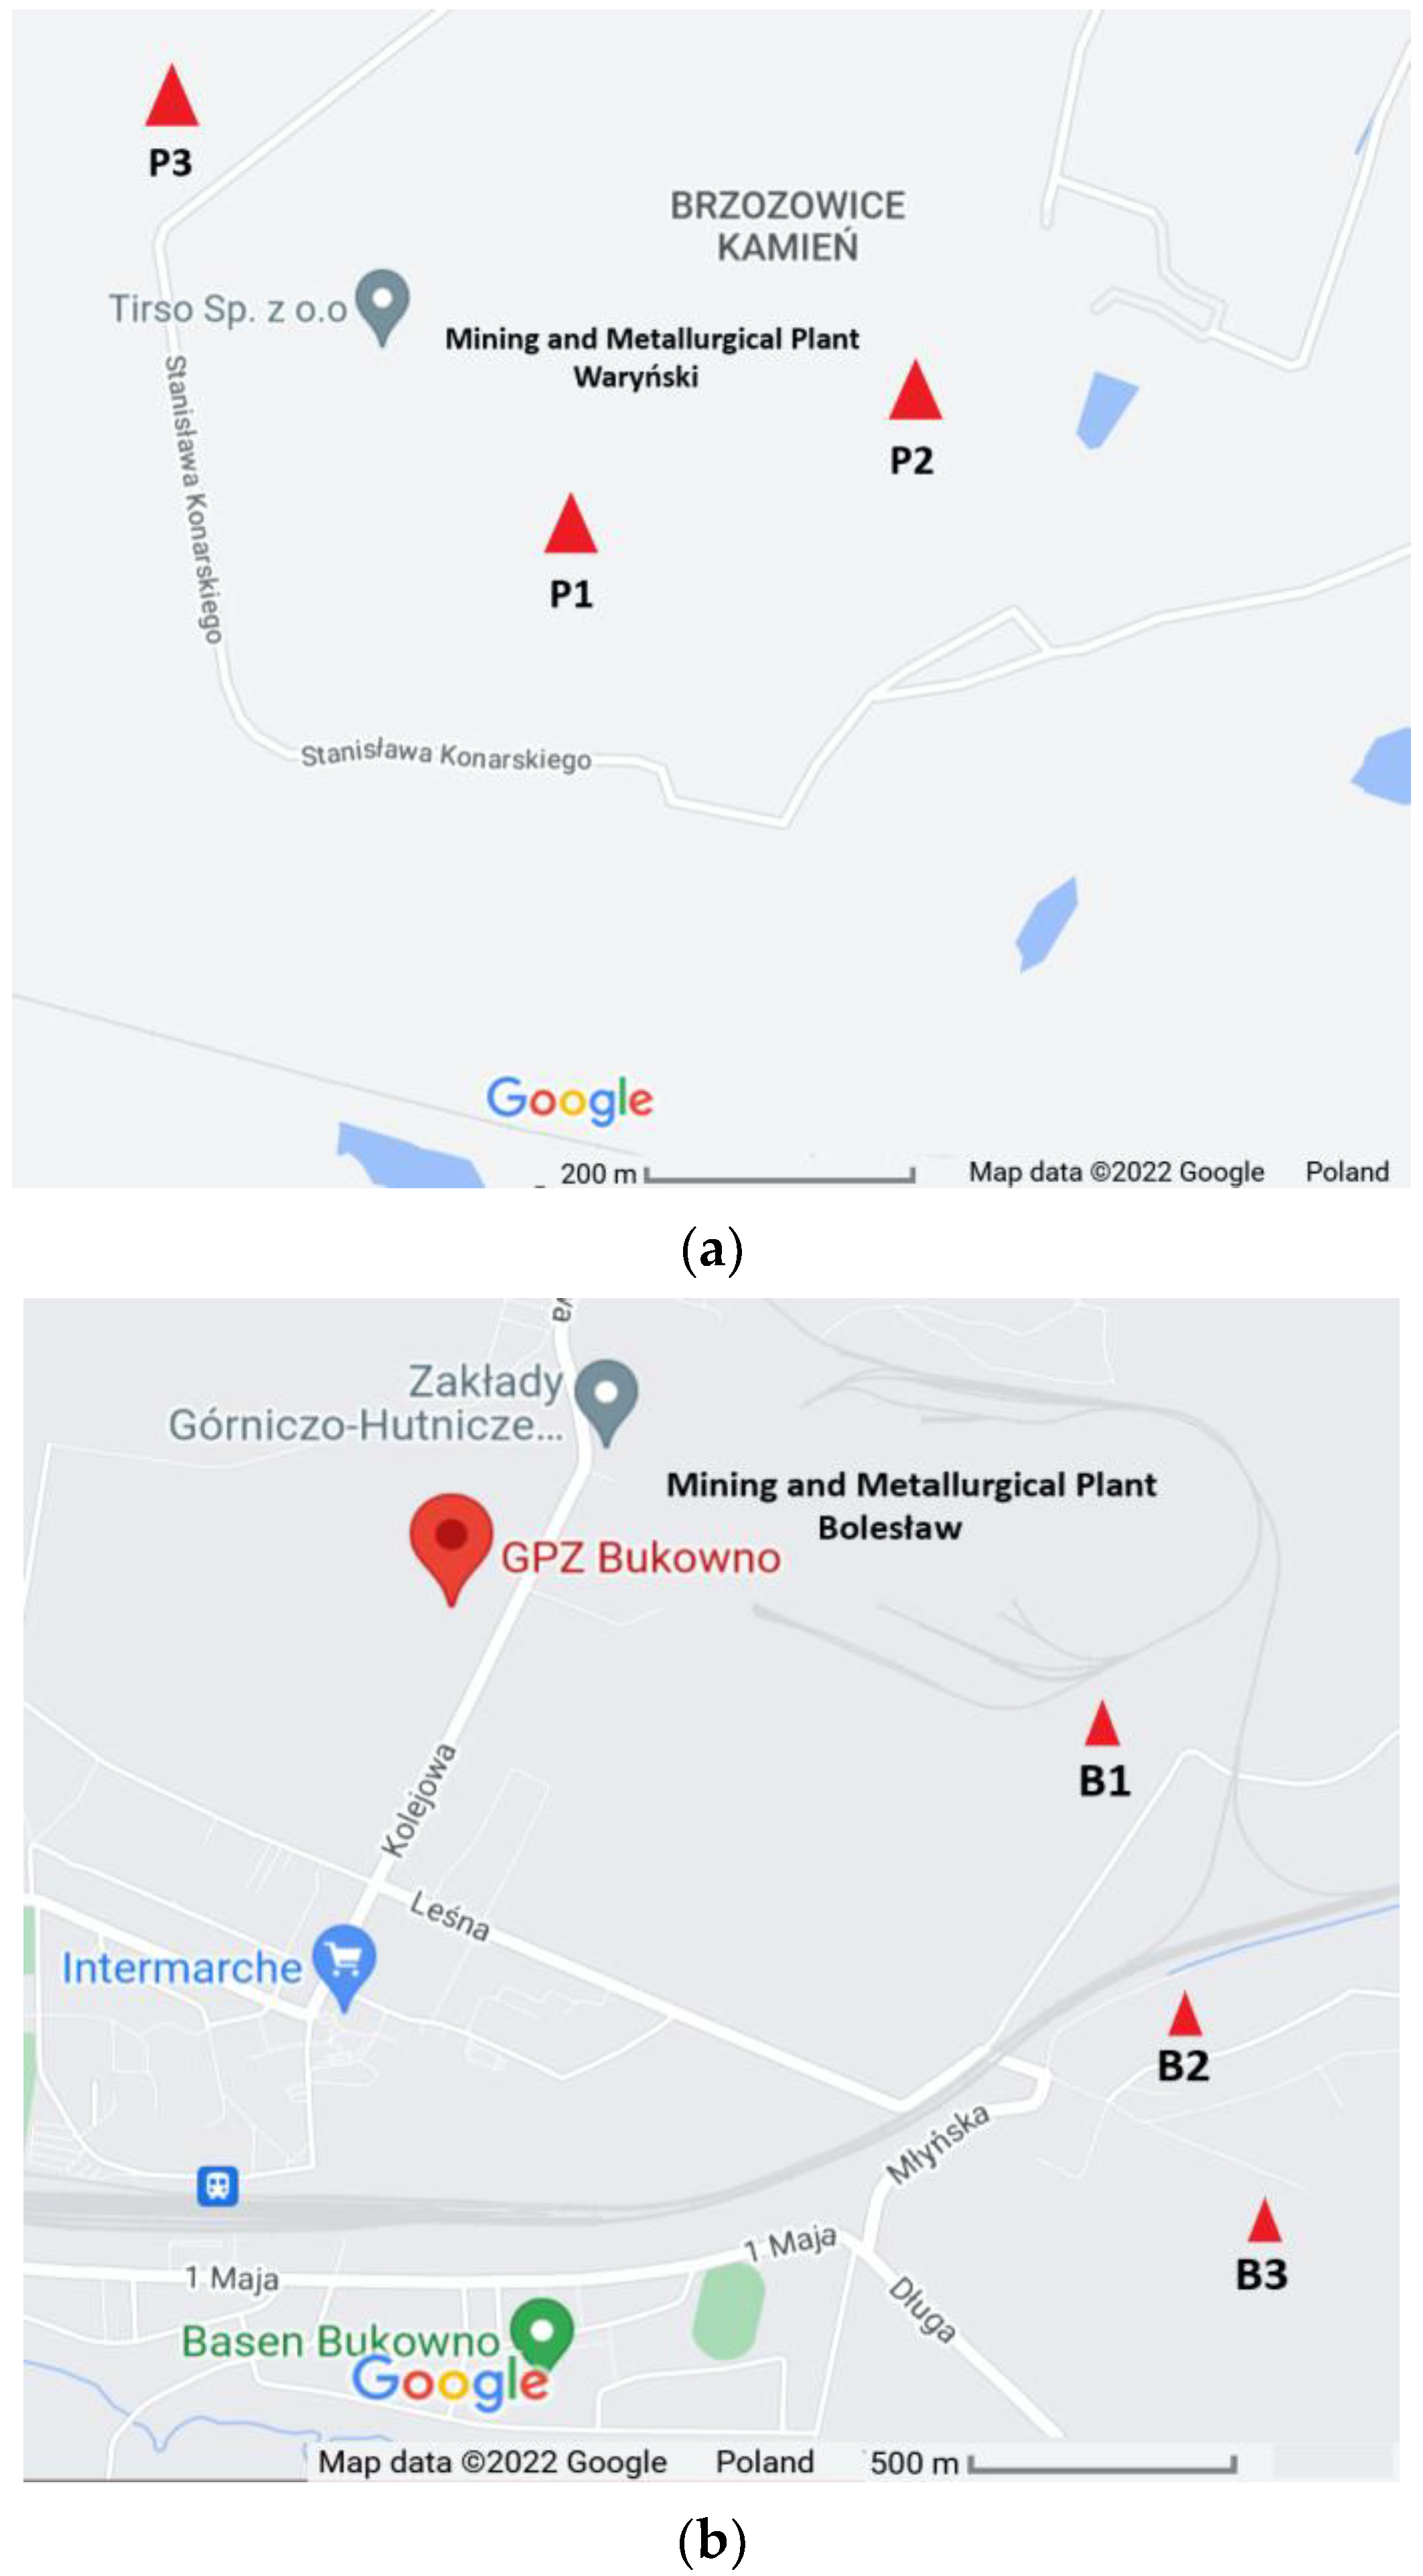
2.1. Soil Sample Collection

Soil samples were collected in the proximity of the former Mining and Metallurgical Plants ‘Waryński’ in Piekary Śląskie (Upper Silesia) and ‘Bolesław’ in Bukowno (Lesser Poland), Poland. Selected soil sampling sites were designed as P1 (50°21′54.4″ N, 18°58′02.5″ E), P2 (50°21′56.2″ N, 18°58′10.0″ E) and P3 (50°22′03.7″ N, 18°57′44.9″ E) in Piekary Śląskie and B1 (50°16′27″ N, 19°29′7″ E), B2 (50°16′4″ N, 19°29′13″ E) and B3 (50°15′51″ N, 19°29′22″ E) in Bukowno (Figure 1).
Five soil samples were taken from the top soil layer (0–0.2 m) from a 1 m × 1 m sampling area and pooled together to make a composite soil sample. The composite samples were transported to the laboratory, where the soil was air dried, sieved through a 2-mm mesh to remove the stones and plant debris and then stored at –20 °C until further use. All analyses were carried out in triplicate for every single soil sample.

2.2. Physicochemical Analysis

Different physicochemical soil parameters were analysed including granulometry, soil moisture, pH, soil organic matter (SOM), organic carbon, total nitrogen, total phosphorus, HM (Zn, Cd, Cu, and Ni) concentration and bioavailable forms, as well as K, P, Na, Mg and Ca.
Soil granulometry was determined using laser diffraction (Mastersizer 2000, Malvern Pananalytical, Malvern, UK) for particles ranging 0–1 mm in size and sieve analysis for particles above 1 mm. The soil samples were classified into a particular granulometric group according to PN-88/B-02480. The soil moisture content was determined in agreement with the ISO method 16586:2003 and soil pH was measured according to PN-ISO 10390:1997. The SOM and organic carbon were estimated using the Turin test [25].
Total nitrogen was quantified using colorimetry by the Slandi 300 (Slandi, Michałowice, Poland) photometer. The soil (0.2 g) was mixed with 2 mL of 30% H2O2 and left for 24 h. The sample was then boiled until complete evaporation of the solution. A volume of 20 mL of H2O was added to the residual precipitate and brought to the boil. After cooling and filtering through a qualitative filter in the solution, the concentration of ammonium, nitrite and nitrate were measured in the solution and the results were added to obtain the total nitrogen value in the dry mass of the soil sample.
To quantify phosphate (PO43−) and Na, K, Mg and Ca content, 0.5 g of soil sample was added to 3 mL of 60% HNO3. The suspension was mineralised in a microwave oven (Mars 5, CEM, Matthews, NC, USA). The resulting solution was diluted to 50 mL. The concentration of phosphate (PO43−) was measured using the colorimetric method on Slandi 300 (Slandi, Michałowice, Poland). The results were converted into phosphorus content in dry matter.
The concentration of Na, K, Mg and Ca were estimated using flame atomic absorption spectrometry (FAAS) (SavantAA Σ, GBC, Braeside, Melbourne, Australia). The results were given in mg/kg dry soil mass.
The total content of selected HMs (Cd, Zn, Ni and Cu) in soil was determined using FAAS (iCE 3500 FAAS, Thermo Fisher Scientific, Waltham, MA, USA). A quantity of 300 mg of soil was dried at 105 °C and then mineralised in a mixture of 8 mL 65% HNO3 and 2 mL H2O2 at 190 °C for 50 min using an Ethos Up microwave oven (Milestone, Sorisole, Italy). After mineralisation, the solutions were filtered on 0.45 µm filter paper and diluted in water and analysed by FAAS. Results were given in mg of metal per kg of dry soil and compared with Polish regulations for the maximum allowed concentration of HMs in soils (Regulation of the Minister of Environment, 9 September 2002 on Soil Quality Standards 2002; further RME 2002) for soil class B: Cd 4 mg/kg dry soil mass, Zn 300 mg/kg dry soil mass, Cu 100 mg/kg dry soil mass and Ni 70 mg/kg dry soil mass.
To quantify water-extractable HMs in soil or their bioavailable fraction (which is the amount of metal extracted from soil using 0.01 M CaCl2), 5 g of soil sample was dried at 105 °C and resuspended in 50 mL of DI water or 50 mL 0.01 M CaCl2 solution, respectively, and then shaken for 2 h at 120 rpm. The suspension was filtered through 0.45 µm filter and metal content was measured using FAAS (iCE 3500 FAAS, Thermo Fisher Scientific, Waltham, MA, USA). Results were given in mg of metal per kg of dry soil.

2.3. Culturable Bacteria Enumeration

The total number of heterotrophic (HB) and oligotrophic bacteria (OB), as well as metal-tolerant bacteria were determined by the plate method using tryptic soy agar (TSA) (BTL, Warsaw, Poland) and broth agar (BTL, Warsaw, Poland) for HB and 10% TSA (BTL, Warsaw, Poland) for OB. All plates were supplemented with 200 µg/mL Nystatin to avoid fungal contamination. The metal-tolerant fraction of culturable bacteria was determined on 1/10 TSA (BTL, Warsaw, Poland), TSA (BTL, Warsaw, Poland) and broth agar (BTL, Warsaw, Poland) plates supplemented with 1 mM CdCl2 (Sigma-Aldrich, Inc. St. Louis, MO, USA), 1 mM ZnCl2 (Sigma-Aldrich, Inc., St. Louis, MO, USA), 1 mM NiCl2 (Sigma-Aldrich, Inc., St. Louis, MO USA) or 1 mM CuCl2 (Sigma-Aldrich, Inc., St. Louis, MO, USA), respectively. The inoculated plates were incubated for 7 days at 22 °C. The number of bacteria was expressed as log of colony forming unit (CFU) per g of dry soil.

2.4. Total Bacteria Enumeration

The total bacterial count in soil was quantified using the 16S rRNA gene in real-time PCR. The template used for amplification was genomic DNA isolated from 2 × 0.5 g of soil using GeneMATRIX Soil DNA Purification Kit (EURx Ltd., Gdańsk, Poland) according to the producer’s protocol and combined as one sample.
A fragment of the 16S rRNA gene was amplified using primers pE (5′-AAA CTC AAA GGA ATT GAC GG-3′) and pF (5′-ACG AGC TGA CGA CAG CCA TG-3′) (Edwards et al., 1989). The reaction mixture (25 µL) consisted of 10 µL of LightCycler® 480 SYBR Green I Master (Roche Diagnostic GmbH, Mannheim, Germany), 1 µL of pE primer (100 µM dil. 1:10 v/v) (Sigma-Aldrich, Inc., St. Louis, MO, USA), 1 µL of pF primer (100 µM dil. 1:10 v/v) (Sigma-Aldrich, Inc., St. Louis, USA), 2 µL of DNA and 6 µL of H2O. The amplification conditions were: 95 °C for 10 min, 30 cycles of 10 s at 95 °C followed by annealing for 20 s at 57 °C and extension for 30 s at 72 °C. Fluorescence data were acquired at the end of each extension step at 81 °C to avoid detection of primer dimers. For the melting curve analysis of products, temperature was raised from 65 to 95 °C and the melting temperatures were determined using LightCycler® (Roche Diagnostic GmbH, Mannheim, Germany) following a modified procedure described elsewhere [26].
Amplification efficiency was estimated by serial dilution of the standard, which was a fragment of 16S rRNA cloned into the pTZ57R/T vector. The standard was prepared using a InsTAclone PCR Cloning Kit (Thermo Fisher Scientific, Waltham, MA, USA), following the manufacturer’s instructions. The 16S rRNA gene copies quantification was calculated as described in [27].

2.5. Total Microbial Activity Measurement

General microbial activity was determined according to a procedure described elsewhere [28] with minor modification: centrifugation of suspension at 2000 rpm for 3 min. The concentration of free fluorescein in the filtered solution was measured at 490 nm using a spectrophotometer (Helios Epsilon, Thermo Fisher Scientific, Waltham, MA, USA). A calibration curve was used to calculate the amount (in μg) of fluorescein per g of dried soil, which corresponds to enzymatic activity in the soil sample.

2.6. Metallotolerant Bacteria Isolation and Identification

Metallotolerant bacteria were isolated from soil samples using 1/10 TSA, TSA and BA media supplemented with 1 mM CdCl2 (Sigma-Aldrich, Inc., St. Louis, MO, USA)—to ensure metal-resistant bacteria isolation—and 200 µg/mL Nystatin (Sigma-Aldrich, Inc., St. Louis, MO, USA). After incubation for 5 days at 22 °C, morphologically different bacteria were taken for further studies. Strains were identified based on the 16S rRNA sequence. Genomic DNA was isolated using Genomic Mini (A&A Biotechnology, Gdańsk, Poland). The 16S rRNA fragment was amplified by PCR using 0.5 µL of starter 8F AGAGTTTGATCCTGGCTCAG (100 µM, dil. 1:10 v/v) (Sigma-Aldrich, Inc., St. Louis, MO, USA), 0.5 µL of starter 1492R GGTTACCTTGTTACGACTT (100 µM, dil. 1:10 v/v) (Sigma-Aldrich, Inc., St. Louis, MO, USA), 0.5 µL of polymerase DreamTaq™ 500 U (Thermo Fisher Scientific, Waltham, MA, USA), 2.5 µL of 10× buffer DreamTaq (Thermo Fisher Scientific, Waltham, MA, USA), 0.5 µL of dNTP Mix (10 mM) (Thermo Fisher Scientific, Waltham, MA, USA) and 3 µL of DNA. The PCR amplification was done according to [27].
The PCR products were purified using Gel Out (A&A Biotechnology, Gdańsk, Poland) following the manufacturer’s protocol. The isolated DNA was sequenced at Genomed S.A. (Warsaw, Poland) and compared with the GenBank using the BLAST [29] database to identify bacteria.

2.7. Minimal Inhibitory Concentration (MIC) of HMs

The MICs were determined by plating method using BA plates (BTL, Warsaw, Poland) supplemented with ZnNO3 (Sigma-Aldrich, Inc., St. Louis, MO, USA), CdCl2 (Sigma-Aldrich, Inc., St. Louis, MO, USA), CuCl2 (Sigma-Aldrich, Inc., St. Louis, MO, USA) or NiCl2 (Sigma-Aldrich, Inc., St. Louis, MO, USA) at different concentrations (e.g., 1–10 mM, 15 mM and 20 mM) with 200 µg/mL of Nystatin (Sigma-Aldrich, Inc., St. Louis, MO, USA). After inoculation, plates were incubated for 7 days at 22 °C. The MIC for each bacterial isolate was determined as the lowest concentration of HM at which no colonies were observed. Plates without added metals were used as positive control while Cupriavidus metallidurans AE104 was used as a negative control for MIC.

2.8. Microbial Community Structure

The structure of microbial communities in soil was estimated using phospholipid fatty acids (PLFAs) as described by other studies [30] with minor modifications. Lipids of microbial origin were extracted, fractioned, methylated and then analysed using gas chromatography (Hewlett-Packard 6890, Agilent, Santa Clara, CA, USA). Methylated fatty acids were identified and quantified using the MIDI-MIS software (Sherlock TSBA6 library, MIDI Inc., Newark, DE, USA) and nonadecanoic acid (19:0) as internal standard. Specific PLFAs for gram-negative bacteria (16:1ω7c, cy17:0, 18:1ω7, cy19:0) [31], gram-positive bacteria (i15:0, a15:0, i16:0, i17:0, a17:0) [31], actinomycetes (10Me17:0, 10Me18:0) [32] and fungi (18:2ω6,9) [33] were used to calculate the total microbial PLFAs and PLFAs for each group of microorganisms, expressed as nmol PLFA per g of dry weight of soil.

2.9. Microbial Community’s Physiological Profile

Microbial community’s catabolic abilities were determined using BIOLOG EcoPlates™ (Biolog Inc., Hayward, CA, USA). The soil solution was prepared with 10 g of dry soil and 90 mL of 0.85% NaCl. The samples were shaken for 2 h (140 rpm) and left for 30 min to settle. The 96-well BIOLOG microplates were inoculated with 120 μL (10−2) dilution aliquots of soil solution supernatant and incubated at 22 °C for 5 d. The readings were performed twice per day using a Bio-Tek ELx808 (BioTek-Agilent, Santa Clara, CA USA) microplate reader at 590 nm. The average well colour development (AWCD) was calculated at 144 h and equalled the optical density value of each well, corrected by subtracting the blank well using Equation (1) [34]:
AWCD = OD i / 31
where AWCD is the average well colour development (units), ODi is optical density value from each well, corrected by subtracting the blank well (inoculated, but without a carbon source), and 31 is number of variables (C substrates).
The sum of the AWCD scores for individual substrates was used as a measurement of total microbial catabolic activity. All analyses were performed in triplicate.

2.10. Genetic Biodiversity of Microbial Community Structure

Total DNA was extracted from 2 × 0.5 g soil samples using a GeneMATRIX Soil DNA Purification Kit (EurX, Gdańsk, Poland) according to the manufacturer’s recommendations and combined in to one sample. The 16S rRNA gene fragment V3–V5 was amplified using primers MF-341-GC CGC CCG CCG CGC CCC GCG CCC GTC CCG CCG CCC CCG CCCG CCT ACG GGA GGC AGC AG with GC clamp [35,36] and MR-907 CCGTCAATTCMTTTGAGTTT [37]. The reaction mixture (25 µL) contained: 0.25 µL of primer MF-341-GC (100 µM, 1:10) (Sigma-Aldrich, Inc., St. Louis, MO, USA), 0.25 µL of primer MR-907 (100 µM, 1:10) (Sigma-Aldrich, Inc., St. Louis, MO, USA), 0.5 µL of polymerase DreamTaqTM 500U (Thermo Fisher Scientific, Waltham, MA, USA), 2.5 µL of buffer 10× DreamTaqTM (Thermo Fisher Scientific, Waltham, MA, USA), 0.5 µL of 10mM Mix dNTP (Thermo Fisher Scientific, Waltham, MA, USA), 4 µL of DNA and 17 µL of H2O. The amplification conditions were: 94 °C for 5 min, and 36 cycles of 94 °C for 20 s, 58 °C for 20 s, 72 °C for 30 s with final 72 °C 5 min.
The electrophoresis of the PCR products was performed in 6% (w/v) polyacrylamide gel (37.5:1 acrylamide:bis-acrylamide) with a linear denaturing gradient ranging from 40 to 70% using DCode Mutation Detection System (Bio-Rad, Hercules, CA, USA). The band pattern was analysed using Image Lab 6.0.1 (Bio-Rad, Hercules, CA, USA) (see Figures S1 and S2 of the Supplementary Materials section). The selected bands were cut out, reamplified, and sequenced. Reamplification was performed using MF-341 CCTACGGGAGGCAGCAG and MR-907 CCGTCAATTCMTTTGAGTTT AG primers. The reaction mixture was prepared as described before and amplification conditions were: 94 °C for 5 min followed by 34 cycles of 94 °C for 20 s, 56 °C for 20 s, 72 °C for 30 s and finally 72 °C for 5 min. The biodiversity of the soil bacterial community was expressed as the Shannon-Wiener index (H’), richness (Rs), and evenness (EH), calculated according to methodology reported elsewhere [38].

2.11. CadA, CzcA, and NccA Genes Detection

Soil isolated strains were tested for presence of cadA, czcA, and nccA genes using PCR. The DNA isolated from the bacteria using Genomic Mini (A&A Biotechnology, Gdańsk, Poland) according to the manufacturer’s instructions was the template for this reaction. The 605 bp fragment of cadA gene was amplified using degenerated primers cad1 5′ AAR ACI GGI ACI YTI ACI AAR GGI G 3′ and cad2 5′ GIG CRT CRT TIA CIC CRT CIC CIA 3′ [39]; the 581 bp nccA gene was amplified using 2555nccAF 5′AGCCGSGASAACGGCAAGCG 3′ and 3117nccAR 5′ CCGATCACCACCGTYGCCAG 3′; and the czcA gene with primers 1226czcAF 5′GACTTCGGCATCATCRTCGAYGG3′, 2026czcAR 5′CGTTGAASCGCARCTGGATCGG 3′ [40]. The reaction mixture (25 µL) contained 1.5 µL of MgCl2 (Thermo Fisher Scientific, Waltham, MA, USA), 2.5 µL of 10× buffer KCl (Thermo Fisher Scientific, Waltham, MA, USA), 0.5 µL of dNTP Mix (10 mM) (Thermo Fisher Scientific, Waltham, MA, USA), 0.25 µL of primer cad1 or 2555nccAF or 1226czcAF, respectively (100 µM, 1:10 v/v) (Sigma-Aldrich, USA), 0.25 µL of primer cad2, primer 3117nccAR or 2026czcAR 5′, respectively (100 µM, 1:10 v/v) ((Sigma-Aldrich, Inc., St. Louis, MO, USA), 0.5 µL of polymerase Taq (Thermo Fisher Scientific, Waltham, MA, USA), 3 µL of DNA and 16.5 µL of H2O.
The amplification conditions were: 94 °C for 2 min, followed by 25 cycles at 94 °C for 1 min denaturation, 60 °C for 1 min annealing, 72 °C for 2 min and extension at 72 °C for 5 min. The pKPY11 plasmid with the cloned cadA gene was used as positive control [39].
The amplification conditions for nccA gene were: 94 °C for 2 min for initial denaturation, 25 cycles of 94 °C for 1 min, 59 °C for 1 min and 72 °C for 1 min followed by extension at 72 °C for 5 min. The positive control for the amplification was genomic DNA from C. metallidurans CH34 isolated with Genomic Mini (A&A Biotechnology, Gdańsk, Poland) according to the manufacturer’s instructions.
The czcA gene fragment was amplified using 94 °C for 2 min initial denaturation, 25 cycles at 94 °C for 1 min, 60 °C for 1 min, 72 °C for 2 min and a last extension of 72 °C for 5 min. The positive control for the amplification was genomic DNA from C. metallidurans CH34. The amplification specificity was checked through sequencing of PCR products. Briefly, PCR products were purified using Gel Out (A&A Biotechnology, Gdańsk, Poland) according to the manufacturer’s instruction. The eluted DNA were sequenced in Genomed S.A. (Warsaw, Poland) and BLAST with the GeneBank database.

2.12. Statistical Analysis

Statistically significant differences between samples were calculated using one-way ANOVA and post-hoc Tukey test (p < 0.05) with Excel and Real Statistics 2020. Kendall Tau correlation was used to investigate the effect of environmental factors on microbial communities.

3. Results

3.1. Physicochemical Analysis of Soil Samples

The results of physicochemical analysis of soil samples are summarised in Table 1. As shown, samples significantly differed in water content, with pH values ranging from slightly acidic to slightly alkaline. The characteristic feature of the tested soils was the high content of macro elements (i.e., Ca, Mg, Na, K and total N, see Table 1). The total content of HMs in different soil samples significantly exceeded acceptable standards for Cd and Zn (Table 1). The only elements whose values remained within acceptable limits were Ni and Cu (with the exception of Cu at point B1).

3.2. Enumeration of Metal Tolerant Microorganisms in Soil Samples

From samples collected at Piekary Śląskie, 64–77% out of the total oligotrophic bacteria (OB) was identified as metal tolerant but no oligotrophic Cu-tolerant bacteria were detected. Neither oligotrophic Ni- and Cd-tolerating bacteria were found in P1, nor Cd-tolerating bacteria in soil sample P2. In soil samples from Bukowno, no Cu-tolerant OB were found. As in the case of Piekary Śląskie, the number of oligotrophic bacteria that tolerated Zn and Ni accounted for 64–93% out of the total bacterial counts from Bukowno.
Metal tolerant bacteria in soil from Piekary Śląskie accounted for 71–96% of all bacteria grown on TSA medium (Heterotrophic bacteria, HB) and 67–89% of bacteria grown on agar broth medium. Cd-tolerant bacteria were found in soil samples from Bukowno (B1 and B2) but Zn-tolerant bacteria were absent in the B2 sample. The number of metallotolerant bacteria in Bukowno samples grown on TSA medium ranged from 73% to 99% (Heterotrophic bacteria, HB). In the case of bacteria grown on agar broth, metal-resistant bacteria accounted for 67–89% of all bacteria (Table 2). The use of real-time PCR (RT-PCR) allowed the assessment of the total bacterial number including culturable and non-cultured fractions. Using this method, bacterial numbers were estimated to be over twice as large compared to bacteria able to grow on culture media (Table 2).

3.3. Bacteria Isolated from Soil Samples

A significant number of metallotolerant bacteria were isolated from soil samples obtained from Piekary Ślaskie and Bukowno sampling sites (18 and 12, respectively), according to their 16S rRNA sequence (Table S1 in Supplementary Materials). The different isolates were classified into three phyla: Proteobacteria, Actinobacteria and Bacteroidetes. Proteobacteria phylum found in the soil samples was represented by Methylobacterium from the Alpha-Proteobacteria class, Variovorax from the Betaproteobacteria class, Pseudomonas from the Gammaproteobacteria and Ralstonia classes, and Cupriavidus from the Betaproteobacteria class. The Actinobacteria phylum was represented by three species from the class Actinobacteria (i.e., Arthrobacter, Rhodococcus, Agromyces). The Bacteroidetes phylum was represented by Chryseobacterium from the Flavobacterium class.
Most isolated bacteria were tolerant towards all selected HMs. Special attention should be given to Rhodococcus erythropolis strain P3 4 TSA, which showed tolerance up to 15 mM Zn and 6 mM Cd, Arthrobacter nitroguajacolicus P2 1 TSA tolerated 10 mM Zn and 6 mM Cd, and Arthrobacter oryzae P1 2 TSA, which enabled growth on media containing 10 mM Zn and 4 mM Cd—all of which were isolated from the Piekary Śląskie sampling site. High MIC values were also noted for bacteria isolated from Bukowno. For example, Agromyces sp. p2ba, Arthrobacter nitroguajacolicus ba O3 and Chryseobacterium sp. 1/10 la1 were found to be tolerant of a wide variety of conditions (Table S1 in Supplementary Materials).

3.4. Microorganisms Structure and Metabolic Activity

PLFA analysis showed gram negative bacteria as the dominant group in the different samples, constituting 46–50% of microorganisms in Piekary Śląskie and 47–60% in Bukowno. Actinomycetes were the least numerous phylum of microorganisms in all tested soils (Table 3). Despite HM contamination, all soil samples showed microbial enzymatic activity (FDA) and microorganisms were found able to break down carbohydrates, carboxylic acids, amino acids, polymers, amines and amides. Their potential to degrade individual carbon substrates, however, varied significantly among tested microbial communities (BIOLOG) (Table 3). Carbohydrates and amino acids were identified as the most important carbon source for microorganisms in Piekary Śląskie and Bukowno. Amines and amides were the least metabolised and constituted 3–7% of the used carbon sources (Table 3).
Genetic structure analysis suggested that Proteobacteria, Gemmatimonadetes and Acidobacteria were present in all studied soils. Representative types Chloroflexi and Actinobacteria were detected in soil from Piekary Śląskie, while in Bukowno sampling sites, Bacteroidetes and Firmicutes were found (Table S2 of Supplementary Materials).

3.5. Genes Encoding Mechanisms of HM Tolerance

Detection of CzcA, NccA and CadA genes, known as part of HM tolerance mechanisms [41], showed that the czcA (822 kb) gene encoding for Co-, Zn- and Cd-tolerance was present in P1 3 1/10 Variovorax paradoxus, P3 3 TSA Variovorax paradoxus, P2 4 ba Arthrobacter sp., P3 1 ba Variovorax sp. and P3 2 ba Arthrobacter sp. isolated from Piekary Śląskie samples, as well as in ba 03 Arthrobacter nitroguajacolicus, 1/10 p2ba Variovorax boronicumulans, TSA 07 Pseudomonas ficuserectae and 1/10 O1 Methylobacterium zatmanii isolated from soil samples from Bukowno. The presence of the nccA (581 kb) gene encoding tolerance for Ni, Co and Cd was found in P1 2 TSA Arthrobacter oryzae (Piekary Śląskie), and ba 03 Arthrobacter nitroguajacolicus, TSA O6 Arthrobacter oxydans, TSA 05 Pseudomonas sp., and1/10 O1 Variovorax boronicumulans (Bukowno). The cadA (1058 kb) gene, determining tolerance to Cd, Zn and Co, was only identified in TSA la3 Pseudomonas sp. (Bukowno). The bands were sequenced and compared with the sequences deposited in the GenBank database (Figure S3 of the Supplementary Materials).

3.6. Kendall Tau Correlation

Interaction between physicochemical and biological soil parameters was tested using the Kendall Tau correlation, Figures S4 and S5 (Supplementary Materials). As shown, negative correlation was observed between soil water content, pH and bacteria cultured on TSA medium, as well as Cd-tolerant and Zn-tolerant cultured bacteria on broth agar, and Zn-tolerant media on 1/10 TSA medium in samples from Piekary Śląskie (Figure S4, Supplementary Materials). The Zn and Cu content negatively affected the number of microorganisms as shown by PLFA and qPCR analysis, as well as culturable fraction of bacteria (TSA medium and 1/10 TSA). These elements also had a negative effect on FDA, BIOLOG index (AUC).
A positive correlation was found between the bioavailable heavy metal fraction (i.e., Zn, Cd) and PLFA (i.e., gram-positive, gram-negative, fungi, actinomycetes) as well as FDA, AUC and Rs determined by the BIOLOG method. Bioavailable Ni and Cd also affected qPCR values in the same way (Figure S4, Supplementary Materials).
In soils collected from Bukowno, soil moisture and pH negatively affected the number of microorganisms (TSA total), soil microorganism activity (FDA), and their ability to break down substrates (BIOLOG). Bioavailable Ni was found positively correlated with the number of cultured microorganisms, PLFA (gram-positive bacteria, actinomycetes, fungi) and microorganism biodiversity determined by DGGE, FDA, as well as parameters from the BIOLOG method (i.e., AUC, H and Rs) (Figure S5, Supplementary Materials).

4. Discussion

4.1. Physicochemical Characterization of Soils

Total metal content in soil is a useful indicator of the overall degree of contamination. It does not, however, provide information about metal mobility, bioavailability and toxicity [42]. Some studies have shown that both total and bioavailable HMs fraction shape microbial communities in contaminated sites [43]. The bioavailable HM fraction found in soil samples from Piekary Śląskie and Bukowno was relatively small compared to the HM total content, probably linked to soil pH, and other key factors determining HM availability in soil. Low pH values decrease HM absorption onto clay minerals, hydrated oxides and organic surfaces [44]. Nevertheless, other physicochemical soil parameters may also contribute to a negative HM effect on soil microbial communities. Results of this research agree with other studies [17,36,45] suggesting that pH and water content have a significant impact on structure and growth of microbial communities (PLFA and culturable bacterial fraction) and are negatively correlated to several biological processes, including enzymatic (FDA) and metabolic activity (BIOLOG), as well as HM availability. The SOM was found not only to be a carbon source but also to influence HM mobility as suggested in the past [42]. The SOM content in both studied soils was low, suggesting that other forms of metal precipitation or immobilisation may occur in the study area. The high amount of nitrogen in soil suggested low enzymatic activity involved in denitrification. Negative effect of Cd on nitrogen transformation has been reported in the past [46] and other studies have suggested that cadmium salts at a concentration of 200 mg/kg soil inhibited denitrification by almost 80% [47] in line with our results.
The studied soils were also characterised by a high content of macro- and microelement which, in addition to their biological role, can generate precipitation of nutrients. For example, Ca may generate phosphorus precipitation, necessary for microorganisms to grow [48]. Our results suggest that, regardless of HM contamination, other factors such as essential nutrient precipitation might influence growth and composition of microbial communities in the study area.

4.2. The Influence of HMs on Bacterial Counts

Over 60% of the total heterotrophic bacteria count showed tolerance towards selected HMs, independently of the collection site. Presence of metal-tolerant bacteria in soils exposed to prolonged HM exposure has been repeatedly reported in the past [15,49]. For example, metal-tolerant bacteria have been found accounting for almost 80% of total soil bacterial number in both laboratory and field experiments [50]. Long-term HM soil contamination undoubtedly leads to selection of microorganisms that possess appropriate mechanisms to enable them to survive under these stressful conditions [51]. The number of soil bacteria calculated by real-time PCR was twice as high as those obtained by culture methods, suggesting that non-cultivated bacteria constitute a large group of soil microbiome. Similar differences between total bacteria number measured either by plate count or real-time PCR methods were also noted [52].

4.3. Microbial Community Structure and Activity in HM-Contaminated Soils

As determined by PLFA, gram-negative bacteria dominated in all tested soils. Nevertheless, gram-positive bacteria also constituted a relatively large group. Actinomycetes accounted for the smallest microorganism group. Fungi are considered by some authors to have higher HM resistance and to be even capable of increasing their number under certain conditions [53]. In this work, however, only small amounts of fungal biomarkers were observed compared to bacteria biomarkers.
This type of controversial observation is frequently discussed. For example, the negative impact of Pb on fungi and fungal colony-forming units (CFUs) of PLFA biomarkers has been reported in the past [54]. Similarly, in another study [55], soil fungal population showed higher sensitivity to HM contamination than bacteria. In contrast, a higher fungal tolerance to metals was observed compared to bacteria by another study [56]. These apparently conflicting findings can be explained by the effect of other factors, such as soil pH [57], nutrient content [58], or presence of other contaminants [59] which can mask the harmful effects of HMs.
The test used for microorganism genetic biodiversity (PCR-DGGE) is particularly useful in environments with small biodiversity, and allows accumulation of data on non-culturable fractions known to be dominant in soil [60]. In soil samples from Piekary Śląskie, Proteobacteria, Chloroflexi, Acidobacteria and Gemmatimonadetes outweighed the others. For samples from Bukowno, Bacteroidetes, Firmicutes, Acidobacteria, Proteobacteria and Gemmatimonadetes were the dominant microorganisms. Similar bacteria groups were found using DGGE analysis in other HM contaminated areas. For example, Bacteroidetes, Acidobacteria, Gemmatimonadetes, Actinobacteria and Betaproteobacteria, with predominance of the former three, were observed in HM-polluted soils from Katowice, Poland [61]. Presence of Acidobacteria, Betaproteobacteria, Gammaproteobacteria and Chloroflexi in long-term HM contaminated soils was also reported by other studies [13].
Bacteria belonging to the Gemmatimonadetes are considered to make up 2% of all bacteria in soil. This phylum is often found in HM contaminated areas [62,63] and it is mostly detected by non-culturing methods [64]. Prevalence of bacteria from this phylum in soils is probably related to their ability to adapt to low water content and neutral or slightly acidic soil pH [64].
Moreover, Acidobacteria is a large, diverse phylum found in different soils with most of the bacteria being non-culturable [65,66], the abundance of which is also correlated with soil pH [67,68]. Chloroflexi phylum members have been reported to colonise a variety of environments, including contaminated soils, while being mainly non-culturable in agreement with our results [62,63,69,70]. Firmicutes have been found as the dominant phylum in Cr-contaminated environments [71] while Proteobacteria is a well-known ubiquitous phylum among HM contaminated soils [72,73], in line with our results using the DGGE method. Microorganism metabolic activity analysis using BIOLOG suggested that carbohydrates and amino acids were the main carbon source while amines and amides were metabolised to the least extent, which agrees with similar observations of carbohydrates and amino acids usage as a primary carbon source in HM contaminated areas [74].

4.4. Isolated Bacteria Characteristics

Proteobacteria, Bacteroides and Actinobacteria were detected using culturable methods. Actinobacteria represent one of the most dominant groups of microorganisms and is the most effective in decomposing organic matter, including hemicellulose and lignin [75,76]. Other studies have suggested that, among others, Actinobacteria tolerate much higher HM concentrations than any other soil bacteria for the same conditions [62,63,69,76]. Most bacteria isolated from both studied areas were found tolerant to at least three of the selected HMs tested (i.e., Cd, Cu, Ni, Zn), in addition to reaching high MIC values. We have also been able to show the genes encoding the mechanisms of tolerance to HMs in isolated bacteria. Thus, czcA and nccA were detected in Variovorax sp., Arthrobacter sp., Pseudomonas sp. and Methylobacterium, while cadA was found in Pseudomonas sp. These same genes have been reported in other studies using culturable techniques by other authors [40,77,78]. Their absence in other bacteria inhabiting tested soils suggests presence of alternative mechanisms enabling them to survive under these conditions, including transporting HM out of the cell, metal precipitation outside or inside the cell, or HM binding through exopolysaccharides [79].
Some of the isolated bacteria were well-known for their high metabolic potential and HM tolerance, such as Cupriavidus sp. [80], Arthrobacter sp. [81], Variovorax sp. [82] and Pseudomonas sp. [83]. Because of their characteristics and origin, these microorganisms can be used in HM contaminated area restoration or laboratory-scale tests to identify the mechanisms enabling them to tolerate high HM concentrations. Furthermore, some of these bacteria (e.g., Agromyces or Variovorax sp.) remain poorly understood, therefore their isolation from soil and genome sequencing is expected to allow for better understanding of their role in contaminated environments.

5. Conclusions

It has been demonstrated in this study that the structure and function of microbial communities in both tested contaminated soils were shaped not only by the specific HM and its concentration, but also by the other physicochemical features of the soil.
It seems that pH and water were the key factors affecting not only the biological part of the soil, but also its structural properties such as bioavailability of HMs. Other factors including low amounts of SOM and high concentration of microelements together with HMs contributed in determining the microbial communities in this area.
Undoubtedly long-term contamination of the soils with HMs has led to the development and domination of metal tolerant fractions of bacteria in these areas. In addition, the non-culturable fraction of bacteria was found to be a significant component of microbial communities in the HM-polluted soils, although they are omitted by the traditional methods.
Nevertheless, culture techniques still having high value, as isolated bacteria may be used in bioremediation of contaminated sites and this method, being environmentally friendly, is currently favoured by many researchers.

Supplementary Materials

The following supporting information can be downloaded at: https://www.mdpi.com/article/10.3390/microbiolres13030045/s1, Table S1. Bacterial strains isolated from Piekary Śląskie and Bukowno soil samples, including HMs-MIC values; Table S2. Sequence-based identification and taxonomic affiliation of DGGE gels bands excised from Piekary Śląskie and Bukowno. Figure S1. DGGE profile for Piekary Śląskie soil sample; Figure S2. DGGE profile for Bukowno soil sample; Figure S3. PCR amplification for (a) czcA, (b) nccA, and (c) cadA; Figure S4. Kendal Tau correlation for physicochemical and biological parameters in the tested soil samples from Piekary Śląskie; Figure S5. Kendal Tau correlation for physicochemical and biological parameters in the tested soil samples from Bukowno.

Author Contributions

Conceptualization, A.K.J. and Z.P.-S.; methodology, A.K.J. and Z.P.-S.; software, A.K.J.; validation, A.K.J.; formal analysis, A.K.J.; investigation, A.K.J.; resources, A.K.J.; data curation, A.K.J.; writing—original draft preparation, A.K.J.; writing—review and editing, A.K.J.; visualization, A.K.J.; supervision, Z.P.-S.; project administration, A.K.J. and Z.P.-S.; funding acquisition, A.K.J. All authors have read and agreed to the published version of the manuscript.

Funding

This research was funded by National Science Center, Poland, Grant number 2013/11/N/NZ9/04630 A.J. was supported by scholarship provided by the “DoktoRIS—Scholarship programme for innovative Silesia”, which was co-financed by the European Union under the European Social Fund covered by Human Capital Programme.

Data Availability Statement

Data supporting reported results are available on request.

Conflicts of Interest

The authors declare that they have no conflict of interest.

References

  1. Mitra, S.; Chakraborty, A.J.; Tareq, A.M.; Emran, T.B.; Nainu, F.; Khusro, A.; Idris, A.M.; Khandaker, M.U.; Osman, H.; Alhumaydhi, F.A.; et al. Impact of heavy metals on the environment and human health: Novel therapeutic insights to counter the toxicity. J. King Saud Univ. Sci. 2022, 34, 101865. [Google Scholar] [CrossRef]
  2. Li, C.; Zhou, K.; Qin, W.; Tian, C.; Qi, M.; Yan, X.; Han, W. A Review on Heavy Metals Contamination in Soil: Effects, Sources, and Remediation Techniques. Soil Sediment. Contam. 2019, 28, 380–394. [Google Scholar] [CrossRef]
  3. Ali, H.; Khan, E.; Ilahi, I. Environmental chemistry and ecotoxicology of hazardous heavy metals: Environmental persistence, toxicity, and bioaccumulation. J. Chem. 2019, 2019, 6730305. [Google Scholar] [CrossRef]
  4. Rai, P.K.; Lee, S.S.; Zhang, M.; Tsang, Y.F.; Kim, K.H. Heavy metals in food crops: Health risks, fate, mechanisms, and management. Environ. Int. 2019, 125, 365–385. [Google Scholar] [CrossRef] [PubMed]
  5. Raza, A.; Habib, M.; Kakavand, S.N.; Zahid, Z.; Zahra, N.; Sharif, R.; Hasanuzzaman, M. Phytoremediation of cadmium: Physiological, biochemical, and molecular mechanisms. Biology 2020, 9, 177. [Google Scholar] [CrossRef] [PubMed]
  6. Ayangbenro, A.S.; Babalola, O.O. A new strategy for heavy metal polluted environments: A review of microbial biosorbents. Int. J. Environ. Res. Public Health 2017, 14, 94. [Google Scholar] [CrossRef] [PubMed]
  7. Bouchez, T.; Blieux, A.L.; Dequiedt, S.; Domaizon, I.; Dufresne, A.; Ferreira, S.; Godon, J.J.; Hellal, J.; Joulian, C.; Quaiser, A.; et al. Molecular microbiology methods for environmental diagnosis. Environ. Chem. Lett. 2016, 14, 423–441. [Google Scholar] [CrossRef]
  8. Giller, K.E.; Witter, E.; Mcgrath, S.P. Toxicity of heavy metals to microorganisms and microbial processes in agricultural soils: A review. Soil Biol. Biochem. 1998, 30, 1389–1414. [Google Scholar] [CrossRef]
  9. Khan, S.; Hesham, A.E.L.; Qiao, M.; Rehman, S.; He, J.Z. Effects of Cd and Pb on soil microbial community structure and activities. Environ. Sci. Pollut. Res. 2010, 17, 288–296. [Google Scholar] [CrossRef]
  10. Wang, Y.P.; Shi, J.Y.; Wang, H.; Lin, Q.; Chen, X.C.; Chen, Y.X. The influence of soil heavy metals pollution on soil microbial biomass, enzyme activity, and community composition near a copper smelter. Ecotoxicol. Environ. Saf. 2007, 67, 75–81. [Google Scholar] [CrossRef]
  11. Wang, X.; Gao, P.; Li, D.; Liu, J.; Yang, N.; Gu, W.; He, X.; Tang, W. Risk assessment for and microbial community changes in Farmland soil contaminated with heavy metals and metalloids. Ecotoxicol. Environ. Saf. 2019, 185, 109685. [Google Scholar] [CrossRef] [PubMed]
  12. Bååth, E. Effects of heavy metals in soil on microbial processes and populations (a review). Water Air Soil Pollut. 1989, 47, 335–379. [Google Scholar] [CrossRef]
  13. Chen, J.; He, F.; Zhang, X.; Sun, X.; Zheng, J.; Zheng, J. Heavy metal pollution decreases microbial abundance, diversity and activity within particle-size fractions of a paddy soil. FEMS Microbiol. Ecol. 2014, 87, 164–181. [Google Scholar] [CrossRef]
  14. Müller, A.K.; Westergaard, K.; Christensen, S.; Sørensen, S.J. The effect of long-term mercury pollution on the soil microbial community. FEMS Microbiol. Ecol. 2001, 36, 11–19. [Google Scholar] [CrossRef]
  15. Pennanen, T.; Frostegård, Å.; Fritze, H.; Bååth, E. Phospholipid fatty acid composition and heavy metal tolerance of soil microbial communities along two heavy metal-polluted gradients in coniferous forests. Appl. Environ. Microbiol. 1996, 62, 420–428. [Google Scholar] [CrossRef]
  16. Jin, Y.; Luan, Y.; Ning, Y.; Wang, L. Effects and mechanisms of microbial remediation of heavy metals in soil: A critical review. Appl. Sci. 2018, 8, 1336. [Google Scholar] [CrossRef]
  17. Guo, H.; Nasir, M.; Lv, J.; Dai, Y.; Gao, J. Understanding the variation of microbial community in heavy metals contaminated soil using high throughput sequencing. Ecotoxicol. Environ. Saf. 2017, 144, 300–306. [Google Scholar] [CrossRef]
  18. Zeng, X.Y.; Li, S.W.; Leng, Y.; Kang, X.H. Structural and functional responses of bacterial and fungal communities to multiple heavy metal exposure in arid loess. Sci. Total Environ. 2020, 723, 138081. [Google Scholar] [CrossRef]
  19. Tipayno, S.C.; Truu, J.; Samaddar, S.; Truu, M.; Preem, J.K.; Oopkaup, K.; Espenberg, M.; Chatterjee, P.; Kang, Y.; Kim, K.; et al. The bacterial community structure and functional profile in the heavy metal contaminated paddy soils, surrounding a nonferrous smelter in South Korea. Ecol. Evol. 2018, 8, 6157–6168. [Google Scholar] [CrossRef] [PubMed]
  20. Masum, S.A.; Islam, M.S. A case study on predicting the environmental impacts of untreated effluent generated from Tannery industrial estate in Dhaka, Bangladesh. Geogr. Environ. Sustain. 2020, 13, 22–31. [Google Scholar] [CrossRef]
  21. Masum, S.A.; Thomas, H.R. Effects of microbial spatial distribution on organic biodegradation and immobilization of trace metals in co-contaminated soils. Comput. Geotech. 2021, 133, 104063. [Google Scholar] [CrossRef]
  22. Wood, J.L.; Liu, W.; Tang, C.; Franks, A.E. Microorganisms in heavy metal bioremediation: Strategies for applying microbial-community engineering to remediate soils. AIMS Bioeng. 2016, 3, 211–229. [Google Scholar] [CrossRef]
  23. Szrek, D.; Bajda, T.; Manecki, M. A comparative study of the most effective amendment for Pb, Zn and Cd immobilization in contaminated soils. J. Environ. Sci. Health—Part A Toxic/Hazard. Subst. Environ. Eng. 2011, 46, 1491–1502. [Google Scholar] [CrossRef] [PubMed]
  24. Kucharski, R.; Sas-Nowosielska, A.; Małkowski, E.; Japenga, J.; Kuperberg, J.M.; Pogrzeba, M.; Krzyzak, J. The use of indigenous plant species and calcium phosphate for the stabilization of highly metal-polluted sites in southern Poland. Plant Soil 2005, 273, 291–305. [Google Scholar] [CrossRef]
  25. Oleksynowa, K.; Tokaj, J.; Jakubiec, J. Guide to Exercies in Soil Science and Geology; Wydawnictwo AR: Kraków, Poland, 1991. [Google Scholar]
  26. Edwards, U.; Rogall, T.; Blockerl, H.; Emde, M.; Bottger, E.C. Isolation and direct complete nucleotide determination of entire genes. Characterization of a gene coding for 16S ribosomal RNA. Nucleic Acids Res. 1989, 17, 7843–7853. [Google Scholar] [CrossRef] [PubMed]
  27. Pacwa-Płociniczak, M.; Płaza, G.A.; Poliwoda, A.; Piotrowska-Seget, Z. Characterization of hydrocarbon-degrading and biosurfactant-producing Pseudomonas sp. P-1 strain as a potential tool for bioremediation of petroleum-contaminated soil. Environ. Sci. Pollut. Res. 2014, 21, 9385–9395. [Google Scholar] [CrossRef]
  28. Sułowicz, S.; Cycoń, M.; Piotrowska-Seget, Z. Non-target impact of fungicide tetraconazole on microbial communities in soils with different agricultural management. Ecotoxicology 2016, 25, 1047–1060. [Google Scholar] [CrossRef] [PubMed]
  29. Altschul, S.F.; Gish, W.; Miller, W.; Myers, E.W.; Lipman, D.J. Basic local alignment search tool. J. Mol. Biol. 1990, 215, 403–410. [Google Scholar] [CrossRef]
  30. Frostegard, A.; Tunlid, A.; Baath, E. Phospholipid fatty acid composition, biomass, and activity of microbial communities from two soil types experimentally exposed to different heavy metals. Appl. Environ. Microbiol. 1993, 59, 3605–3617. [Google Scholar] [CrossRef]
  31. Willers, C.; Jansen van Rensburg, P.J.; Claassens, S. Phospholipid fatty acid profiling of microbial communities-a review of interpretations and recent applications. J. Appl. Microbiol. 2015, 119, 1207–1218. [Google Scholar] [CrossRef]
  32. Kroppenstedt, R.M. Fatty Acid and Menaquinone Analysis of Actinomycetes and Related Organisms. In Chemical Methods in Bacterial Systematics; Goodfellow, M., Minnikin, D.E., Eds.; Academic Press: London, UK, 1985; pp. 173–199. [Google Scholar]
  33. Frostegård, Å.; Tunlid, A.; Bååth, E. Use and misuse of PLFA measurements in soils. Soil Biol. Biochem. 2011, 43, 1621–1625. [Google Scholar] [CrossRef]
  34. Magdalena, F.; Stefania, J.T. Agricultural utilisation of dairy sewage sludge: Its effect on enzymatic activity and microorganisms of the soil environment. Afr. J. Microbiol. Res. 2011, 5, 1755–1762. [Google Scholar] [CrossRef]
  35. Muyzer, G.; De Waal, E.C.; Uitterlinden, A.G. Profiling of complex microbial populations by denaturing gradient gel electrophoresis analysis of polymerase chain reaction-amplified genes coding for 16S rRNA. Appl. Environ. Microbiol. 1993, 59, 695–700. [Google Scholar] [CrossRef] [PubMed]
  36. Muyzer, G.; Smalla, K. Application of denaturing gradient gel electrophoresis (DGGE) and temperature gradient gel electrophoresis (TGGE) in microbial ecology. Antonie Van Leeuwenhoek 1998, 73, 127–141. [Google Scholar] [CrossRef] [PubMed]
  37. Ishii, K.; Fukui, M.; Takii, S. Microbial succession during a composting process as evaluated by denaturing gradient gel electrophoresis analysis. J. Appl. Microbiol. 2000, 89, 768–777. [Google Scholar] [CrossRef]
  38. Cycoń, M.; Markowicz, A.; Borymski, S.; Wójcik, M.; Piotrowska-Seget, Z. Imidacloprid induces changes in the structure, genetic diversity and catabolic activity of soil microbial communities. J. Environ. Manag. 2013, 131, 55–65. [Google Scholar] [CrossRef]
  39. Oger, C.; Mahillon, J.; Petit, F. Distribution and diversity of a cadmium resistance (cadA) determinant and occurrence of IS257 insertion sequences in Staphylococcal bacteria isolated from a contaminated estuary (Seine, France). FEMS Microbiol. Ecol. 2003, 43, 173–183. [Google Scholar] [CrossRef]
  40. Karelová, E.; Harichová, J.; Stojnev, T.; Pangallo, D.; Ferianc, P. The isolation of heavy-metal resistant culturable bacteria and resistance determinants from a heavy-metal-contaminated site. Biologia (Bratisl) 2011, 66, 18–26. [Google Scholar] [CrossRef]
  41. Nies, D.H. Efflux-mediated heavy metal resistance in prokaryotes. FEMS Microbiol. Rev. 2003, 27, 313–339. [Google Scholar] [CrossRef]
  42. Kim, R.Y.; Yoon, J.K.; Kim, T.S.; Yang, J.E.; Owens, G.; Kim, K.R. Bioavailability of heavy metals in soils: Definitions and practical implementation—a critical review. Environ. Geochem. Health 2015, 37, 1041–1061. [Google Scholar] [CrossRef] [PubMed]
  43. Zhen, Z.; Wang, S.; Luo, S.; Ren, L.; Liang, Y.; Yang, R.; Li, Y.; Zhang, Y.; Deng, S.; Zou, L.; et al. Significant Impacts of Both Total Amount and Availability of Heavy Metals on the Functions and Assembly of Soil Microbial Communities in Different Land Use Patterns. Front. Microbiol. 2019, 10, 2293. [Google Scholar] [CrossRef]
  44. Guo, X.; Zhao, G.; Zhang, G.; He, Q.; Wei, Z.; Zheng, W.; Qian, T.; Wu, Q. Effect of mixed chelators of EDTA, GLDA, and citric acid on bioavailability of residual heavy metals in soils and soil properties. Chemosphere 2018, 209, 776–782. [Google Scholar] [CrossRef] [PubMed]
  45. Nicol, G.W.; Leininger, S.; Schleper, C.; Prosser, J.I. The influence of soil pH on the diversity, abundance and transcriptional activity of ammonia oxidizing archaea and bacteria. Environ. Microbiol. 2008, 10, 2966–2978. [Google Scholar] [CrossRef] [PubMed]
  46. Afzal, M.; Yu, M.; Tang, C.; Zhang, L.; Muhammad, N.; Zhao, H.; Feng, J.; Yu, L.; Xu, J. The negative impact of cadmium on nitrogen transformation processes in a paddy soil is greater under non-flooding than flooding conditions. Environ. Int. 2019, 129, 451–460. [Google Scholar] [CrossRef]
  47. Smolders, E.; Brans, K.; Coppens, F.; Merckx, R. Potential nitrification rate as a tool for screening toxicity in metal-contaminated soils. Environ. Toxicol. Chem. 2001, 20, 2469–2474. [Google Scholar] [CrossRef] [PubMed]
  48. Richardson, A.E.; Simpson, R.J. Soil microorganisms mediating phosphorus availability. Plant Physiol. 2011, 156, 989–996. [Google Scholar] [CrossRef] [PubMed]
  49. Azarbad, H.; van Straalen, N.M.; Laskowski, R.; Nikiel, K.; Röling, W.F.M.; Niklińska, M. Susceptibility to additional stressors in metal-tolerant soil microbial communities from two pollution gradients. Appl. Soil Ecol. 2016, 98, 233–242. [Google Scholar] [CrossRef]
  50. Song, J.; Shen, Q.; Wang, L.; Qiu, G.; Shi, J.; Xu, J.; Brookes, P.C.; Liu, X. Effects of Cd, Cu, Zn and their combined action on microbial biomass and bacterial community structure. Environ. Pollut. 2018, 243, 510–518. [Google Scholar] [CrossRef]
  51. Díaz-Raviña, M.; Bååth, E. Development of metal tolerance in soil bacterial communities exposed to experimentally increased metal levels. Appl. Environ. Microbiol. 1996, 62, 2970–2977. [Google Scholar] [CrossRef]
  52. Borymski, S.; Cycon, M.; Beckmann, M.; Mur, L.A.J.; Piotrowska-Seget, Z. Plant species and heavy metals affect biodiversity of microbial communities associated with metal-tolerant plants in metalliferous soils. Front. Microbiol. 2018, 9, 1425. [Google Scholar] [CrossRef] [PubMed] [Green Version]
  53. Rajapaksha, R.M.C.P.; Tobor-Kapłon, M.A.; Bååth, E. Metal toxicity affects fungal and bacterial activities in soil differently. Appl. Environ. Microbiol. 2004, 70, 2966–2973. [Google Scholar] [CrossRef] [PubMed]
  54. Bååth, E.; Díaz-Raviña, M.; Bakken, L.R. Microbial biomass, community structure and metal tolerance of a naturally Pb-enriched forest soil. Microb. Ecol. 2005, 50, 496–505. [Google Scholar] [CrossRef] [PubMed]
  55. Xu, Y.; Seshadri, B.; Bolan, N.; Sarkar, B.; Ok, Y.S.; Zhang, W.; Rumpel, C.; Sparks, D.; Farrell, M.; Hall, T.; et al. Microbial functional diversity and carbon use feedback in soils as affected by heavy metals. Environ. Int. 2019, 125, 478–488. [Google Scholar] [CrossRef] [PubMed]
  56. Wang, F.; Yao, J.; Si, Y.; Chen, H.; Russel, M.; Chen, K.; Qian, Y.; Zaray, G.; Bramanti, E. Short-time effect of heavy metals upon microbial community activity. J. Hazard. Mater. 2010, 173, 510–516. [Google Scholar] [CrossRef]
  57. Azarbad, H.; Niklińska, M.; Van Gestel, C.A.M.; Van Straalen, N.M.; Röling, W.F.M.; Laskowski, R. Microbial community structure and functioning along metal pollution gradients. Environ. Toxicol. Chem. 2013, 32, 1992–2002. [Google Scholar] [CrossRef]
  58. Chodak, M.; Gołebiewski, M.; Morawska-Płoskonka, J.; Kuduk, K.; Niklińska, M. Diversity of microorganisms from forest soils differently polluted with heavy metals. Appl. Soil Ecol. 2013, 64, 7–14. [Google Scholar] [CrossRef]
  59. Klimek, B.; Sitarz, A.; Choczyński, M.; Niklińska, M. The Effects of Heavy Metals and Total Petroleum Hydrocarbons on Soil Bacterial Activity and Functional Diversity in the Upper Silesia Industrial Region (Poland). Water Air Soil Pollut. 2016, 227, 265. [Google Scholar] [CrossRef]
  60. Bodor, A.; Bounedjoum, N.; Vincze, G.E.; Erdeiné Kis, Á.; Laczi, K.; Bende, G.; Szilágyi, Á.; Kovács, T.; Perei, K.; Rákhely, G. Challenges of unculturable bacteria: Environmental perspectives. Rev. Environ. Sci. Biotechnol. 2020, 19, 1–22. [Google Scholar] [CrossRef]
  61. Pacwa-Płociniczak, M.; Płociniczak, T.; Yu, D.; Kurola, J.M.; Sinkkonen, A.; Piotrowska-Seget, Z.; Romantschuk, M. Effect of Silene vulgaris and Heavy Metal Pollution on Soil Microbial Diversity in Long-Term Contaminated Soil. Water Air Soil Pollut. 2018, 229, 13. [Google Scholar] [CrossRef]
  62. Navarro-Noya, Y.E.; Jan-Roblero, J.; González-Chávez, D.C.; Hernández-Gama, R.; Hernández-Rodríguez, C. Bacterial communities associated with the rhizosphere of pioneer plants (Bahia xylopoda and Viguiera linearis) growing on heavy metals-contaminated soils. Antonie Van Leeuwenhoek 2010, 97, 335–349. [Google Scholar] [CrossRef]
  63. Pereira, L.B.; Vicentini, R.; Ottoboni, L.M.M. Changes in the bacterial community of soil from a neutral mine drainage channel. PLoS ONE 2014, 9, e96605. [Google Scholar] [CrossRef] [PubMed]
  64. DeBruyn, J.M.; Nixon, L.T.; Fawaz, M.N.; Johnson, A.M.; Radosevich, M. Global biogeography and quantitative seasonal dynamics of Gemmatimonadetes in soil. Appl. Environ. Microbiol. 2011, 77, 6295–6300. [Google Scholar] [CrossRef] [PubMed]
  65. Kalam, S.; Basu, A.; Ahmad, I.; Sayyed, R.Z.; El-Enshasy, H.A.; Dailin, D.J.; Suriani, N.L. Recent Understanding of Soil Acidobacteria and Their Ecological Significance: A Critical Review. Front. Microbiol. 2020, 11, 580024. [Google Scholar] [CrossRef] [PubMed]
  66. Kielak, A.M.; Barreto, C.C.; Kowalchuk, G.A.; van Veen, J.A.; Kuramae, E.E. The ecology of Acidobacteria: Moving beyond genes and genomes. Front. Microbiol. 2016, 7, 744. [Google Scholar] [CrossRef] [PubMed]
  67. Hartman, W.H.; Richardson, C.J.; Vilgalys, R.; Bruland, G.L. Environmental and anthropogenic controls over bacterial communities in wetland soils. Proc. Natl. Acad. Sci. USA 2008, 105, 17842–17847. [Google Scholar] [CrossRef] [PubMed]
  68. Jones, R.T.; Robeson, M.S.; Lauber, C.L.; Hamady, M.; Knight, R.; Fierer, N. A comprehensive survey of soil acidobacterial diversity using pyrosequencing and clone library analyses. ISME J. 2009, 3, 442–453. [Google Scholar] [CrossRef]
  69. Gołebiewski, M.; Deja-Sikora, E.; Cichosz, M.; Tretyn, A.; Wróbel, B. 16S rDNA pyrosequencing analysis of bacterial community in heavy metals polluted soils. Microb. Ecol. 2014, 67, 635–647. [Google Scholar] [CrossRef] [PubMed]
  70. Tebo, B.M.; Davis, R.E.; Anitori, R.P.; Connell, L.B.; Schiffman, P.; Staudigel, H. Microbial communities in dark oligotrophic volcanic ice cave ecosystems of Mt. Erebus, Antarctica. Front. Microbiol. 2015, 6, 179. [Google Scholar] [CrossRef] [PubMed]
  71. Miao, Y.; Liao, R.; Zhang, X.X.; Wang, Y.; Wang, Z.; Shi, P.; Liu, B.; Li, A. Metagenomic insights into Cr(VI) effect on microbial communities and functional genes of an expanded granular sludge bed reactor treating high-nitrate wastewater. Water Res. 2015, 76, 43–52. [Google Scholar] [CrossRef]
  72. Liu, Y.; Gao, T.; Wang, X.; Fu, J.; Zuo, M.; Yang, Y.; Yin, Z.; Wang, Z.; Tai, X.; Chang, G. Effects of heavy metals on bacterial community surrounding Bijiashan mining area located in northwest China. Open Life Sci. 2022, 17, 40–54. [Google Scholar] [CrossRef] [PubMed]
  73. Tseng, S.C.; Liang, C.M.; Chia, T.; Ton, S.S. Changes in the composition of the soil bacterial community in heavy metal-contaminated farmland. Int. J. Environ. Res. Public Health 2021, 18, 8661. [Google Scholar] [CrossRef] [PubMed]
  74. Xie, Y.; Fan, J.; Zhu, W.; Amombo, E.; Lou, Y.; Chen, L.; Fu, J. Effect of heavy metals pollution on soil microbial diversity and bermudagrass genetic variation. Front. Plant Sci. 2016, 7, 755. [Google Scholar] [CrossRef] [PubMed]
  75. Mawang, C.I.; Azman, A.S.; Fuad, A.S.M.; Ahamad, M. Actinobacteria: An eco-friendly and promising technology for the bioaugmentation of contaminants. Biotechnol. Rep. 2021, 32, e00679. [Google Scholar] [CrossRef] [PubMed]
  76. Alvarez, A.; Saez, J.M.; Davila Costa, J.S.; Colin, V.L.; Fuentes, M.S.; Cuozzo, S.A.; Benimeli, C.S.; Polti, M.A.; Amoroso, M.J. Actinobacteria: Current research and perspectives for bioremediation of pesticides and heavy metals. Chemosphere 2017, 166, 41–62. [Google Scholar] [CrossRef] [PubMed]
  77. Remenár, M.; Kamlárova, A.; Harichova, J.; Zámocky, M.; Ferianc, P. The heavy-metal resistance determinant of newly isolated bacterium from a nickel-contaminated soil in Southwest Slovakia. Pol. J. Microbiol. 2018, 67, 191–201. [Google Scholar] [CrossRef] [PubMed]
  78. Harichová, J.; Karelová, E.; Pangallo, D.; Ferianc, P. Structure analysis of bacterial community and their heavy-metal resistance determinants in the heavy-metal-contaminated soil sample. Biology 2012, 67, 1038–1048. [Google Scholar] [CrossRef]
  79. Bruins, M.R.; Kapil, S.; Oehme, F.W. Microbial resistance to metals in the environment. Ecotoxicol. Environ. Saf. 2000, 45, 198–207. [Google Scholar] [CrossRef]
  80. Nies, D.H. The biological chemistry of the transition metal transportome of: Cupriavidus metallidurans. Metallomics 2016, 8, 481–507. [Google Scholar] [CrossRef]
  81. Guo, X.; Xie, C.; Wang, L.; Li, Q.; Wang, Y. Biodegradation of persistent environmental pollutants by Arthrobacter sp. Environ. Sci. Pollut. Res. 2019, 26, 8429–8443. [Google Scholar] [CrossRef]
  82. Han, J.I.; Choi, H.K.; Lee, S.W.; Orwin, P.M.; Kim, J.; LaRoe, S.L.; Kim, T.G.; O’Neil, J.; Leadbetter, J.R.; Lee, S.Y.; et al. Complete genome sequence of the metabolically versatile plant growth-promoting endophyte Variovorax paradoxus S110. J. Bacteriol. 2011, 193, 1183–1190. [Google Scholar] [CrossRef] [Green Version]
  83. Hu, N.; Zhao, B. Key genes involved in heavy-metal resistance in Pseudomonas putida CD2. FEMS Microbiol. Lett. 2007, 267, 17–22. [Google Scholar] [CrossRef] [PubMed] [Green Version]
Figure 1. Sample site geographical location in (a) Piekary Śląskie, and (b) Bukowno, Poland (source: https://www.google.pl/maps, modified, 21 July 2022).
Microbiolres 13 00045 g001
Table 1. Physicochemical characterization of soil samples.
Piekary ŚląskieBukowno
P1P2P3B1B2B3
Water content (%)26.21 ± 0.24 b29.48 ± 0.12 a8.54 ± 0.25 c5.01 ± 0.28 d5.34 ± 0.36 d1.56 ± 0.21 e
pH (H20)7.71 ± 0.03 b8.14 ± 0.02 a7.62 ± 0.01 c6.79 ± 0.01 e6.96 ± 0.01 d5.49 ± 0.01 f
pH (KCl)8 ± 0.03 b8.29 ± 0.01 a7.15 ± 0.01 c6.77 ± 0.01 e6.81 ± 0.01 d4.69 ± 0.01 f
pH (CaCl2)7.84 ± 0.01 b8.15 ± 0.01 a7.04 ± 0.01 c6.78 ± 0.01 e6.82 ± 0.01 d5.07 ± 0.01 f
Total N (mg/kg)829.9 ± 35.21 a780.8 ± 15.41 a997.8 ± 19.28 a747.97 ± 950.41 a215.63 ± 6.15 a151.2 ± 7.81 a
Organic matter (%)7.76 ± 0.02 b7.89 ± 0.06 b10.95 ± 0.55 a2.62 ± 0.04 c2.23 ± 0.07 c0.54 ± 0.04 d
Organic carbon (%)4.5 ± 0.01 b4.58 ± 0.03 b6.35 ± 0.32 a1.52 ± 0.02 c1.3 ± 0.04 c0.32 ± 0.02 d
P (%)0.83 ± 0.03 a1.14 ± 0.04 b0.38 ± 0.01 c0.2 ± 0.02 d0.29 ± 0.01 e0.24 ± 0.01de
Na (mg/kg)547.77 ± 23.24 a397.67 ± 63.28 b131.1 ± 5.11 c112.3 ± 10.87 cd38.6 ± 6.35 de15.17 ± 0.42 e
Mg (g/kg)37.486 ± 0.877 a14.965 ± 0.567 b5.865 ± 0.636 c19.257 ± 0.024 d3.420 ± 0.441 e0.277 ± 0.024 f
K (g/kg)0.708 ± 0.152 c1.093 ± 0.055 ab1.219 ± 0.059 a0.962 ± 0.111 b0.333 ± 0.076 d0.114 ± 0.056 d
Ca (g/kg)109.124 ± 2.746 a36.105 ± 3.384 b9.396 ± 0.425 d24.361 ± 1.402 c3.230 ± 0.285 e0.274 ± 0.049 e
Zn total (g/kg)1.208 ± 0.106 b1.282 ± 0.205 b1.035 ± 0.083 b1.8143 ± 0.00 a1.777 ± 0.00 b14.362 ± 0.00 b
Zn (H20) (mg/kg)0.49 ± 0.3 f1.14 ± 0.69 def3.47 ± 1.54 c19.38 ± 0.00 a1.98 ± 0.00 cd6.25 ± 0.00 b
Zn (CaCl2) (mg/kg)0.34 ± 0.12 e0.35 ± 0.11 e7.92 ± 0.88 d56.21 ± 0.00 a14.34 ± 0.00 b21.43 ± 0.00 c
Cd total (g/kg)0.293 ± 0.016 c1.215 ± 0.119 b0.0459 ± 0.006 d1.991 ± 0.00 a0.100 ± 0.00 d0.017 ± 0.00 d
Cd (H20) (mg/kg)0.06 ± 0.03 c0.14 ± 0.07 b0.03 ± 0.00 c0.51 ± 0.00 a0.02 ± 0.00 c0.01 ± 0.00 c
Cd (CaCl2) (mg/kg)0.05 ± 0.01 e0.11 ± 0.03 d0.24 ± 0.01 c3.32 ± 0.00 a0.49 ± 0.00 c0.21 ± 0.00 b
Ni total (mg/kg)3.94 ± 0.08 d3 ± 0.22 d0.62 ± 0.08 e54.16 ± 0.00 a44.63 ± 0.00 b15.25 ± 0.00 c
Ni (H20) (mg/kg)0.001 ± 0.001 e0.002 ± 0.001 de0.003 ± 0.001 d0.02 ± 0.00 c0.04 ± 0.00 a0.03 ± 0.00 b
Ni (CaCl2) (mg/kg)0.001 ± 0.002 a0.000.000.01 ± 0.00 c0.02 ± 0.00 b0.02 ± 0.00 b
Cu total (mg/kg)580.68 ± 59.12 b175.65 ± 13.7 c14.59 ± 0.69 d1116.87 ± 0.0 a75.81 ± 0.00 d0.00 ± 0.00
Cu (H20) (mg/kg)0.04 ± 0.02 a0.05 ± 0.01 a0.03 ± 0.02 a0.00 ± 0.00 b0.02 ± 0.00 a0.01 ± 0.00 a
Cu (CaCl2) (mg/kg)0.02 ± 0.01 b0.05 ± 0.00 a0.01 ± 0.01b0.01 ± 0.00 b0.00 ± 0.00 b0.01 ± 0.00 b
The data represent the mean and standard deviation of three replicates. P1, P2 and P3 indicate individual sampling sites from Piekary Śląskie; and B1, B2 and B3 from Bukowno. Data with different lower-case letters indicate statistically significant differences between results of particular parameter (one-way ANOVA, Tukey test, p < 0.05) and the same letter refers to no significant difference.
Table 2. Metallotolerant bacteria enumeration in soil samples.
Bacteria Count, Piekary ŚląskieBukowno
(log10 CFU/g Dry Soil) P1P2P3B1B2B3
OBTotal4.44 ± 0.09 ce4.79 ± 0.14 cd4.91 ± 0.03 c3.86 ± 0.04 f5.73 ± 0.43 a5.53 ± 0.16 ab
Cu0.00 ± 0.000.00 ± 0.000.00 ± 0.000.00 ± 0.000.00 ± 0.000.00 ± 0.00
Cd0.00 ± 0.000.00 ± 0.003.80 ± 0.14 a0.00 ± 0.000.00 ± 0.000.00 ± 0.00
Ni0.00 ± 0.003.51 ± 0.17 a3.44 ± 0.35 ab2.48 ± 0.15 c0.00 ± 0.000.00 ± 0.00
Zn3.10 ±0.00 a3.11 ± 0.00 a3.67 ± 0.31 a3.59 ± 0.03 a4.58 ± 0.49 a2.83 ± 2.46 a
HB (TSA)Total4.35 ± 0.08 cde4.50 ± 0.04 ac4.64 ± 0.67 ab3.71 ± 0.09 f4.38 ± 0.10 acd4.73 ± 0.67 a
Cu3.98 ± 0.34 ce4.26 ± 0.06 c4.38 ± 0.65 ab3.28 ± 0.24 f4.56 ± 0.21 a4.19 ± 0.63 cd
Cd3.10 ± 0.00 a3.59 ± 0.31a3.53 ± 0.52 a0.00 ± 0.000.00 ± 0.003.47 ± 0.54 a
Ni3.99 ± 0.14 a4.33 ± 0.25 a4.42 ± 0.65 a3.87 ± 0.89 a5.12 ± 0.70 a4.66 ± 0.65 a
Zn3.86 ± 0.28 a3.47 ± 0.39 a4.28 ± 0.63 a3.87 ± 2.06 a4.64 ± 0.83 a4.63 ± 0.65 a
HB (Broth agar)Total4.65 ± 0.10 ade4.77 ± 0.07 ac4.80 ± 0.24 ab4.65 ± 0.10 ef4.77 ± 0.07 ad4.80 ± 0.24 a
Cu4.14 ± 0.07 a3.99 ± 0.09 a4.03 ± 0.61 a4.14 ± 0.07 a3.99 ± 0.09 a4.03 ± 0.61 a
Cd3.33 ± 0.40 a3.21 ± 0.17 a4.07 ± 0.22 a3.33 ± 0.40 a3.21 ± 0.17 a4.07 ± 0.22 a
Ni3.99 ± 0.38 ade4.23 ± 0.26 ac4.16 ± 0.30 ad3.99 ± 0.38 ef4.23 ± 0.26 a4.16 ± 0.30 ab
Zn3.77 ± 0.06 a3.65 ± 0.21 a4.27 ± 0.05 a3.77 ± 0.06 a3.65 ± 0.21 a4.27 ± 0.05 a
RT-PCRTotal9.04 ± 0.08 bc9.11 ± 0.02 ab9.16 ± 0.03 a9.02 ± 0.03 bd9.06 ± 0.03 abd8.99 ± 0.03 cd
The data represent the mean and standard deviation of three replicates. P1, P2 and P3 indicate individual sampling sites from Piekary Śląskie; and B1, B2 and B3 from Bukowno. T: total number of heterotrophic bacteria; Cu, Cd, Ni, Zn: the number of Cu-, Cd-, Ni- and Zn-tolerant bacteria. Data with different lower-case letters indicate statistically significant differences between results of particular parameter (one-way ANOVA, Tukey test, p < 0.05) and the same letter refers to no significant difference.
Table 3. Metabolic activity of microorganisms in soil samples.
Method Sampling Site
P1P2P3B1B2B3
FDA (µg fluorescein/g dry soil)0.23 ± 0.08 b0.27 ± 0.06 b0.58 ± 0.1 a0.28 ± 0.1 b0.15 ± 0.04 b0.56 ± 0.07 a
PLFATotal, nmol PLFA/g dry soil2.83 ± 0.76 bc8.27 ± 0.95 ac12.64 ± 1.70 a5.88 ± 5.89 ac10.38 ± 1.26 ac77.62 ± 2.78 ac
Gram + (%)38.74 ± 3.75 a41.54 ± 0.46 a38.84 ± 0.25 a32.57 ± 19.47 a38.19 ± 2.36 a37.93 ± 3.01 a
Gram − (%)46.04 ± 4.33 a50.49 ± 0.57 a47.14 ± 0.65 a59.84 ± 18.32 a47.75 ± 1.73 a47.33 ± 2.43 a
Actinomycetes (%)15.21 ± 1.91 a4.65 ± 0.07 a9.23 ± 0.53 a6.71 ± 7.39 a8.23 ± 0.81 a8.43 ± 1.59 a
Fungi (%)0.00 ± 0.003.31 ± 0.67 a4.80 ± 0.12 a0.88 ± 0.76 a5.83 ± 0.18 a6.31 ± 1.37 a
BIOLOGAWCD0.82 ± 0.05 ecd0.78 ± 0.04 cd1.15 ± 0.17 f0.09 ± 0.02 a0.82 ± 0.08 d1.38 ± 0.07 b
Carbohydrates (%)32.87 ± 7.14 b19.18 ± 1.53 a24.60 ± 0.10 b61.69 ± 3.17 b18.41 ± 2.74 b25.05 ± 1.99 b
Carboxylic Acids (%)4.41 ± 3.81 cdf17.09 ± 0.46 c15.42 ± 1.13 cd7.67 ± 5.37 ce8.13 ± 3.66 b18.97 ± 2.07 a
Amino acids (%)31.42 ± 3.52 cf35.48 ± 0.34 ce30.11 ± 1.85 c12.16 ± 1.82 cd41.28 ± 4.47 b26.94 ± 1.13 a
Polymers (%)17.98 ± 0.66 c16.81 ± 3.78 cd16.45 ± 0.98 ce12.24 ± 6.99 cf18.90 ± 1.92 b13.52 ± 0.58 a
Amines and amides (%)5.58 ± 3.97 bcd4.36 ± 0.76 bde5.99 ± 0.40 cb2.58 ± 3.00 bdf5.83 ± 0.66 b7.93 ± 3.40 a
Miscellaneous (%)7.74 ± 5.31 c7.07 ± 3.19 ce7.44 ± 2.69 cd3.66 ± 2.56 cf7.45 ± 1.55 b7.60 ± 2.27 a
DGGEH’1.02 ± 0.08 fde0.70±0.02 b0.95±0.04 d1.01±0.05 ed0.49±0.03 cb0.04 ± 0.00 a
Rs26 ± 0.00 a21 ±0.00 a21 ± 0.00 a18 ± 0.00 a24 ± 0.00 a24 ± 0.00 a
EH0.31 ± 0.02 ed0.23 ± 0.01 cb0.31±0.01 dc0.35±0.02 fe0.23 ± 0.01 b0.01 ± 0.00 a
The data represent the mean and standard deviation of three replicates. P1, P2 and P3 indicate individual sampling sites from PiekaryŚląskie; and B1, B2 and B3 from Bukowno. Data with different lower-case letters indicate statistically significant differences between results of particular parameter (one-way ANOVA, Tukey test, p < 0.05) and the same letter refers to no significant difference. AWCD (Average Well Colour Development).
Publisher’s Note: MDPI stays neutral with regard to jurisdictional claims in published maps and institutional affiliations.

