Article

Association of Climatic Factors with Frequency of Dengue

by
Gracia Viviana González-Enríquez
1,2,
Blanca Miriam Torres-Mendoza
1,2,*,
Martha Escoto-Delgadillo
3,
Efrain Chavarria-Avila
2,
Sagrario Karina Esparza-Avila
1,
Clara Esperanza Santacruz-Tinoco
4,
Bernardo Martínez-Miguel
4,
Magally Farah Diva Arenas-Sevilla
1,5 and
David Israel Javalera Castro
1,6,*
1
Laboratorio de Apoyo, Vigilancia e Investigación Epidemiológica, División de Neurociencias, Centro de Investigación Biomédica de Occidente, Instituto Mexicano del Seguro Social, Guadalajara 44340, Mexico
2
Departamento de Disciplinas Filosófico, Metodológicas e Instrumentales, Centro Universitario de Ciencias de la Salud, Universidad de Guadalajara, Guadalajara 44340, Mexico
3
Centro Universitario de Ciencias Biológicas y Agropecuarias, Universidad de Guadalajara, Guadalajara 45200, Mexico
4
División de Laboratorios Especializados, Instituto Mexicano del Seguro Social, México City 07760, Mexico
5
Doctorado en Salud Pública, Centro Universitario de Ciencias de la Salud, Universidad de Guadalajara, Guadalajara 44340, Mexico
6
Departamento de Fundamentos Biológicos, Instituto de Ciencias Biológicas, Universidad Autónoma de Guadalajara, Guadalajara 45129, Mexico
*
Authors to whom correspondence should be addressed.
Infect. Dis. Rep. 2026, 18(3), 47; https://doi.org/10.3390/idr18030047
Submission received: 22 March 2026 / Revised: 14 May 2026 / Accepted: 14 May 2026 / Published: 16 May 2026
(This article belongs to the Section Viral Infections)

Abstract

Background: Climate change has contributed to the global resurgence of dengue, with a spike of more than 14.4 million dengue cases. This study aimed to analyze the association between dengue frequency with climatic factors, circulating serotypes, and disease severity in northwestern Mexico. Methods: A retrospective time-series study was conducted using dengue molecular diagnostic data reported between September 2017 and January 2025 by the Laboratorio de Apoyo a la Vigilancia e Investigación Epidemiológica del Centro de Investigación Biomédica de Occidente, Mexico. Data included dengue frequency, serotype distribution, and clinical severity across seven states in northwestern Mexico (Colima, Guanajuato, Jalisco, Michoacán, Nayarit, Sinaloa, and Sonora). Meteorological data were obtained from the Automatic Meteorological Stations of the National Water Commission. Associations between dengue frequency and climatic variables were evaluated using linear regression models. Statistical analyses were performed using SPSS v24 and R v3.5. Results: In Jalisco, minimum, mean and maximum temperatures, as well as precipitation, were significant predictors of dengue cases, explaining approximately 21.7% of the variance (adjusted R2 = 0.217, p < 0.001). In Colima and Michoacán, precipitation showed no predictive value. In Guanajuato, the maximum temperature was excluded from the model (adjusted R2 = 0.226). Models for Nayarit, Sinaloa, and Sonora excluded two or more climatic variables, with adjusted R2 values of 0.111, 0.151, and 0.049, respectively. Conclusions: Climatic conditions and epidemiological time trends explain a modest proportion of dengue cases in northwestern Mexico, with the strongest association observed in Jalisco. Additional determinants, including vector ecology, host immunity, circulating serotypes, population mobility, and public health interventions, should be considered to better understand dengue dynamics.

1. Introduction

Dengue is a mosquito-borne viral disease considered by the World Health Organization as a major public health concern [1]. Over the past decades, dengue incidence has increased worldwide, with the exception of 2021, when reported cases declined during the SARS-CoV-2 pandemic [1,2,3]. Dengue outbreaks occur cyclically every three to five years and are influenced by the distribution, density, and competence to infect and transmit the virus of Aedes mosquito vectors [2]. In 2024, 14.4 million dengue cases were reported globally, representing more than double to the previous record 2023. This surge included over 52,711 severe cases and 11,185 deaths [4]. In Mexico alone, 125,160 confirmed cases and 478 deaths were recorded, with the highest burden concentrated in northwestern states [5].
Multiple factors contribute to dengue emergence and spread, including vector distribution, introduction of new viral serotypes, population immunity, health system capacity, human mobility, tourism, and climate change. Climatic variables—particularly temperature, rainfall, and humidity—play a critical role by influencing vector survival, reproduction, and viral replication [6,7].
Climate change is altering the distribution and frequency of dengue fever globally, impacting public health and prevention strategies. There are projections for different climate scenarios across various regions of the world [8] and in Mexico [9]. These projections show geographical variations and significant gaps in information on climatic variables, which can also contribute to increased dengue cases. Therefore, it is essential to develop approximate regional scenarios that serve as a basis for future predictions [8,9].
Accordingly, this study aimed to evaluate the relationship between dengue frequency and climatic factors in northwestern Mexico and to describe the circulating serotypes and disease severity.

2. Materials and Methods

2.1. Study Design and Data Collection

A retrospective time-series analysis was conducted using dengue molecular diagnostic records from 7 September 2017 to 15 January 2025. Data were obtained from the electronic database of Laboratorio de Apoyo a la Vigilancia e Investigación Epidemiológica del Centro de Investigación Biomédica de Occidente (LAVIE-CIBO), which supports epidemiological surveillance of vector-borne diseases in the region.

2.2. Eligibility Criteria

Records were included if samples: (1) were analyzed by RT-qPCR for vector-borne disease diagnosis; (2) were collected within 0–5 days of symptom onset; (3) included an epidemiological investigation; (4) met the operational definition of a probable dengue case; (5) originated from one of seven northwestern Mexican states (Colima, Guanajuato, Jalisco, Michoacán, Nayarit, Sinaloa, or Sonora); and (6) corresponded to Instituto Mexicano del Seguro Social beneficiaries.

2.3. Laboratory Diagnosis and Serotyping

Dengue virus detection was performed by LAVIE-CIBO using the TaqMan™ Arbovirus Triplex Kit (ZIKV/DENV/CHIKV) (Applied Biosystems, Waltham, MA, USA). Positive samples were subsequently serotyped using the Dengue Serotyping Real-Time PCR (RT-qPCR) Detection Kit (VIASURE, Zaragoza, Spain), following manufacturer instructions. DENV-positive samples with Ct > 32 were not serotyped and were classified as “Not determined”.

2.4. Climatic Data

Northwestern Mexico encompasses approximately 438,005 km2 (22% of the national territory) [10] and exhibits predominantly dry and semi-dry climates. Daily meteorological data on precipitation and minimum, mean, and maximum temperatures from January 2017 to January 2025 were obtained from the Automatic Meteorological Stations of the Hydrological Information System of the National Water Commission [11].

2.5. Statistical Analysis

Descriptive statistics were used to summarize dengue frequencies, serotypes, severity, and climatic variables. The dengue frequencies were obtained from the relationship between positive dengue cases by RT-qPCR and the total number of cases, with the operational definition of a probable dengue case per 100.
Climatic data were aggregated by epidemiological week (52 weeks per year). Weekly averages were used to construct heatmaps and regression models. Linear regression analyses were conducted separately for each state to evaluate associations between dengue rate and climatic variables. Statistical significance was set at α = 0.05, with 95% confidence intervals. The analyses were performed using statistical packages SPSS v24 (IBM, Armonk, NY, USA) and R v3.5 (The R Foundation, Vienna, Austria).

3. Results

3.1. Dengue Frequency and Serotype Distribution

Between 2017 and 2025, a total of 28,986 dengue cases were diagnosed across the seven states. Jalisco accounted for nearly half of all cases, whereas Sinaloa reported the lowest number. In recent years, a serotype shift was observed from D1, D2 and finally D3. Notably, 66.3% of cases corresponded to non-severe dengue over the years, and 2024 was the year with the highest cases of dengue with warning signs (n = 6151) and severe dengue (n = 265). The largest outbreak occurred in 2024, coinciding with a post-pandemic resurgence (Table 1).
The cases of dengue and DENV serotypes in the seven states are shown in Table 2. DENV serotype D3 is described as responsible for the most significant number of diagnoses in all states, and subsequently, the frequency of circulating serotypes was different for each state. Likewise, the patients diagnosed were outpatients, with a ratio of 2.35 to 1 for each hospitalized patient, and only 55 deaths were diagnosed with dengue. Regarding the clinical classification of dengue, the cases were distributed according to their definition as NSD with 19,205 (66.3%) cases, DWS with 8885 (30.7%), SD with 656 (2.3%), and “Not clinically classified” with 240 (0.8%) (Table 2).
Serotype D2 showed the highest proportion of severe dengue cases, followed by D3 and D1 (Table 3).

3.2. Climatic Conditions and Dengue Cases

Dengue cases exhibited strong seasonality, peaking during warmer and wetter months, particularly between epidemiological weeks 29 and 50 of 2024. States with higher rates experienced moderate rainfall and temperatures favorable to mosquito survival, whereas states with extreme heat and lower precipitation reported fewer cases.
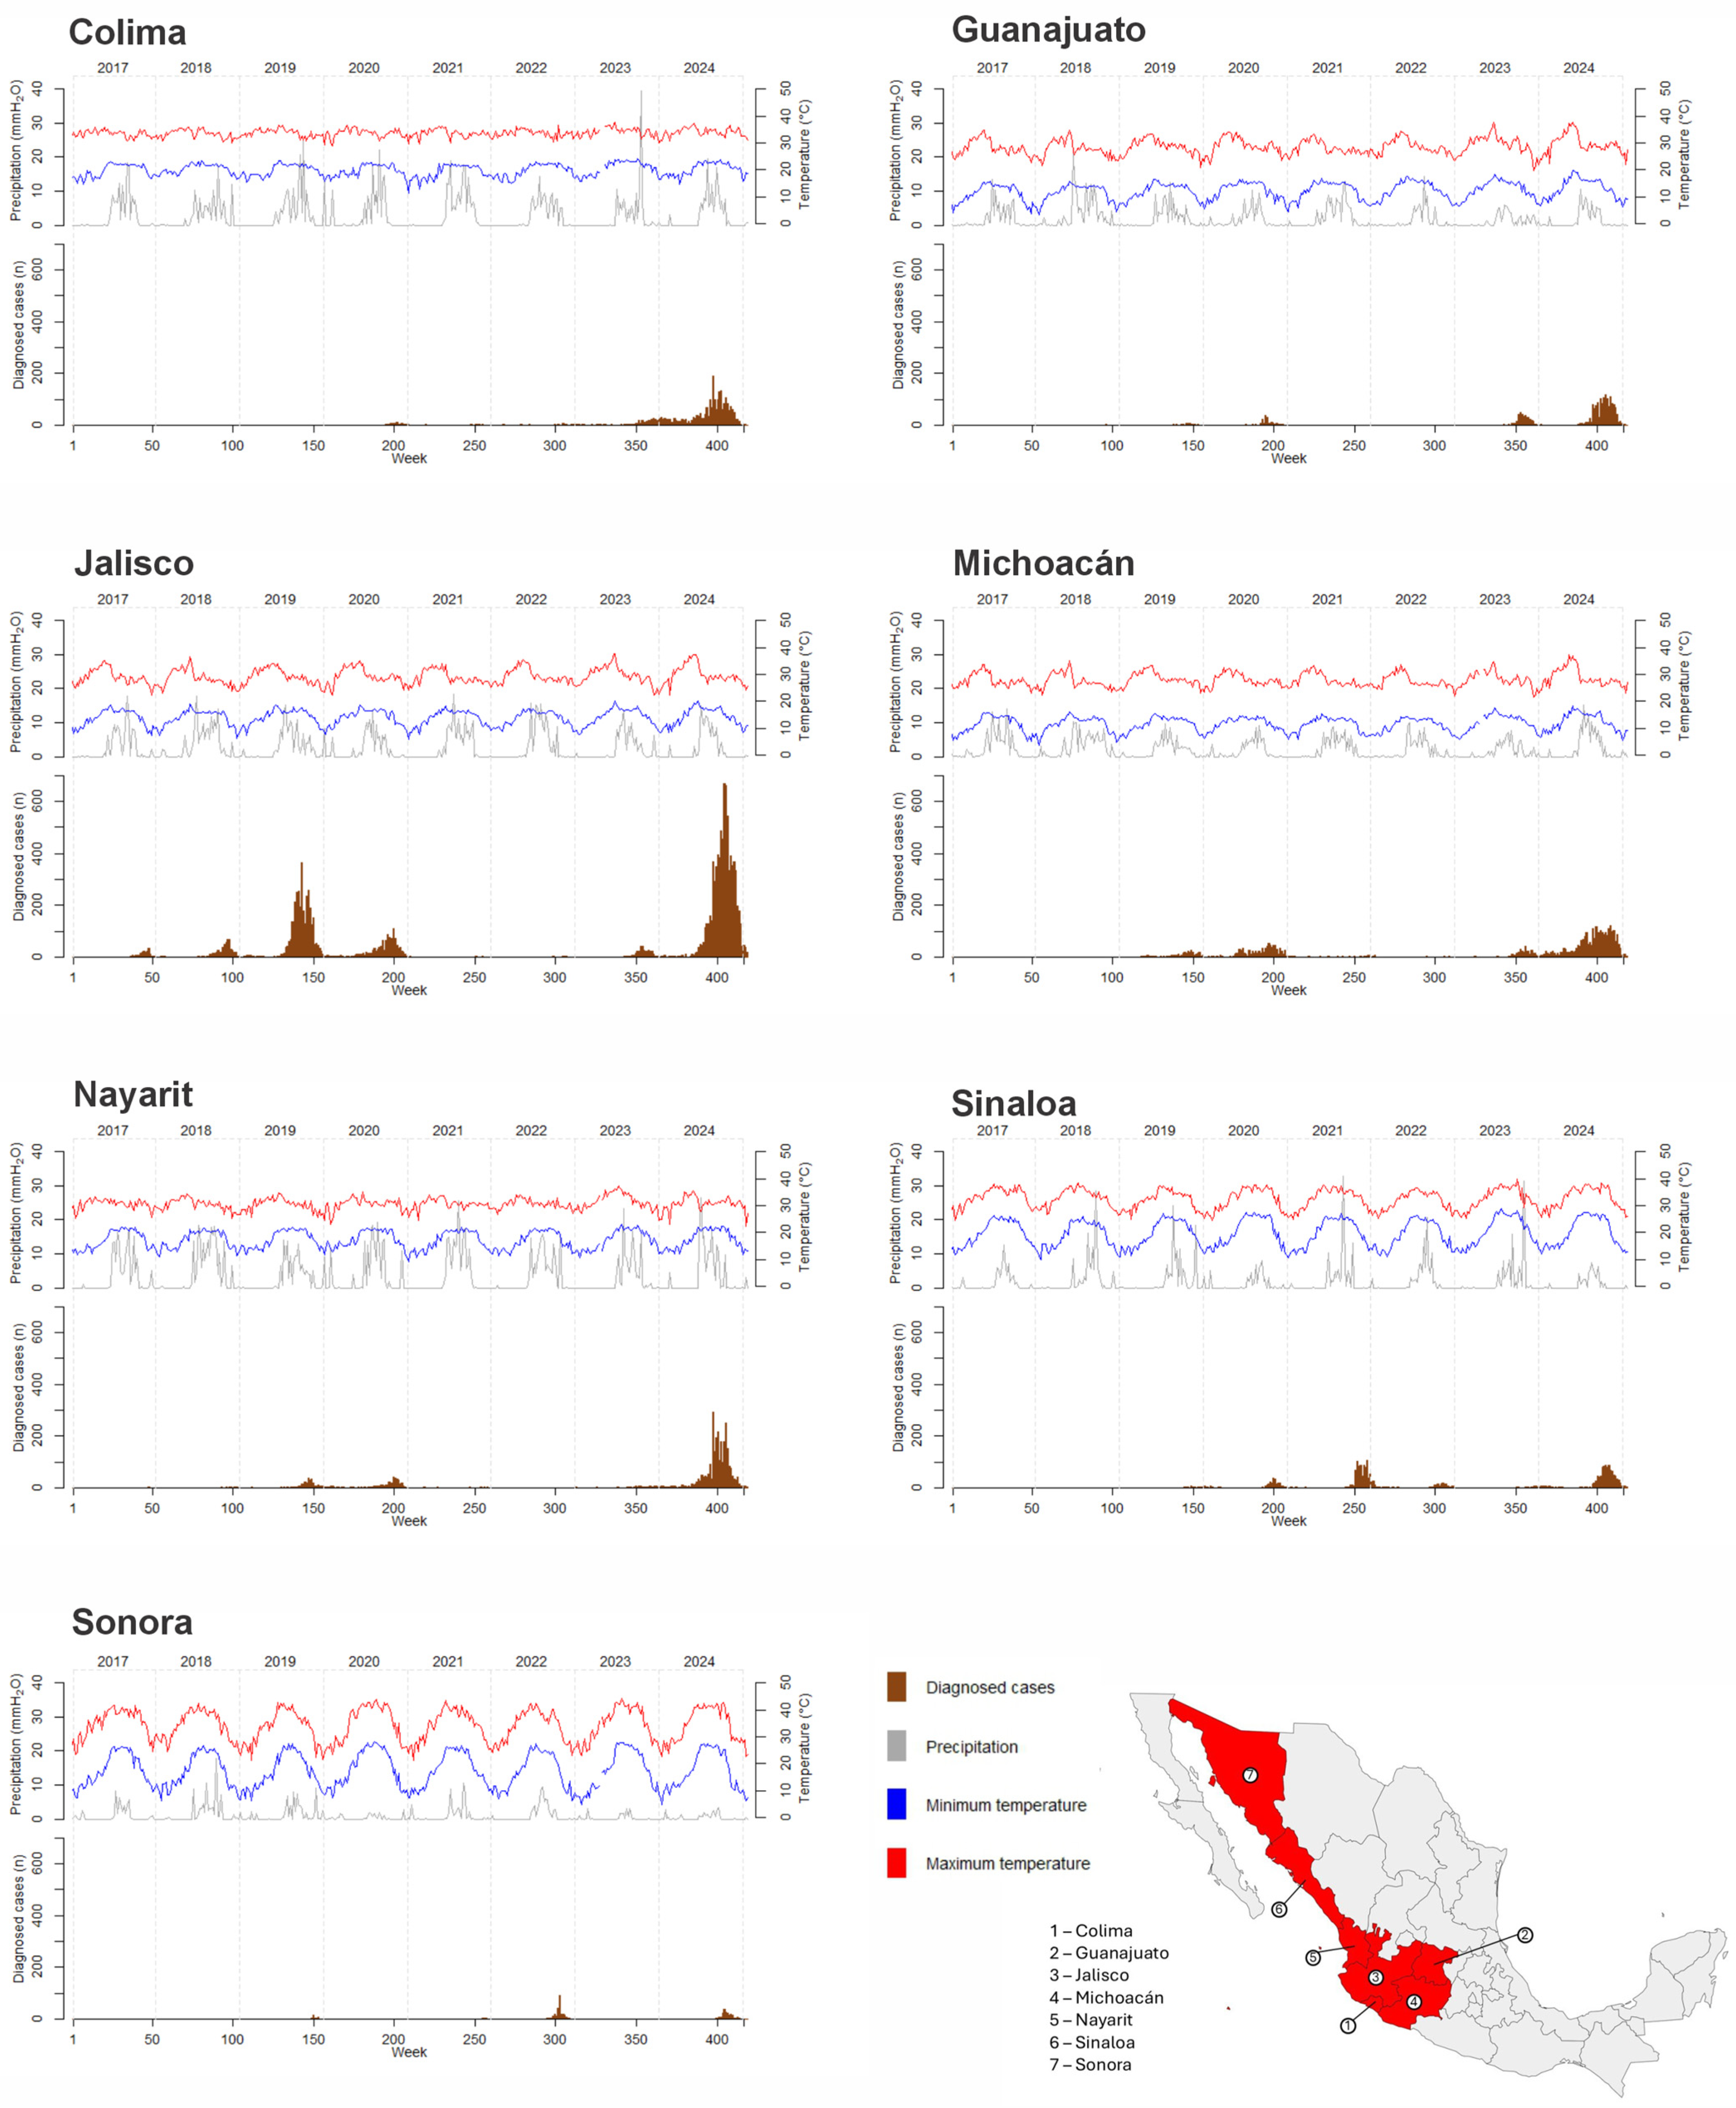
Figure 1 indicates the distribution of dengue cases, as well as maximum and minimum temperatures and precipitation, from 2017 to 2025 by epidemiological week (EpiWeek) across the seven states of northwestern Mexico. The highest mean maximum temperatures were recorded in Sinaloa (32.53 °C; range: 24.43–39.76 °C), Colima (33.70 °C; range: 28.86–37.72 °C), and Sonora (34.21 °C; range: 21.10–44.17 °C). The states with the lowest mean minimum temperatures were Michoacán (11.23 °C; range: 3.78–18.21 °C), Guanajuato (12.20 °C; range: 3.26–19.63 °C), and Jalisco (13.96 °C; range: 5.78–20.13 °C). Average rainfall was highest in Nayarit (3.28 mm; range: 0–26.44 mm), followed by Colima (2.71 mm; range: 0–39.54 mm) and Jalisco (2.61 mm; range: 0–18.45 mm).
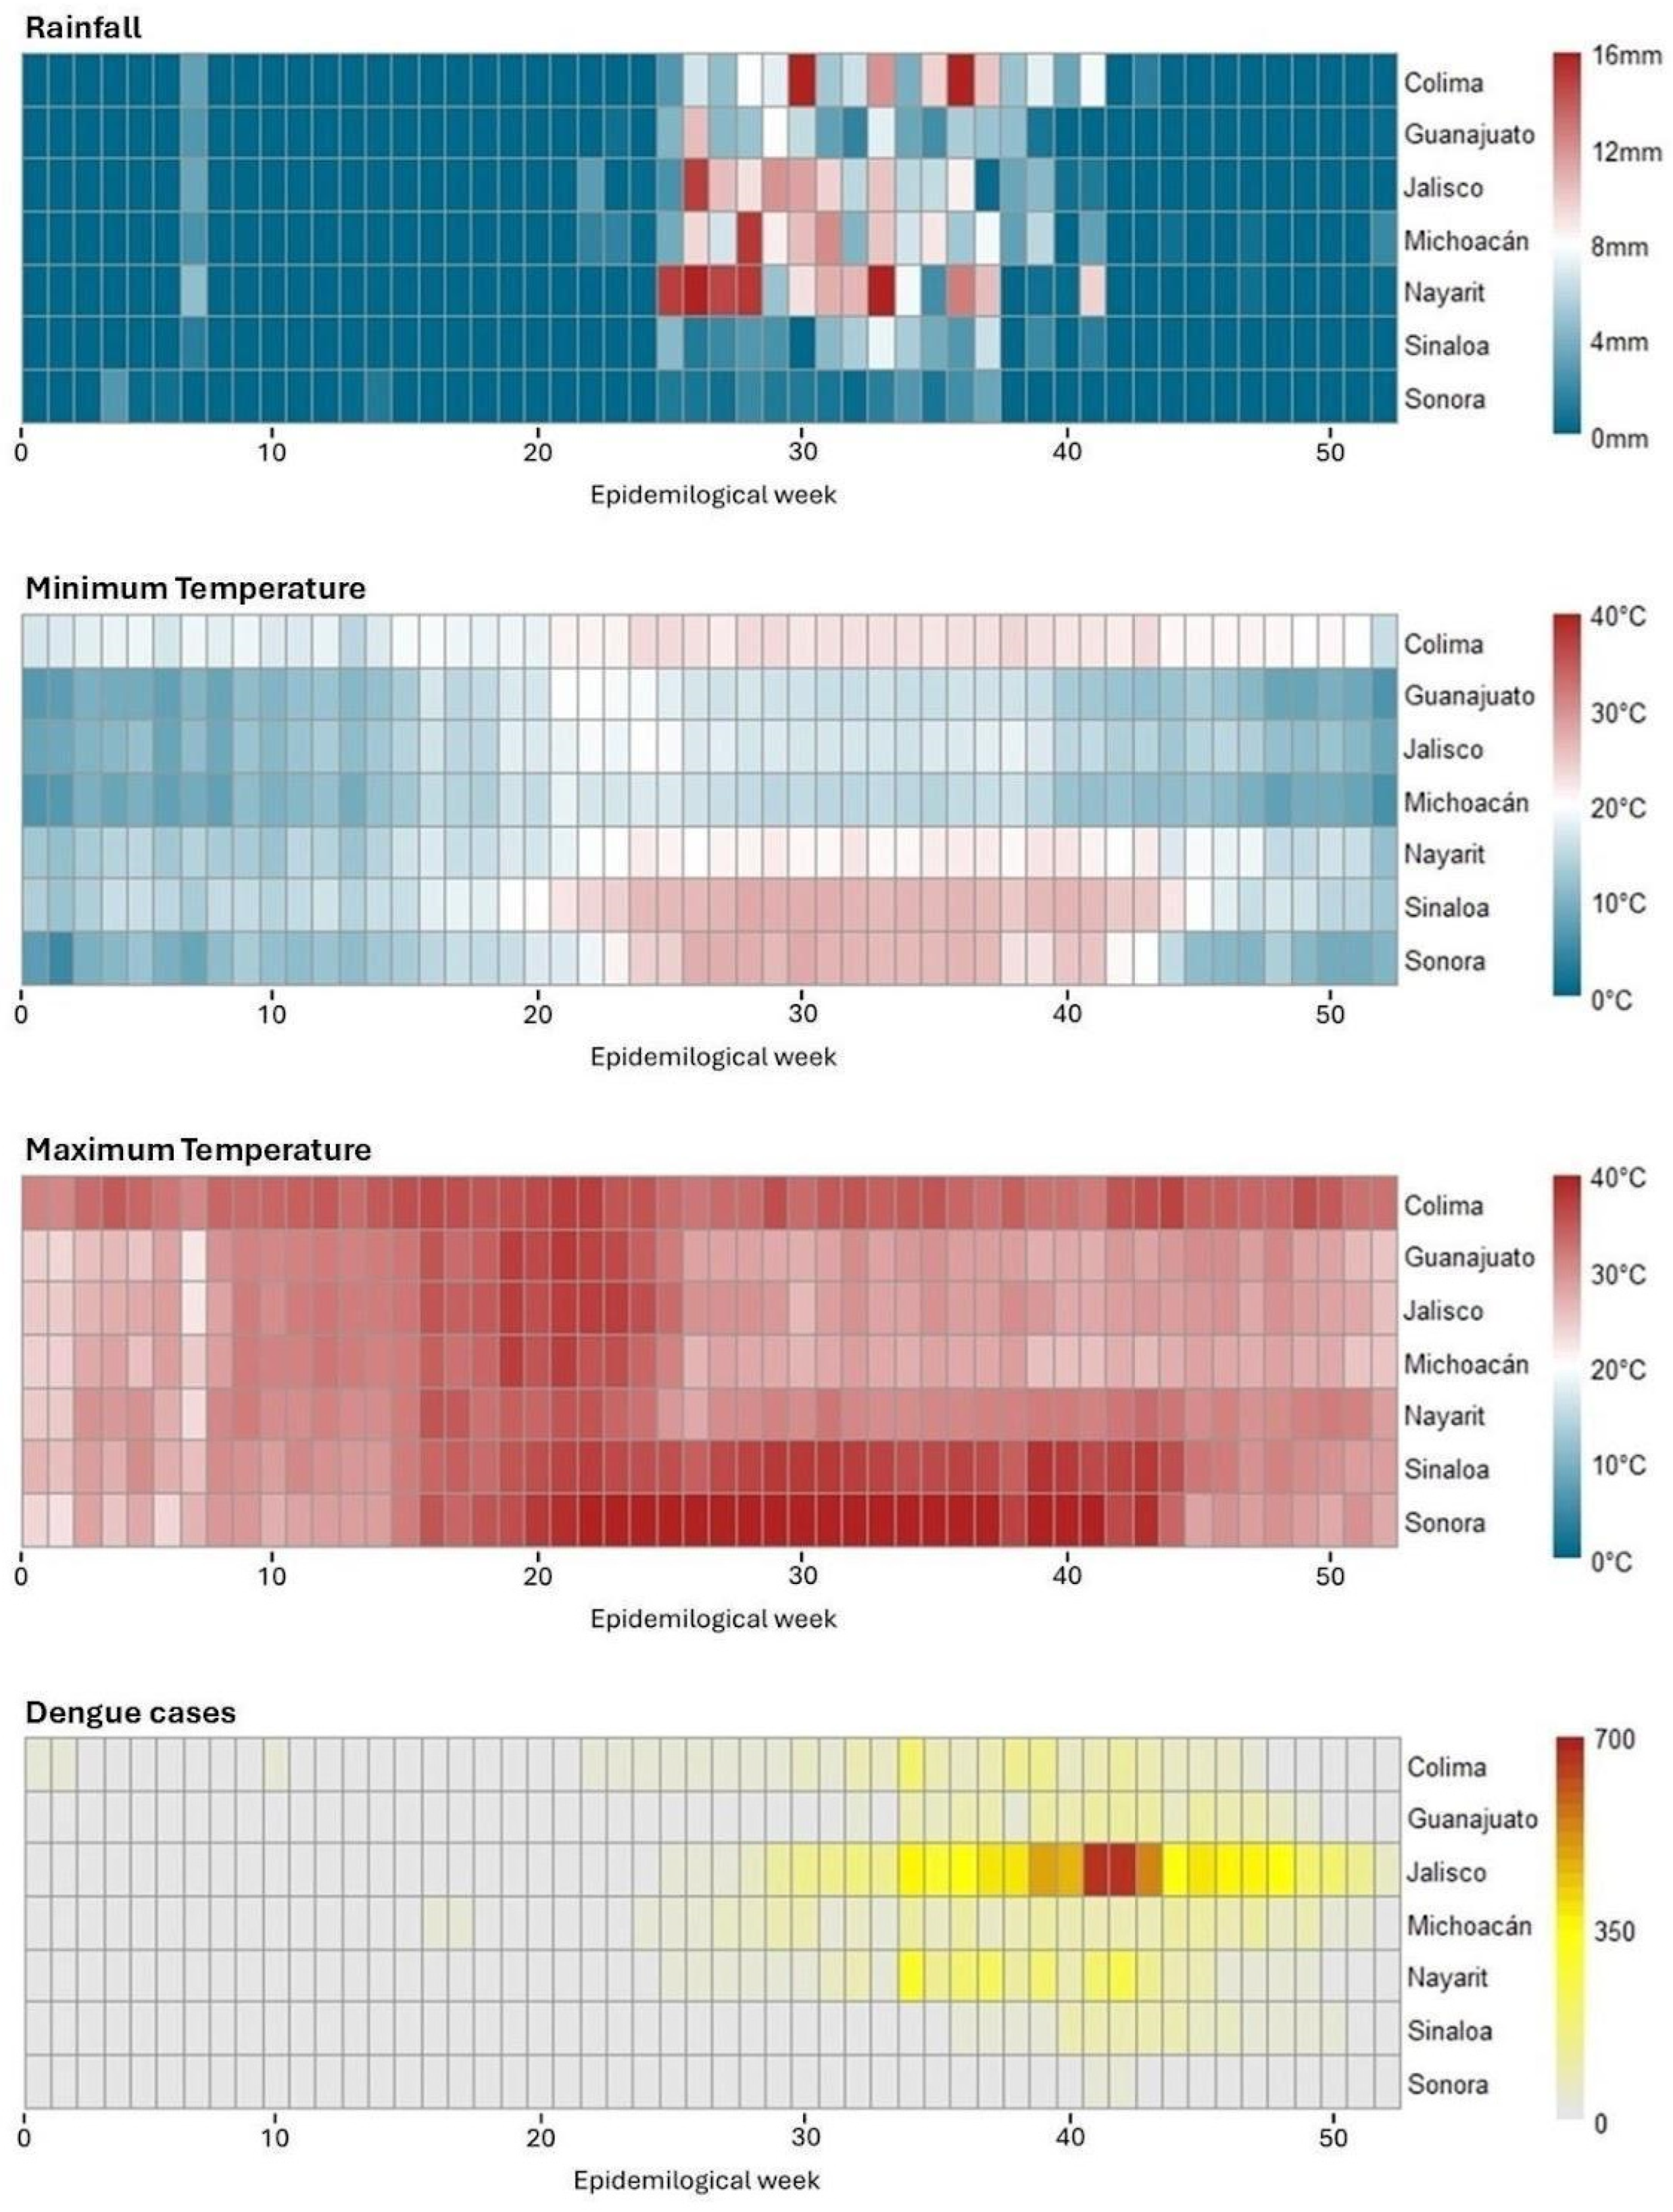
Across all seven states, dengue cases peaked during the 2024 outbreak, with a marked increase between EpiWeeks 29 and 50. During this period, the states with the highest number of dengue cases were Jalisco, Nayarit, Michoacán, and Colima, which experienced maximum temperatures ranging from 22.46 °C to 37.47 °C, minimum temperatures from 5.68 °C to 23.90 °C, and total rainfall between 0 and 26.44 mm. Conversely, Sinaloa and Sonora, which reported fewer cases, exhibited higher maximum temperatures (25.52–42.65 °C), higher minimum temperatures (12.20–27.60 °C), and lower precipitation (0–7.40 mm) (Figure 2).

3.3. Dengue Prediction Models

The analysis of dengue behavior in the region of interest was studied following the reports from 7 September 2017 to 15 January 2025. For proper tracking, the weeks included in this period were numbered from 1 January 2017, giving a total of 419 weeks of reporting. A multivariate analysis was performed to define the predictive value of the meteorological parameters on the number of dengue cases because the rainfall variable has values of zero; only with linear regression were valid models obtained. In addition, the meteorological variables showed a wide dispersion among regions, so a model was made for each state. Table 4 shows the prediction models for each of the seven states of the northwestern region.
The diagnosis of dengue cases in Jalisco decreased during the SARS-CoV-2 pandemic. This unexpected trend complicated the development of an accurate mathematical model for predicting dengue rates. Consequently, tests were conducted for each state to determine which climatological parameters best explained the observed patterns (Table 4).
The model of Jalisco included all the meteorological variables as a predictor of dengue cases, which explains approximately 22% of the cases (adjusted R2 = 0.217, p < 0.001). For the rest of the states, some meteorological variables were not included in the models (Table 4).
According to the estimates presented, the behavior of dengue is explained using the linear model of the following formula and its substitutions according to the values for each state:
Dengue cases = (A∙W) + (B∙P) + (C∙Tmin) + (D∙Tmean) + (E∙Tmax) + Cons
where
W: Week
P: Precipitation
Tmin: Minimum Temperature
Tmean: Mean Temperature
Tmax: Maximum Temperature
Cons: Constant
A,B,C,D and E: These are the values of the estimator corresponding to each variable by region, as presented in Table 4.
State-specific linear regression models revealed heterogeneous associations between climatic variables and dengue rates. The Jalisco model included all meteorological parameters and explained approximately 21.7% of dengue variability. In other states, fewer variables contributed significantly, resulting in lower explanatory power.

4. Discussion

This study identified a clear association between dengue rates and climatic factors, particularly minimum and maximum temperature and rainfall. An increase in minimum temperature has been associated with a higher number of dengue cases [12,13,14]. Mosquitoes exhibit prolonged flight activity and greater efficiency at temperatures between 15 °C and 27 °C, which increases the likelihood of human–vector contact [12,15]. In the present analysis, minimum temperatures across the evaluated states ranged from 4 °C to 28 °C, encompassing the optimal range for vector activity.
In contrast, higher temperatures were associated with a reduction in dengue cases, although Childs et al. observed a nonlinear relationship between temperature and dengue incidence [16]. When temperatures exceed 30 °C, mosquito survival and feeding behavior tend to decline [17]. Experimental studies have shown that mosquito viral incubation and larval development periods shorten between 15 °C and 30 °C [18], whereas viral replication and dissemination within mosquito salivary glands are disrupted at approximately 32 °C [15]. In this study, maximum temperatures reached up to 40 °C in Sonora and Sinaloa, the two states that reported fewer dengue cases during the 2024 outbreak.
A systematic review reported that the risk of dengue infection increases by approximately 13% for every 1 °C rise in temperature [17]. Similarly, in Jalisco, our findings indicate that a 1 °C increase in minimum temperature was associated with a 17% increase in dengue risk. This temperature sensitivity may partly explain the magnitude of the most recent outbreak in the region, particularly when combined with the observed shift in circulating serotypes [17,19].
Rainfall was another relevant climatic factor and, in this study, demonstrated a negative association with dengue rate. A similar pattern was reported in Kenya, where heavy rainfall was hypothesized to disrupt mosquito breeding habitats or reduce the effectiveness of vector control measures [20]. However, other studies have reported a positive association between rainy periods and increased dengue risk, highlighting the complex and context-dependent role of precipitation in dengue transmission dynamics [13].
When the combined effects of environmental variables were considered, Jalisco—particularly in 2024—exhibited a convergence of conditions consistent with a worst-case transmission scenario: sustained moderate rainfall, maximum temperatures close to 30 °C, and minimum temperatures near 15 °C for more than six consecutive months. Both univariate analyses and regression models suggest that dengue cases are driven less by isolated climatic variables and more by specific combinations of favorable conditions that can overwhelm public health systems. Identifying and quantifying the relative contribution of these factors constitutes one of the principal contributions of this study.
Globally, a decline in dengue rate was observed between 2020 and 2021 [21,22,23,24]. A similar reduction in confirmed dengue cases occurred in northwestern Mexico during this period; however, a sharp resurgence was observed in 2024, particularly in the state of Jalisco. Comparable post-pandemic increases were also reported in Malaysia, Sudan, and Brazil in 2022 relative to 2021 [21,22,23].
Containment measures implemented during the COVID-19 pandemic underscored the role of human mobility in dengue transmission. In Sri Lanka and Brazil, dengue cases declined by 31% and 40%, respectively, during periods of restricted movement [25,26]. These observations support the hypothesis that population mobility is a critical driver of dengue spread in urban settings [22,26]. Additionally, limited access to healthcare services during the pandemic—due to prioritization of COVID-19 control—may have contributed to underreporting of dengue cases [21].
Regarding viral serotypes, a shift in circulating variants was observed in northwestern Mexico, with a transition from predominance of DENV-1 and DENV-2 to DENV-3. In the most recent year, DENV-3 was the dominant serotype, accounting for a substantial proportion of cases. The introduction of new DENV serotypes, genotypes, or lineages can displace endemic strains and, in immunologically naïve populations, trigger large outbreaks and potentially more severe clinical outcomes [19,27]. In contrast to some previous reports [27,28], DENV-3 was not associated with increased disease severity in this study. Most severe cases were linked to DENV-2, which has been consistently associated with more severe dengue manifestations [28,29]. Both DENV-1 and DENV-2 were associated with thrombocytopenia and bleeding complications [30].
Notably, Mendoza-Hernandez et al. (2025) reported that DENV-3 infection was not associated with classical warning signs such as hemorrhagic manifestations [30]. Instead, mortality was more accurately predicted by neurological involvement, systemic inflammation, or renal dysfunction [30]. In the present study, detailed clinical symptoms and laboratory parameters were unavailable, as only clinical classification reports were accessible. Consequently, we were unable to evaluate warning signs among DENV-2 and DENV-3 cases, particularly among fatal cases. These findings highlight the need to reassess current clinical criteria used to define dengue severity [27,30].
Several limitations should be acknowledged. The study population consisted exclusively of individuals with access to formal employment and health services, which may limit generalizability. Evidence from the Philippines suggests that socioeconomic determinants significantly influence dengue incidence. Provinces characterized by high population density, larger household size, higher poverty levels, increased per capita health expenditure, and lower latitude demonstrate a higher risk of dengue compared with regions at higher temperature ranges; such social determinants were not incorporated into the present analysis [14].
From a methodological perspective, some samples tested positive for the dengue virus but yielded negative serotyping results. This may reflect low viral load or RNA degradation, allowing detection of pan-DENV targets but not serotype-specific sequences [31]. Ariyaratne et al. reported the co-circulation of two DENV-3 genotypes during the 2023 outbreak in Sri Lanka, one of which evaded detection by CDC primers [32]. Furthermore, the higher mutation rate observed in DENV-3 may contribute to false-negative serotyping results due to undetected viral variants [33].
Dengue is a global problem, and research groups in different parts of the world have sought to identify the factors that most influence its prevalence. These range from models that use only climatological variables, like ours [34], to those that incorporate time series and even machine learning using AI [35].
Our model has some limitations, including the type of insecticide used and its application frequency in the region under study. However, it also has strengths; a prediction coefficient linked to the epidemiological week number, temperatures, and precipitation levels was established. We believe that one of the main contributions of this study is to highlight the importance of the combination of climatic conditions that increase the frequency of dengue cases. Based on these findings, this scenario predicts more cases of light rainfall, high minimum temperatures, and low maximum temperatures. This provides a starting point to reinforce prevention actions when these conditions occur, including population education, fumigation strategies, and others.
Finally, the predictive model explained only a limited proportion of dengue cases. Future analyses should incorporate additional determinants beyond climatic variables, including ecological, social, and demographic factors, to improve explanatory power [12,36]. Dengue outbreaks cannot be attributed solely to climate, vectors, or viral characteristics [37]. Factors such as urbanization [38], migration, tourism, fumigation, and community-based educational interventions aimed at preventive behaviors should also be systematically evaluated [39].

5. Conclusions

Climatic variables and temporal trends explain a modest proportion of dengue rates in northwestern Mexico, with the strongest effect observed in Jalisco. A serotype shift was observed across the years from D1 to D2 to D3. The D3 serotype was the most dominant during the 2024 outbreak and was not associated with dengue severity. Comprehensive dengue prevention and control strategies should integrate climatic surveillance with vector control, population mobility monitoring, and health system preparedness.

Author Contributions

G.V.G.-E.: design of the study, data analysis, and drafting the article. B.M.T.-M.: conception and design of the study, data analysis, interpretation, and drafting and revising of the manuscript critically for important intellectual content. M.E.-D.: acquisition of data and revising it critically for important intellectual content. E.C.-A.: analysis, interpretation of data and drafting the article. S.K.E.-A.: acquisition of data and drafting the article. C.E.S.-T.: conception of the study and revising it critically for important intellectual content. B.M.-M.: analysis of data and revising it critically for important intellectual content. M.F.D.A.-S.: interpretation of data and revising the manuscript. D.I.J.C.: conception, analysis, interpretation of data and drafting the article. All authors have read and agreed to the published version of the manuscript.

Funding

This research received no external funding.

Institutional Review Board Statement

The study was conducted in accordance with the Declaration of Helsinki and approved by the Research and Ethics Committee of the Instituto Mexicano del Seguro Social (registration number: R-2025-1305-035, approved on 5 February 2025.

Informed Consent Statement

Patient consent was waived because the researcher worked with an Excel database and not with the patients.

Data Availability Statement

The data presented in this study is available upon request from the corresponding author due to privacy reasons.

Conflicts of Interest

The authors declare no conflicts of interest.

Abbreviations

The following abbreviations are used in this manuscript:
DENVdengue virus
DWSdengue with warning signs
HISHydrological Information System
LAVIE-CIBOLaboratorio de Apoyo a la Vigilancia e Investigación Epidemiológica del Centro de Investigación Biomédica de Occidente
NSDnon-severe dengue
RT-qPCRquantitative real-time PCR
SDsevere dengue
VBDvector-borne disease

References

  1. World Health Organization. Disease Outbreak News; Dengue–Global Situation. Available online: https://www.who.int/emergencies/disease-outbreak-news/item/2024-DON518 (accessed on 30 April 2026).
  2. Pan American Health Organization/World Health Organization. Alerta Epidemiológica: Circulación Sostenida de Dengue en la Región de las Américas. 5 de Diciembre de 2023. Washington, D.C. OPS/OMS. 2023. Available online: https://www.paho.org/sites/default/files/2023-12/2023-dic-phe-alerta-dengue-esp-final.pdf (accessed on 24 April 2025).
  3. de Almeida, M.T.; Merighi, D.G.S.; Visnardi, A.B.; Boneto Gonçalves, C.A.; Amorim, V.M.F.; Ferrar, A.S.d.A.; de Souza, A.S.; Guzzo, C.R. Latin America’s Dengue Outbreak Poses a Global Health Threat. Viruses 2025, 17, 57. [Google Scholar] [CrossRef] [PubMed]
  4. World Health Organization. Global Dengue Surveillance. Global Dengue Situation: 2024. Available online: https://worldhealthorg.shinyapps.io/dengue_global/ (accessed on 13 May 2026).
  5. Secretaría de Salud. Panorama Epidemiológico de Dengue. Semana Epidemiológica 52 de 2024. Available online: https://www.gob.mx/salud/documentos/panorama-epidemiologico-de-dengue-2024 (accessed on 14 April 2025).
  6. Pirani, M.; Lorenz, C.; de Azevedo, T.S.; Barbosa, G.L.; Blangiardo, M.; Chiaravalloti-Neto, F. Effects of the El Niño-Southern Oscillation and seasonal weather conditions on Aedes aegypti infestation in the State of São Paulo (Brazil): A Bayesian spatio-temporal study. PLoS Neglected Trop. Dis. 2024, 18, e0012397. [Google Scholar] [CrossRef]
  7. Salehi, M.; Mousa Farkhani, E.; Moghri, J.; Ghasemian, A.; Tabatabaee, S.S.; Hooshmand, E. Global dengue fever management in health systems: Identifying strategies, challenges and solutions—A scoping review protocol. BMJ Open 2025, 15, e097085. [Google Scholar] [CrossRef]
  8. Islam, J.; Frentiu, F.D.; Devine, G.J.; Bambrick, H.; Hu, W. A State-of-the-Science Review of Long-Term Predictions of Climate Change Impacts on Dengue Transmission Risk. Environ. Health Perspect. 2025, 133, 56002. [Google Scholar] [CrossRef]
  9. Sánchez-González, G.; Condé, R.; Noguez-Moreno, R.; López-Vázquez, P.C. Prediction of dengue outbreaks in Mexico based on entomological, meteorological and demographic data. PLoS ONE 2018, 13, e0196047. [Google Scholar] [CrossRef] [PubMed]
  10. Instituto Nacional de Estadística, Geografía e Informática. Temas. Available online: https://www.inegi.org.mx/temas/ (accessed on 20 April 2025).
  11. Comisión Nacional del Agua. Hydrological Information System. Available online: https://sih.conagua.gob.mx/ (accessed on 20 April 2025).
  12. Cheong, Y.L.; Burkart, K.; Leitão, P.J.; Lakes, T. Assessing weather effects on dengue disease in Malaysia. Int. J. Environ. Res. Public Health 2013, 10, 6319–6334. [Google Scholar] [CrossRef]
  13. García, C.; García, L.; Espinosa-Carreón, L.; Ley, C. Abundancia y distribución de Aedes aegypti (Diptera: Culicidae) y dispersión del dengue enGuasave Sinaloa, México [Abundance and distribution of Aedes aegypti (Diptera: Culicidae), and dengue dispersion in Guasave Sinaloa, Mexico]. Rev. Biol. Trop. 2011, 59, 1609–1619. [Google Scholar] [PubMed]
  14. Seposo, X.; Valenzuela, S.; Apostol, G.L. Socio-economic factors and its influence on the association between temperature and dengue incidence in 61 Provinces of the Philippines, 2010–2019. PLoS Neglected Trop. Dis. 2023, 17, e0011700. [Google Scholar] [CrossRef]
  15. Ziegler, R.; Blanckenhorn, W.U.; Mathis, A.; Verhulst, N.O. Video analysis of the locomotory behaviour of Aedes aegypti and Ae. japonicus mosquitoes under different temperature regimes in a laboratory setting. J. Therm. Biol. 2022, 105, 103205. [Google Scholar] [CrossRef] [PubMed]
  16. Childs, M.L.; Lyberger, K.; Harris, M.; Burke, M.; Mordecai, E.A. Climate warming is expanding dengue burden in the Americas and Asia. medRxiv 2025. [Google Scholar] [CrossRef]
  17. Damtew, Y.T.; Tong, M.; Varghese, B.M.; Anikeeva, O.; Hansen, A.; Dear, K.; Zhang, Y.; Morgan, G.; Driscoll, T.; Capon, T.; et al. Effects of high temperatures and heatwaves on dengue fever: A systematic review and meta-analysis. eBioMedicine 2023, 91, 104582. [Google Scholar] [CrossRef]
  18. Hug, D.O.H.; Hugo, E.; Verhulst, N.O. Avoid the light to avoid the heat? Thermal and light preferences of Aedes aegypti mosquito larvae. Anim. Behav. 2024, 219, 123011. [Google Scholar] [CrossRef]
  19. Sinha, S.; Singh, K.; Ravi Kumar, Y.S.; Roy, R.; Phadnis, S.; Meena, V.; Bhattacharyya, S.; Verma, B. Dengue virus pathogenesis and host molecular machineries. J. Biomed. Sci. 2024, 31, 43. [Google Scholar] [CrossRef]
  20. Agasa, L.O.; Thuita, F.; Achia, T.; Karanja, A. Analysing dengue fever spread in Kenya using the Zero-Inflated Poisson model. J. Public Health Afr. 2025, 16, 781. [Google Scholar] [CrossRef] [PubMed]
  21. Balakrishnan, K.N.; Lee, P.C. Impact of COVID-19 on dengue: A two fold challenge to public health in Sabah, Malaysia. J. Infect. Dev. Ctries. 2024, 18, S40–S49. [Google Scholar] [CrossRef]
  22. Santos, T.M.I.L.; Versiani, A.F.; Campos, G.R.F.; Moraes, M.M.; Parra, M.C.P.; Mistrao, N.F.B.; Negri, A.F.; Bagno, F.F.; Galves, M.G.; Moreno, C.M.; et al. Dengue and SARS-CoV-2 co-circulation and overlapping infections in hospitalized patients. Front. Cell. Infect. Microbiol. 2024, 14, 1429309. [Google Scholar] [CrossRef] [PubMed]
  23. Mustafa, M.I.; Makhawi, A.M. The reemergence of dengue virus in Sudan. J. Infect. Public Health 2023, 16, 1392–1395. [Google Scholar] [CrossRef]
  24. Saita, S.; Maeakhian, S.; Silawan, T. Temporal Variations and Spatial Clusters of Dengue in Thailand: Longitudinal Study before and during the Coronavirus Disease (COVID-19) Pandemic. Trop. Med. Infect. Dis. 2022, 7, 171. [Google Scholar] [CrossRef]
  25. Surendran, S.N.; Nagulan, R.; Sivabalakrishnan, K.; Arthiyan, S.; Tharsan, A.; Jayadas, T.T.P.; Raveendran, S.; Kumanan, T.; Ramasamy, R. Reduced dengue incidence during the COVID-19 movement restrictions in Sri Lanka from March 2020 to April 2021. BMC Public Health 2022, 22, 388. [Google Scholar] [CrossRef]
  26. Araújo, J.L.B.; Bomfim, R.; Sampaio Filho, C.I.N.; Cavalcanti, L.P.G.; Lima Neto, A.S.; Andrade, J.S., Jr.; Furtado, V. The impact of COVID-19 mobility restrictions on dengue transmission in urban areas. PLoS Neglected Trop. Dis. 2024, 18, e0012644. [Google Scholar] [CrossRef]
  27. Harapan, H.; Michie, A.; Sasmono, R.T.; Imrie, A. Dengue: A Minireview. Viruses 2020, 12, 829. [Google Scholar] [CrossRef]
  28. Tatura, S.N.N.; Denis, D.; Santoso, M.S.; Hayati, R.F.; Kepel, B.J.; Yohan, B.; Tedjo Sasmono, R. Outbreak of severe dengue associated with DENV-3 in the city of Manado, North Sulawesi, Indonesia. Int. J. Infect. Dis. 2021, 106, 185–196. [Google Scholar] [CrossRef]
  29. Soo, K.M.; Khalid, B.; Ching, S.M.; Chee, H.Y. Meta-analysis of dengue severity during infection by different dengue virus serotypes in primary and secondary infections. PLoS ONE 2016, 11, e0154760. [Google Scholar] [CrossRef]
  30. Mendoza-Hernandez, M.A.; Diaz-Martinez, J.; Hernández-Fuentes, G.A.; Rojas-Larios, F.; Cárdenas-Cárdenas, K.A.; García de León-Flores, P.; Rojas-Cruz, D.A.; Aceves-Calvario, R.; Gómez-Sandoval, E.; Árciga-García, M.; et al. Unexpected Predictors of Mortality During a DENV-3 Outbreak in Western Mexico: Seizures, Polyserositis, and Renal Dysfunction Without Severe Thrombocytopenia. Viruses 2025, 17, 950. [Google Scholar] [CrossRef]
  31. Koo, C.; Kaur, S.; Teh, Z.Y.; Xu, H.; Nasir, A.; Lai, Y.L.; Khan, E.; Ng, L.-C.; Hapuarachchi, H.C. Genetic Variability in Probe Binding Regions Explains False Negative Results of a Molecular Assay for the Detection of Dengue Virus. Vector-Borne Zoonotic Dis. 2016, 16, 489–495. [Google Scholar] [CrossRef]
  32. Ariyaratne, D.; Senadheera, B.; Kuruppu, H.; Pramanayagam Jayadas, T.T.; Gomes, L.; Ranasinghe, D.; Bary, F.; Wijewickrama, A.; Agulilar, S.M.; Bennett, S.; et al. Simultaneous Cocirculation of 2 Genotypes of Dengue Virus Serotype 3 Causing a Large Outbreak in Sri Lanka in 2023. J. Infect. Dis. 2025, 231, 1041–1048. [Google Scholar] [CrossRef]
  33. Islam, A.; Deeba, F.; Tarai, B.; Gupta, E.; Naqvi, I.H.; Abdullah, M.; Dohare, R.; Ahmed, A.; Almajhdi, F.N.; Hussain, T.; et al. Global and local evolutionary dynamics of Dengue virus serotypes 1, 3, and 4. Epidemiol. Infect. 2023, 151, e127. [Google Scholar] [CrossRef] [PubMed]
  34. Lu, X.; Teh, S.Y.; Tay, C.J.; Abu-Kassim, N.F.; Fam, P.S.; Soewono, E. Application of multiple linear regression model and long short-term memory with compartmental model to forecast dengue cases in Selangor, Malaysia based on climate variables. Infect. Dis. Model. 2024, 10, 240–256. [Google Scholar] [CrossRef] [PubMed]
  35. Chen, X.; Moraga, P. Assessing dengue forecasting methods: A comparative study of statistical models and machine learning techniques in Rio de Janeiro, Brazil. Trop. Med. Health 2025, 53, 52. [Google Scholar] [CrossRef]
  36. Gizaw, Z.; Salubi, E.; Pietroniro, A.; Schuster-Wallace, C.J. Impacts of climate change on water-related mosquito-borne diseases in temperate regions: A systematic review of literature and meta-analysis. Acta Trop. 2024, 258, 107324. [Google Scholar] [CrossRef] [PubMed]
  37. Trejo, I.; Barnard, M.; Spencer, J.; Keithley, J.; Martinez, K.; Crooker, I.; Hengartner, N.; Romero-Severson, E.; Manore, C. Changing temperature profiles and the risk of dengue outbreaks. PLoS Clim. 2023, 2, e0000115. [Google Scholar] [CrossRef]
  38. Sajib, A.; Akter, S.; Saha, G.; Hossain, Z. Demographic-environmental effect on dengue outbreaks in 11 countries. PLoS ONE 2024, 19, e0305854. [Google Scholar] [CrossRef] [PubMed]
  39. Liu, K.; Fang, S.; Li, Q.; Lou, Y. Effectiveness evaluation of mosquito suppression strategies on dengue transmission under changing temperature and precipitation. Acta Trop. 2024, 253, 107159. [Google Scholar] [CrossRef] [PubMed]
Figure 1. Climatic variables and dengue cases in seven states of northwestern Mexico by epidemiologic week.
Idr 18 00047 g001
Figure 2. Heatmap of dengue cases in relation to rainfall and maximum and minimum temperatures in the seven states of northwestern Mexico by epidemiological week in 2024.
Idr 18 00047 g002
Table 1. Distribution of diagnosed cases of dengue fever by year.
Year
201720182019202020212022202320242025Total(%)
States in the northwestern area
of the country
Colima011762945296227952732(9.4)
Guanajuato024916520375143832034(7.0)
Jalisco19653233371194211733579337013,635(47.0)
Michoacán0028584259253142574144113(14.2)
Nayarit725285398235972743103593(12.4)
Sinaloa003221625231940499(1.7)
Sonora0041249816214391011102380(8.2)
Total20356040302926966558145918,17211228,986(100)
DENV * serotype
D1139349854417824535753102774(9.6)
D231892917223374542529854107351(25.4)
D30011485852012,9624813,638(47.1)
D4000001329033(0.1)
Not determined612225827591292814109645190(17.8)
Total20356040302926966558145918,17211228,986(100)
Clinical classification
Non-severe dengue043227392183729286102711,7555419,205(66.3)
Dengue with warning signs010210136762142564166151578885(30.7)
Severe dengue010263652216142651656(2.3)
Not clinically classified2031615210210240(0.8)
Total20356040302926966558145918,17211228,986(100)
* DENV: dengue virus.
Table 2. Distribution of diagnosed cases by geographic region (2017–2025).
ColimaGuanajuatoJaliscoMichoacánNayaritSinaloaSonoraTotal
DENV * serotype
D11693061319619176291562774
D2203994036122656321710077351
D31676126662401438207620174113,638
D401101090333
Not determined6843622030820769524735190
Total2732203413,63541133593499238028,986
Patient gender
Male1308996607018911619198111413,196
Female14241038756522221974301126615,790
Gender ratio (M:F)1:1.091:1.041:1.251:1.181:1.221:1.521:1.141:1.20
Patient type
Outpatient1764168110,00331962152299119720,292
Hospitalized9653513593914143820011788639
Death3239330555
Clinical classification
Non-severe dengue17211505931132801897272121919,205
Dengue with warning signs9775013711805163421810398885
Severe dengue332839224499121656
Not clinically classified1022141301240
* DENV: dengue virus.
Table 3. DENV serotypes and clinical severity in northwestern Mexico from 2017 to 2025.
Clinical Classification
Non-Severe DengueDengue with Warning SignsSevere DengueUnknown
D12102 (10.9)462 (5.2)55 (8.4)155 (64.6)
D25187 (27.0)1863 (21.0)285 (43.4)16 (6.7)
D39057 (47.2)4386(49.4)195 (29.7)0 (0.0)
D428 (0.1)4 (0.0)1 (0.2)0 (0.0)
  Not determined2831 (14.8)2170 (24.4)120 (18.3)69 (28.7)
Total19,2058885656240
DENV: Dengue virus; frequency (percentage).
Table 4. Linear regression model.
Dependent Variable: Number of Dengue Cases
ColimaGuanajuatoJaliscoMichoacánNayaritSinaloaSonora
Variable
Week α0.1260.3001.4100.3880.2270.4660.096
Precipitation (mm)-- *−0.907−5.373-- *-- *−0.603-- *
Minimum Temperature (°C)3.4372.35817.5532.8923.451-- *-- *
Mean Temperature (°C)−4.246−2.407−9.160−3.359−2.718−0.516−0.080
Maximum Temperature (°C)1.958-- *−6.5701.018-- *-- *-- *
Constant−22.87114.459143.080−0.4564.0617.4090.579
R2 Adjusted0.2260.2260.2170.2560.1110.1510.049
p<0.001<0.001<0.001<0.001<0.001<0.001<0.001
* Variable not included in the model by the software for the corresponding state; method: backward, pin = 0.05, pout = 0.01; α epidemiological week (52 weeks per year). All values presented for each variable are coefficients calculated by the statistical software using the raw data for each variable as the source.
Disclaimer/Publisher’s Note: The statements, opinions and data contained in all publications are solely those of the individual author(s) and contributor(s) and not of MDPI and/or the editor(s). MDPI and/or the editor(s) disclaim responsibility for any injury to people or property resulting from any ideas, methods, instructions or products referred to in the content.