
Brain Structural and Functional Alterations in Multiple Sclerosis-Related Fatigue: A Systematic Review

 ,
,  , , and
Abstract
1. Introduction
2. Materials and Methods
- -
- The report: author, year, journal;
- -
- The study: participants’ characteristics, definition and criteria for fatigue;
- -
- The participants: sex, age, education, EDSS, MS type, diagnosis criteria, MS duration, medications, other symptoms;
- -
- The research design: scan design;
- -
- The intervention: imaging technique, scanner type, smoothing, software analysis.
3. Results
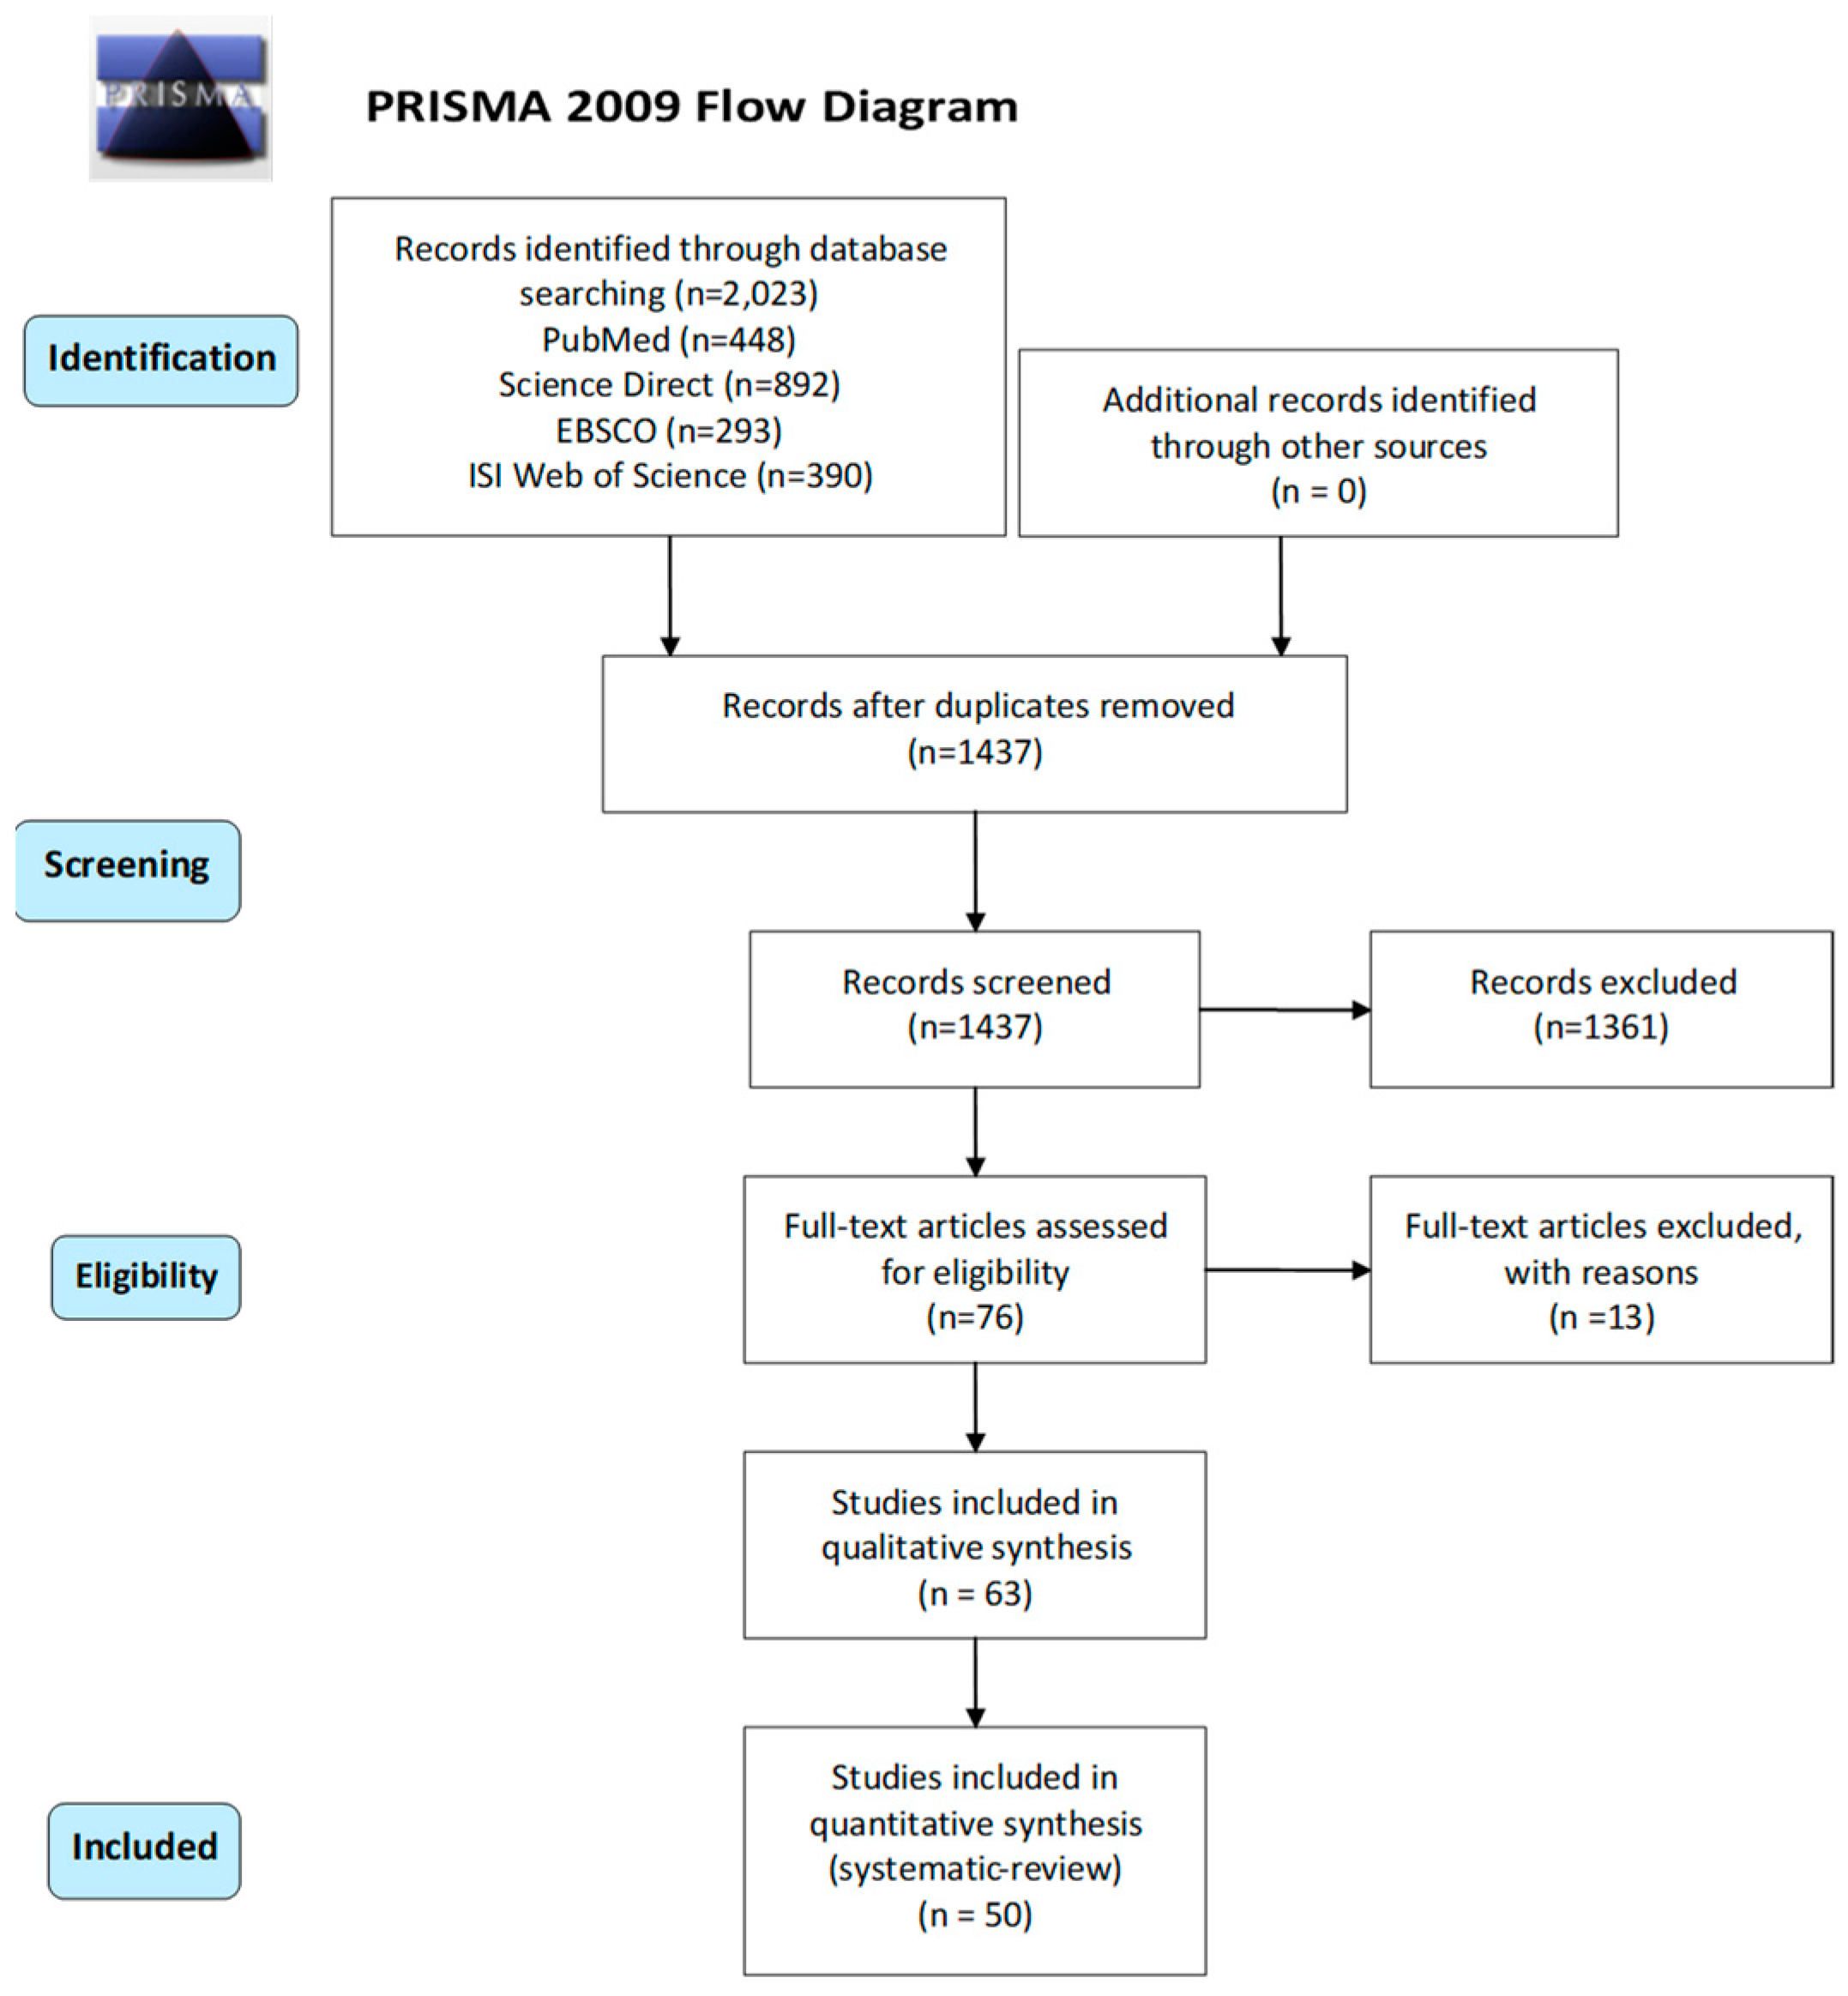
3.1. Search Results
3.1.1. Structural Neuroimaging Findings Correlated to Fatigue
3.1.2. Functional Neuroimaging Findings Correlated to Fatigue
4. Discussion
4.1. Structural Analysis
4.2. Functional Results
5. Conclusions
Supplementary Materials
Author Contributions
Funding
Institutional Review Board Statement
Informed Consent Statement
Data Availability Statement
Conflicts of Interest
Abbreviations
| MS | Multiple sclerosis |
| PCC | Posterior cingulate cortex |
| CNS | Central nervous system |
| ACC | Anterior cingulate cortex |
| MRI | Magnetic resonance imaging |
| SMN | Sensorimotor network |
| fMRI | Functional magnetic resonance imaging |
| rCMRglu | Relative glucose merabolism |
| PET | Positron emission tomography |
| Cho/Cr | Choline/creatine ratio |
| F | Patients with fatigue |
| NF | Patients without fatigue |
| CF | Patients with cognitive fatigue |
| CNF | Patients without cognitive fatigue |
| RRMS | Relapsing-remitting |
| PPMS | Primary progressive |
| SPMS | Secondary progressive |
| HC | Healthy control |
| EDSS | Expanded disability status scale |
| WM | White matter |
| GM | Gray matter |
| LL | Lesion load |
| SPM | Statistical parametric mapping |
| LV | Lesion volume |
| NAA/tCr | N-acetylaspartate to the total creatine |
| PASAT | Paced auditory serial addition task |
| NAWM | Normal-appearing white matter |
| NAGM | Normal-appearing gray matter |
| SMA | Supplementary motor area |
| PMC | Primary motor cortex |
| CMA | Cingulate motor area |
| VBM | Voxel-based morphometry |
| Cth | Cortical thickness |
| DWIs | Diffusion-weighted images |
| DTI | Diffusion tensor imaging |
| RD | Radial diffusivity |
| MD | Mean diffusivity |
| AD | Axial diffusivity |
| MTR | Magnetization transfer ratio |
| rs- fMRI | Resting-state fMRI |
| FC | Functional connectivity |
| NAA | N-acetylaspartate |
| Cr | Creatine |
| MRSI | Proton MR spectroscopic imaging |
| DMN | Default mode network |
References
- Reich, D.S.; Lucchinetti, C.F.; Calabresi, P.A. Multiple Sclerosis. N. Engl. J. Med. 2018, 378, 169–180. [Google Scholar] [CrossRef] [PubMed]
- Browne, P.; Chandraratna, D.; Angood, C.; Tremlett, H.; Baker, C.; Taylor, B.V.; Thompson, A.J. Atlas of Multiple Sclerosis 2013: A growing global problem with widespread inequity. Neurology 2014, 83, 1022–1024. [Google Scholar] [CrossRef] [PubMed]
- Burfeind, K.G.; Yadav, V.; Marks, D.L. Hypothalamic Dysfunction and Multiple Sclerosis: Implications for Fatigue and Weight Dysregulation. Curr. Neurol. Neurosci. Rep. 2016, 16, 98. [Google Scholar] [CrossRef] [PubMed]
- Leone, C.; D’Amico, E.; Cilia, S.; Nicoletti, A.; Di Pino, L.; Patti, F. Cognitive impairment and “invisible symptoms” are not associated with CCSVI in MS. BMC Neurol. 2013, 13, 97. [Google Scholar] [CrossRef]
- Poser, S.; Raun, N.E.; Poser, W. Age at onset, initial symptomatology and the course of multiple sclerosis. Acta Neurol. Scand. 1982, 66, 355–362. [Google Scholar] [CrossRef]
- Polliack, M.L.; Barak, Y.; Achiron, A. Late-onset multiple sclerosis. J. Am. Geriatr. Soc. 2001, 49, 168–171. [Google Scholar] [CrossRef]
- Reynolds, R.; Roncaroli, F.; Nicholas, R.; Radotra, B.; Gveric, D.; Howell, O. The neuropathological basis of clinical progression in multiple sclerosis. Acta Neuropathol. 2011, 122, 155–170. [Google Scholar] [CrossRef]
- Ontaneda, D.; Fox, R.J. Progressive multiple sclerosis. Curr. Opin. Neurol. 2015, 28, 237–243. [Google Scholar] [CrossRef]
- D’Amico, E.; Patti, F.; Zanghi, A.; Zappia, M. A Personalized Approach in Progressive Multiple Sclerosis: The Current Status of Disease Modifying Therapies (DMTs) and Future Perspectives. Int. J. Mol. Sci. 2016, 17, 1725. [Google Scholar] [CrossRef]
- Gelfand, J.M. Multiple sclerosis: Diagnosis, differential diagnosis, and clinical presentation. Handb. Clin. Neurol. 2014, 122, 269–290. [Google Scholar]
- Kluger, B.M.; Krupp, L.B.; Enoka, R.M. Fatigue and fatigability in neurologic illnesses: Proposal for a unified taxonomy. Neurology 2013, 80, 409–416. [Google Scholar] [CrossRef] [PubMed]
- Miller, P.; Soundy, A. The pharmacological and non-pharmacological interventions for the management of fatigue related multiple sclerosis. J. Neurol. Sci. 2017, 381, 41–54. [Google Scholar] [CrossRef] [PubMed]
- Kos, D.; Kerckhofs, E.; Nagels, G.; D’Hooghe, M.B.; Ilsbroukx, S. Origin of fatigue in multiple sclerosis: Review of the literature. Neurorehabil. Neural Repair. 2008, 22, 91–100. [Google Scholar] [CrossRef] [PubMed]
- Manjaly, Z.M.; Harrison, N.A.; Critchley, H.D.; Do, C.T.; Stefanics, G.; Wenderoth, N.; Lutterotti, A.; Muller, A.; Stephan, K.E. Pathophysiological and cognitive mechanisms of fatigue in multiple sclerosis. J. Neurol. Neurosurg. Psychiatry 2019, 90, 642–651. [Google Scholar] [CrossRef]
- Dantzer, R.; Heijnen, C.J.; Kavelaars, A.; Laye, S.; Capuron, L. The neuroimmune basis of fatigue. Trends Neurosci. 2014, 37, 39–46. [Google Scholar] [CrossRef]
- Heitmann, H.; Andlauer, T.F.M.; Korn, T.; Muhlau, M.; Henningsen, P.; Hemmer, B.; Ploner, M. Fatigue, depression, and pain in multiple sclerosis: How neuroinflammation translates into dysfunctional reward processing and anhedonic symptoms. Mult. Scler. 2020, 28, 1020–1027. [Google Scholar] [CrossRef]
- de la Rubia Orti, J.E.; Platero, J.L.; Yang, I.H.; Ceron, J.J.; Tvarijonaviciute, A.; Sabater, P.S.; Benlloch, M.; Sancho-Cantus, D.; Sancho, S. Possible Role of Butyrylcholinesterase in Fat Loss and Decreases in Inflammatory Levels in Patients with Multiple Sclerosis after Treatment with Epigallocatechin Gallate and Coconut Oil: A Pilot Study. Nutrients 2021, 13, 3230. [Google Scholar] [CrossRef]
- MacAllister, W.S.; Krupp, L.B. Multiple sclerosis-related fatigue. Phys. Med. Rehabil. Clin. N. Am. 2005, 16, 483–502. [Google Scholar] [CrossRef]
- Flachenecker, P.; Rufer, A.; Bihler, I.; Hippel, C.; Reiners, K.; Toyka, K.V.; Kesselring, J. Fatigue in MS is related to sympathetic vasomotor dysfunction. Neurology 2003, 61, 851–853. [Google Scholar] [CrossRef]
- Sander, C.; Hildebrandt, H.; Schlake, H.P.; Eling, P.; Hanken, K. Subjective Cognitive Fatigue and Autonomic Abnormalities in Multiple Sclerosis Patients. Front. Neurol. 2017, 8, 475. [Google Scholar] [CrossRef]
- Cortez, M.M.; Nagi Reddy, S.K.; Goodman, B.; Carter, J.L.; Wingerchuk, D.M. Autonomic symptom burden is associated with MS-related fatigue and quality of life. Mult. Scler. Relat. Disord. 2015, 4, 258–263. [Google Scholar] [CrossRef] [PubMed]
- Krbot Skoric, M.; Crnosija, L.; Adamec, I.; Barun, B.; Gabelic, T.; Smoljo, T.; Stanic, I.; Pavicic, T.; Pavlovic, I.; Drulovic, J.; et al. Autonomic symptom burden is an independent contributor to multiple sclerosis related fatigue. Clin. Auton. Res. 2019, 29, 321–328. [Google Scholar] [CrossRef] [PubMed]
- Merkelbach, S.; Dillmann, U.; Kolmel, C.; Holz, I.; Muller, M. Cardiovascular autonomic dysregulation and fatigue in multiple sclerosis. Mult. Scler. 2001, 7, 320–326. [Google Scholar] [CrossRef] [PubMed]
- Dinoto, A.; Baldini, S.; Morelli, M.E.; Pasquin, F.; Bratina, A.; Bosco, A.; Sartori, A.; Manganotti, P. Unveiling the relationship between autonomic involvement, fatigue, and cognitive dysfunction in early relapsing-remitting multiple sclerosis. Neurol. Sci. 2021, 42, 4281–4287. [Google Scholar] [CrossRef]
- Husain, M.; Roiser, J.P. Neuroscience of apathy and anhedonia: A transdiagnostic approach. Nat. Rev. Neurosci. 2018, 19, 470–484. [Google Scholar] [CrossRef]
- Swardfager, W.; Rosenblat, J.D.; Benlamri, M.; McIntyre, R.S. Mapping inflammation onto mood: Inflammatory mediators of anhedonia. Neurosci. Biobehav. Rev. 2016, 64, 148–166. [Google Scholar] [CrossRef]
- Der-Avakian, A.; Markou, A. The neurobiology of anhedonia and other reward-related deficits. Trends Neurosci. 2012, 35, 68–77. [Google Scholar] [CrossRef]
- Seixas, D.; Palace, J.; Tracey, I. Chronic pain disrupts the reward circuitry in multiple sclerosis. Eur. J. Neurosci. 2016, 44, 1928–1934. [Google Scholar] [CrossRef]
- Penner, I.K.; Paul, F. Fatigue as a symptom or comorbidity of neurological diseases. Nat. Rev. Neurol. 2017, 13, 662–675. [Google Scholar] [CrossRef]
- Solaro, C.; Gamberini, G.; Masuccio, F.G. Depression in Multiple Sclerosis: Epidemiology, Aetiology, Diagnosis and Treatment. CNS Drugs 2018, 32, 117–133. [Google Scholar] [CrossRef]
- Palotai, M.; Guttmann, C.R. Brain anatomical correlates of fatigue in multiple sclerosis. Mult. Scler. 2020, 26, 751–764. [Google Scholar] [CrossRef] [PubMed]
- Schmaal, L.; Veltman, D.J.; van Erp, T.G.; Samann, P.G.; Frodl, T.; Jahanshad, N.; Loehrer, E.; Tiemeier, H.; Hofman, A.; Niessen, W.J.; et al. Subcortical brain alterations in major depressive disorder: Findings from the ENIGMA Major Depressive Disorder working group. Mol. Psychiatry 2016, 21, 806–812. [Google Scholar] [CrossRef] [PubMed]
- Stephan, K.E.; Manjaly, Z.M.; Mathys, C.D.; Weber, L.A.; Paliwal, S.; Gard, T.; Tittgemeyer, M.; Fleming, S.M.; Haker, H.; Seth, A.K.; et al. Allostatic Self-efficacy: A Metacognitive Theory of Dyshomeostasis-Induced Fatigue and Depression. Front. Hum. Neurosci. 2016, 10, 550. [Google Scholar] [CrossRef] [PubMed]
- Kuppuswamy, A. The fatigue conundrum. Brain 2017, 140, 2240–2245. [Google Scholar] [CrossRef] [PubMed]
- Savitz, J.; Harrison, N.A. Interoception and Inflammation in Psychiatric Disorders. Biol. Psychiatry Cogn. Neurosci. Neuroimaging 2018, 3, 514–524. [Google Scholar] [CrossRef]
- McMorris, T.; Barwood, M.; Corbett, J. Central fatigue theory and endurance exercise: Toward an interoceptive model. Neurosci. Biobehav. Rev. 2018, 93, 93–107. [Google Scholar] [CrossRef]
- Heesen, C.; Nawrath, L.; Reich, C.; Bauer, N.; Schulz, K.H.; Gold, S.M. Fatigue in multiple sclerosis: An example of cytokine mediated sickness behaviour? J. Neurol. Neurosurg. Psychiatry 2006, 77, 34–39. [Google Scholar] [CrossRef]
- Bakshi, R.; Miletich, R.S.; Henschel, K.; Shaikh, Z.A.; Janardhan, V.; Wasay, M.; Stengel, L.M.; Ekes, R.; Kinkel, P.R. Fatigue in multiple sclerosis: Cross-sectional correlation with brain MRI findings in 71 patients. Neurology 1999, 53, 1151–1153. [Google Scholar] [CrossRef]
- Colombo, B.; Martinelli Boneschi, F.; Rossi, P.; Rovaris, M.; Maderna, L.; Filippi, M.; Comi, G. MRI and motor evoked potential findings in nondisabled multiple sclerosis patients with and without symptoms of fatigue. J. Neurol. 2000, 247, 506–509. [Google Scholar] [CrossRef]
- Riccitelli, G.; Rocca, M.A.; Forn, C.; Colombo, B.; Comi, G.; Filippi, M. Voxelwise assessment of the regional distribution of damage in the brains of patients with multiple sclerosis and fatigue. AJNR Am. J. Neuroradiol. 2011, 32, 874–879. [Google Scholar] [CrossRef]
- Thickbroom, G.W.; Sacco, P.; Faulkner, D.L.; Kermode, A.G.; Mastaglia, F.L. Enhanced corticomotor excitability with dynamic fatiguing exercise of the lower limb in multiple sclerosis. J. Neurol. 2008, 255, 1001–1005. [Google Scholar] [CrossRef] [PubMed][Green Version]
- Blamire, A.M.; Cader, S.; Lee, M.; Palace, J.; Matthews, P.M. Axonal damage in the spinal cord of multiple sclerosis patients detected by magnetic resonance spectroscopy. Magn. Reson. Med. 2007, 58, 880–885. [Google Scholar] [CrossRef] [PubMed]
- Induruwa, I.; Constantinescu, C.S.; Gran, B. Fatigue in multiple sclerosis—A brief review. J. Neurol. Sci. 2012, 323, 9–15. [Google Scholar] [CrossRef] [PubMed]
- Yigit, P.; Acikgoz, A.; Mehdiyev, Z.; Dayi, A.; Ozakbas, S. The relationship between cognition, depression, fatigue, and disability in patients with multiple sclerosis. Ir. J. Med. Sci. 2020, 190, 1129–1136. [Google Scholar] [CrossRef] [PubMed]
- Hugos, C.L.; Copperman, L.F.; Fuller, B.E.; Yadav, V.; Lovera, J.; Bourdette, D.N. Clinical trial of a formal group fatigue program in multiple sclerosis. Mult. Scler. 2010, 16, 724–732. [Google Scholar] [CrossRef]
- Kerling, A.; Keweloh, K.; Tegtbur, U.; Kuck, M.; Grams, L.; Horstmann, H.; Windhagen, A. Effects of a Short Physical Exercise Intervention on Patients with Multiple Sclerosis (MS). Int. J. Mol. Sci. 2015, 16, 15761–15775. [Google Scholar] [CrossRef]
- Rietberg, M.B.; van Wegen, E.E.; Uitdehaag, B.M.; Kwakkel, G. The association between perceived fatigue and actual level of physical activity in multiple sclerosis. Mult. Scler. 2011, 17, 1231–1237. [Google Scholar] [CrossRef]
- Surakka, J.; Romberg, A.; Ruutiainen, J.; Aunola, S.; Virtanen, A.; Karppi, S.L.; Maentaka, K. Effects of aerobic and strength exercise on motor fatigue in men and women with multiple sclerosis: A randomized controlled trial. Clin. Rehabil. 2004, 18, 737–746. [Google Scholar] [CrossRef]
- Rottoli, M.; La Gioia, S.; Frigeni, B.; Barcella, V. Pathophysiology, assessment and management of multiple sclerosis fatigue: An update. Expert Rev. Neurother. 2017, 17, 373–379. [Google Scholar] [CrossRef]
- Calabrese, M.; Rinaldi, F.; Grossi, P.; Mattisi, I.; Bernardi, V.; Favaretto, A.; Perini, P.; Gallo, P. Basal ganglia and frontal/parietal cortical atrophy is associated with fatigue in relapsing-remitting multiple sclerosis. Mult. Scler. 2010, 16, 1220–1228. [Google Scholar] [CrossRef]
- Tomasevic, L.; Zito, G.; Pasqualetti, P.; Filippi, M.; Landi, D.; Ghazaryan, A.; Lupoi, D.; Porcaro, C.; Bagnato, F.; Rossini, P.; et al. Cortico-muscular coherence as an index of fatigue in multiple sclerosis. Mult. Scler. 2013, 19, 334–343. [Google Scholar] [CrossRef] [PubMed]
- Morgante, F.; Dattola, V.; Crupi, D.; Russo, M.; Rizzo, V.; Ghilardi, M.F.; Terranova, C.; Girlanda, P.; Quartarone, A. Is central fatigue in multiple sclerosis a disorder of movement preparation? J. Neurol. 2011, 258, 263–272. [Google Scholar] [CrossRef] [PubMed]
- Andreasen, A.K.; Jakobsen, J.; Soerensen, L.; Andersen, H.; Petersen, T.; Bjarkam, C.R.; Ahdidan, J. Regional brain atrophy in primary fatigued patients with multiple sclerosis. Neuroimage 2010, 50, 608–615. [Google Scholar] [CrossRef] [PubMed]
- Codella, M.; Rocca, M.A.; Colombo, B.; Rossi, P.; Comi, G.; Filippi, M. A preliminary study of magnetization transfer and diffusion tensor MRI of multiple sclerosis patients with fatigue. J. Neurol. 2002, 249, 535–537. [Google Scholar] [CrossRef] [PubMed]
- Gobbi, C.; Rocca, M.A.; Pagani, E.; Riccitelli, G.C.; Pravata, E.; Radaelli, M.; Martinelli-Boneschi, F.; Falini, A.; Copetti, M.; Comi, G.; et al. Forceps minor damage and co-occurrence of depression and fatigue in multiple sclerosis. Mult. Scler. 2014, 20, 1633–1640. [Google Scholar] [CrossRef] [PubMed]
- Gobbi, C.; Rocca, M.A.; Riccitelli, G.; Pagani, E.; Messina, R.; Preziosa, P.; Colombo, B.; Rodegher, M.; Falini, A.; Comi, G.; et al. Influence of the topography of brain damage on depression and fatigue in patients with multiple sclerosis. Mult. Scler. 2014, 20, 192–201. [Google Scholar] [CrossRef]
- Palotai, M.; Mike, A.; Cavallari, M.; Strammer, E.; Orsi, G.; Healy, B.C.; Schregel, K.; Illes, Z.; Guttmann, C.R. Changes to the septo-fornical area might play a role in the pathogenesis of anxiety in multiple sclerosis. Mult. Scler. 2018, 24, 1105–1114. [Google Scholar] [CrossRef]
- Palotai, M.; Small, C.; Makris, N.; Somes, N.G.; Pinzon, A.M.; Rathi, Y.; Marzullo, A.; Levitt, J.J.; Bakshi, R.; Chitnis, T.; et al. Microstructural Changes in the Left Mesocorticolimbic Pathway are Associated with the Comorbid Development of Fatigue and Depression in Multiple Sclerosis. J. Neuroimaging 2021, 31, 501–507. [Google Scholar] [CrossRef]
- Cogliati Dezza, I.; Zito, G.; Tomasevic, L.; Filippi, M.M.; Ghazaryan, A.; Porcaro, C.; Squitti, R.; Ventriglia, M.; Lupoi, D.; Tecchio, F. Functional and structural balances of homologous sensorimotor regions in multiple sclerosis fatigue. J. Neurol. 2015, 262, 614–622. [Google Scholar] [CrossRef]
- Bisecco, A.; Nardo, F.D.; Docimo, R.; Caiazzo, G.; d’Ambrosio, A.; Bonavita, S.; Capuano, R.; Sinisi, L.; Cirillo, M.; Esposito, F.; et al. Fatigue in multiple sclerosis: The contribution of resting-state functional connectivity reorganization. Mult. Scler. 2018, 24, 1696–1705. [Google Scholar] [CrossRef]
- Cruz Gomez, A.J.; Ventura Campos, N.; Belenguer, A.; Avila, C.; Forn, C. Regional brain atrophy and functional connectivity changes related to fatigue in multiple sclerosis. PLoS ONE 2013, 8, e77914. [Google Scholar] [CrossRef] [PubMed]
- Filippi, M.; Rocca, M.A.; Colombo, B.; Falini, A.; Codella, M.; Scotti, G.; Comi, G. Functional magnetic resonance imaging correlates of fatigue in multiple sclerosis. Neuroimage 2002, 15, 559–567. [Google Scholar] [CrossRef] [PubMed]
- Hidalgo de la Cruz, M.; d’Ambrosio, A.; Valsasina, P.; Pagani, E.; Colombo, B.; Rodegher, M.; Falini, A.; Comi, G.; Filippi, M.; Rocca, M.A. Abnormal functional connectivity of thalamic sub-regions contributes to fatigue in multiple sclerosis. Mult. Scler. 2018, 24, 1183–1195. [Google Scholar] [CrossRef]
- Rocca, M.A.; Meani, A.; Riccitelli, G.C.; Colombo, B.; Rodegher, M.; Falini, A.; Comi, G.; Filippi, M. Abnormal adaptation over time of motor network recruitment in multiple sclerosis patients with fatigue. Mult. Scler. 2016, 22, 1144–1153. [Google Scholar] [CrossRef] [PubMed]
- Rocca, M.A.; Agosta, F.; Colombo, B.; Mezzapesa, D.M.; Falini, A.; Comi, G.; Filippi, M. fMRI changes in relapsing-remitting multiple sclerosis patients complaining of fatigue after IFNbeta-1a injection. Hum. Brain Mapp. 2007, 28, 373–382. [Google Scholar] [CrossRef] [PubMed]
- Rocca, M.A.; Gatti, R.; Agosta, F.; Broglia, P.; Rossi, P.; Riboldi, E.; Corti, M.; Comi, G.; Filippi, M. Influence of task complexity during coordinated hand and foot movements in MS patients with and without fatigue. A kinematic and functional MRI study. J. Neurol. 2009, 256, 470–482. [Google Scholar] [CrossRef] [PubMed]
- Roelcke, U.; Kappos, L.; Lechner-Scott, J.; Brunnschweiler, H.; Huber, S.; Ammann, W.; Plohmann, A.; Dellas, S.; Maguire, R.P.; Missimer, J.; et al. Reduced glucose metabolism in the frontal cortex and basal ganglia of multiple sclerosis patients with fatigue: A 18F-fluorodeoxyglucose positron emission tomography study. Neurology 1997, 48, 1566–1571. [Google Scholar] [CrossRef]
- Specogna, I.; Casagrande, F.; Lorusso, A.; Catalan, M.; Gorian, A.; Zugna, L.; Longo, R.; Zorzon, M.; Naccarato, M.; Pizzolato, G.; et al. Functional MRI during the execution of a motor task in patients with multiple sclerosis and fatigue. Radiol. Med. 2012, 117, 1398–1407. [Google Scholar] [CrossRef]
- Stefancin, P.; Govindarajan, S.T.; Krupp, L.; Charvet, L.; Duong, T.Q. Resting-state functional connectivity networks associated with fatigue in multiple sclerosis with early age onset. Mult. Scler. Relat. Disord. 2019, 31, 101–105. [Google Scholar] [CrossRef]
- Hanken, K.; Eling, P.; Kastrup, A.; Klein, J.; Hildebrandt, H. Integrity of hypothalamic fibers and cognitive fatigue in multiple sclerosis. Mult. Scler. Relat. Disord. 2015, 4, 39–46. [Google Scholar] [CrossRef]
- Hanken, K.; Francis, Y.; Kastrup, A.; Eling, P.; Klein, J.; Hildebrandt, H. On the role of the amygdala for experiencing fatigue in patients with multiple sclerosis. Mult. Scler. Relat. Disord. 2018, 20, 67–72. [Google Scholar] [CrossRef]
- Hanken, K.; Manousi, A.; Klein, J.; Kastrup, A.; Eling, P.; Hildebrandt, H. On the relation between self-reported cognitive fatigue and the posterior hypothalamic-brainstem network. Eur. J. Neurol. 2016, 23, 101–109. [Google Scholar] [CrossRef] [PubMed]
- Moher, D.; Liberati, A.; Tetzlaff, J.; Altman, D.G.; Group, P. Preferred reporting items for systematic reviews and meta-analyses: The PRISMA statement. BMJ 2009, 339, b2535. [Google Scholar] [CrossRef] [PubMed]
- Ouzzani, M.; Hammady, H.; Fedorowicz, Z.; Elmagarmid, A. Rayyan-a web and mobile app for systematic reviews. Syst. Rev. 2016, 5, 210. [Google Scholar] [CrossRef] [PubMed]
- Wilting, J.; Rolfsnes, H.O.; Zimmermann, H.; Behrens, M.; Fleischer, V.; Zipp, F.; Groger, A. Structural correlates for fatigue in early relapsing remitting multiple sclerosis. Eur. Radiol. 2016, 26, 515–523. [Google Scholar] [CrossRef] [PubMed]
- Rocca, M.A.; Parisi, L.; Pagani, E.; Copetti, M.; Rodegher, M.; Colombo, B.; Comi, G.; Falini, A.; Filippi, M. Regional but not global brain damage contributes to fatigue in multiple sclerosis. Radiology 2014, 273, 511–520. [Google Scholar] [CrossRef]
- Bernitsas, E.; Yarraguntla, K.; Bao, F.; Sood, R.; Santiago-Martinez, C.; Govindan, R.; Khan, O.; Seraji-Bozorgzad, N. Structural and Neuronal Integrity Measures of Fatigue Severity in Multiple Sclerosis. Brain Sci. 2017, 7, 102. [Google Scholar] [CrossRef]
- Palotai, M.; Cavallari, M.; Koubiyr, I.; Pinzon, A.M.; Nazeri, A.; Healy, B.C.; Glanz, B.; Weiner, H.L.; Chitnis, T.; Guttmann, C.R.G. Microstructural fronto-striatal and temporo-insular alterations are associated with fatigue in patients with multiple sclerosis independent of white matter lesion load and depression. Mult. Scler. J. 2020, 26, 1708–1718. [Google Scholar] [CrossRef]
- Sander, C.; Eling, P.; Hanken, K.; Klein, J.; Kastrup, A.; Hildebrandt, H. The Impact of MS-Related Cognitive Fatigue on Future Brain Parenchymal Loss and Relapse: A 17-Month Follow-up Study. Front. Neurol. 2016, 7, 155. [Google Scholar] [CrossRef]
- Chalah, M.A.; Kauv, P.; Creange, A.; Hodel, J.; Lefaucheur, J.P.; Ayache, S.S. Neurophysiological, radiological and neuropsychological evaluation of fatigue in multiple sclerosis. Mult. Scler. Relat. Disord. 2019, 28, 145–152. [Google Scholar] [CrossRef]
- Damasceno, A.; Damasceno, B.P.; Cendes, F. Atrophy of reward-related striatal structures in fatigued MS patients is independent of physical disability. Mult. Scler. 2016, 22, 822–829. [Google Scholar] [CrossRef] [PubMed]
- Derache, N.; Grassiot, B.; Mezenge, F.; Emmanuelle Dugue, A.; Desgranges, B.; Constans, J.M.; Defer, G.L. Fatigue is associated with metabolic and density alterations of cortical and deep gray matter in Relapsing-Remitting-Multiple Sclerosis patients at the earlier stage of the disease: A PET/MR study. Mult. Scler. Relat. Disord. 2013, 2, 362–369. [Google Scholar] [CrossRef]
- Niepel, G.; Tench Ch, R.; Morgan, P.S.; Evangelou, N.; Auer, D.P.; Constantinescu, C.S. Deep gray matter and fatigue in MS: A T1 relaxation time study. J. Neurol. 2006, 253, 896–902. [Google Scholar] [CrossRef] [PubMed]
- Palotai, M.; Nazeri, A.; Cavallari, M.; Healy, B.C.; Glanz, B.; Gold, S.M.; Weiner, H.L.; Chitnis, T.; Guttmann, C.R.G. History of fatigue in multiple sclerosis is associated with grey matter atrophy. Sci. Rep. 2019, 9, 14781. [Google Scholar] [CrossRef]
- Pellicano, C.; Gallo, A.; Li, X.; Ikonomidou, V.N.; Evangelou, I.E.; Ohayon, J.M.; Stern, S.K.; Ehrmantraut, M.; Cantor, F.; McFarland, H.F.; et al. Relationship of cortical atrophy to fatigue in patients with multiple sclerosis. Arch. Neurol. 2010, 67, 447–453. [Google Scholar] [CrossRef] [PubMed]
- Sepulcre, J.; Masdeu, J.C.; Goni, J.; Arrondo, G.; Velez de Mendizabal, N.; Bejarano, B.; Villoslada, P. Fatigue in multiple sclerosis is associated with the disruption of frontal and parietal pathways. Mult. Scler. 2009, 15, 337–344. [Google Scholar] [CrossRef] [PubMed]
- Tedeschi, G.; Dinacci, D.; Lavorgna, L.; Prinster, A.; Savettieri, G.; Quattrone, A.; Livrea, P.; Messina, C.; Reggio, A.; Servillo, G.; et al. Correlation between fatigue and brain atrophy and lesion load in multiple sclerosis patients independent of disability. J. Neurol. Sci. 2007, 263, 15–19. [Google Scholar] [CrossRef]
- Zellini, F.; Niepel, G.; Tench, C.R.; Constantinescu, C.S. Hypothalamic involvement assessed by T1 relaxation time in patients with relapsing-remitting multiple sclerosis. Mult. Scler. 2009, 15, 1442–1449. [Google Scholar] [CrossRef]
- Marchesi, O.; Vizzino, C.; Meani, A.; Conti, L.; Riccitelli, G.C.; Preziosa, P.; Filippi, M.; Rocca, M.A. Fatigue in multiple sclerosis patients with different clinical phenotypes: A clinical and magnetic resonance imaging study. Eur. J. Neurol. 2020, 27, 2549–2560. [Google Scholar] [CrossRef]
- Genova, H.M.; Rajagopalan, V.; Deluca, J.; Das, A.; Binder, A.; Arjunan, A.; Chiaravalloti, N.; Wylie, G. Examination of cognitive fatigue in multiple sclerosis using functional magnetic resonance imaging and diffusion tensor imaging. PLoS ONE 2013, 8, e78811. [Google Scholar] [CrossRef]
- Rocca, M.A.; Absinta, M.; Valsasina, P.; Copetti, M.; Caputo, D.; Comi, G.; Filippi, M. Abnormal cervical cord function contributes to fatigue in multiple sclerosis. Mult. Scler. 2012, 18, 1552–1559. [Google Scholar] [CrossRef] [PubMed]
- Svolgaard, O.; Andersen, K.W.; Bauer, C.; Madsen, K.H.; Blinkenberg, M.; Selleberg, F.; Siebner, H.R. Cerebellar and premotor activity during a non-fatiguing grip task reflects motor fatigue in relapsing-remitting multiple sclerosis. PLoS ONE 2018, 13, e0201162. [Google Scholar] [CrossRef] [PubMed]
- Tartaglia, M.C.; Narayanan, S.; Francis, S.J.; Santos, A.C.; De Stefano, N.; Lapierre, Y.; Arnold, D.L. The relationship between diffuse axonal damage and fatigue in multiple sclerosis. Arch. Neurol. 2004, 61, 201–207. [Google Scholar] [CrossRef] [PubMed][Green Version]
- Tellez, N.; Alonso, J.; Rio, J.; Tintore, M.; Nos, C.; Montalban, X.; Rovira, A. The basal ganglia: A substrate for fatigue in multiple sclerosis. Neuroradiology 2008, 50, 17–23. [Google Scholar] [CrossRef] [PubMed]
- Zaini, W.H.; Giuliani, F.; Beaulieu, C.; Kalra, S.; Hanstock, C. Fatigue in Multiple Sclerosis: Assessing Pontine Involvement Using Proton MR Spectroscopic Imaging. PLoS ONE 2016, 11, e0149622. [Google Scholar] [CrossRef]
- Campo, C.G.; Salamone, P.C.; Rodriguez-Arriagada, N.; Richter, F.; Herrera, E.; Bruno, D.; Pagani Cassara, F.; Sinay, V.; Garcia, A.M.; Ibanez, A.; et al. Fatigue in multiple sclerosis is associated with multimodal interoceptive abnormalities. Mult. Scler. 2020, 26, 1845–1853. [Google Scholar] [CrossRef]
- Pravata, E.; Zecca, C.; Sestieri, C.; Caulo, M.; Riccitelli, G.C.; Rocca, M.A.; Filippi, M.; Cianfoni, A.; Gobbi, C. Hyperconnectivity of the dorsolateral prefrontal cortex following mental effort in multiple sclerosis patients with cognitive fatigue. Mult. Scler. 2016, 22, 1665–1675. [Google Scholar] [CrossRef]
- Hanken, K.; Eling, P.; Klein, J.; Klaene, E.; Hildebrandt, H. Different cortical underpinnings for fatigue and depression in MS? Mult. Scler. Relat. Disord. 2016, 6, 81–86. [Google Scholar] [CrossRef]
- Codella, M.; Rocca, M.A.; Colombo, B.; Martinelli-Boneschi, F.; Comi, G.; Filippi, M. Cerebral grey matter pathology and fatigue in patients with multiple sclerosis: A preliminary study. J. Neurol Sci 2002, 194, 71–74. [Google Scholar] [CrossRef]
- Rovira, A.; Leon, A. MR in the diagnosis and monitoring of multiple sclerosis: An overview. Eur. J. Radiol. 2008, 67, 409–414. [Google Scholar] [CrossRef]
- Yousaf, T.; Dervenoulas, G.; Politis, M. Advances in MRI Methodology. Int. Rev. Neurobiol. 2018, 141, 31–76. [Google Scholar] [PubMed]
- Filippi, M.; Horsfield, M.A.; Bressi, S.; Martinelli, V.; Baratti, C.; Reganati, P.; Campi, A.; Miller, D.H.; Comi, G. Intra- and inter-observer agreement of brain MRI lesion volume measurements in multiple sclerosis. A comparison of techniques. Brain 1995, 118 Pt 6, 1593–1600. [Google Scholar] [CrossRef] [PubMed]
- De Groot, C.J.; Bergers, E.; Kamphorst, W.; Ravid, R.; Polman, C.H.; Barkhof, F.; van der Valk, P. Post-mortem MRI-guided sampling of multiple sclerosis brain lesions: Increased yield of active demyelinating and (p)reactive lesions. Brain 2001, 124 Pt 8, 1635–1645. [Google Scholar] [CrossRef] [PubMed]
- Bienenstock, E.L.; Cooper, L.N.; Munro, P.W. Theory for the development of neuron selectivity: Orientation specificity and binocular interaction in visual cortex. J. Neurosci. 1982, 2, 32–48. [Google Scholar] [CrossRef]
- Ciccarelli, O.; Brex, P.A.; Thompson, A.J.; Miller, D.H. Disability and lesion load in MS: A reassessment with MS functional composite score and 3D fast FLAIR. J. Neurol. 2002, 249, 18–24. [Google Scholar] [CrossRef]
- De Stefano, N.; Airas, L.; Grigoriadis, N.; Mattle, H.P.; O’Riordan, J.; Oreja-Guevara, C.; Sellebjerg, F.; Stankoff, B.; Walczak, A.; Wiendl, H.; et al. Clinical relevance of brain volume measures in multiple sclerosis. CNS Drugs 2014, 28, 147–156. [Google Scholar] [CrossRef]
- Marrie, R.A.; Fisher, E.; Miller, D.M.; Lee, J.C.; Rudick, R.A. Association of fatigue and brain atrophy in multiple sclerosis. J. Neurol. Sci. 2005, 228, 161–166. [Google Scholar] [CrossRef]
- Capone, F.; Collorone, S.; Cortese, R.; Di Lazzaro, V.; Moccia, M. Fatigue in multiple sclerosis: The role of thalamus. Mult. Scler. 2020, 26, 6–16. [Google Scholar] [CrossRef]
- Chaudhuri, A.; Behan, P.O. Fatigue and basal ganglia. J. Neurol. Sci. 2000, 179, 34–42. [Google Scholar] [CrossRef]
- Haber, S.N.; Knutson, B. The reward circuit: Linking primate anatomy and human imaging. Neuropsychopharmacology 2010, 35, 4–26. [Google Scholar] [CrossRef]
- Bushnell, M.C.; Ceko, M.; Low, L.A. Cognitive and emotional control of pain and its disruption in chronic pain. Nat. Rev. Neurosci. 2013, 14, 502–511. [Google Scholar] [CrossRef] [PubMed]
- Cardoso-Cruz, H.; Sousa, M.; Vieira, J.B.; Lima, D.; Galhardo, V. Prefrontal cortex and mediodorsal thalamus reduced connectivity is associated with spatial working memory impairment in rats with inflammatory pain. Pain 2013, 154, 2397–2406. [Google Scholar] [CrossRef] [PubMed]
- Zhou, H.; Martinez, E.; Lin, H.H.; Yang, R.; Dale, J.A.; Liu, K.; Huang, D.; Wang, J. Inhibition of the Prefrontal Projection to the Nucleus Accumbens Enhances Pain Sensitivity and Affect. Front. Cell Neurosci. 2018, 12, 240. [Google Scholar] [CrossRef] [PubMed]
- Eshaghi, A.; Marinescu, R.V.; Young, A.L.; Firth, N.C.; Prados, F.; Jorge Cardoso, M.; Tur, C.; De Angelis, F.; Cawley, N.; Brownlee, W.J.; et al. Progression of regional grey matter atrophy in multiple sclerosis. Brain 2018, 141, 1665–1677. [Google Scholar] [CrossRef]
- Brenner, P.; Piehl, F. Fatigue and depression in multiple sclerosis: Pharmacological and non-pharmacological interventions. Acta Neurol. Scand. 2016, 134 (Suppl. 200), 47–54. [Google Scholar] [CrossRef]
- Sbardella, E.; Tona, F.; Petsas, N.; Pantano, P. DTI Measurements in Multiple Sclerosis: Evaluation of Brain Damage and Clinical Implications. Mult. Scler. Int. 2013, 2013, 671730. [Google Scholar] [CrossRef]
- Basser, P.J.; Mattiello, J.; LeBihan, D. MR diffusion tensor spectroscopy and imaging. Biophys. J. 1994, 66, 259–267. [Google Scholar] [CrossRef]
- Barkhof, F. The clinico-radiological paradox in multiple sclerosis revisited. Curr. Opin. Neurol. 2002, 15, 239–245. [Google Scholar] [CrossRef]
- Rovaris, M.; Gallo, A.; Valsasina, P.; Benedetti, B.; Caputo, D.; Ghezzi, A.; Montanari, E.; Sormani, M.P.; Bertolotto, A.; Mancardi, G.; et al. Short-term accrual of gray matter pathology in patients with progressive multiple sclerosis: An in vivo study using diffusion tensor MRI. Neuroimage 2005, 24, 1139–1146. [Google Scholar] [CrossRef]
- Rovaris, M.; Bozzali, M.; Iannucci, G.; Ghezzi, A.; Caputo, D.; Montanari, E.; Bertolotto, A.; Bergamaschi, R.; Capra, R.; Mancardi, G.L.; et al. Assessment of normal-appearing white and gray matter in patients with primary progressive multiple sclerosis: A diffusion-tensor magnetic resonance imaging study. Arch. Neurol. 2002, 59, 1406–1412. [Google Scholar] [CrossRef]
- Pulizzi, A.; Rovaris, M.; Judica, E.; Sormani, M.P.; Martinelli, V.; Comi, G.; Filippi, M. Determinants of disability in multiple sclerosis at various disease stages: A multiparametric magnetic resonance study. Arch. Neurol. 2007, 64, 1163–1168. [Google Scholar] [CrossRef] [PubMed][Green Version]
- Bammer, R.; Augustin, M.; Strasser-Fuchs, S.; Seifert, T.; Kapeller, P.; Stollberger, R.; Ebner, F.; Hartung, H.P.; Fazekas, F. Magnetic resonance diffusion tensor imaging for characterizing diffuse and focal white matter abnormalities in multiple sclerosis. Magn. Reson. Med. 2000, 44, 583–591. [Google Scholar] [CrossRef]
- Bozzali, M.; Cercignani, M.; Sormani, M.P.; Comi, G.; Filippi, M. Quantification of brain gray matter damage in different MS phenotypes by use of diffusion tensor MR imaging. AJNR Am. J. Neuroradiol. 2002, 23, 985–988. [Google Scholar] [PubMed]
- Bisecco, A.; Caiazzo, G.; d’Ambrosio, A.; Sacco, R.; Bonavita, S.; Docimo, R.; Cirillo, M.; Pagani, E.; Filippi, M.; Esposito, F.; et al. Fatigue in multiple sclerosis: The contribution of occult white matter damage. Mult. Scler. 2016, 22, 1676–1684. [Google Scholar] [CrossRef] [PubMed]
- Ogawa, S.; Menon, R.S.; Kim, S.G.; Ugurbil, K. On the characteristics of functional magnetic resonance imaging of the brain. Annu. Rev. Biophys. Biomol. Struct. 1998, 27, 447–474. [Google Scholar] [CrossRef]
- Ogawa, S.; Tank, D.W.; Menon, R.; Ellermann, J.M.; Kim, S.G.; Merkle, H.; Ugurbil, K. Intrinsic signal changes accompanying sensory stimulation: Functional brain mapping with magnetic resonance imaging. Proc. Natl. Acad. Sci. USA 1992, 89, 5951–5955. [Google Scholar] [CrossRef]
- Phelps, M.E. PET: A biological imaging technique. Neurochem. Res. 1991, 16, 929–940. [Google Scholar] [CrossRef]
- Basile, B.; Castelli, M.; Monteleone, F.; Nocentini, U.; Caltagirone, C.; Centonze, D.; Cercignani, M.; Bozzali, M. Functional connectivity changes within specific networks parallel the clinical evolution of multiple sclerosis. Mult. Scler. 2014, 20, 1050–1057. [Google Scholar] [CrossRef]
- Tanji, J. Sequential organization of multiple movements: Involvement of cortical motor areas. Annu. Rev. Neurosci. 2001, 24, 631–651. [Google Scholar] [CrossRef]
- Tanji, J. The supplementary motor area in the cerebral cortex. Neurosci. Res. 1994, 19, 251–268. [Google Scholar] [CrossRef]


| Reference | Imaging Technique | Subjects | Fatigue Scale | Matched Variables | Unmatched Variables | Neuroimaging Findings Correlated to Fatigue | Findings: F, NF vs. HC | Findings: F vs. NF |
|---|---|---|---|---|---|---|---|---|
| Cross-sectional | ||||||||
| [53] | DTI | F:17 NF:17 | FSS | Disease duration, age, sex, immunomodulatory treatment, DSC score. | EDSS, central motor activation. | DTI FA, DTI ADC, MTR | F = NF | |
| [54] | DTI | F:30 NF:30 | FSS | Age *, sex *, disease duration, education, EDSS, PASAT, T2-LV, NBV, NGMV, pharmacological treatment. | FA, MD, RD, and AD | F = NF | ||
| FA Frontal and occipital U-fibers, R external capsule, L uncinate fasciculus, forceps minor, L superior longitudinal fasciculus, bilateral cingulum, and pons (p ≤ 0.05) | F↓ | |||||||
| MD, RD Frontal and occipital U-fibers, right external capsule, L uncinate fasciculus, forceps minor, L superior longitudinal fasciculus, bilateral cingulum, and pons (p ≤ 0.05) | F↑ | |||||||
| AD L internal capsule, bilateral external capsule, bilateral corona radiata, L superior longitudinal fasciculus, bilateral anterior thalamic radiation, R inferior fronto-occipital fasciculus, and forceps minor (p ≤ 0.05) | NF↑ | |||||||
| [77] | DTI, volume of subcortical nuclei, and brainstem structures. | F:15 Moderately F:14 NF:14 | FSS | Age, disease duration, pharmacological treatment, EDSS, T2 LV | Volume of thalamus (p = 0.001), pallidum (p = 0.013), and superior cerebellar peduncle (p = 0.002). | F↓ | ||
| RD in R temporal cortex (p = 0.016, corrected p = 0.026) | F↑ | |||||||
| FA in R temporal cortex (p = 0.004, corrected p = 0.005) | F↓ | |||||||
| [54] | MT and DT MRI | F:14 NF:14 | FSS | Age, disease duration, EDSS | MTR, FA, and MD | F = NF | ||
| [39] | MRI | F:15 NF:15 | FSS | Age, sex, disease duration, EDSS pyramidal score, MADRS | Median MRI total lesion burden the parietal lobe (p < 0.05), internal capsule (p < 0.05), and periventricular areas (p < 0.05). | F↑ | ||
| [82] | VBM | F:11 NF:6 | EMIF-SEP | Age, sex, EDSS, disease duration, MADRS, Mattis score, lesion volume | LV: juxtacortical and/or overlapping cortico-subcortical lesions located in frontal and temporal areas (p < 0.05). | F↑ | ||
| [55] | DT MRI | F:81 NF:66 | FSS * | Sex, age, disease duration, PASAT, pharmacological treatment, T2 LV, T1 LV, NBV, NGWV, NWMV | EDSS, MADRS * | MD | F = NF | |
| FA of the Fm (p = 0.02), R ATR (p = 0.03) | F↓ | |||||||
| [56] | VBM | F:64 NF:59 | FSS * | Sex, age, disease duration, pharmacological treatment, PASAT, T2 LV, T1 LV, NBV | EDSS, MADRS * | WM atrophy: Ant Thal Rad, Post Thal Rad, Sup Cor Rad, Post Cor Rad, cingulum, corpus callosum, SLF, ILF, IFOF, fornix, Fm, CST, cerebral peduncle, medial lemniscus, SCP, MCP, ICP regional | F = NF | |
| [61] | VBM | F:32 NF:28 | FSS * | Sex, age, disease duration, T1 LV, ICV | EDSS, CDMI | WM atrophy: L frontal areas that included the L medial frontal gyrus of the SMA, L superior frontal gyrus; L precuneus, bilateral brainstem; L and WM of the L cerebellum (p < 0.001) | F↑ | |
| WM atrophy: bilateral frontal lobe, R middle cingulate gyrus, bilateral posterior cingulate gyrus, bilateral temporal and occipital lobes, around L thalamus and bilateral corpus callosum (p < 0.001) | NF↑ | |||||||
| WM atrophy: frontal region (motor areas and insula), temporal, occipital, and parietal lobes. Bilateral thalamus, bilateral corpus callosum, cingulate gyrus (anterior, middle and posterior parts), bilateral brainstem and cerebellum (p < 0.001). | F↑ | |||||||
| [89] | MRI | F: 174 NF: 192 | MFIS | Sex, education, PASAT, disease duration, | Age, MADRS, EDSS | T2 LV, T1 LV, NWMV | F = NF | |
| [52] | MRI | F:16 NF:17 | FSS | Age, disease duration, EDSS, 17-HDRS | Frontal lobe T2-LL (p = 0.017) | F↑ | ||
| [57] | MRI | F:27 NF:21 | MFIS | Age *, sex, disease duration, EDSS | Cognitive fatigue, physical fatigue, psychosocial fatigue, tSTAI, BDI * | T2LL corpus callosum, fornix internal capsule, corona radiata, posterior thalamic radiation, sagittal stratum, external capsule, cingulum, fasciculus | F = NF | |
| WMLL tracts: posterior limb of the internal capsule, retrolenticular part of the internal capsule, sagittal stratum, superior longitudinal fasciculus, and uncinate fasciculus | F = NF | |||||||
| [96] | DT MRI | F:26 Reversible F:25 NF:42 | MFIS | Age, sex, disease duration, disease category, EDSS | CES-D, T2LV* | FA bilateral fronto-orbital and subgenual regions, R superior temporal and temporal polar regions and R temporal WM, R insular and periinsular area (including the external and extreme capsules and claustrum), bilateral anterior limb of internal capsule, bilateral precommisural striatum, R amygdala and hippocampal/parahippocampal region, and R crus cerebri (F vs. NF: p < 0.001; F vs. reversible: p < 0.001. Corrected p with: age + sex + DD + EDSS + LL p = 0.954; corrected p with age + sex + DD + EDSS + LL + CES-D p = 0.290) | F ↓ Reversible F = NF | |
| [58] | DWIs | F:26 Reversible F:25 NF:42 | MFIS | Age, sex, disease duration, disease phenotype, EDSS, CES-D | NR | FA, AD, MD, RD of superolateral medial forebrain bundle. | F = NF | |
| [91] | DT MR | F:20 NF:15 | FSS | Sex, age, EDSS, disease duration | NR | Cord average FA (p < 0.0001), | F↓ | |
| Cord average MD (p = 0.001), brain NAWM average FA (p = 0.03), brain NAWM average MD (p = 0.001), brain GM average MD (p = 0.01) | F↑ | |||||||
| Cord average FA (p < 0.0001) | NF↓ | |||||||
| Cord average MD (p = 0.0009), brain NAWM average FA (p < 0.0001), brain NAWM average MD (p = 0.004), and brain GM average MD (p = 0.0001). | NF↑ | |||||||
| Brain NAWM average FA (p = 0.001) | NF↓ | |||||||
| [76] | DT MR | F:31 NF:32 | FSS | Sex, age, disease duration, EDSS, disease clinical phenotype, pharmacological treatment, MADRS, T2 LV, T1 LV. | NR | FA Fm, L inferior fronto-occipital fasciculus, R anterior thalamic radiation (p < 0.001, uncorrected) | F↓ | |
| Occurrence of lesion in the R ATR (p < 0.001, uncorrected). | F↑ | |||||||
| [86] | MRI, VBM | F:43 NF:17 | MFIS | NR | T2 LL, T1 LL. | T2 LL volume (p < 0.001), T1 LV (p < 0.001) | F↑ | |
| [87] | MRI | F:197 NF:25 | FSS | Age at onset, number of relapses, WM-f. | Age, disease duration, education, AWM-f, GM-f, T2 lesion, T1 lesion. | AWM-f (p = 0.001), T1-LL (p = 0.002), T2-LL (p < 0.001). | F↑ | |
| [75] | DTI | F:38 NF:41 | FSMC | Age, disease duration, EDSS, education, pharmacological treatment | NR | FA for the thalamus and basal ganglia including the caudate nucleus, globus pallidus, and putamen (p = 0.017) | F↓ | |
| MD for the thalamus (p = 0.010) and basal ganglia including the caudate nucleus, globus pallidus, and putamen (p = 0.030) | F↑ | |||||||
| FA thalamus (p < 0.001) | F↓ | |||||||
| MD thalamus (p < 0.001) | F↑ | |||||||
| FA basal ganglia | F (p = 0.005) and NF (p = 0.035) ↓ | |||||||
| FA frontal cortex | F (p < 0.001) and NF (p = 0.007) | |||||||
| MD basal ganglia and frontal cortex (p < 0.001) | F↑ | |||||||
| Reference | Imaging Technique | Subjects | Fatigue Scale | Matched Variables | Unmatched Variables | Neuroimaging Findings Correlated to Fatigue | Findings: F, NF vs. HC | Findings: F vs. NF |
|---|---|---|---|---|---|---|---|---|
| Cross-sectional | ||||||||
| [70] | DTI | CF:37 CNF:12 | FSS | Age, education, disease duration, EDSS, TWT, 9-HP, PASAT. | NR | AD (p = 0.025) and RD (p = 0.033) between posterior hypothalamus and mesencephalon | CF↓ | |
| AD and RD fibers of the CC (p < 0.001) | CF and CNF↑ | |||||||
| Fibers of the CC | CF = CNF | |||||||
| [72] | DTI | CF:20 CNF:14 | FSMC * | Age, disease duration, MSFC, BDI, LL, BPF | EDSS * (BDI > 13 *) | AD (p = 0.016) and RD (p = 0.042) R posterior hypothalamus and the locus coeruleus. | CNF↑ | |
| AD (p = 0.043) and RD (p = 0.062) fibers between the posterior hypothalamus and the locus coeruleus in the R hemisphere | CNF↑ | |||||||
| AD and RD CC fibers, brainstem | CNF = CF | |||||||
| [71] | DT MRI | CF:67 CNF:28 | FSMC | Sex, disease duration, EDSS, BPF * | Age *, BDI * | FA: L amygdala | CNF↓ | |
| FA posterior CC, anterior CC, L stria terminalis, R stria terminalis | CF↓ | |||||||
| FA posterior CC, anterior CC, L stria terminalis, L amygdala | CNF↓ | |||||||
| FA: R amygdala, R stria terminalis, L stria terminalis, anterior and posterior CC | CF = CNF | |||||||
| FA anterior corpus callosum (p < 0.001), posterior corpus callosum (p < 0.001) | CF and CNF↓ | |||||||
| [89] | MRI | CF:115 CNF:251 | MFIS | PASAT, disease duration, EDSS | Sex, age, education, MADRS | T2 LV, T1 LV, normalized WM volume | CF = CNF | |
| Longitudinal | ||||||||
| [79] | DTI | CF:28 CNF:14 | FSMC | Sex, clinical phenotype, FSMC | Pharmacological treatment, age *, education, relapse during the evaluation period | Total brain volume (GM and WM) after 17 months (p < 0.05) | F↓ | |
| AD and RD in the CC after 17 months (p < 0.05) | F↑ | |||||||
| Lateral ventricle volume after 17 months (p < 0.05) | F↑ | |||||||
| Reference | Imaging Technique | Subjects | Fatigue Scale | Matched Variables | Unmatched Variables | Neuroimaging Findings Correlated to Fatigue | Findings: F, NF vs. HC | Findings: F vs. NF |
|---|---|---|---|---|---|---|---|---|
| Cross-sectional | ||||||||
| [53] | TBM | F:17 NF:17 | FSS | Disease duration, age, sex, immunomodulatory treatment, DSC score. | EDSS, central motor activation. | Atrophy: Mesial aspect of superior frontal gyrus R (p = 0.027), anterior cingulate, genual part R (p = 0.030); anterior insula and inferior frontal gyrus L (p = 0.042), inferior frontal gyrus L (p = 0.004), superior parietal lobule R (p = 0.027), inferior parietal lobule R (p = 0.049); inferior parietal lobule L (p = 0.011), middle temporal gyrus R (p = 0.028), superior temporal gyrus R (p = 0.046), caudate head R (p = 0.039) | F↑ | |
| [50] | MRI | F:71 NF81 | FSS | Sex, age, disease duration, T2 LV | EDSS | Volume of putamen (p = 0.011), caudatum (p = 0.020), and thalamus (p = 0.004). | F↓ | |
| Cth of the superior frontal gyrus (p = 0.003) and inferior parietal gyrus (p = 0.001) | F↓ | |||||||
| Global Cth (p < 0.001), frontal lobe (p < 0.001), temporal lobe (p < 0.001) | F↓ | |||||||
| Volume of putamen (p < 0.001), caudatum (p < 0.001), pallidus (p < 0.001), and thalamus (p < 0.001) | F↓ | |||||||
| [78] | VBM | F:16 NF:13 | MFIS | Age, sex, education, disease duration | IFS, IC-AS | GM atrophy | F = NF | |
| GM volume interoceptive areas (thalamus, hippocampus, caudate R, putamen R, temporal mid R and L, temporal sup R and L, temporal pole sup R, cingulum mid L, cerebellum L and R, cuneus R, frontal sup orb L, frontal mid orb L and R, cingulum ant R, cingulum mid R and L, fusiform L) (p < 0.001) | F↓ | |||||||
| GM volume (thalamus, hippocampus, vermis, cerebellum L, caudate R, putamen, frontal sup R, parahippocampal L, amygdala, precentral R, occipital mid R, putamen L, pallidum L, lingual L, occipital Mid L, postcentral L, cingulum Mmid L) (p < 0.001) | NF↓ | |||||||
| [80] | VBM | F:21 NF:17 | MFIS | Age, sex, education, relationship status, EDSS, disease clinical phenotype, disease duration, pharmacological treatment | HADS, TAS | Volume of caudate nuclei R (p = 0.011), L (p = 0.005) | F↑ | |
| Volume of L parietal cortex (p = 0.011) | F↓ | |||||||
| [99] | MT and DT MRI | F:14 NF:14 | FSS | Age, disease duration, EDSS | Average MTR and MD from cerebral GM. GM of the frontal lobe’s cerebral cortex and basal ganglia. | F = NF F = NF | ||
| [59] | MRI | F:15 NF:12 | MFIS | Age, disease duration, annual relapse rate, EDSS, BDI, lesion relative fraction | Thalamus volumes | F = NF | ||
| Cth of Rolandic regions and the volume of thalami | F = NF | |||||||
| [61] | VBM | F:32 NF:28 | FSS * | Sex, age, disease duration, T1 LV, ICV | EDSS, CDMI | GM volume: left cerebellum (p < 0.001). | F↓ | |
| GM atrophy in R paracentral gyrus (SMA), different areas of the bilateral temporal and occipital lobes, R precuneus, bilateral thalamus (p < 0.001) | NF↑ | |||||||
| GM atrophy in the paracentral gyrus (SMA), bilateral precentral gyrus (PMC), bilateral occipital lobe, precuneus and posterior cingulate gyrus (p < 0.001) | F↑ | |||||||
| [81] | MRI | F:22 NF:27 | FSS | Sex, age *, relapse in previous 24 months, disease duration, pharmacological treatment, PASAT | EQ5D, ZDS *, EDSS *, pyramidal FS score *, 9HPT, T25FW, SDMT Intracranial volume * | Atrophy of caudate (EDSS covariate: p = 0.048; depression covariate: p = 0.046), accumbens volumes (EDSS covariate: p = 0.047, depression covariate: p = 0.042), volume of cerebellar CLs (EDSS covariate: p = 0.0099, or pyramidal score: p = 0.0002) | F↑ | |
| [82] | VBM | F:11 NF:6 | EMIF-SEP | Age, sex, EDSS, disease duration, MADRS, Mattis score, lesion volume | GM density in frontal mid L and frontal sup L (p < 0.001), frontal mid orb R (p = 0.024), frontal sup orb L, frontal med orb L and frontal mid orb L (p = 0.007), frontal inf tri L (p = 0.008), temporal inf L (p < 0.001), precuneus L and parietal sup L (p < 0.001). | F↓ | ||
| [56] | VBM | F:64 NF:59 | FSS * | Sex, age, disease duration, pharmacological treatment, PASAT, T2 LV, T1 LV, NBV | EDSS, MADRS * | GM atrophy: thalamus, caudate nucleus, putamen, insula, amygdala, hippocampus, ACC, MCC, PCC, orbital SFG, orbital MFG, orbital IFG, IFG pars triangularis, IFG pars opercularis, medial SFG, SFG, MFG, SMA, paracentral lobule, precentral gyrus, postcentral gyrus, SPL, IPL, precuneus, cuneus, angular gyrus, Heschl gyrus, STG, ITG, MTG, fusiform gyrus, lingual gyrus, SOG, MOG, calcarine sulcus | F = NF | |
| [98] | MRI | F:18 NF:42 | FSS | Age, education, disease duration, EDSS, BPF, FSS, BDI, alertness without cueing, alertness with cueing, time walk test, 9-HPT, PASAT | BDI cognitive somatic items | Cth: right inferior parietal lobe (p < 0.05). | F↓ | |
| Cth: precuneus R (p < 0.05), middle cingulate R (p < 0.05) | F↓ | |||||||
| [89] | MRI | F:174 NF:192 | MFIS | Sex, education, PASAT, disease duration | Age, EDSS, MADRS | Normalized brain volume, normalized GM volume, normalized thalamic volume | F = NF | |
| [52] | MRI | F:16 NF:17 | FSS | Age, disease duration, EDSS, 17-HDRS | T2 for juxtacortical, periventricular, deep GM, infratentorial, deep WM. GM volume, WM volume, total brain volume | F = NF | ||
| [83] | MRI | F:20 NF:11 | FSS | Age, sex, disease duration, T2 volume. | EDSS | Deep GM T1 in the thalamus (p = 0.018) | F↑ | |
| [84] | VBM | F:30 Reversible F:31 NF:37 | MFIS | Age, sex, disease duration, disease clinical phenotype, EDSS, timebetween MFIS and MRI | CES-D, WM LL | GM volume frontal pole, frontal gyrus, frontal-orbital cortex, frontal-medial cortex, cingulate gyrus, paracingulate gyrus, precentral gyrus, postcentral gyrus, insula, temporal pole, superior temporal gyrus, middle temporal gyrus, transverse temporal gyrus, planum temporale, planum polare, parahippocampal gyrus, precuneus, supramarginal gyrus, angular gyrus, lateral occipital cortex, hippocampus, amygdala, accumbens, caudate, putamen, thalamus, cuneus, occipital pole, periaqueductal GM, cerebellum (age, sex, disease duration, EDSS, CESD, medication family-wise error, Bonferroni corrected p < 0.017) | F↓ | |
| [85] | MRI | F:8 NF:16 | MFIS | NR | EDSS, CES-D *, age | CTh parietal lobe (p = 0.05) Thalamic volume (p = 0.07) | F↓ | |
| [40] | MRI | F:10 NF:14 | FSS | Sex, age, disease duration, EDSS, T2LV, NBV, WMV, GMV. | GM atrophy L central culcus, L middle frontal gyrus, precentral gyrus (p < 0.05, family-wise error corrected) | F↑ | ||
| GM atrophy: L superior frontal sulcus, L precentral gyrus, posterior cingulate cortex, R thalamus, L middle frontal gyrus (p < 0.05; family-wise error corrected) | F and NF↑ | |||||||
| GM atrophy: L central sulcus, L middle frontal gyrus (p < 0.05; family wise error corrected) | F↑ | |||||||
| [76] | DT MR | F: 31 NF:32 | FSS | Sex, age, disease duration, EDSS, disease clinical phenotype, pharmacological treatment, MADRS, T2 LV, T1 LV. | Atrophy of R side of the nucleus accumbens (p = 0.01) GM atrophy R ITG (BA20) (p < 0.001, uncorrected), | F↑ | ||
| GM atrophy in R thalamus, L side of the hippocampus, L side of the caudate nucleus, R inferior frontal gyrus, R middle temporal gyrus, R middle cingulate gyrus, L superior frontal gyrus, R ITG, L middle frontal gyrus, R anterior cingulate gyrus (p < 0.001, uncorrected) | F↑ | |||||||
| R thalamus, L thalamus, R postcentral gyrus, L caudate nucleus (p < 0.001 uncorrected) | NF↑ | |||||||
| [86] | MRI, VBM | F:43 NF:17 | MFIS | T2 LL, T1 LL. | GM atrophy in the left superior frontal gyrus (p = 0.006), R middle frontal gyrus (p = 0.008), and L middle frontal gyrus (p = 0.009) | F↑ | ||
| GM atrophy in the left superior frontal gyrus (p < 0.001), R middle frontal gyrus (p < 0.001), and L middle frontal gyrus (p < 0.001) | F and NF↑ | |||||||
| [87] | MRI | F:197 NF:25 | FSS | Age at onset, number of relapses, WM-f. | Age, disease duration, education, AWM-f, GM-f, T2 lesion, T1 lesion. | GM-f (p < 0.001) | F↓ | |
| [51] | MRI | F:11 NF:9 | MFIS | Age, sex, disease duration, relapse, EDSS, FSS, BDI, 9-HPT | Global Cth | F = NF | ||
| [88] | MRI | F:23 NF:9 | FSS | Sex, age, disease duration, T2 LV | EDSS | Hypothalamic volume | F = NF | |
| Reference | Imaging Technique | Subjects | Fatigue Scale | Matched Variables | Unmatched Variables | Neuroimaging Findings Correlated to Fatigue | Findings: F, NF vs. HC | Findings F vs. NF |
|---|---|---|---|---|---|---|---|---|
| Cross-sectional | ||||||||
| [89] | MRI | CF: 115 CNF: 251 | MFIS | PASAT, disease duration, EDSS | Sex, age, education, MADRS | Normalized brain volume, normalized GM volume, normalized thalamic volume | CF = CNF | |
| Reference | Imaging Technique | Subjects | Fatigue Scale | Matched Variables | Unmatched Variables | Neuroimaging Findings Correlated to Fatigue | Findings: F, NF vs. HC | Findings F vs. NF |
|---|---|---|---|---|---|---|---|---|
| Cross-sectional | ||||||||
| [60] | rs-fMRI | F:28, NF:31 | FSS | Age, sex, disease duration, education, EDSS, PASAT, T2LV, NBV | NR | DMN FC in the PCC (p < 0.05) | F and NF↓ | F↑ |
| DMN FC in ACC (p < 0.05). | F↓ | F↓ | ||||||
| SMN FC activation in the L PMC and SMC | F↑ | |||||||
| SMN FC in R PMC, L PMC (p < 0.05) | NF↑ | |||||||
| [78] | rs-fMRI | F:16 NF:13 | MFIS | Age, sex, education, disease duration | IFS, IC-AS | FC between R ACC and L insula (p = 0.002) | F↑ | |
| [61] | rs-fMRI | F:32 NF:28 | FSS * | Sex, age, disease duration, T1 LV, ICV | EDSS, CDMI | SMN: rs-FC: left precentral gyrus associated with premotor cortex (p < 0.005, family-wise error corrected) | NF↑ | |
| SMN: rs-FC of the R precentral gyrus and PMC (p < 0.005, family-wise error corrected) | NF↑ | |||||||
| [82] | VBM, PET | F:11 NF:6 | EMIF-SEP | Age, sex, EDSS; disease duration, MADRS, Mattis score, lesion volume | NR | rCMRglu | F = NF | |
| [62] | Task-based fMRI (Hand motor task) | F:15 NF:14 | FSS | Age, disease duration, EDSS. | NR | Relative activation of the contralateral CMA (p = 0.001) | F↑ | |
| Activation of ipsilateral cerebellar hemisphere (p = 0.004), the ipsilateral rolandic operculum (p = 0.001), the ipsilateral precuneus (p < 0.001), the contralateral thalamus (p < 0.001), and the contralateral middle frontal gyrus (p = 0.003) | NF↑ | |||||||
| Activation of ipsilateral inferior frontal gyrus (p = 0.01) and contralateral thalamus (p = 0.001) | F↓ | |||||||
| [63] | rs-fMRI | F:36 NF:86 | MFIS | Sex, pharmacological treatment | Age, education, disease clinical phenotype, EDSS, T2 LV, T1 LV, NBV | rs-FC between L temporal SR and cerebellum (p < 0.05, family-wise error corrected) | F↑ | |
| rs-FC between L motor SR and insula (p < 0.05 family-wise error corrected), L temporal SR and cerebellum (p < 0.05 family-wise error corrected) | NF↑ | |||||||
| [64] | Task-based fMRI (repetitive flex-ext of the last four fingers of the right hand moving together) | F:50 NF:29 | MFIS | Sex, age, disease duration, EDSS, T2 LV, T1 LV | NR | Activation of bilateral MTG, left pre-SMA, left SMA, bilateral superior frontal gyrus, left postcentral gyrus, left putamen, and bilateral caudate nucleus (p < 0.05 family-wise error corrected). | F↓ | F↓ |
| Activation in R middle frontal gyrus (p < 0.05 family-wise error corrected), | F↑ | F↑ | ||||||
| Activation of R precentral gyrus, R middle temporal gyrus, and bilateral cerebellum (p < 0.01) | F and NF↑ | |||||||
| [65] | Task-based fMRI (Task1: flex-ext of the last four fingers of the hand. Task2: flex-ext of the hand and foot in phasic) | F:12 NF:10 | FSS | Age, disease duration, EDSS, 9-HPT, finger and foot tapping rate, pharmacological treatment | NR | Task 1: Recruitment of ipsilateral thalamus, contralateral CMA, regions located in the MFG, bilaterally. Primary SMC bilaterally, SMA bilaterally (p < 0.05 corrected for multiple comparison) | F↑ | |
| Task 2: Activation of the thalamus bilaterally, contralateral primary SMC, and contralateral precentral gyrus (p < 0.05 corrected for multiple comparison). | F↑ | |||||||
| Activation of the contralateral SII (p < 0.05 corrected for multiple comparison). | NF↑ | |||||||
| [66] | Task-based fMRI (cycle movement of the hand and foot) | F:11 NF:13 | FSS | Sex, age, disease duration, EDSS | NR | In-phase movement: activation cerebellum bilaterally, R precuneus, R MFG, SMA bilaterally, L hand primary SMC (p < 0.05 corrected at a cluster-level) | NF↑ | |
| In-phase movement: activation cerebellum bilaterally, L SII, R precuneus, L hand primary SMC (p < 0.05 corrected at a cluster-level) | F↑ | |||||||
| In-phase movement: activation L cerebellum, L SII (p < 0.05 corrected at a cluster-level) | F↑ | |||||||
| Anti-phase movement: activation L cerebellum, L SII, R precuneus, L IPL, R MFG, L MFG, L IFG, B CMA, B SMA, L hand primary SMC (p < 0.05 corrected at a cluster-level) | NF↑ | |||||||
| Anti-phase movement: activation cerebellum bilaterally, L SII, R precuneus, L hand primary SMC (p < 0.05 corrected at a cluster-level) | F↑ | |||||||
| Anti-phase movement: activation cerebellum bilaterally, L SII, R precuneus (p < 0.05 corrected at a cluster-level) | F↑ | |||||||
| [91] | Task-based fMRI (tactile stimulation of the palm of the right hand) | F:20 NF:15 | FSS | Sex, age, EDSS, disease duration | NR | Cervical cord mean fMRI intensity (p = 0.04) Cervical cord mean fMRI intensity (p = 0.02) | NF↑ | NF↑ |
| [67] | PET | F:19 NF:16 | FSS | Age at onset of MS symptoms, age at PET investigation, disease duration, EDSS | NR | CMRGlu bilaterally in a prefrontal lobe including the lateral and medial prefrontal cortex and adjacent WM, in the premotor cortex, and in the right SMA area. Capsula interna and extended from the ventral putamen toward the lateral head of the caudate nucleus, particularly at the R brain side. Posterior parietal cortex (p < 0.005) (Brodman area [BA] 39/40, supramarginal and angular gyrus, medial occipital gyrus), which extended into the middle temporal and occipital gyrus (p < 0.005). | F↓ | |
| R cerebellar vermis and to the anterior cingulate gyrus of both brain sides | F↑ | |||||||
| Global CMRGlu (p = 0.0014) | F↓ | |||||||
| Global CMRGlu (p = 0.0008) | NF↓ | |||||||
| [68] | Task-based fMRI (finger tapping) | F:12 NF:12 | FSS | Age, sex, hand dominance, depression, clinical disability, disease duration, motor performance | NR | Activation of the premotor area ipsilateral* at the level of the R putamen (p = 4.26) and of the middle frontal gyrus (p = 3.30) on the R DLPFC (p = 3.12). Bilateral activation of the SMA and ipsilateral activation of the premotor cortex and cerebellum. | F↑ | |
| Activation of primary sensorimotor areas bilaterally (R: p = 3.34), R SMA ipsilateral ** (p = 4.27), L premotor area contralateral ** (p = 3.46), cerebellum contralateral ** (p = 3.56), upper parietal lobe bilaterally (R: p = 3.88; L: p = 3.60) | NF↑ | |||||||
| [69] | rs-fMRI | F:10 NF:12 | FSS | Age, disease duration, LL, LV | MFIS, BDI | Connectivity between the R thalamus and R precentral gyrus (p = 0.015). | F↑ | |
| Connectivity between R thalamus and L parietal operculum (p = 0.0002), L thalamus and R superior frontal gyrus (p = 0.046), and between the L insula and posterior cingulate (p = 0.003). | F↓ | |||||||
| [92] | Task-based fMRI (pincer grip, produced a steady force level: 20% MVC) | F:27 NF:17 | FSMC | Age, gender, disease duration, treatment, PSQI, ESS, PASAT, SDMT, JTHFT, 9-HPT | EDSS, BDI | Task-related activity pattern | F and NF = HC | F = NF |
| [93] | MRSI | F:34 NF:26 | FSS | EDSS, Age, disease duration, T2 LV, FSS | NR | The NAA/Cr ratio (controlling for EDSS and age, p = 0.004) | F↓ | |
| [94] | MRSI | F:17 NF:13 | FSS, MFIS | Age, sex, disease duration, | EDSS *, BDI * lesion volume * | NAA/Cr in the lentiform nucleus region (Controlling for LV, BDI, and EDSS, p = 0.015) | F↓ | |
| [95] | MRSI | F:10 NF:9 | FSS | Age *, EDSS, LL | %GM * | In the pons, NAA/tCr in L4, R5 and R6 | F↓ | |
| In the pons, NAA/tCr in L6 | NF↓ | |||||||
| Reference | Imaging Technique | Subjects | Fatigue Scale | Cognitive Evaluation | Matched Variables | Unmatched Variables | Neuroimaging Findings Correlated to Fatigue | Findings: CF, CNF vs. HC | Findings CF vs. CNF |
|---|---|---|---|---|---|---|---|---|---|
| Cross Sectional | |||||||||
| [97] | Task-based fMRI (paced auditory serial addition test (PASAT)) | CF:11 CNF:11 | FSMC | PASAT: CF:81.2(47–118) CNF:103.6(73–118) | Age, sex, education, disease duration, EDSS, NBV, NGMV, NWMV, T2LV | NR | RS-FC at t2 (30 min after execution of PASAT) between the L superior frontal gyrus and supplementary motor area, bilateral middle temporal gyri and the bilateral middle occipital gyri (p < 0.001, uncorrected), the L-superior frontal gyrus (SFG) hyperconnected at t1(immediately after PASAT) with the left caudate nucleus and hypoconnected at t2 with the left anterior thalamus. | CF↑ | CF↑ |
Publisher’s Note: MDPI stays neutral with regard to jurisdictional claims in published maps and institutional affiliations. |
© 2022 by the authors. Licensee MDPI, Basel, Switzerland. This article is an open access article distributed under the terms and conditions of the Creative Commons Attribution (CC BY) license (https://creativecommons.org/licenses/by/4.0/).
Share and Cite
Barbi, C.; Pizzini, F.B.; Tamburin, S.; Martini, A.; Pedrinolla, A.; Laginestra, F.G.; Giuriato, G.; Martignon, C.; Schena, F.; Venturelli, M. Brain Structural and Functional Alterations in Multiple Sclerosis-Related Fatigue: A Systematic Review. Neurol. Int. 2022, 14, 506-535. https://doi.org/10.3390/neurolint14020042
Barbi C, Pizzini FB, Tamburin S, Martini A, Pedrinolla A, Laginestra FG, Giuriato G, Martignon C, Schena F, Venturelli M. Brain Structural and Functional Alterations in Multiple Sclerosis-Related Fatigue: A Systematic Review. Neurology International. 2022; 14(2):506-535. https://doi.org/10.3390/neurolint14020042
Chicago/Turabian StyleBarbi, Chiara, Francesca Benedetta Pizzini, Stefano Tamburin, Alice Martini, Anna Pedrinolla, Fabio Giuseppe Laginestra, Gaia Giuriato, Camilla Martignon, Federico Schena, and Massimo Venturelli. 2022. "Brain Structural and Functional Alterations in Multiple Sclerosis-Related Fatigue: A Systematic Review" Neurology International 14, no. 2: 506-535. https://doi.org/10.3390/neurolint14020042
APA StyleBarbi, C., Pizzini, F. B., Tamburin, S., Martini, A., Pedrinolla, A., Laginestra, F. G., Giuriato, G., Martignon, C., Schena, F., & Venturelli, M. (2022). Brain Structural and Functional Alterations in Multiple Sclerosis-Related Fatigue: A Systematic Review. Neurology International, 14(2), 506-535. https://doi.org/10.3390/neurolint14020042