Article

Shell Analysis and Optimisation of a Pure Electric Vehicle Power Train Based on Multiple Software

1
Yantai Vocational College, Shandong Yantai, 264005, China
2
School of computer and control engineering, Yantai University, Shandong Yantai 264005, China
3
Department of Computer Science and Technology, Tongji University, Shanghai 201804, China
*
Author to whom correspondence should be addressed.
World Electr. Veh. J. 2018, 9(4), 49; https://doi.org/10.3390/wevj9040049
Submission received: 17 October 2018 / Revised: 14 November 2018 / Accepted: 22 November 2018 / Published: 5 December 2018

Abstract

:
Motor end cover mounting fracture is a problem recently encountered by novel pure electric vehicles. Regarding the study of the traditional vehicle engine mount bracket and on the basis of the methods of design and optimisation available, we have analysed and optimised the pure electric vehicle end cover mount system. Multi-body dynamic software and finite element software have been combined. First, we highlight the motor end cover mount bracket fracture engineering problems, analyse the factors that may produce fracture, and propose solutions. By using CATIA software to establish a 3D model of the power train mount system, we imported it into ADAMS multi-body dynamic software, conducted 26 condition analysis, obtained five ultimate load conditions, and laid the foundations for subsequent analysis. Next, a mount and shell system was established by the ANSYS finite element method, and modal, strength, and fatigue analyses were performed on the end cover mount. We found that the reason for fracture lies in the intensity of the end cover mount joint, which leads to the safety factor too small and the fatigue life not being up to standard. The main goal was to increase the strength of the cover mount junction, stiffness, safety coefficient, and fatigue life. With this aim, a topology optimisation was conducted to improve the motor end cover. A 3D prototype was designed accordingly. Finally, stiffness, strength, modal, and fatigue were simulated. Our simulation results were as follows. The motor end cover suspension stiffness increases by 20%, the modal frequency increases by 2.3%, the quality increases by 3%, the biggest deformation decreases by 52%, the maximum stress decreases by 28%, the minimum safety factor increases by 40%, and life expectancy increases 50-fold. The results from sample and vehicle tests highlight that the component fracture problem has been successfully solved and the fatigue life dramatically improved.

1. Introduction

CAE (Computer-Aided Engineering) technology has become a cornerstone of the development of computers, with several methods of numerical simulation such as FEM (Finite Element Method), MBD (Multi-Body Dynamic method), and topology optimisation used in production. Once original designs are developed, virtual experiments may also be conducted via CAE methods. These present some advantages including high efficiency, an improved product quality, and a reduction in the cost of product development [1]. CAD (Computer-Aided Design) gives people a first impression before production, MBD allows for understanding how things may work before they really can, FEM carries out simulations more precisely, and topological optimisation provides a better solution. Homogenisation and artificial materials are mostly used in topology [2]. Shape optimisation is a method of detailed design focused on modifying boundaries to achieve a solution [3]. Size optimisation requires preliminary stiff and stress analyses and confirms the structure based on safety and lifetime rules [4]. In 2007, Xiao et al. used both topological and shape optimisation methods to optimise the suspension bracket and the original design of the installation of the final design. The quality of the object reduced by 12% [5]. In 2008, Huang et al., based on 28 working conditions from a general company, carried out a stress analysis with regard to the suspension bracket, applied the weighted flexibility as the objective function, took the minimum stress, considered modal frequency and volume ratio as constraints, and conducted a multi-working condition topology optimisation [6]. In 2008, the suspension bracket was designed by the topological optimisation method and the structure topology optimisation was carried out using the smallest target function by Lv et al. After optimisation, the distribution of stress becomes more reasonable and the weight decreases by 9.4% [7,8]. In 2010, after a topological optimisation of the engine mounting bracket, a rationality analysis of material turnovers was carried out, and the test workload was dramatically reduced by the fem simulation of the fatigue test by Sue et al. In 2011, Wu et al., based on linear theory, calculated the ultimate load to withstand the stent by finite element software and confirmed its validity by a test of road durability [9]. With regard to the optimal design of a stent, in 2011 Yang et al. found that the method of topological optimisation reduces the concentration of stress of the stent and improves the fatigue durability of the bracket [10]. In 2012, the method of size optimisation was used by Liao et al. to optimise the bracket under such a working condition. As a result, the quality of the optimised stent increased by 37% [11,12,13,14,15,16,17,18].
In this paper, we explore the power train of a pure electric vehicle by suspension bearings and provide a multi-body dynamic model by electric driving force assembly. To develop the condition of the electric vehicle characteristic, we calculate the situation of limit load. Thus, finite element modelling analysis and topology optimisation of the power train shell are conducted. The original fracture problem of the shell is solved by applying the optimised support. Some computer applications are used in the study, including ADAMS, ANSYS, and PRO/E, and the simulation results were found to be valid by a real vehicle experiment. The paper made a great contribution to solving the motor end cover mount bracket fracture engineering problems that have dogged this industry for a long time. In addition, the motor end cover was also improved via a topology optimisation, and its efficiency and performance have significantly improved since the optimisation.

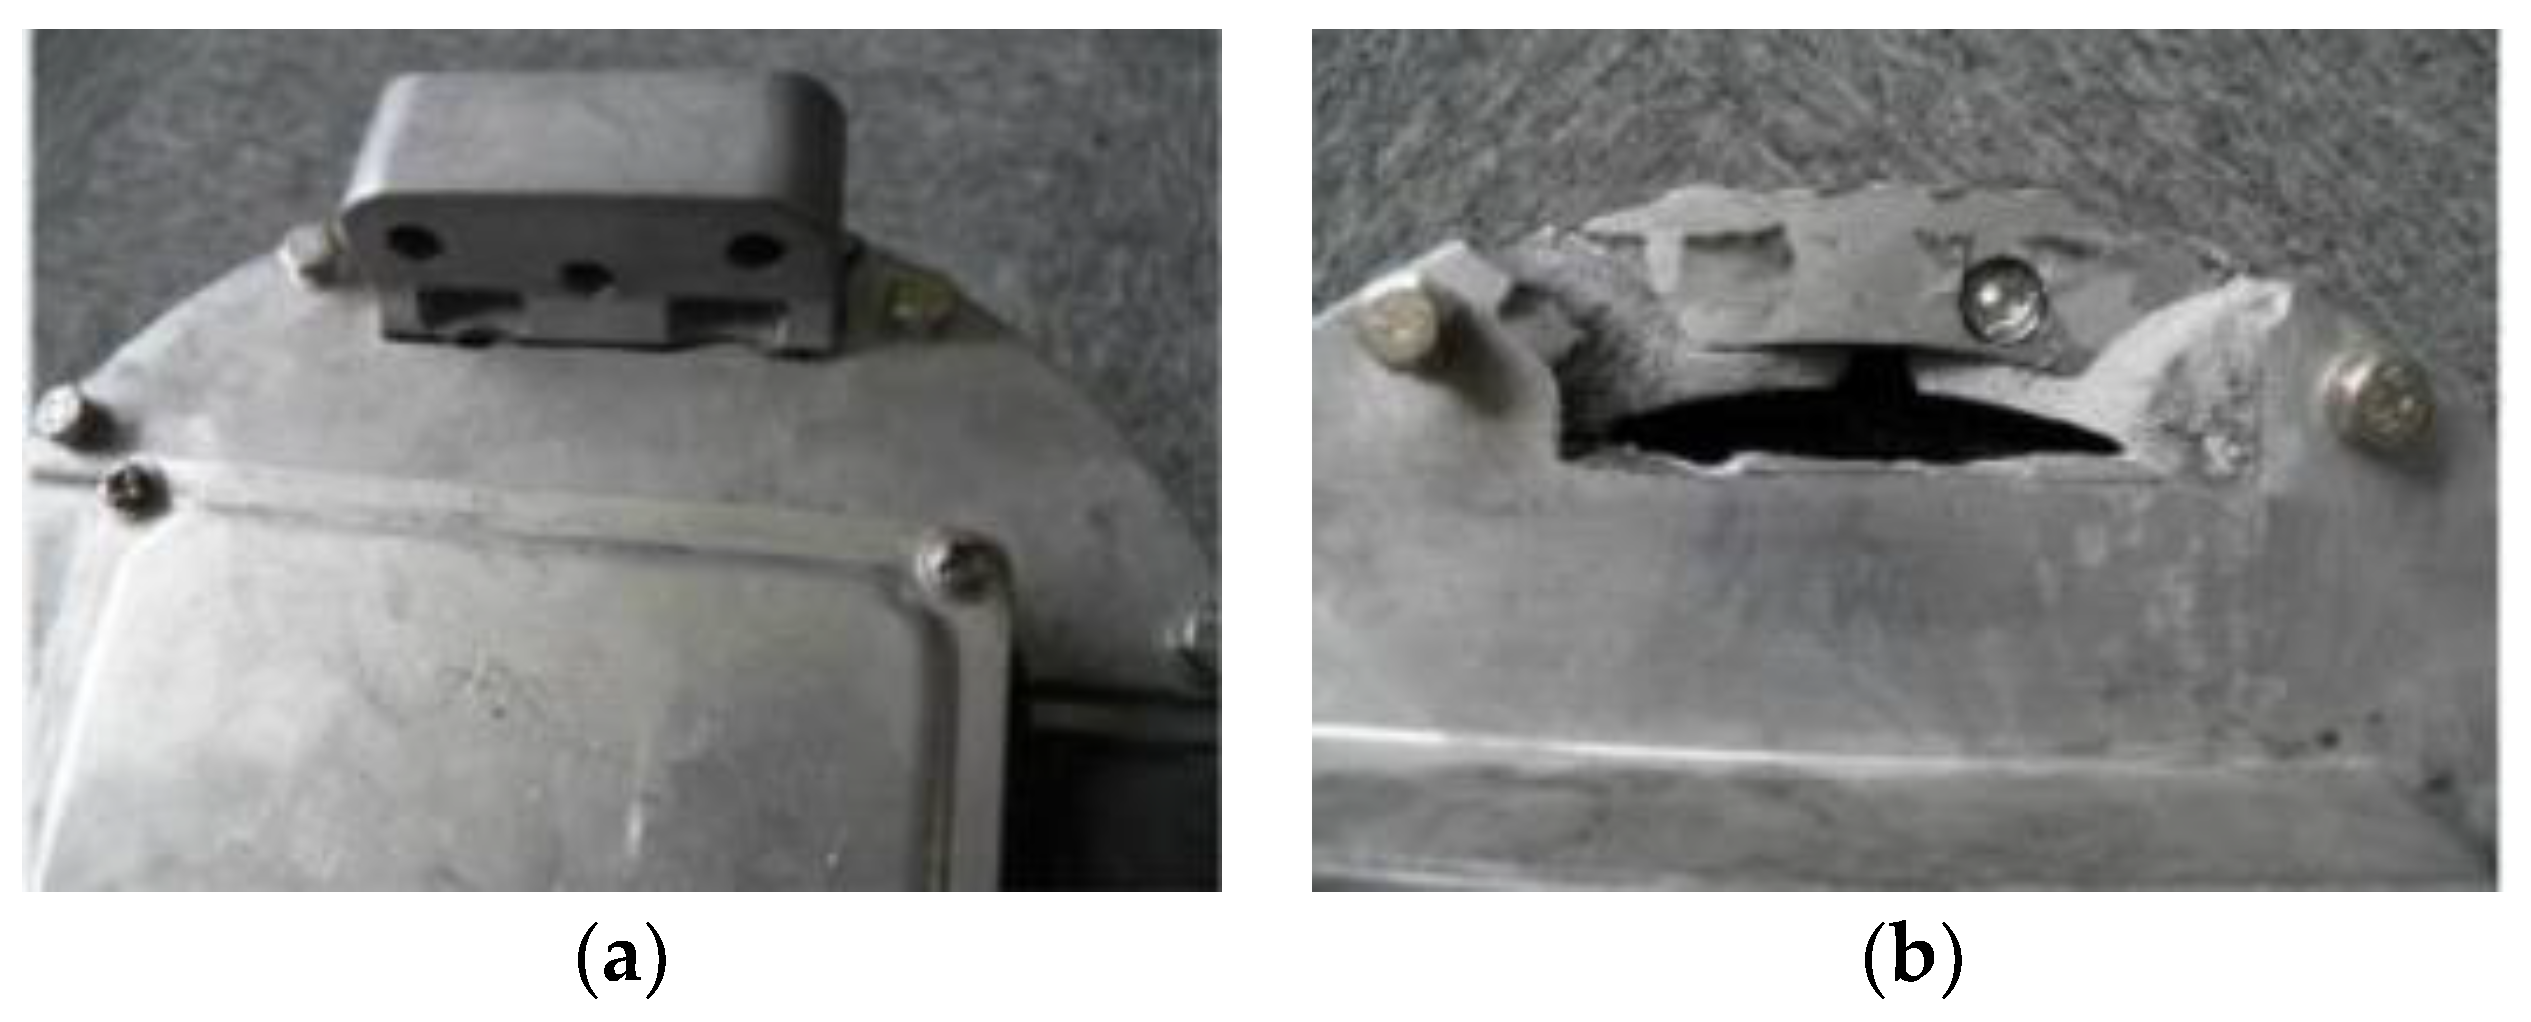
2. The Shell Crack Problem

A pure electric vehicle road test experiment was carried out. In the course of that test, hearing a sound indicated the ball dust cover on the right side of the shaft cage was torn. After lifting the vehicle and checking it, it was found that the motor end cover and the chassis mount bracket had been broken, resulting in motor tilt and a ball cage teared on the right side of the shaft. The result is that the right side of the shaft is detached from the transmission and damage, and the transmission oil was leaking, leaving the test car at great risk. Figure 1 illustrates the motor end cover mount (or shell, for short) fracture.
In view of the above problems arising from the road test, a shell dynamic simulation was decided on using a variety of software with the aim of calculating the stress distribution of the suspension, finding the defective parts, and analysing the fatigue and harshness. Through various analysis, optimisation, and redesign, a newly designed shell can be simulated and validated by tests to verify the conditions required.

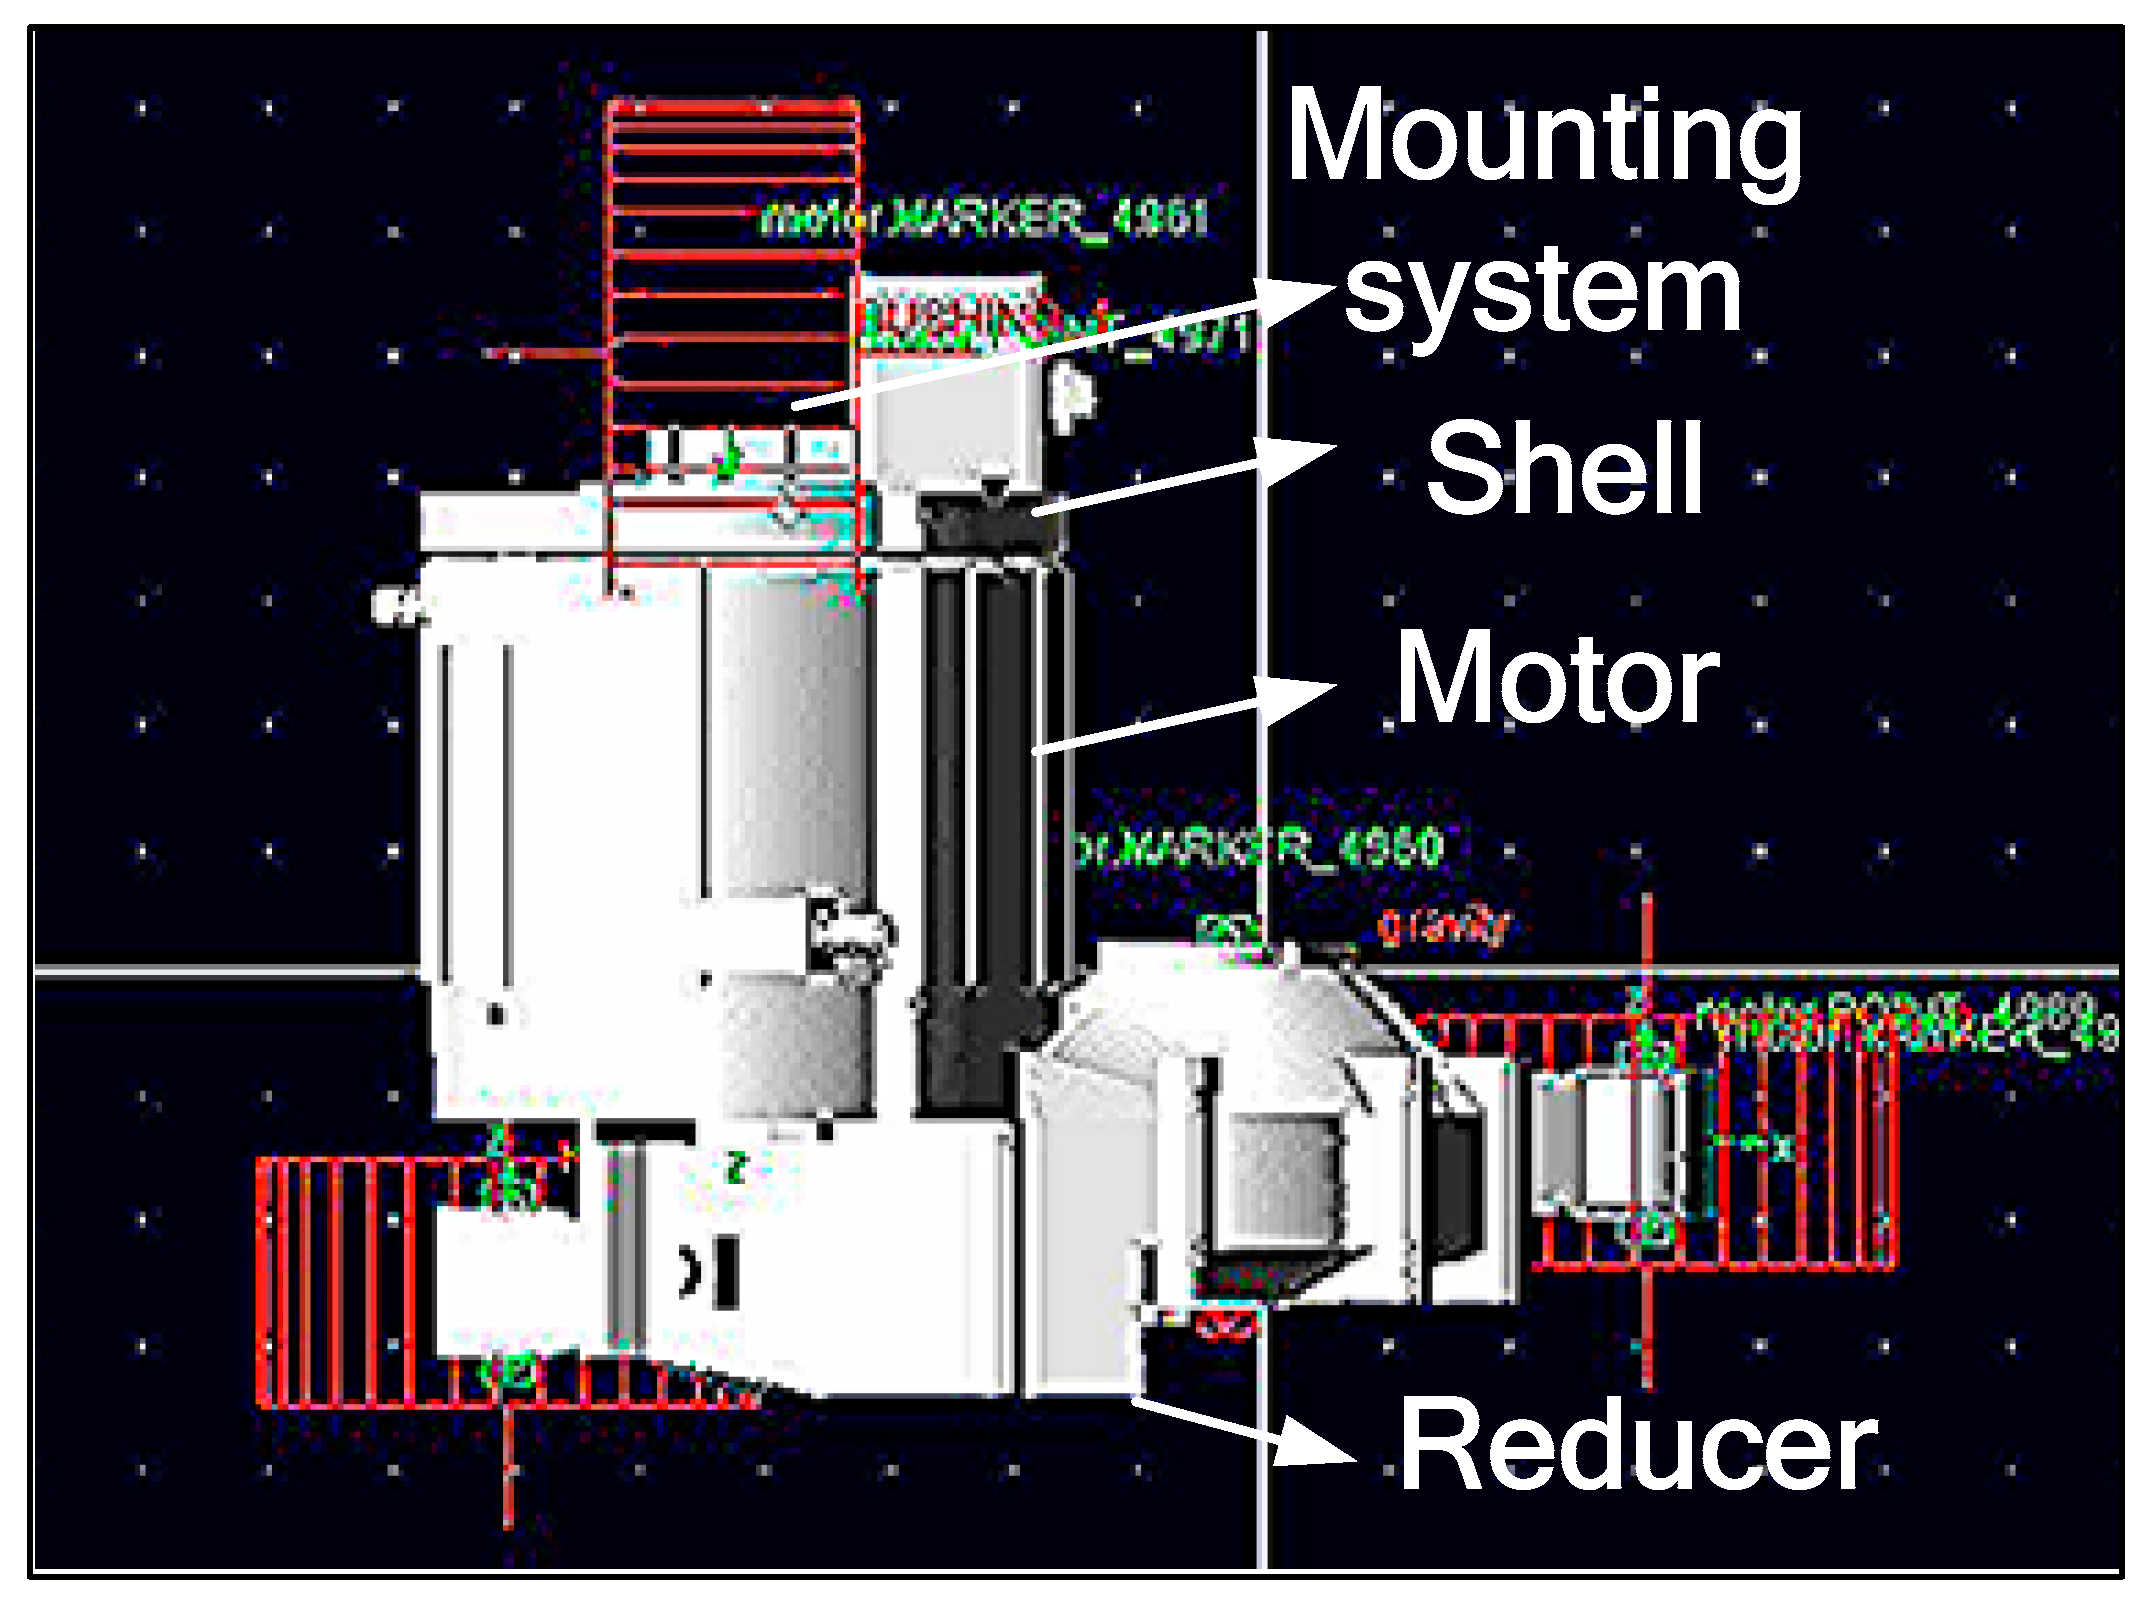
3. Typical Working Conditions Solved by ADAMS Software

We used Automatic Dynamic Analysis of Mechanical Systems (ADAMS) to establish a power train mounting system model, developed some dynamic simulations under different working conditions, derived working loads, and found the basis for stationary stress and dynamic fatigue computation. The Lagrange method is most often used to solve multi-body dynamic problems. The Lagrange function is given by the following expression:
d d t ( y q ˙ j ) T q j + V q j + D q ˙ j = Q j * ,
where T, V, D mean kinetic energy, potential energy, and dissipate energy, resp., Q j * denotes the generalized forces matrix, q j and q ˙ j represent power train mass centre generalized force and generalized velocity of 6 freedoms. The dynamic function of power train mounting system is given by
[ M ] { q ¨ } + [ C ] { q ˙ } + [ K ] { q } = { F ( t ) } ,
where [M] represents the mass matrix, [C] is the damping matrix, [K] means the stiffness matrix, and [F] is the matrix of forces.
ADAMS (a software developed by Mechanical Dynamics Inc) is used worldwide by domain OEMs and research institutions. The power train mounting system provided by ADAMs/View and Vibration Module is depicted in Figure 2.
Using ADAMS to conduct dynamic simulations, 26 typical working conditions were derived from 28 general typical working conditions by the build force module to apply loads, set necessary parameters, and obtain the final results, which can be checked through the ADAMS/Post Processor Module. Typical loading results appear in Table 1.

4. Stress Computation and Fatigue Analysis

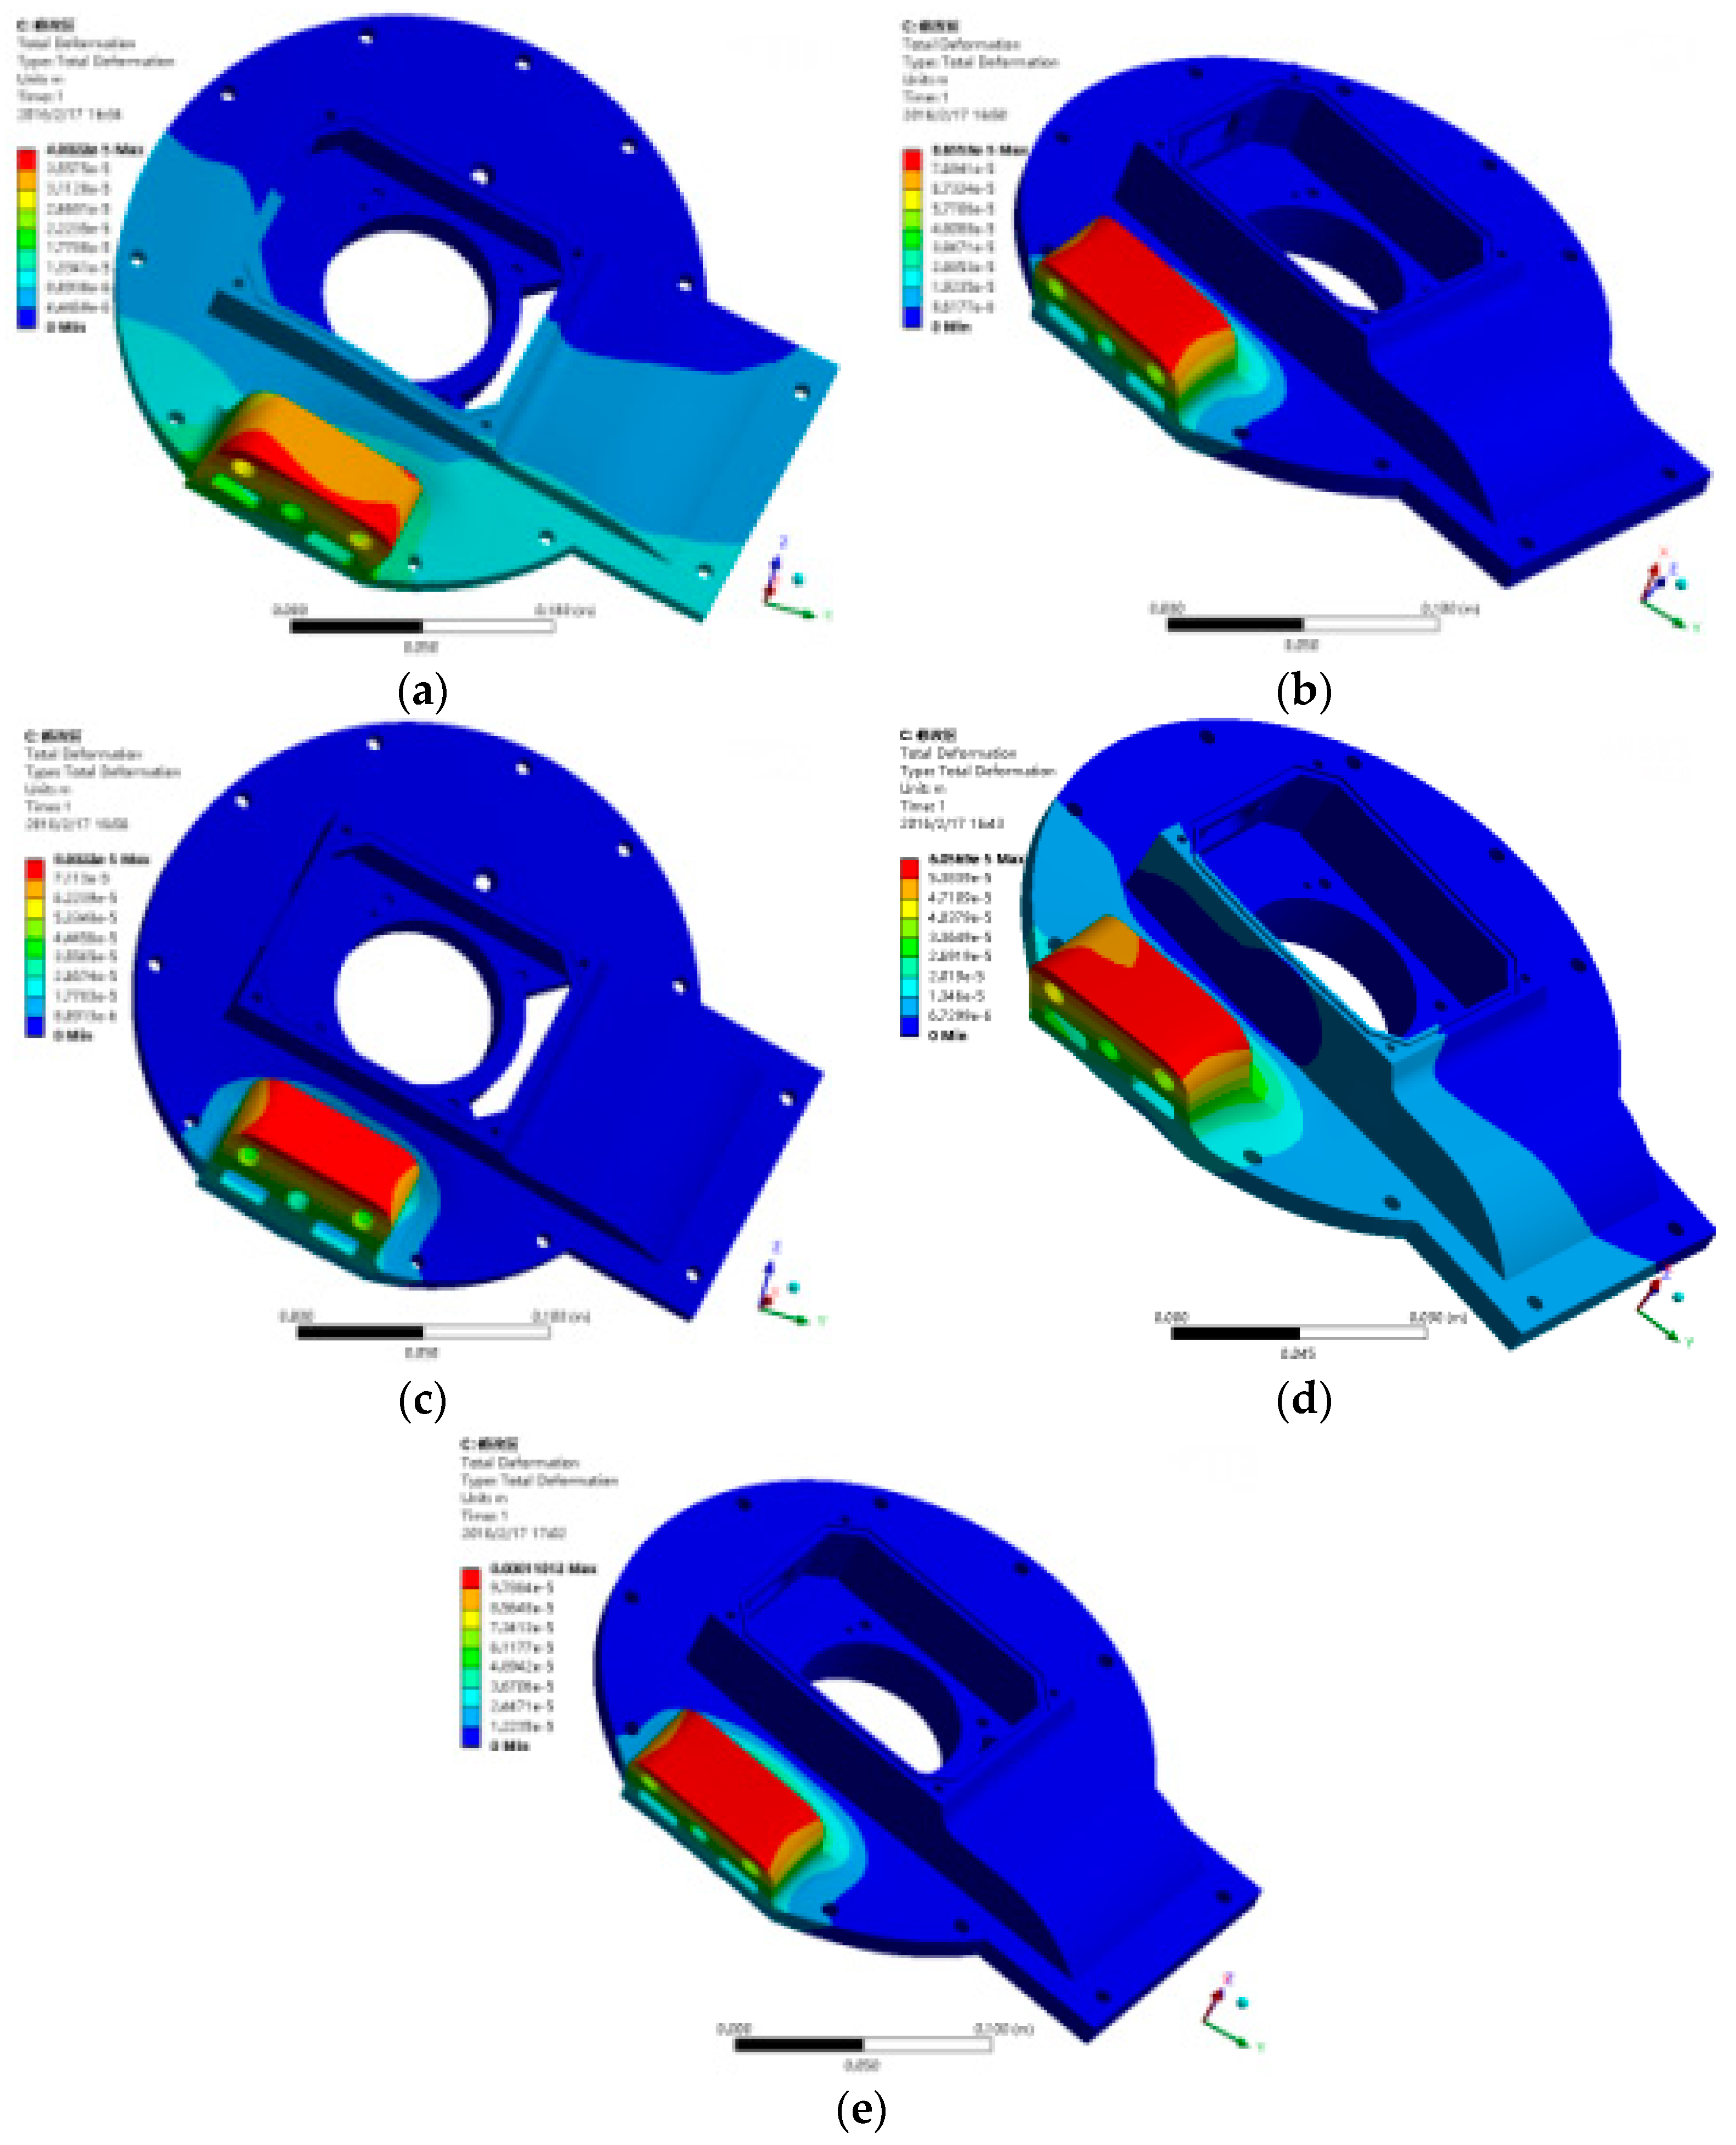
4.1. Stress Computation

ANSYS is a world-leading CAE application that integrates several tools required for design and analysis, with a high degree of openness and flexibility and a user-friendly interface. ANSYS allows an outstanding finite element analysis before and after processing the platform and provides a highly interactive visual environment to establish a finite element model of product. Its open architecture provides the broadest range of CAD, CAE, and CFD interfaces, and supports user customization as a seamless integration in any simulation environment. Its powerful geometric clean-up function can be used to amend errors in the geometric model, modify it, and improve its efficiency and quality. Through efficient mesh partitioning technology, a full beam is completed and the plate shell is divided either automatically or semi-automatically. Also, tetrahedron and hexahedron type meshes greatly simplify the simulation of complex geometric models. Advanced mesh deformation technology allows users to directly change existing grids and implement new designs without rebuilding a geometric model. In this way the design is improved as well as the efficiency of development. A powerful model tree view can easily cope with the display and hierarchical management needs of various major models, especially for the integrated refinement modelling of complex mechanical equipment. During the modelling process, four components are defined for each suspension bracket, namely, lvl10000, 2D, 3D, and mass. From these, 2D and 3D represent the surface mesh and body grids, resp., and mass is represented by a concentration point, i.e., the force or constraint that the point is subjected to is on the defined grid. The material for the suspension bracket is aluminium. The performance indexes of the material appear in Table 2.
The ultimate load of the mounting point obtained by the upper section was applied to the corresponding point of the motor end cover suspension, and the stress‒strain situation of the end cover suspension under the limiting loads was analysed (cf., Figure 3). From the strain results, it follows that the largest deformation occurs in the place where the suspension bearings are, and the maximum stress occurs where the suspension bearings are combined with the motor end cap, which corresponds to the part with the engineering fault. The maximum strain image is shown in Figure 3.

4.2. Fatigue Analysis

The last stage carries out a static strength analysis in the mechanical part design. In fact, merely computing the static strength design is not enough, so the fatigue life situation has to be further discussed. Often the usage lifetime for the rated load is found on the basis of calculations. The fatigue calculation of that section adopts a constant amplitude load and is proportional to it. The proportion of the main stress is constant, and its cuts do not change over time. The relationship between load and fatigue aging is the stress‒life curve. The results of calculating the static strength and fatigue life of such a section are summarized in Table 3. It can be seen that the stress value of the combination of mounting and end cap is greater. The fatigue limit of the aluminium material used in the structure is 138 MPa, standing in the limit load working condition. There is an approaching fatigue limit working condition and two working conditions exceed that fatigue limit, so additional optimisation is required to reduce the maximum stress and improve both the minimum safety factor and the fatigue number.

5. Topology Design

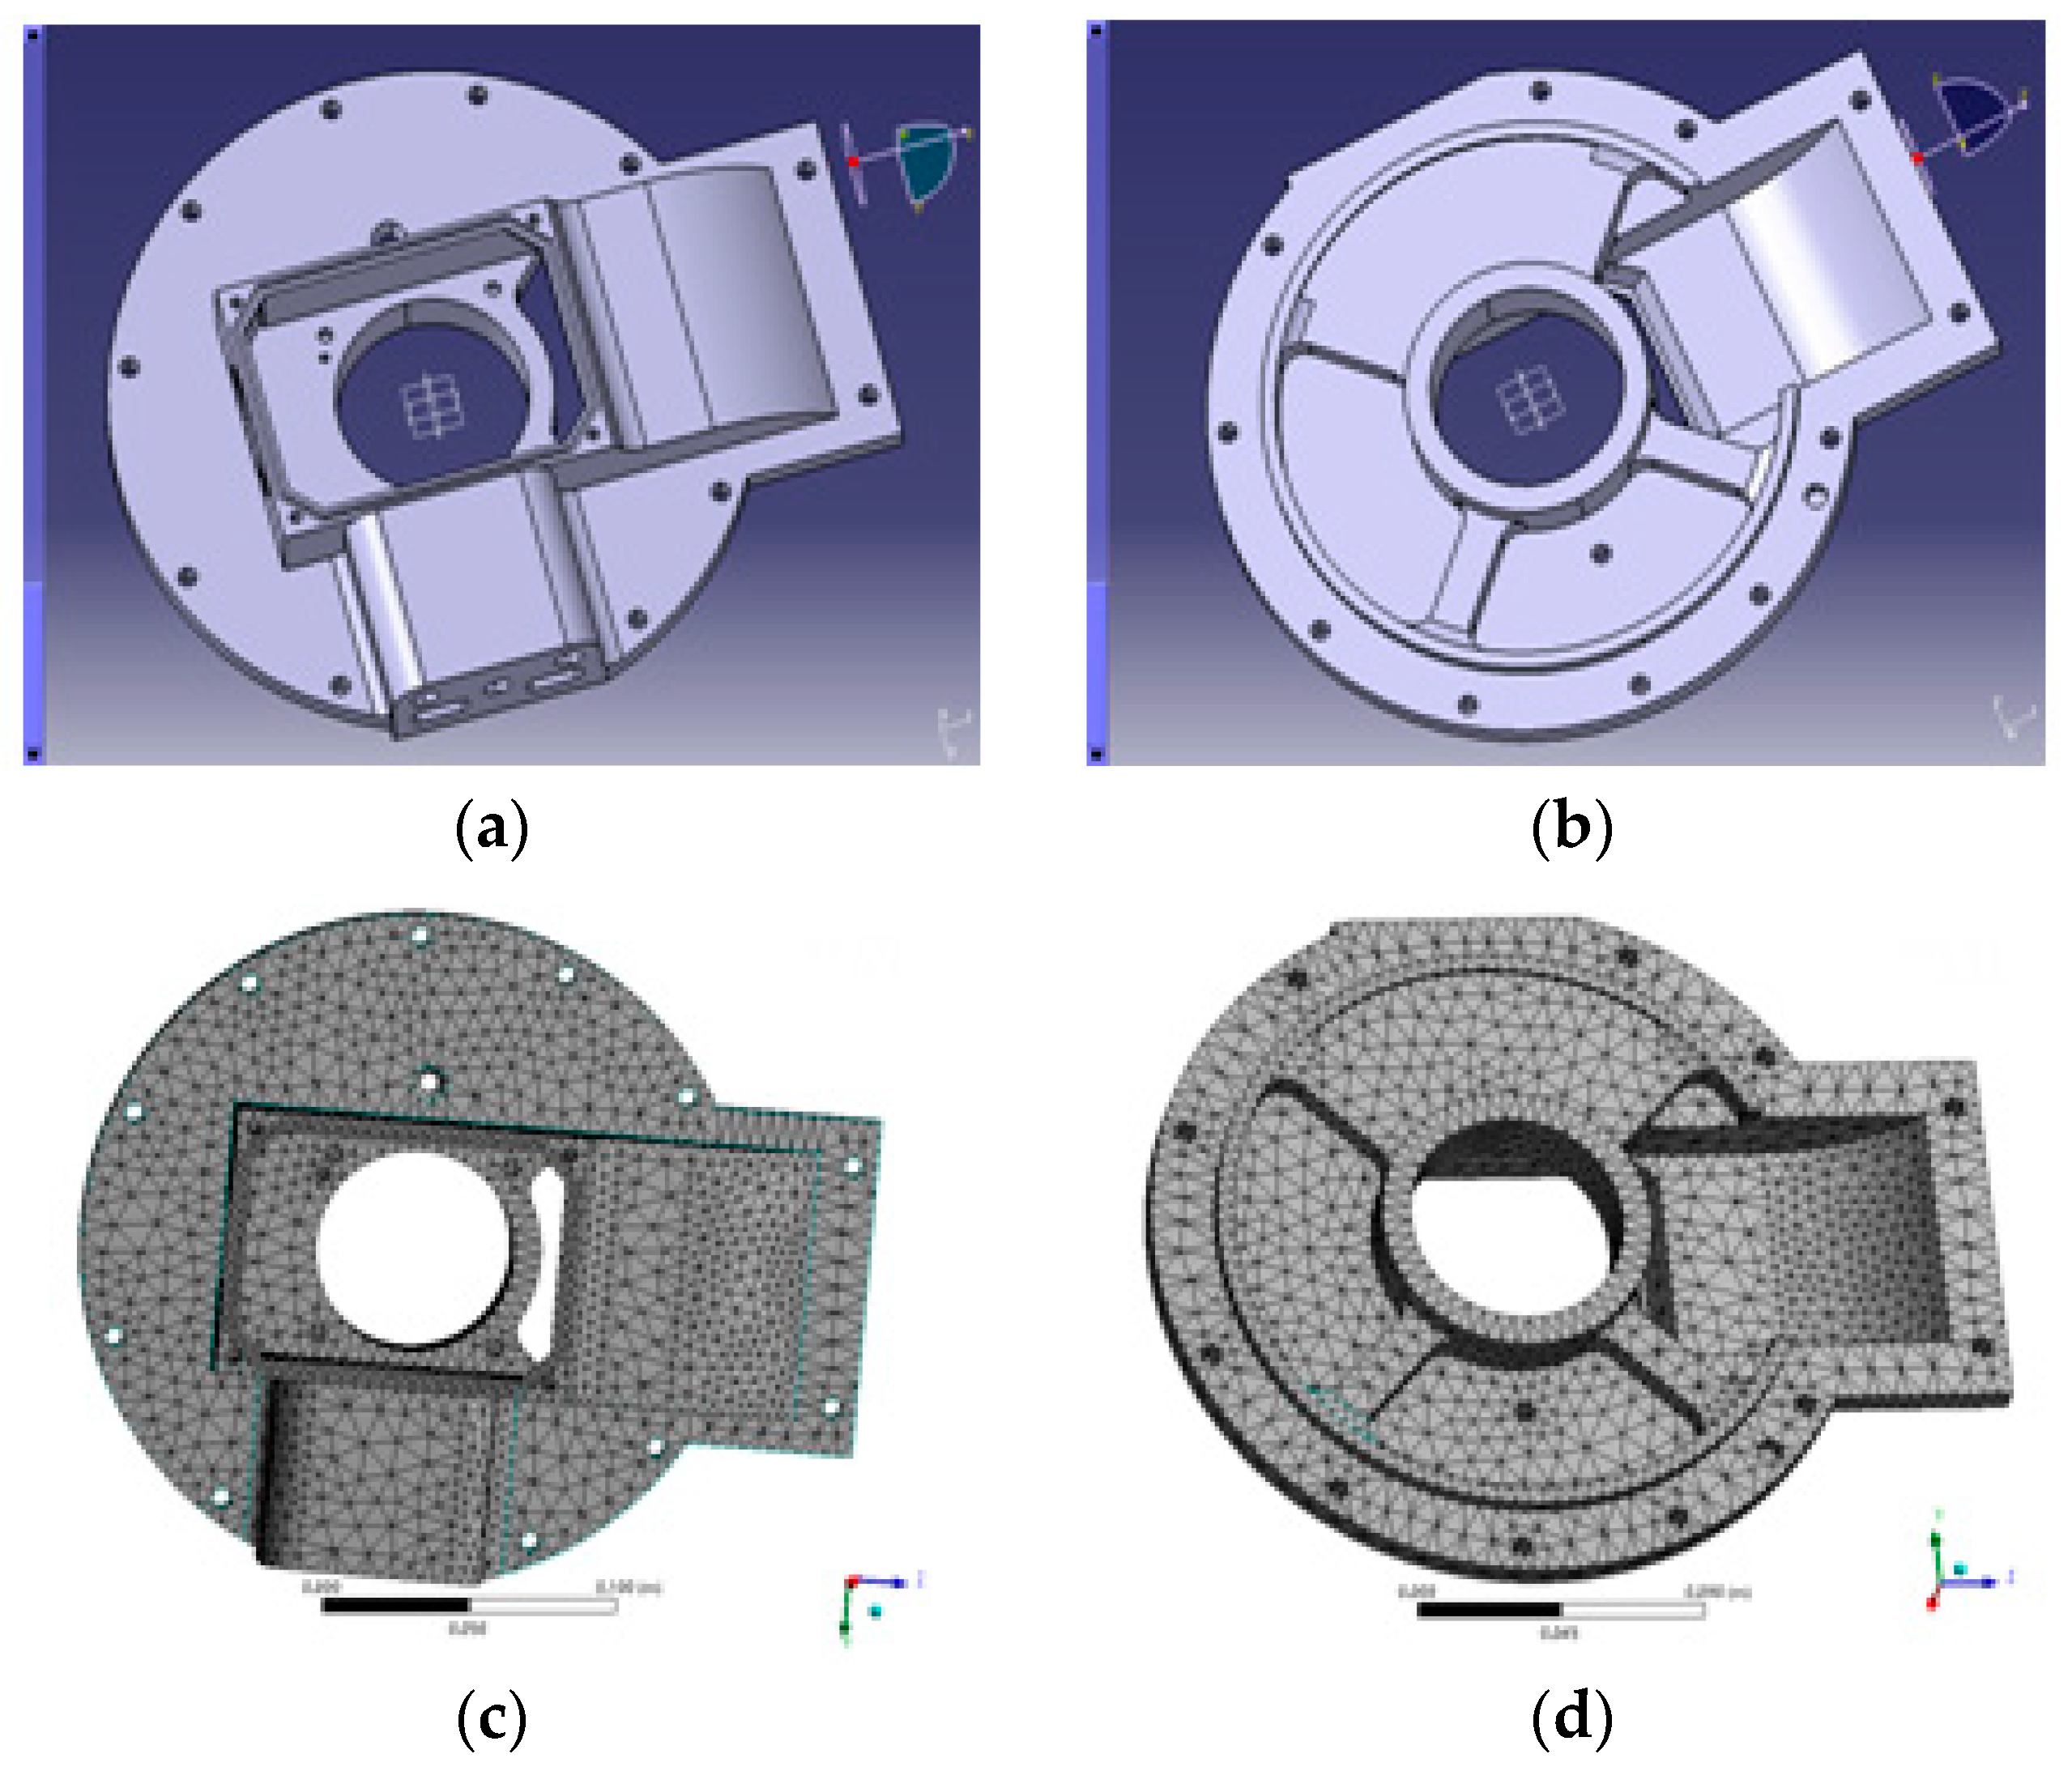
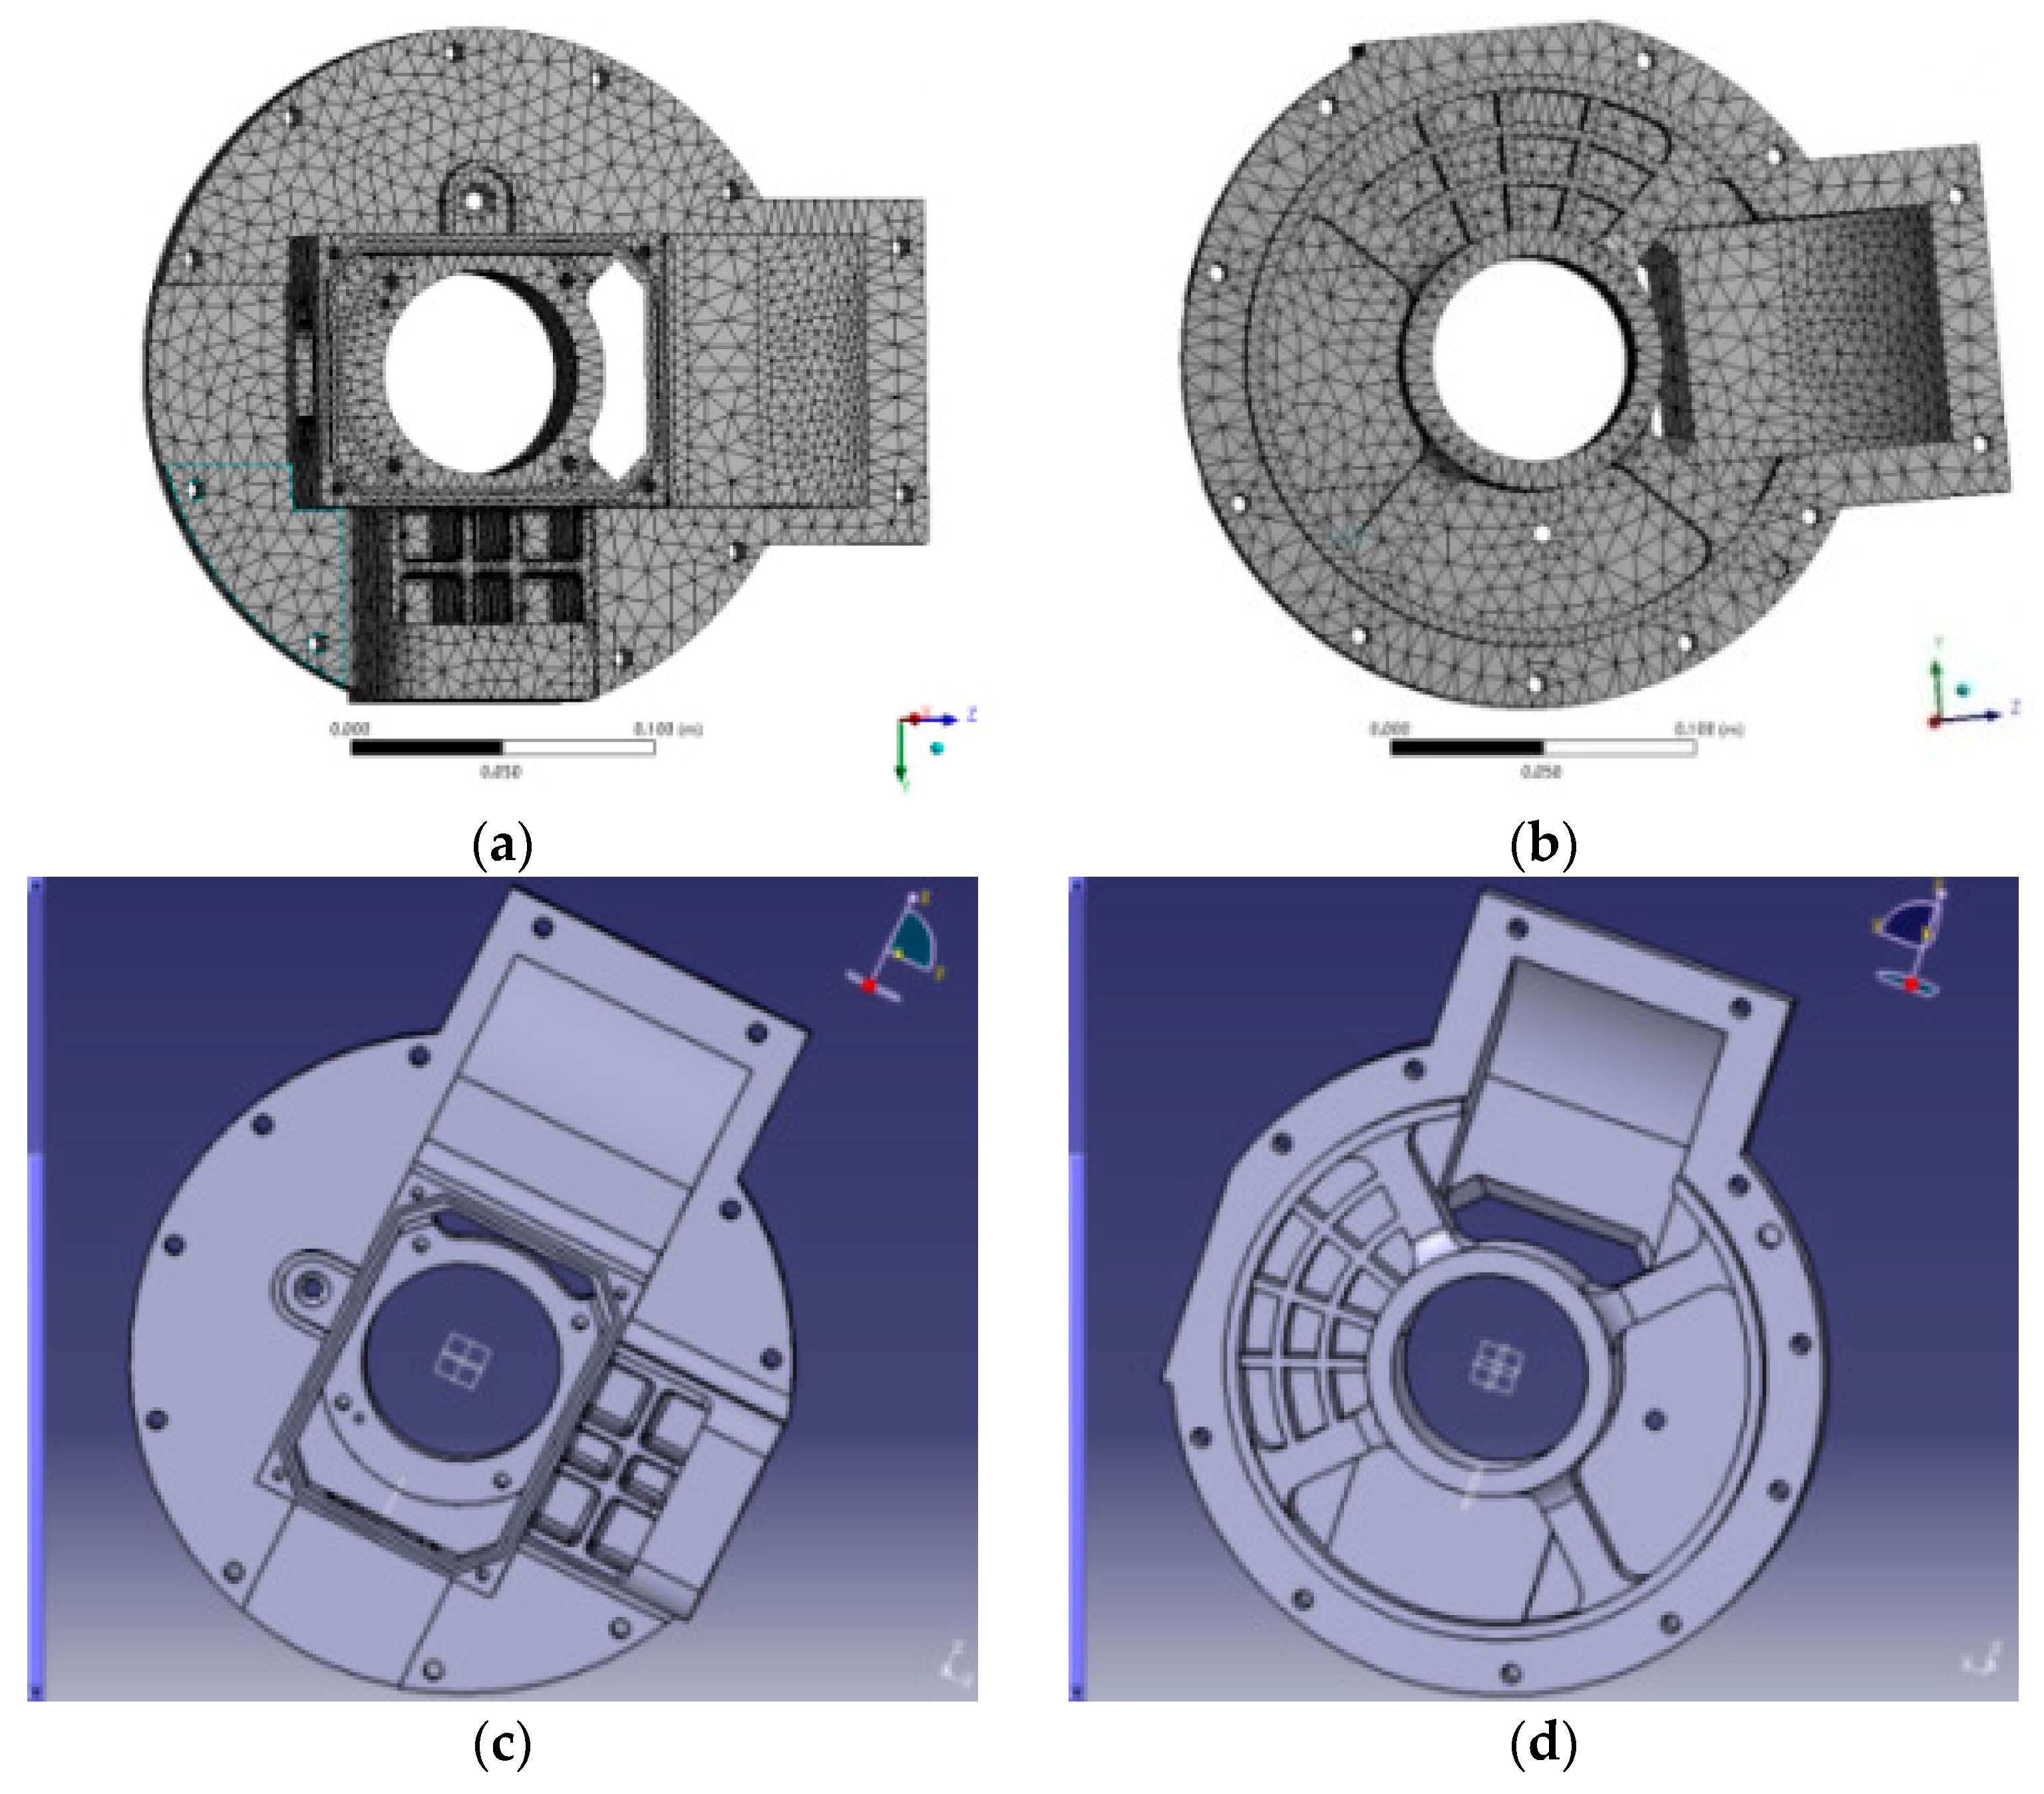
5.1. A Middle Model Design by PRO/E Software

The reason for the rupture of the end-cap parts is a shortage of strength. Appropriate design should be carried out to meet the basic strength requirements. According to the strain results, the maximum deformation occurred in the mounting bearings and the maximum stress occurred in the mounting bearing and the motor end cap bonding site. The maximum stress value is close to or exceeds the fatigue limit of the material under the limiting condition, so it becomes necessary to optimise the maximum stress and further improve the minimum safety factor and fatigue number. Considering that the first-order modal frequencies of the suspension bracket are at least 1000 Hz, the strength is improved by increasing the material, and the basic size and frequency of each order remain unchanged. The initial design entity model is shown in Figure 4. To validate the usability of the model, a strength check of the model is established, its finite element model loaded, the load of the limiting working condition compared, and the stress‒strain results under the limit load shown in Table 4. Notice that the maximum stress value of several major limiting conditions decreases with varying degrees. Reducing the amount is also relatively considerable, especially both the third and the fifth working conditions. The rate of reduction of maximum stress was found to be greater than 70%. Thus, the initial design of the model can satisfy the requirements of strength design as well as the conditions of usage of electric vehicles. The corresponding maximum stress and strain maps appear in Figure 3.

5.2. Topology Optimisation by ANSYS Software

To make the initial design of the middle model satisfy the strength requirements, a further optimisation was carried out. Considering the variation of stiffness and strength of optimum allowance in different working conditions, the method of topological optimisation was chosen. By calculating the operating conditions of the mounting system, the optimum working condition of the stress was selected. Then we defined the commit task (to optimise after the end) and selected the OptiStruct panel in the analysis page to make the optimised finite element graph (see Figure 5a,b). The output file is automatically generated after tuning. After calculations, the quality of the end-cover suspension bracket increased from the original 3.665 to 3.555 kg (3%). Based on the finite element optimisation results, the motor power train shell is established using PRO/E software as shown in Figure 5c,d.

6. Stress Computation and Fatigue Analysis after Optimisation

The ultimate load of the mounting point was applied to the motor end cover, and the stress‒strain situation of the end cover under the limiting loads was analysed (cf., Figure 3). From the strain results, it holds that the largest deformation occurs in the place of the mounting base, and the maximum stress occurs in the mounting bearings and the motor end cap bonding sites. The optimised maximum strain and stress values appear in Table 5. Observe that the maximum deformation amount of five limit loads decreases by 52%, and the average of maximum stress decreases by 28.5%. The optimised safety coefficient and fatigue number of values are shown in Table 6. Thus, the minimum safety factor of 5 limit loads increases, there is an average increasing of 40%, and the minimum fatigue number exceeds an average of 50 times.

7. Experiment after Optimisation

7.1. Metal Fatigue Test

Metal fatigue testing is a method to experimentally determine the material of σ-1. First, the s‒n curve of the material is drawn. Then the fatigue damage phenomena and fracture characteristics are analysed to determine the metal materials under a symmetrical cyclic fatigue limit. Statistics show that about 70% of the mechanical part failure is caused by fatigue, with most of the accidents being catastrophic. Therefore, through experimental studies, the anti-fatigue performance of metal materials is shown to be of practical significance. Fatigue and rupture test inputs were as follows: X direction of the shell arms: loading force was +1850 N, the frequency was 15 Hz, and the cycle times were 500,000; Z direction of the shell arms: loading force was [−1562N,1048 N], the frequency was also 15 Hz, and the cycle times were 500,000. The obtained results can be stated in the following terms:
(1) Original shell: for 500,000 times cycles in both the X and Z directions of the arms, the fatigue test result was “crack.”
(2) Optimised shell: for 500,000 times cycles in both the X and Z directions of the arms, the fatigue test result was “no crack.”

7.2. Road Test

A PAVE experiment of a pure electric vehicle was carried out on the rock field, with the aim of checking the fatigue durability of the body structure. The test mileage was fixed to 2000 km, the aggrandizement coefficient was set to 1:100, and the test cycle lasted 14 days. Similar to the results of the metal test, at the end of the test, when the original shell cracked, the optimised prototype did not appear to be cracked.
The results from both a metal fatigue test and a real vehicle road test show that the durability of the samples is greatly improved, which solved the original fracture problem of the power train shell.

8. Conclusions

In this paper, we focus on the shell of a pure electric vehicle power train. Specifically, we address the problem of its fracture and solve it computationally. Several analyses involving dynamic simulation, static strength, fatigue, and topology optimisation of the components were conducted. Moreover, an assessment regarding the optimised performance and prototype test was carried out. The main stages of our research are stated next. (1) We introduce the component fracture problems, analyse the failure reasons of motor end cover, follow the overall situation, and lay the foundations for both strength and fatigue analyses. (2) A model for an electric power train mounting system is developed by ADAMS, based on 28 general working conditions. In addition, the operational conditions of the electric vehicle were proposed and the typical load work of the component was computed. (3) Both static and fatigue analyses were conducted via ANSYS, so a basis for optimisation was defined. (4) A maximum stress condition was provided to conduct structural topology optimisation. Thereafter, the weight increased slightly though the maximum deformation decreased by 52%, the maximum stress by 28%, the minimum safety factor increased by 40%, and the life expectancy increased 50-fold. (5) The results obtained by the metal fatigue test and real vehicle road test show that the fracture problem was solved with the fatigue lifetime of the power train shell being significantly improved. Despite this solution to the fracture problems and optimisation, there are still many aspects of this field worth exploring. In future research, the battery for electric vehicles could be studied in detail.

Author Contributions

Conceptualization, S.G.; methodology, S.G. and X.Y.; software, X.T.; validation, S.G., X.T. and X.Y.; formal analysis, S.G.; investigation, X.T.; resources, X.Y.; writing—original draft preparation, S.G.; writing—review and editing, X.Y.; project administration, X.T.; funding acquisition, S.G.

Funding

This project was supported by National Natural Science Foundation of China (61572418) research on the formation of trust network and its application in intelligent recommendation.

Conflicts of Interest

The authors declare no conflict of interest.

References

  1. Lin, T.; Yan, J.; Lv, Z. Transmission mount bracket optimisation design based on the CAE analysis. J. Equip. Manuf. Technol. 2010, 10, 53–55. [Google Scholar]
  2. Zhou, K.; Li, J.; Li, X. Methods of structural topology optimisation. J. Mech. 2005, 35, 69–76. [Google Scholar]
  3. Deng, X.; Fang, Z.; Liu, G. Power train mount bracket topology optimisation study. J. Three Gorges Univ. 2006, 28, 230–232. [Google Scholar]
  4. Zhang, S.; Zheng, D.; Hao, Q. The Structure Optimisation Design Technology Based on Hyper Works; Mechanical Industry Publishing House: Beijing, China, 2007. [Google Scholar]
  5. Xiao, Y. Structural Optimisation of Engine Mount Bracket; SAE noise and vibration conference and exhibition; SAE: Warrendale, PA, ISA, 2007. [Google Scholar]
  6. Huang, Q.; Du, D.; Huang, X. Power train mount bracket multi-load topology optimisation. J. Automot. Technol. 2008, 10, 27–30. [Google Scholar]
  7. Lv, Z. A Big Minivan Power Train Mount System Optimisation Design Research; Hunan University: Changsha, China, 2010. [Google Scholar]
  8. Sue, X.; Chen, Z. Engine mounting back bracket design optimisation and fatigue analysis. Comput. Aided Eng. 2011, 20, 49–52. [Google Scholar]
  9. Wu, L.; Cui, X. Engine mount front bracket strength analysis and improving design. J. Automot. Eng. 2011, 6, 42–44. [Google Scholar]
  10. Yang, Z. Finite element analysis and improvement of engine support. J. Motor Pract. Technol. 2011, 2, 47–50. [Google Scholar]
  11. Liao, S.; Cheng, C. Car mount bracket simulation analysis and size optimisation. J. Coal Mine Mach. 2012, 33, 23–25. [Google Scholar]
  12. Lokesha, V.; Deepika, T.; Ranjini, P.S.; Cangul, I.N. Operations of Nanostructures via Sdd, Abc4 and Ga5 Indices. Appl. Math. Nonlinear Sci. 2017, 2, 173–180. [Google Scholar] [CrossRef]
  13. Korpinar, T.; Turhan, E. Inextensible Flows of Biharmonic S-Curves according to Sabban Frame in Heisenberg Group Heis3. J. Interdiscip. Math. 2018, 21, 17–27. [Google Scholar] [CrossRef]
  14. Chande, M.K.; Lee, C.; Li, C. Cryptanalysis and Improvement of a ECDLP based proxy blind signature scheme. J. Discrete Math. Sci. Cryptogr. 2018, 21, 23–34. [Google Scholar] [CrossRef]
  15. Hillman, D. Looking Back to 2015 while Looking Ahead (Using a Freshly Polished Crystal Ball) to 2016: We’ll Begin First by Looking Back at Our “Hits” and “Misses”. Paper Asia 2016, 32, 22–25. [Google Scholar]
  16. Lv, C.; Xing, Y.; Zhang, J.; Na, X.; Li, Y.; Liu, T.; Cao, D.; Wang, F.-Y. Levenberg–Marquardt Backpropagation Training of Multilayer Neural Networks for State Estimation of a Safety-Critical Cyber-Physical System. IEEE Trans. Ind. Inform. 2018, 14, 3436–3446. [Google Scholar] [CrossRef]
  17. Lv, C.; Hu, X.; Vincentelli, A.; Marina, C.; Li, Y.; Cao, D. Driving-Style-Based Co-Design Optimization of an Automated Electric Vehicle: A Cyber-Physical System Approach. IEEE Trans. Ind. Electron. 2018. [Google Scholar] [CrossRef]
  18. Lv, C.; Xing, Y.; Lu, C.; Liu, Y.; Guo, H.; Gao, H.; Cao, D. Hybrid-Learning-Based Classification and Quantitative Inference of Driver Braking Intensity of an Electrified Vehicle. IEEE Trans. Veh. Technol. 2018. [Google Scholar] [CrossRef]
Figure 1. Power train shell crack. (a) Before cracking; (b) after cracking.
Wevj 09 00049 g001
Figure 2. Power train mounting system by ADAMS.
Wevj 09 00049 g002
Figure 3. Stress and strain under extreme conditions. (a) Working Condition 1 strain; (b) Working condition 2 strain; (c) Working Condition 3 strain; (d) Working condition 4 strain; (e) Working condition 5 strain.
Wevj 09 00049 g003
Figure 4. CAD and FEM model of middle product: (a) CAD model of side A (b) CAD model of side B (c) FEM model of side A (d) FEM model of side B.
Wevj 09 00049 g004
Figure 5. CAD and FEM model of the optimised product. (a) FEM model of side A (b) FEM model of side B (c) CAD model of side A (d) CAD model of side B.
Wevj 09 00049 g005
Table 1. Typical working load.
ConditionX Direction (N)Y Direction (N)Z Direction (N)Maximum Stress (MPa)
11690189798.5
2363−1−197597.8
315701−96133.2
4−1478−10568123.9
52011105−147169.2
Table 2. Material attributes.
Material GradesElastic ModulusPoisson RatioYield StrengthTensile StrengthFatigue LimitDensity
ADC12 Aluminium7.1 × 1010 Pa0.33310 MPa450 MPa138 MPa2.7 g/cm3
Table 3. Shell strength and fatigue analysis results.
Max Distortion (m)Maximum Stress (MPa)Minimum Safety FactorFatigue Number
4 × 10−598.50.671.76 × 106
6 × 10−597.80.671.82 × 106
8.7 × 10−5133.20.51.89 × 106
8 × 10−5123.90.533.4 × 106
11 × 10−5169.20.42.61 × 106
Table 4. Results of strength analysis after initial design of end cap.
Original Maximum Stress (MPa)Maximum Stress After Initial Design (MPa)Improved Quantity (%)
98.590.38.3
97.888.79.3
133.235.473.4
123.931.774.4
169.245.773
Table 5. Analysis results of optimised rear end cover suspension strength.
Max Distortion After Optimisation (m)Maximum Deformation Reduction (%)Maximum Stress After Optimisation (MPa)Maximum Stress Reduction (%)
3.36 × 10⁻⁵−1683.5−15.2
3.77 × 10⁻⁵−37.290.7−7.3
3.09 × 10⁻⁵−64.580.1−39.86
2.84 × 10⁻⁵−64.574.4−39.95
3.9 × 10⁻⁵−78.1101.6−40
Table 6. Fatigue analysis of end cover suspension.
Minimum Safety FactorFatigue NumberIncrease of Safety Coefficient (%)Increased Number of Fatigue (times)
0.7941.03 × 107+18.5+4.85
0.733.7 × 106+9+1.03
0.831.67 × 107+66+87.36
0.93.77 × 107+70+109.88
0.551.43 × 106+37.5+53.79

