Article

Combination of LiCs and EDLCs with Batteries: A New Paradigm of Hybrid Energy Storage for Application in EVs

1
School of Electrical, Electronic and Computer Engineering, North-West University, Potchefstroom 2520, South Africa
2
Faculty of Engineering and Physical Sciences, Queen’s University Belfast, Belfast BT7 1NN, Northern Ireland, UK
*
Author to whom correspondence should be addressed.
World Electr. Veh. J. 2018, 9(4), 47; https://doi.org/10.3390/wevj9040047
Submission received: 9 October 2018 / Revised: 13 November 2018 / Accepted: 16 November 2018 / Published: 19 November 2018

Abstract

:
The research presented in this paper proposes a hybrid energy storage system that combines both electrolytic double-layer capacitors (EDLCs) also known as supercapacitors (SCs) and lithium-ion capacitors (LiCs) also known as hybrid capacitors (HCs) with a battery through a multiple input converter. The proposal was verified in simulation and validated by implementing a laboratory prototype. A new hybridisation topology, which reduces the amount of resource requirement when compared to the conventional hybridisation topology, is introduced. An electric vehicle (EV) current profile from previous research was used to test the performance of the proposed topology. From the results obtained, the hybridisation topology proposed in this research had the lowest cost per unit power at 14.81 $/kW, the lowest cost per unit power to energy, and available power to energy ratio, both at 1:1.3, thus making it a more attractive hybridisation topology than the two conventional alternatives. The multiple input converter built had efficiency values in excess of 80%. The key take away from this paper is that using the proposed hybridisation topology, the battery is less often required to supply energy to the electric vehicle, and so, its cycle life is preserved. Furthermore, since the battery is not used for the repeated acceleration and deceleration in the entire driving cycle, the battery’s cycle life is further preserved. Furthermore, since the battery is not the only storage device in the energy storage system, it can be further downsized to best fit the required base load; therefore, leading to a more optimized energy storage system by reducing the weight and volume of space occupied by the energy storage system, while also achieving better efficiencies.

1. Introduction

One of the biggest challenges towards achieving efficient and effective energy use in electric vehicles (EVs) and other renewable energy technologies is the energy storage system [1,2]. Batteries, though being improved with newer technologies, are still not capable of meeting the load requirement while retaining their lifespan. Hybrid energy storage systems have been proposed in the literature to solve this problem [3,4,5]. It has been proposed previously to combine high power dense energy storage alternatives with batteries that are high energy dense. Supercapacitors (SCs) and hybrid capacitors (HCs) are quite similar energy storage devices, as they are both double-layer capacitors [6,7]. However, SCs have a higher power density and a lower energy density than HCs [8]. In battery and SC hybrid systems, there has been a reported downside due to the poor energy density of SCs, while in battery and HC systems, the low power density of HCs has been reported to pose a challenge [9,10].
Generally, when energy storage hybridisation is considered, the more conventional approach is to combine two energy storages, one high energy dense and one high power dense storage; this has been the trend of most of the research in the area of energy storage hybridisation [11]. More often than not, the hybrid energy storage would either be a combination of battery and SC or battery and HC [12,13,14].
Starting with the battery and SC hybridisation, much work has been done in this aspect for different applications, amounting to a rather rapid adoption of the topology, although it possesses certain limitations. In reference [15], a Pb-acid battery of 12 V was hybridised with an SC bank of 12 cells in series, with each cell having a capacitance of 310 F through a multiple input non-isolated bidirectional half-bridge DC–DC converter. The target application was for use in an EV; however, the test was carried out using an electronic load. The authors were able to achieve up to 75% discharge of the SC bank through the DC–DC converter and consequently achieved an efficient use of the battery. The authors proposed that future work will focus on the analysis of their system’s efficiency at high voltage condition; also, the DC–DC converter they used needed more work to improve its efficiency and cost-benefit ratio.
A similar application was considered by [16]; the authors also proposed the hybridisation of the battery and SC, but their approach involved using only one DC–DC converter. The battery was connected at the input of the DC–DC converter, and SC was placed parallel to the output of the DC–DC converter, which was then placed parallel to the load such that SC was always performing peak power shaving for the battery. The downside of this topology is that the battery will always be in use, and so, there will be constant energy flowing from the battery towards SC and the load, which will amount to an inefficient use of energy because of the losses in charging SC from the battery.
In reference [17], a Li-ion battery and SCs were used in a hybrid energy storage system with the application of a fuzzy logic controller (FLC). The authors used an isolated dual active bridge converter for each of the energy storages. They reported to have achieved fast charging; however, the research trend is moving away from the use of transformer isolation in the hybridisation of energy storages because the weight of the transformer further adds to the weight of the entire system, especially in high voltage applications. This consequently increases the energy and power requirements of the system, especially for systems involving mobility such as electric wheelchairs and electric vehicles. Several other combinations of battery and SCs for locomotive and stationary applications were presented in [18,19,20,21,22,23,24,25].
Although LiCs have proven to present significant advantages over SCs [26], their adoption has been quite slow [27]; this is very likely due to the very huge cost of HCs as compared to SCs [28]. Although it is expected that with increased adoption, demand and volume of production, the cost of production will also reduce, because of the lithium doping of LiC cells, the price will always be higher than SC cells. In reference [29], the authors combined a bank of 108 Li-ion capacitor series cells obtained from JM Energy with a lithium (NMC) battery for applications in EVs using the same topology proposed by [16]. In this proposal, the authors have sacrificed the high power density that could have been obtained if an SC were used. It is important to note that the limitations of the topology proposed by [16] as discussed above still apply here as well. The authors in [29] claimed to have developed a bench mark for evaluating control algorithms for EVs in their research; however, this claim needs to be verified.
There are some interesting research works that have been carried out with the combination of the battery and SCs or the battery and HC with renewable energy sources such as photovoltaic (PV) systems, fuel cells, and wind turbines. Some of these studies can be found in [30,31,32,33,34,35,36]. The dearth of research involving the use of LiCs cannot be overemphasized, particularly in energy storage hybridisation. There is a need to look into cost-effective inclusion or adoption topologies, which would give room to fully exploit the advantages presented by LiCs. The research presented in this paper seeks to address these shortcomings of both battery-SC and battery-HC energy storage systems by proposing a new hybrid energy storage system that combines both SCs and HCs with a battery through a multiple input DC-DC converter. A descriptive block diagram of the proposed hybrid energy storage system through a multiple input converter is presented in Figure 1.

2. Proposed Hybrid Energy Storage System

The descriptive block diagram presented in Figure 1 highlights the focus of this research, which is the combination of the battery, SC, and HC for use by an EV. From this figure, it can be seen that the main components of this research include; the energy storages, the multiple input converter, the control system, the electronic load, and the various sensors (voltage and current sensors) that enable the controller to make intelligent decisions about the utilization of energy.
The system controller is the brain box of the entire system; it is responsible for processing measurements and calculating the duty ratios required by the switches in the multiple input DC-DC converter. The system controller measures the state of charge of the energy storages, measures the current consumption of the motor drive train, and the voltage at the DC bus, which is also the output of the DC-DC converter and controls the DC–DC converter output to attain the required voltage level through the duty PWM signals. The system controller also decides which of the energy storages should get charged when there is energy available for storage through regenerative braking; it does this using a set of predetermined rules.

2.1. Energy Storage Implementation

Energy storages are at the core of this research; in particular, the focus is on hybridising battery, SCs and HCs. The scale of implementation of the energy storages was small to facilitate their use in the laboratory; previous experiments have been carried out in the literature [33,37] at a similar scale in which the load was an electronic load, as was done in this research, instead of using a physical electric vehicle. The choice of SCs and HCs was made such that they had similar capacitance such that there was room for a one-to-one comparison of both energy storages.
For the experimental implementation, the SC cells used were the BCAP 3000 cells from Maxwell technologies. Each cell has a maximum voltage of 2.7 V, respectively. Six of these cells were connected in series, giving a total maximum voltage of 16.7 V and a bank capacitance of 500 F, since each cell has a cell capacitance of 3000 F. For HCs, the ESD-SCAP-CL-3000 F cells from Samwha Capacitors were used, and each cell has a maximum cell voltage of 2.8 V, which is 0.1 V higher than SC cells. Just like in the case of SCs, six cells were used in series for the HC bank to give a total of 16.8 V.
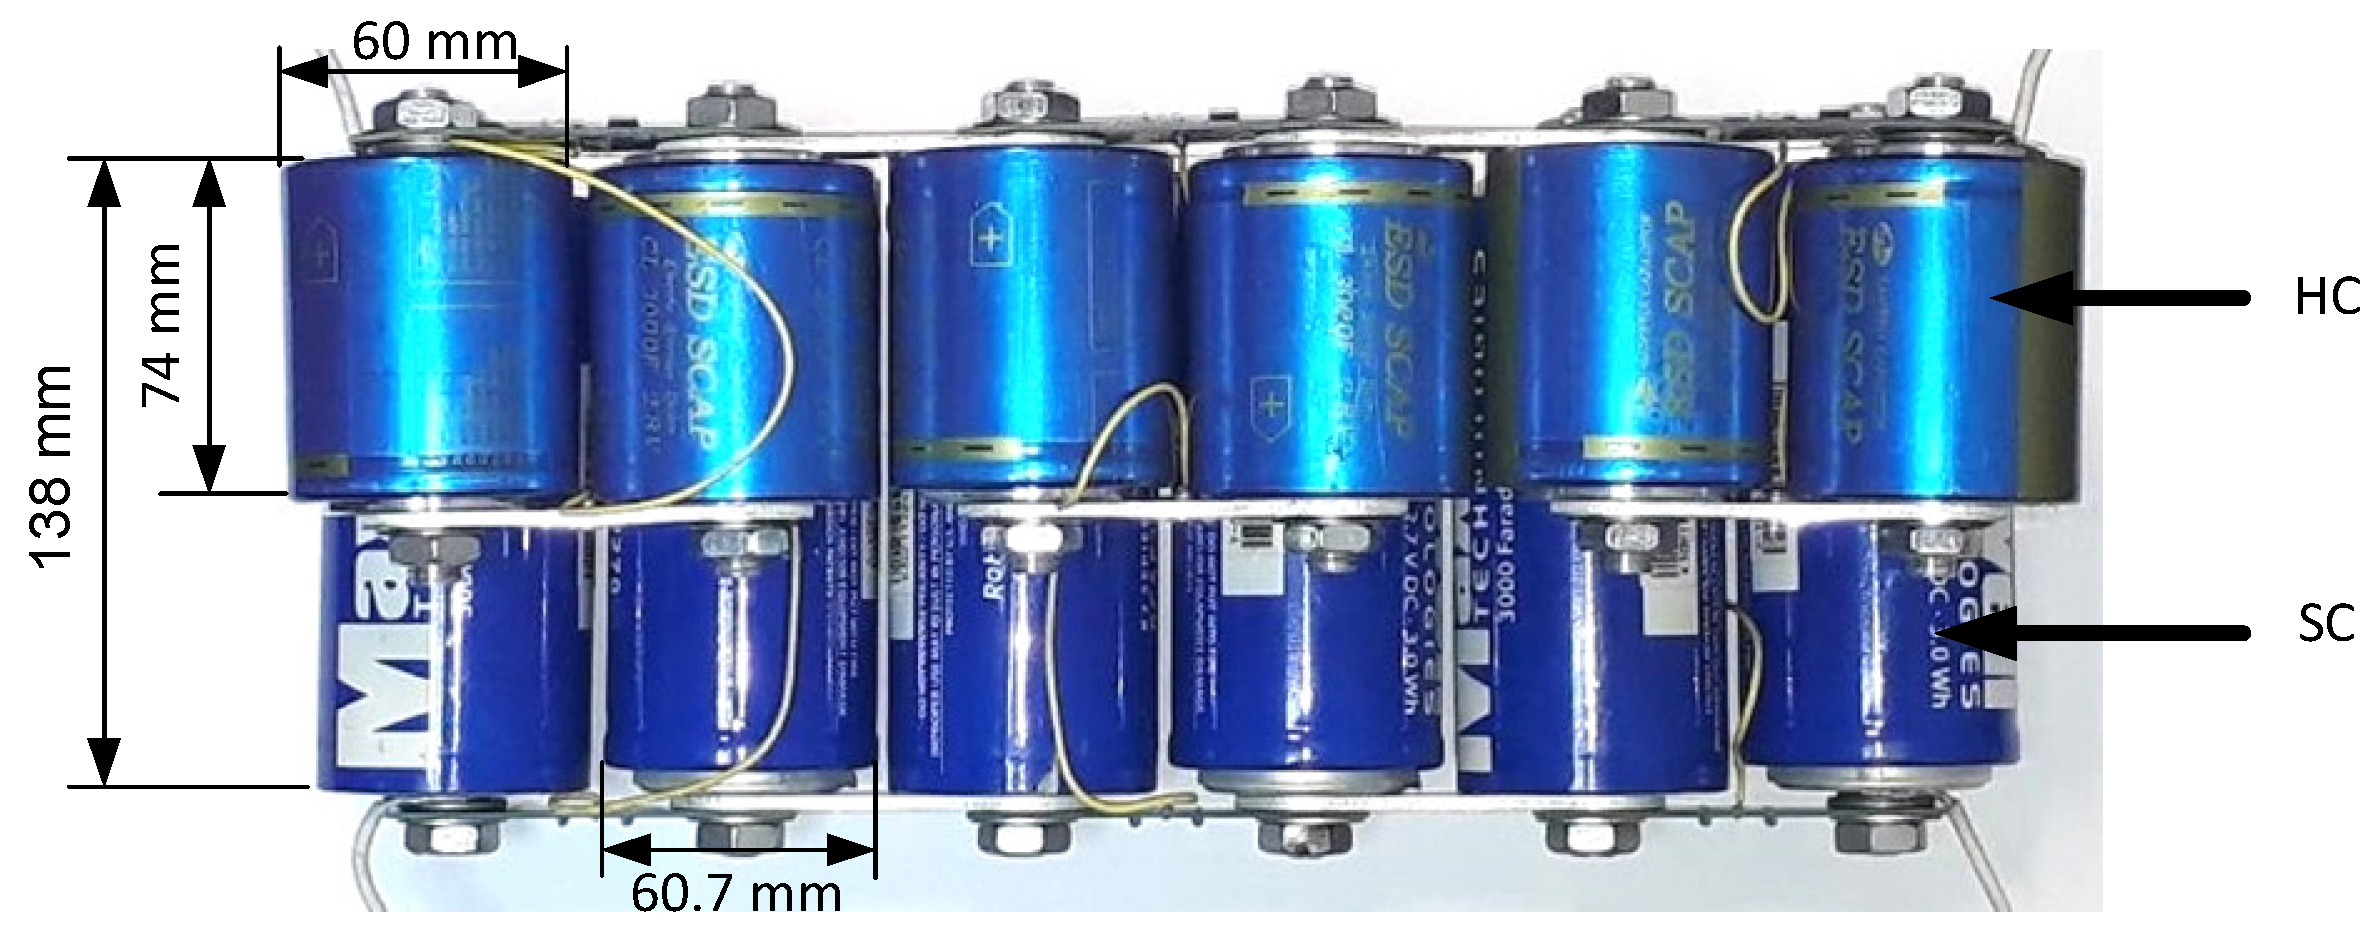
One of the major differences between SCs and HCs is the physical sizes, as can be seen in the image in Figure 2; HC is about half the size of SC, even though being rated at the same capacitance of 3000 F. This gives the feeling that HC is just a better version of SC, but looking at the internal resistances of the storage banks presented in Table 1, it is observed that SC has a lower equivalent series resistance (ESR); thus, it has a higher power density than HC, but a lower energy density. Therefore, there is an indication that SC and HC possess distinctly different characteristics that can be exploited to achieve better energy utilization.
The battery used for the experimental system was a 6000-mAh 4S lithium polymer (LiPo) battery from Turnigy Power Systems®. It is rated at a nominal voltage of 14.8 V, and usually, it is recommended not to discharge it below 14 V. The lithium polymer battery was used as opposed to the conventional use of Li-ion batteries because of the scale of the implementation. This battery has four cells in series, hence the ‘4S’ in the name, each cell having a voltage of 3.7 V, thus amounting to 14.8 V. Table 1 presents an overview of the important electrical parameters and the corresponding values of the energy storage devices.
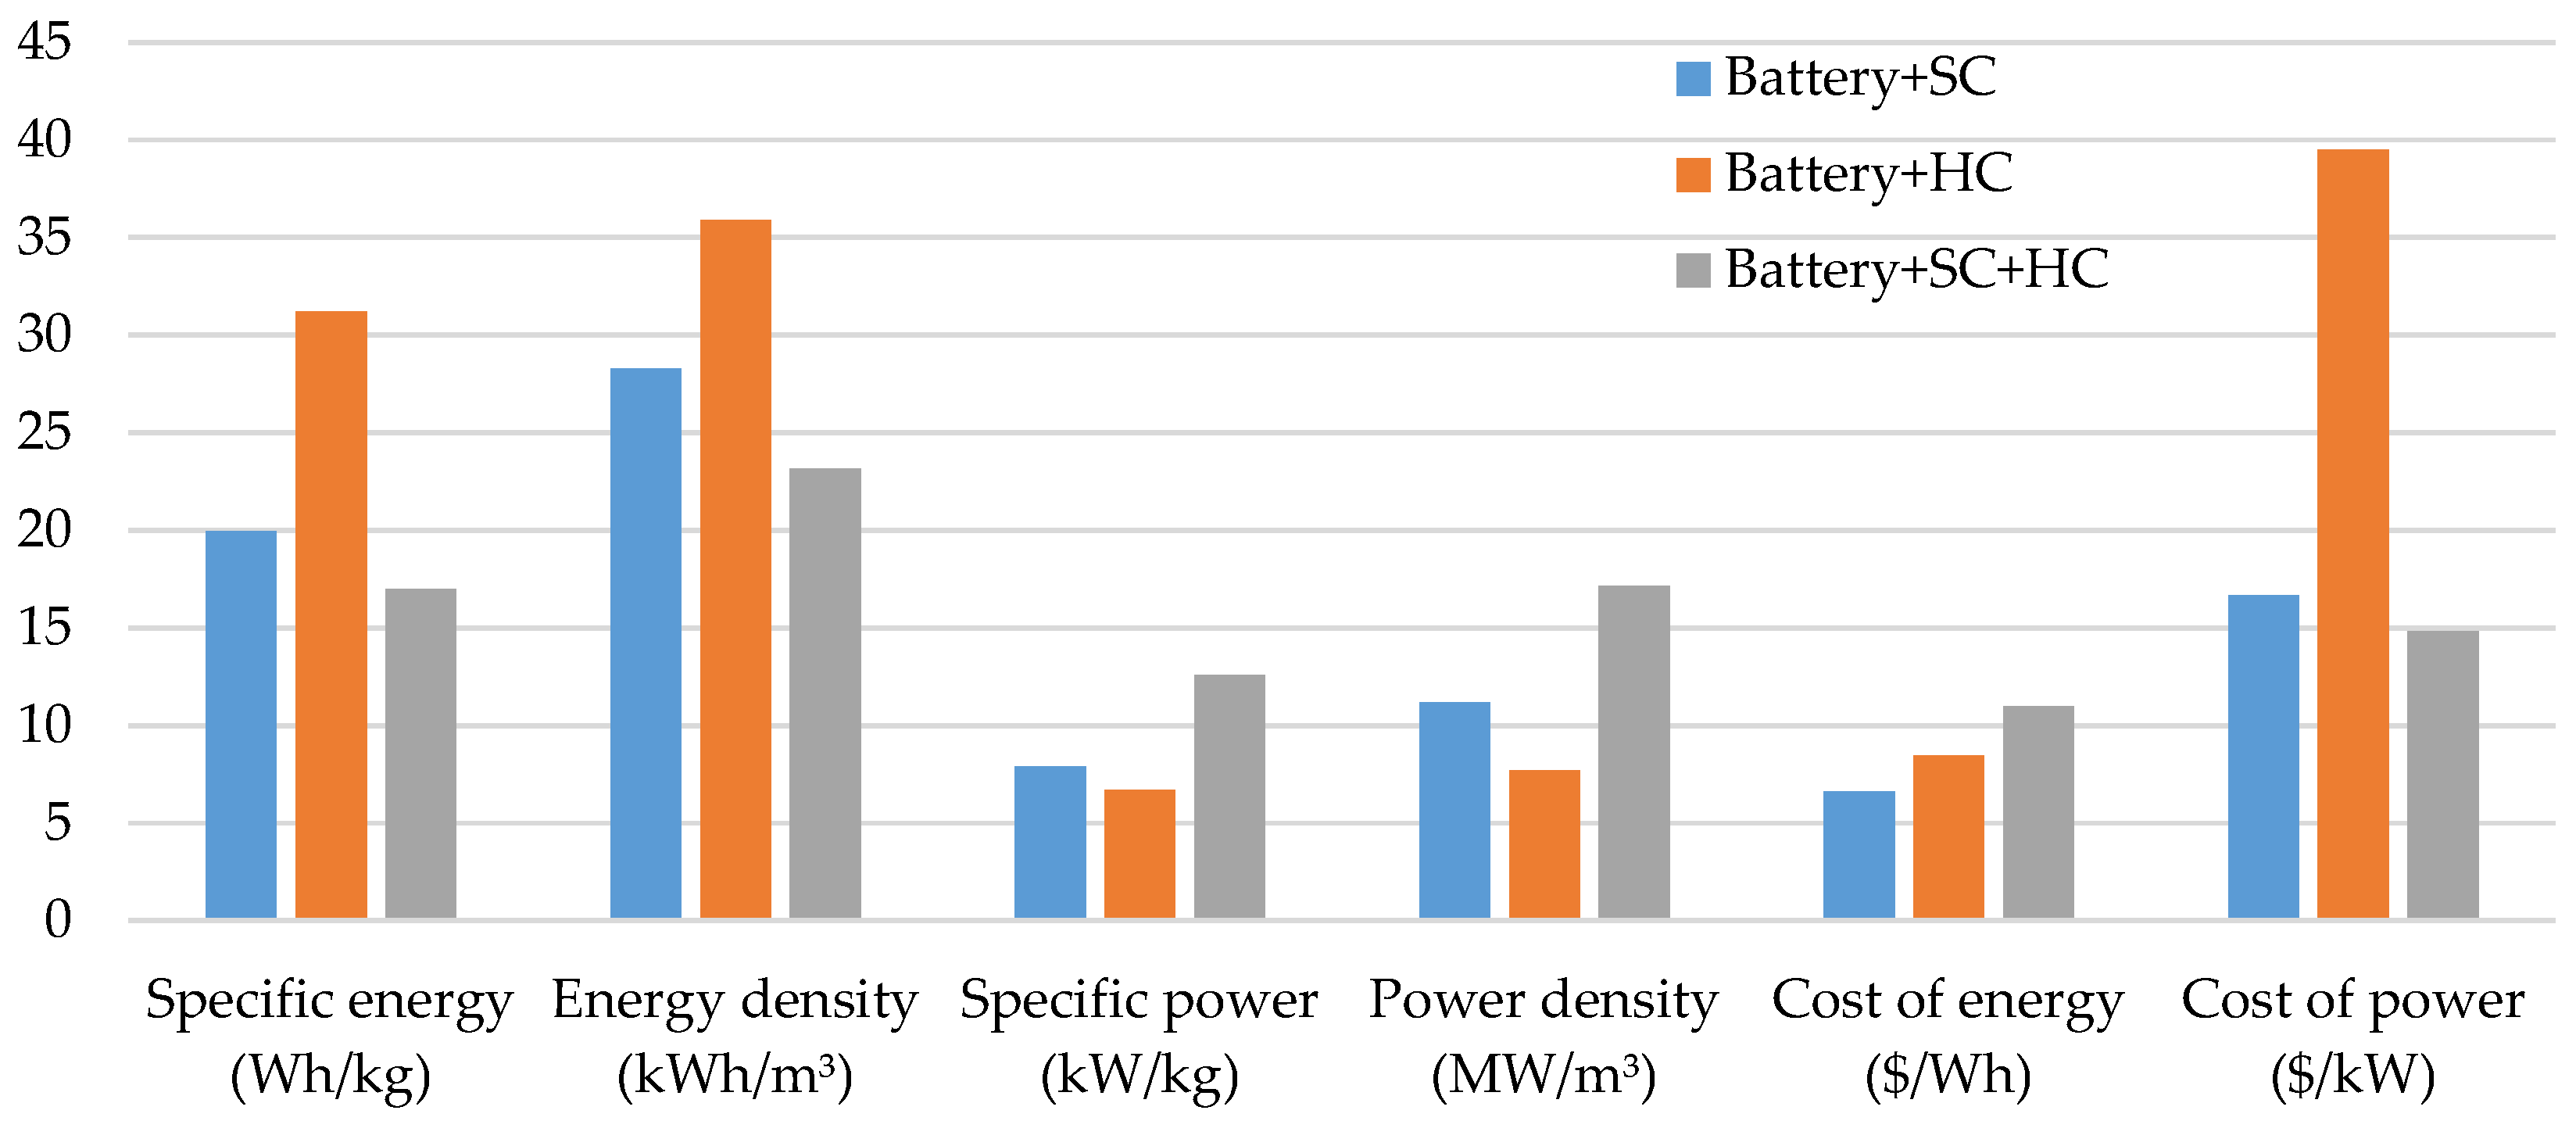
The three energy storage devices were analysed in different combinations, which gave rise to a total of three different hybrid energy storage regimes. These regimes are as follows; battery-SC, battery-HC, and the last one, which is the main focus of this research, the battery-SC-HC energy storage regime. The characteristic values of the three different energy storage regimes were normalised based on performance and cost parameters, and these comparisons are presented in Figure 3. The data presented in Figure 3 were obtained from the datasheets of the respective energy storages, excluding the cost information. The term cost is relative and depends largely on the factors considered; therefore, for this analysis, the cost did not factor into the logistics and shipping in order to eliminate any factor that could skew the results in any direction; only the market prices of the devices were considered. Furthermore, the cost did not factor in depreciation or the cost of any associated accessories; therefore, only the replacement costs are considered.
The performance classification of energy storages and even energy sources is usually into two categories: the volume and mass characteristics of the energy storages. The volume characteristics are taken seriously when considering applications that do not necessarily require mobility; an example of such applications is in grid-scale energy storages, in most cases, the mass of the energy storage is not much of a concern in such applications. However, in automotive applications such as EVs, the mass of the energy storage is of equal importance as the volume of space it would occupy. The volume characteristic of the energy storages can be further classified into two, namely the power and the energy density, while the weight characteristic is further classified as specific power and specific energy. The power density is the time rate of energy transfer per unit volume, while the energy density is the amount of energy stored in a system per unit volume. On the other hand, the specific power is the time rate of energy transfer per unit mass, while the specific energy is the amount of energy stored in a system per unit mass.
In Figure 3, it can be observed that the highest power density is obtained with the energy storage regime that has the combination of the battery, SC, and HC at 12.59 kW/kg, and 17.16 MW/m3 for the specific power and power density, respectively. In the battery–SC–HC hybrid storage, the ratio of power to energy is also at the lowest at 1:1.3; this is an improvement from the 1:3 and 1:5 of the battery–HC and battery–SC hybrid energy storage systems, respectively. For the economic implications, the combination of all three energy storages has the lowest cost per unit power sitting at 14.81 $/kW; its cost per unit energy is about 11 $/Wh; which is higher than that of the battery–SC at 6.6 $/Wh and the battery–HC at 8.47 $/Wh. However, looking at the ratio of the cost of energy to the cost of power per unit, the battery–SC–HC hybrid energy storage system is the lowest at 1:1.3 when compared to 1:3 and 1:5 of the battery–SC and battery-HC energy storage systems, respectively; thus making it a very cost-attractive hybridisation or combination of the energy storages. It is expected that as the years go by, the cost of HCs will drop further, which would further contribute positively to the benefits of having both SCs and HCs in the same energy storage system.
To conclude this analysis, considering the economic and performance characteristics of the energy storage regimes analysed, it can be said that the best energy storage regime for application in EVs would be an effective combination of the three energy storages, that is the battery, SC and HC. This is because this energy storage regime gives room to exploit the high energy characteristics of the battery separately through the multiple input converter and the high power characteristics of SC and HC independently, as well, while still affording a low deviation between the cost per unit power and energy.

2.2. The Multiple Input Converter Implementation

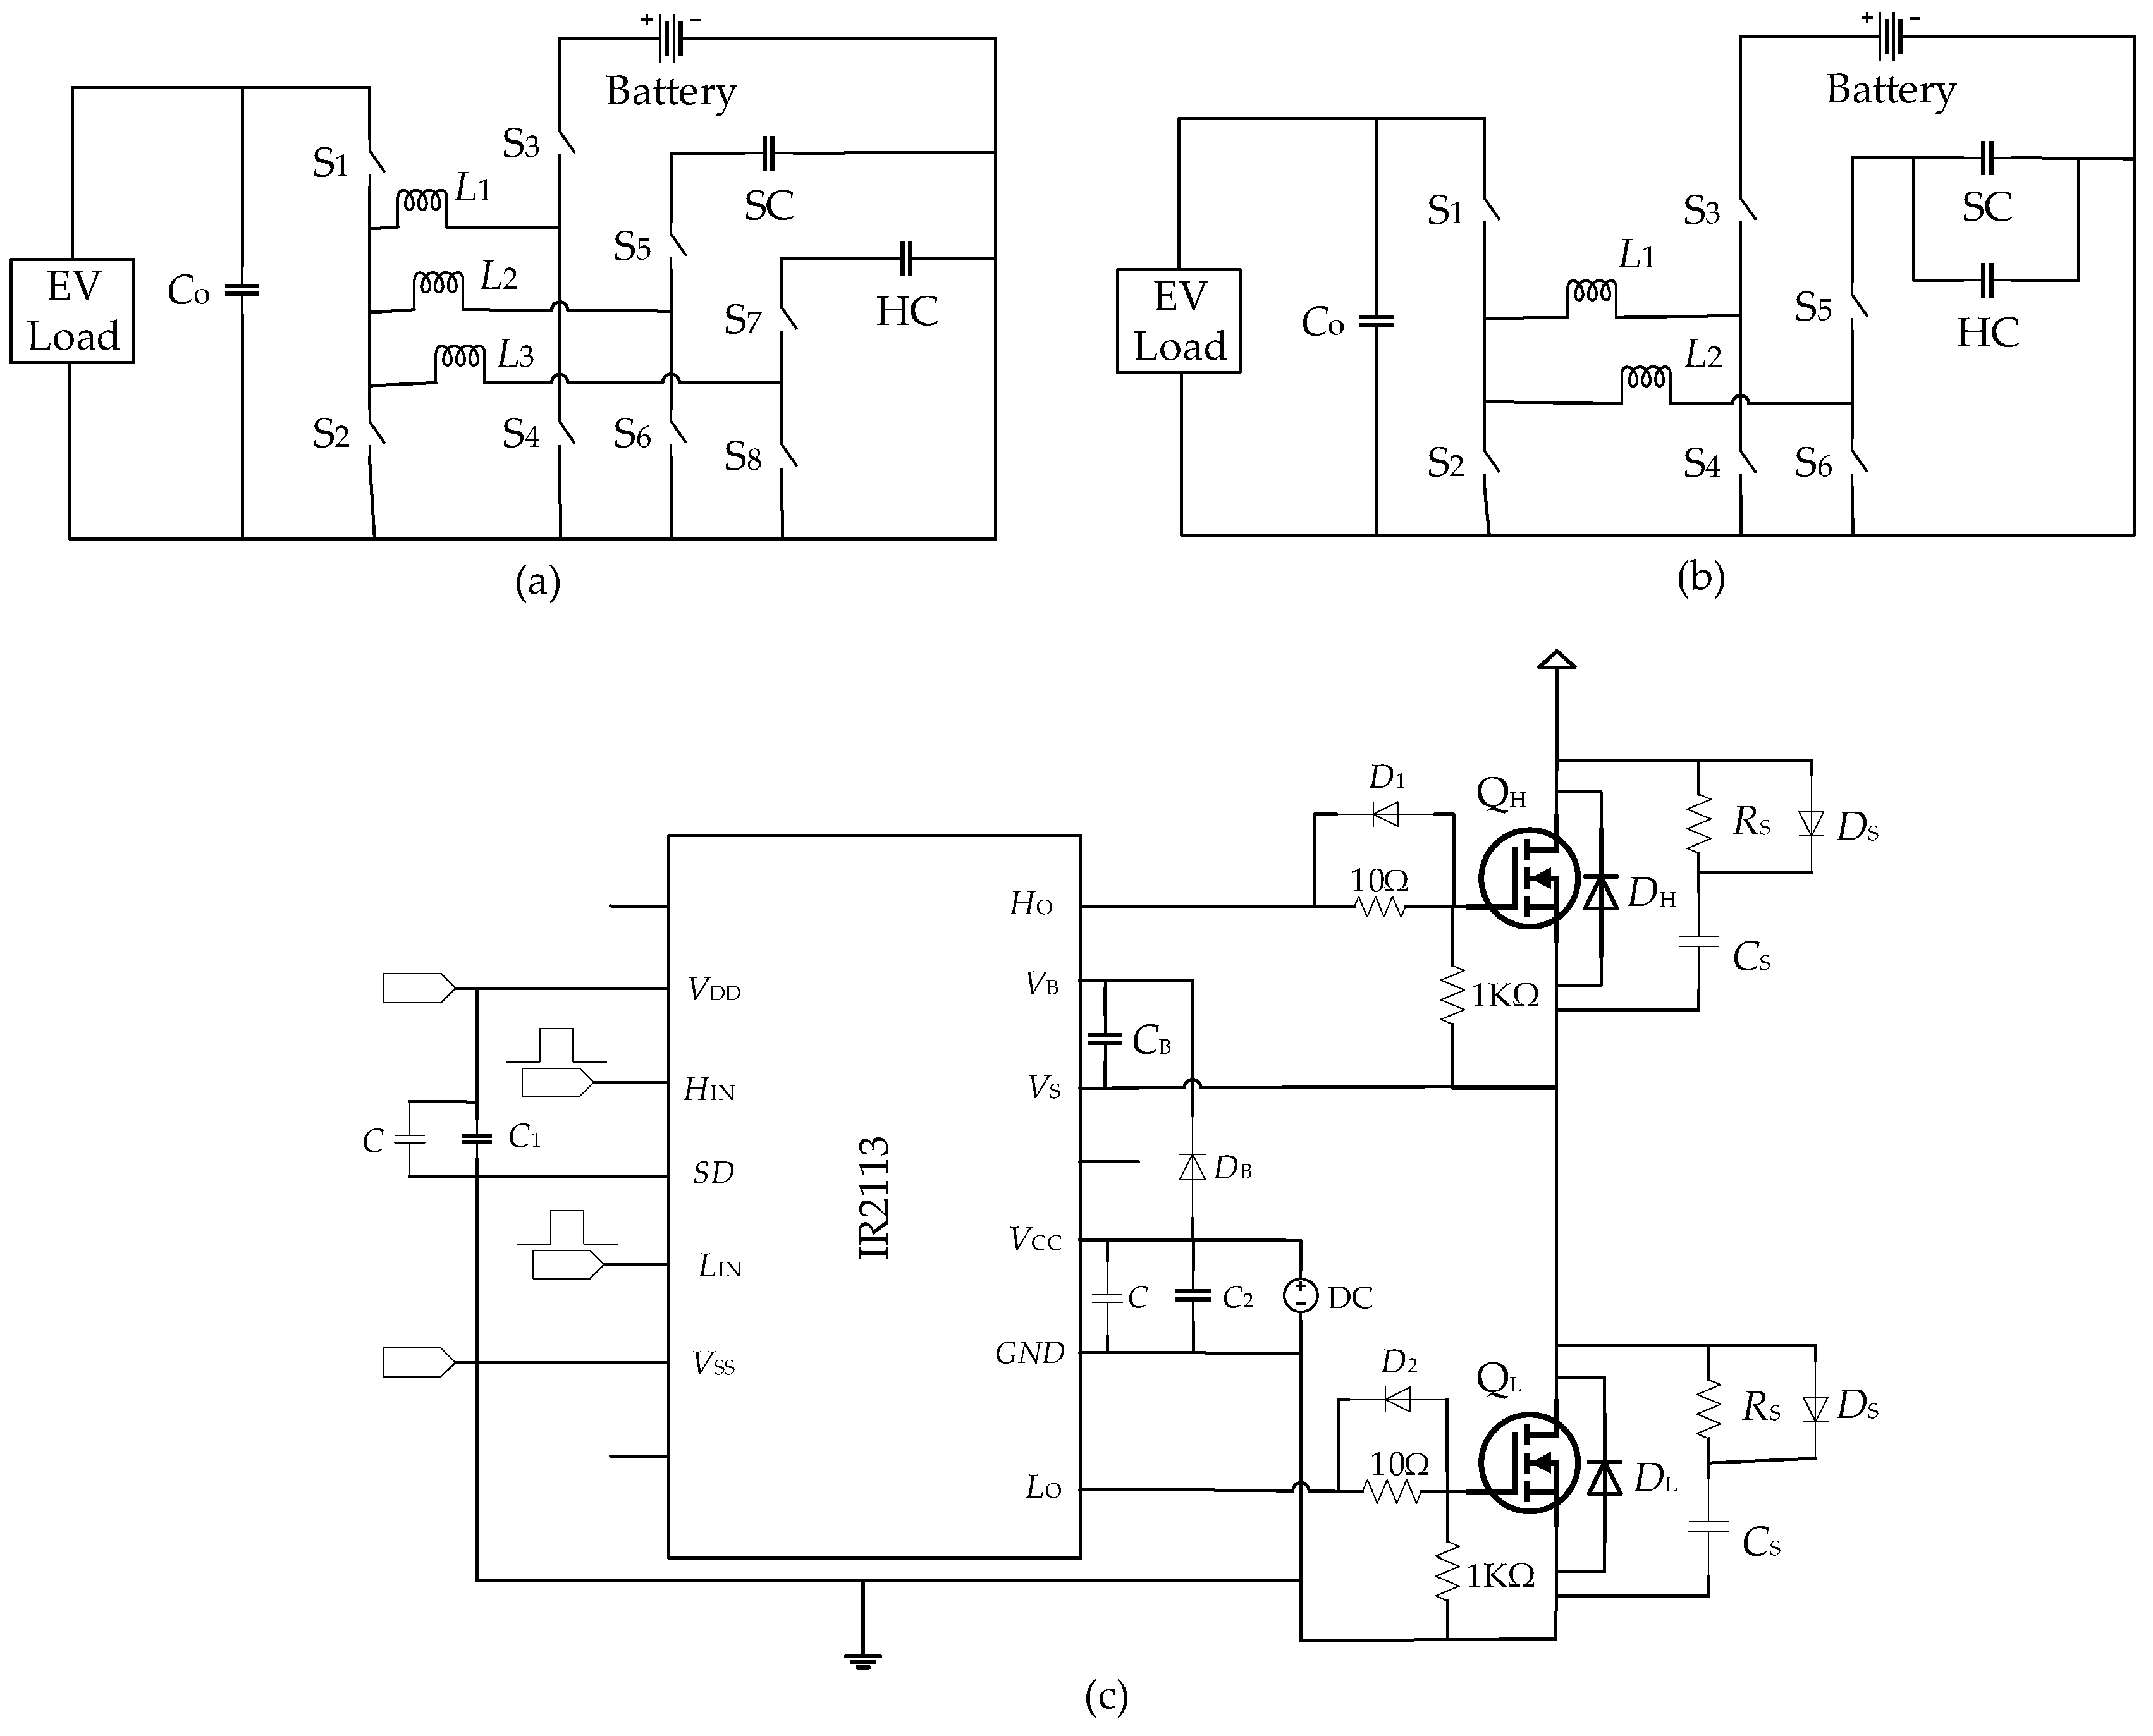
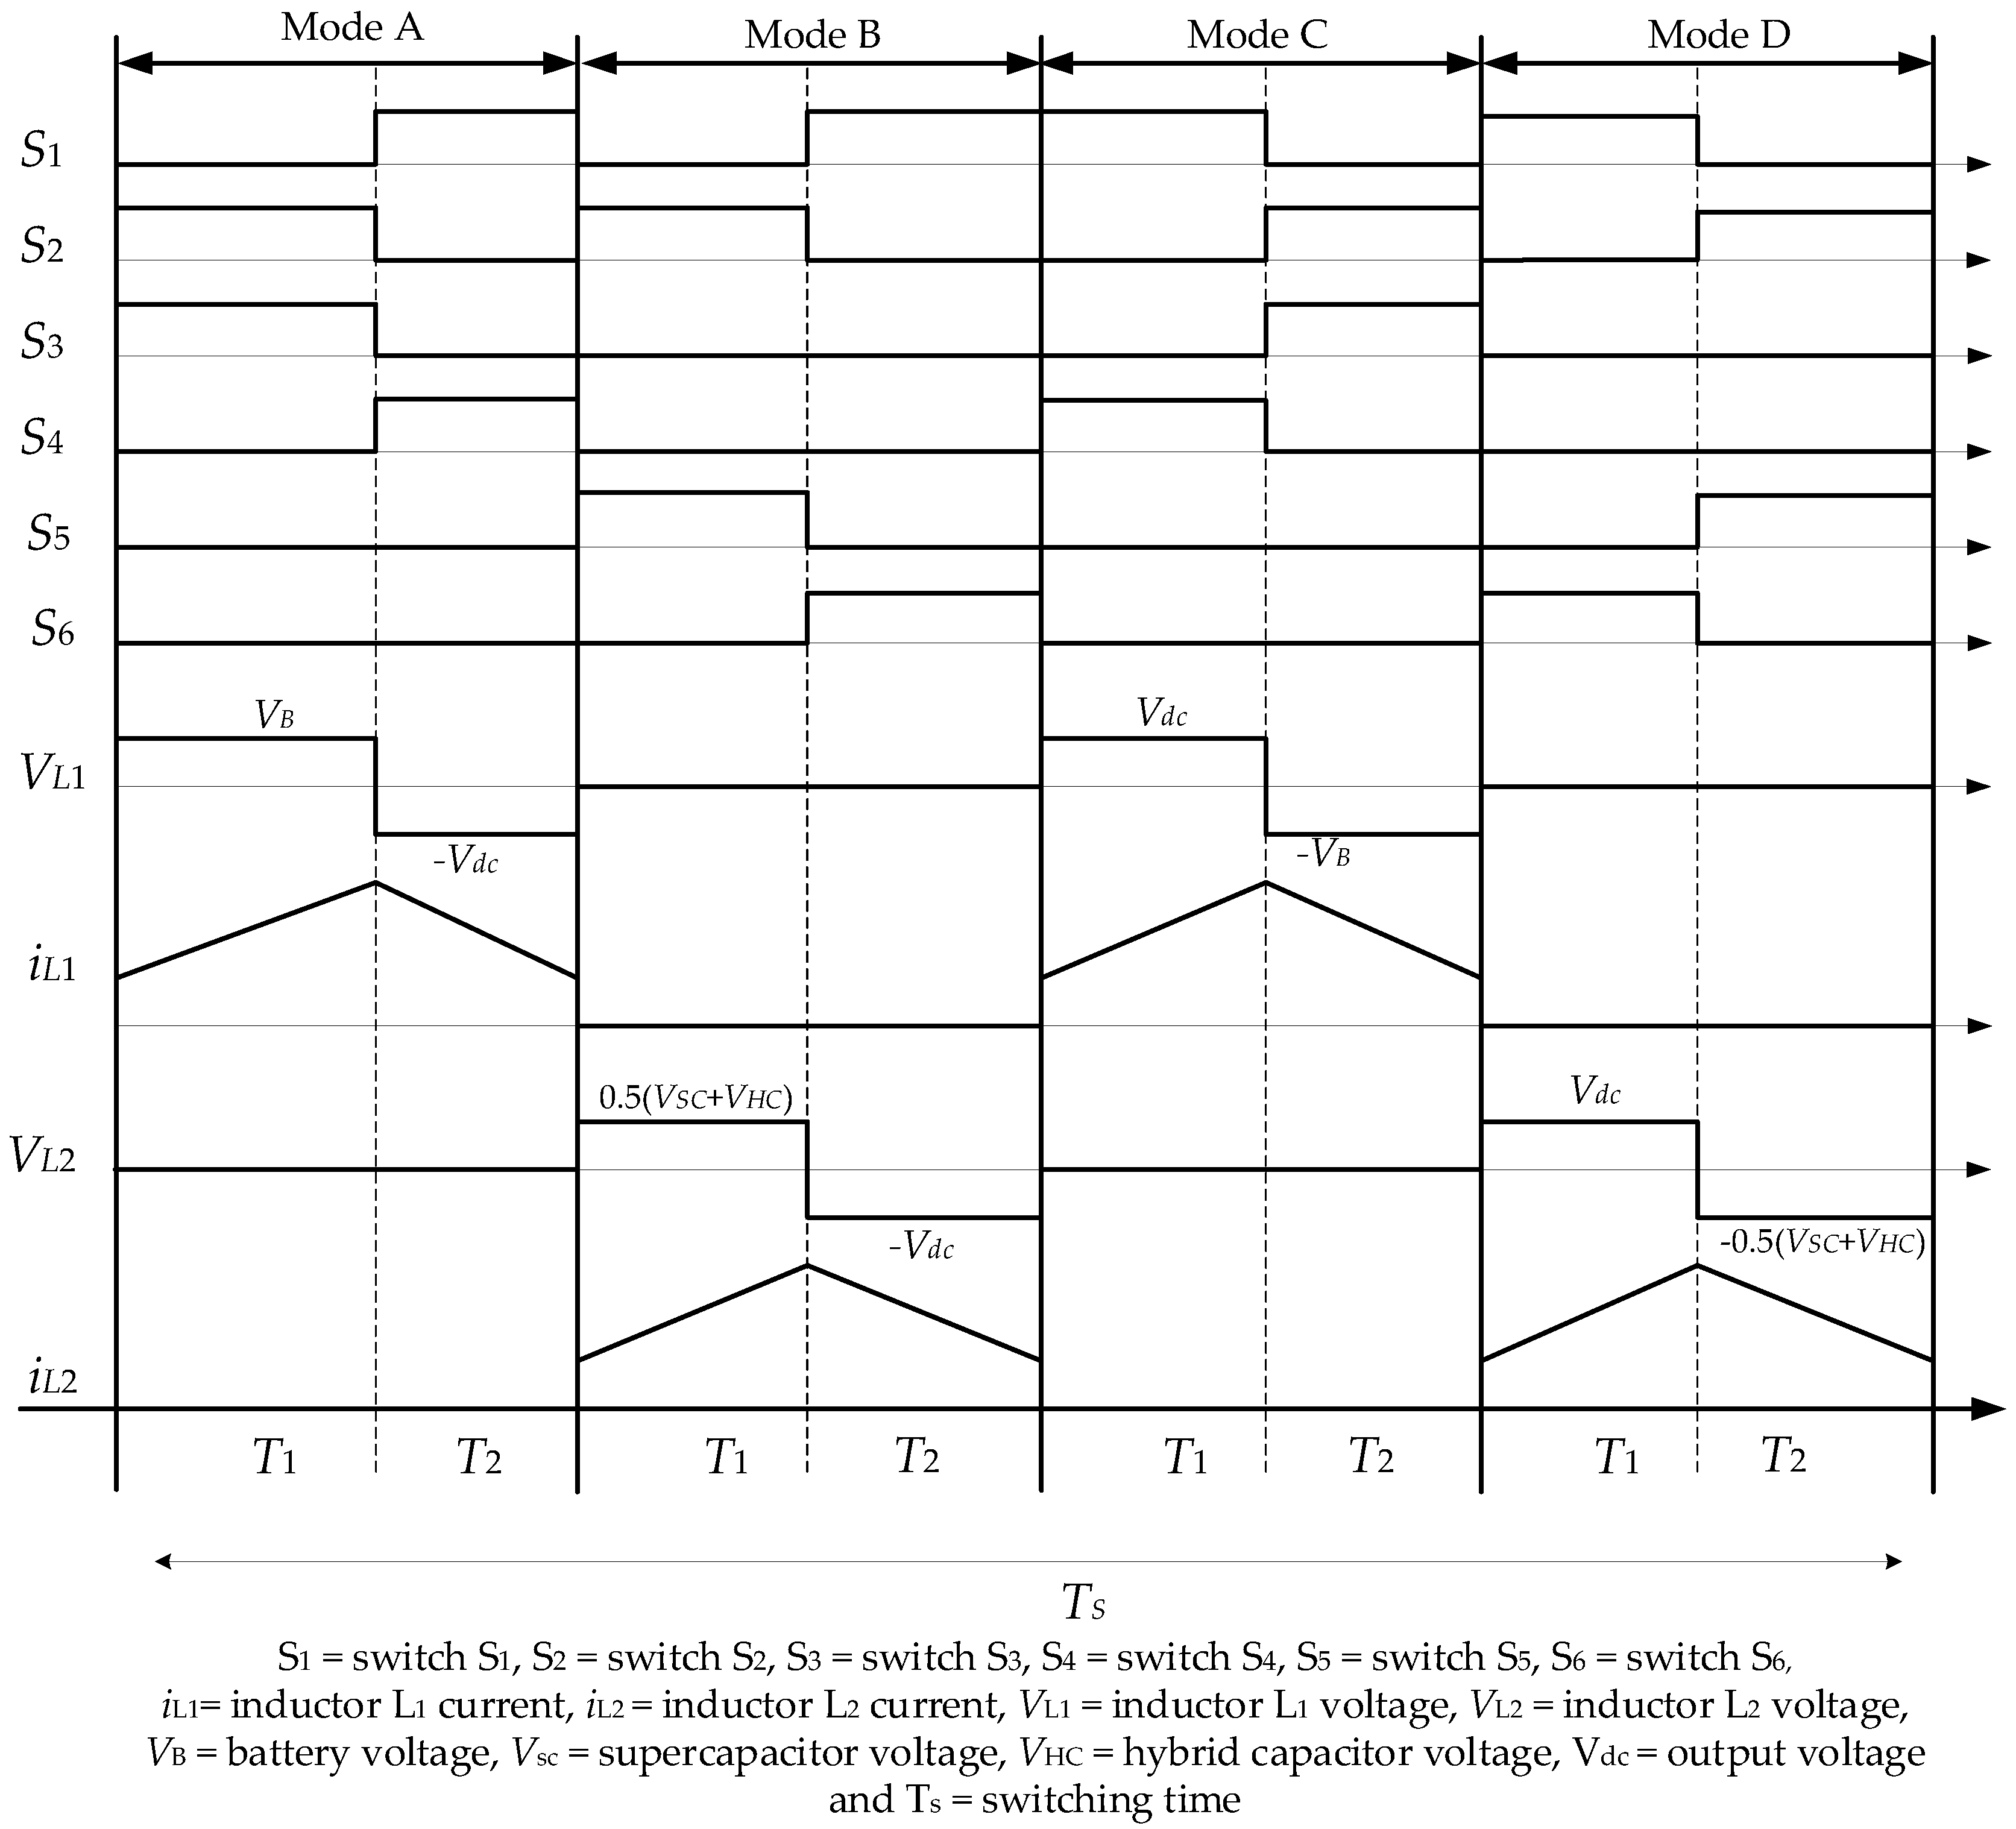
Figure 4a,b presents the conventional and the proposed energy storage hybridisation topologies, respectively. The conventional hybridisation topology involves the use of a three-input DC–DC converter, having one input port for each energy storage, while the hybridisation topology proposed in this research involves having SC and HC connected directly in parallel, thus requiring only a two-input converter, as shown in Figure 4b. The multiple input converter that was used to implement the proposed hybridisation topology as presented in Figure 4b was first proposed by the authors of [41,42]. The converter can operate in Modes A and B and C and D, as described by the switching patterns presented in Table 2, when the energy storage devices (battery and SC and HC, respectively) are supplying energy and when the DC link is supplying energy to the storage devices, for example during regenerative braking, respectively. Specifically, in Mode A, the battery alone is supplying energy to the EV, while in Mode B, only SC and HC are supplying energy to the EV load. Conversely, in Mode C, energy is being transferred from the DC link of the EV to the battery, while in Mode D, energy is being transferred from the DC link to SC and HC. The steady state waveforms of the converter operation in the modes described above is presented in Figure 5. More detail about the steady-state waveform and other possible modes of the converter operation were adequately addressed in reference [42]. The relationship between the battery voltage and DC bus voltage in Modes A and D is presented in Equations (1) and (2), while the relationship between the DC bus voltage and the parallel arrangement of SC and HC is given by Equations (3) and (4) for Modes B and C, respectively, where VDC is the average output voltage, D is the duty ratio, T1 is the ON time, while T2 is the total OFF time, and VB, VSC, and VHC is the battery, SC, and HC voltage, respectively [42].
V D C = T 1 T 2 + T 3 .   V B = D 1 D   .   V B
V B = T 1 T 2 + T 3   . V D C =   D 1 D   .   V D C
V D C   V D C = T 1 T 2 + T 3   .   1 2   ( V S C +   V H C ) =   D 1 D   . 1 2   ( V S C +   V H C )
1 2   ( V S C +   V H C ) = T 1 T 2 + T 3   .   V D C =   D 1 D   . 1 2 V D C
Taking a look at the converter in Figure 4b, it can be seen that when each input is considered individually, it is simply an H-bridge DC–DC converter without isolation, therefore having high side and low side switches, just like the conventional H-bridge converter. The high side switch in simple terms refers to the switching arrangement of having the switch connected between the positive (high) side of the power supply and the load, like Switch S3 in Figure 4b; while the low side refers to having the switch connected between the ground (low side) and the load, like Switch S4 in Figure 4b. The odd numbered Switches S1, S3, S5, and S7 for Figure 4a and S1, S3, and S5, while the even numbered Switches S2, S4, S6, and S8 for Figure 4a and S2, S4, and S6 for Figure 4b are the low side switches.
The switches were implemented using N-channel MOSFETs, both for the high side and the low sides. P-channel MOSFETs are sometimes used for high side switching since the driving circuits are less complex than that of the N-channel MOSFETs used in high side switching. However, P-channel MOSFETs usually have a much higher ON state resistance than the complementary N-channel MOSFETs. Therefore, the N-channel MOSFET was the switch of choice in this case, since it has a lower ON-state resistance, which meant higher efficiency could be achieved than if a P-channel MOSFET were to be used. In Figure 4c, the schematic implementation of the high side (QH) and the low side (QL) is presented alongside the MOSFET driver implementation circuit. The MOSFETs were switched using an IR2113 MOSFET driver from Infineon technologies. The IR2113 is a half-bridge MOSFET driver with 14-pin dual in-line packaging that allows for driving one half (that is the high side and the associated low side) of the H-bridge switch topology from one chip. This is a very big benefiting feature, since it would eliminate the need to drive every single switch independently, which would have increased the number of chips required; hence, board space is saved. Using a half bridge driver meant that only four drivers were required for the three-input converter and only three driver chips for the two-input converter presented in Figure 4a,b, respectively; therefore, only one driver chip is required for each additional input port to the converter system.
In Figure 4c, the 1-kΩ resistor placed between the gate and source of the MOSFETs is a gate protection resistor to ensure that the switches turn OFF properly. The 10 Ω resistor delays the turn ON, while the diode (D1 and D2) placed in reverse bias to the resistor both discharges the capacitance of the MOSFET quickly to avoid a delayed turn OFF in order to prevent cross conduction across the adjacent high side and low side switches, respectively. L1, L2, and L3 are the inductors of each of the input sources, and Co is the output capacitor of the multiple input converters. An RCD snubber design is implemented, which is a snubber circuit involving the use of a resistor, capacitor, and diode. The snubber circuit was used to protect the switches from accidentally turning ON due to stray signals in the circuit by damping the voltage and current ringing, reducing the switching losses and transfer power dissipation from the switches to avoid heating up the switches. Rs and Cs are the snubber resistors and capacitors for the snubber circuits of each of the switches. The values of Rs and Cs were calculated using Equations (5) and (7) [43,44], respectively. The resistor, Rs, needed to be low enough to allow the dissipation of power at the maximum switching voltage and current, hence the application of Ohms’ law, as described in Equation (5). Since the resistor dissipates its energy by storing it in the snubber capacitor Cs, considering a 2-W resistor such that it is able to dissipate half of its power rating into the capacitor for twice the switching frequency in one second, as described in Equation (6), therefore Cs was obtained as presented in Equation (7) [43,44], where is the maximum switching voltage, is the maximum switching current, f is the switching frequency, and Cs is the capacitance of the snubber capacitor.
R s   v 0 I
1 = 1 2 C s v 2 × 2 f
C s = 1 v 0 2 f
For the MOSFET driver circuit, VDD and VSS are the output voltage levels of the controller and the ground of the controller; this is to ensure an adequate reference ON and OFF state so the driver could understand the ON and OFF states of the controller. A capacitor C1 is added with a parallel ceramic capacitor of low equivalent series resistance to facilitate high frequency switching. HIN and LIN are the inputs of the MOSFET driver for the high side and low side switch signals, respectively. SD is the shutdown pin, which acts as a fail-safe when there is an error in the operation of the converter; it shuts down the driver operation to prevent further damage to the MOSFET driver, and GND is the common ground. Again C2 is an electrolytic capacitor, and a complementary ceramic capacitor is used to ensure stable voltage across VCC and GND. LO is the gate drive signal for the low side switch, while HO is the gate drive signal for the high side switch. Since an N-channel MOSFET was used for the high side switching, the gate signal voltage had to be higher than the voltage at the drain of the switch; therefore, a floating gate voltage was used. This was achieved by using a bootstrap circuit, which was implemented simply using CB and VB. VS is tied to the source of the high side switch and therefore becomes the effective reference ground for the bootstrap capacitor, and VB, which is the bootstrap voltage, gets its charge from forward biasing the diode DB. This makes the switching signal of the high side switch have a voltage VB higher than the voltage (VDS) at the drain of the corresponding high side switch. The values for the various circuit parameters presented in Figure 4b,c are presented in Table 3.

3. Results

The tests carried out on the energy storages involved verifying the performance of the energy storages against the results of previous research, the specifications on their datasheet, the theories guiding their operation, and validating the proposed energy storage hybridisation topology. It was important to validate the energy storages by verifying the working condition; this was done by carrying out charging and discharging tests and comparing the results to previous research.
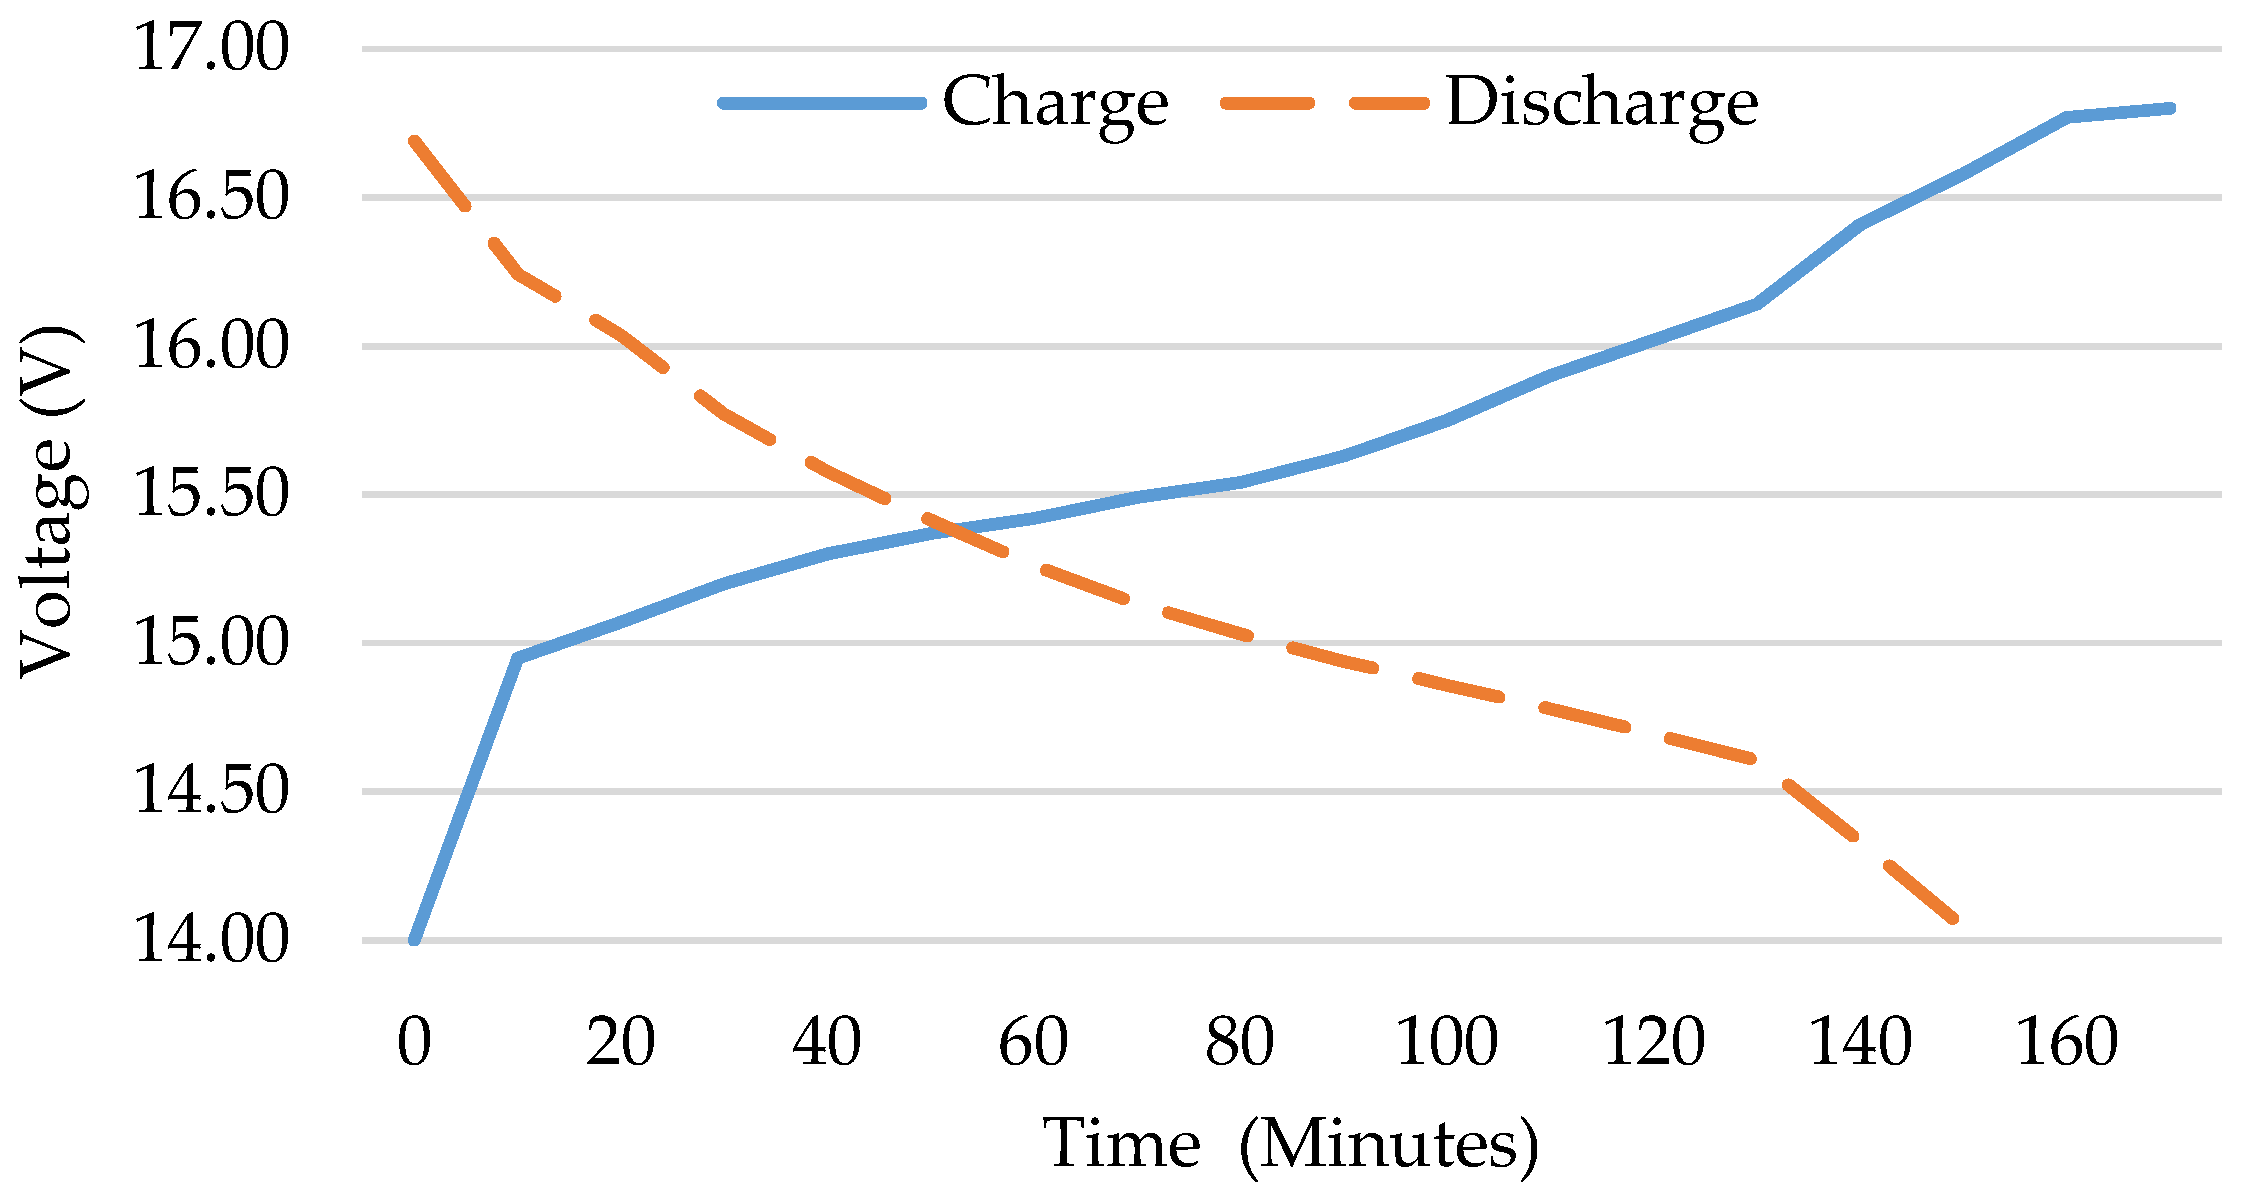
Starting with the battery, the charge and discharge curves of the battery are presented in Figure 6. The battery was charged by supplying a 2-A constant current through its terminals, and charging started at a full discharge of 14 V and lasted till a full charge voltage of 16.8 V; while the discharge started from a full charge voltage of 16.8 V and then stopped when the useable energy in the battery was consumed at 14 V. The charging of the battery under the constant 2-A current lasted for about three hours, while the full discharge under a 2-A load lasted for about 2.5 h. Comparing this to the discharging time obtained by [33,37], they reported a 60-min discharge time for the battery under a 4-A load. According to the datasheet of the battery in reference [40], it is rated at 6000 mAh, which means it is expected to be able to supply a load of 6 A for one hour; using this as a ratio, that means under a 2-A load, it should run for up to three hours. From the discharge test, the battery was seen to be able to run for more than 80% of the time prescribed by the manufacturer; therefore, the battery performance was within acceptable limits.
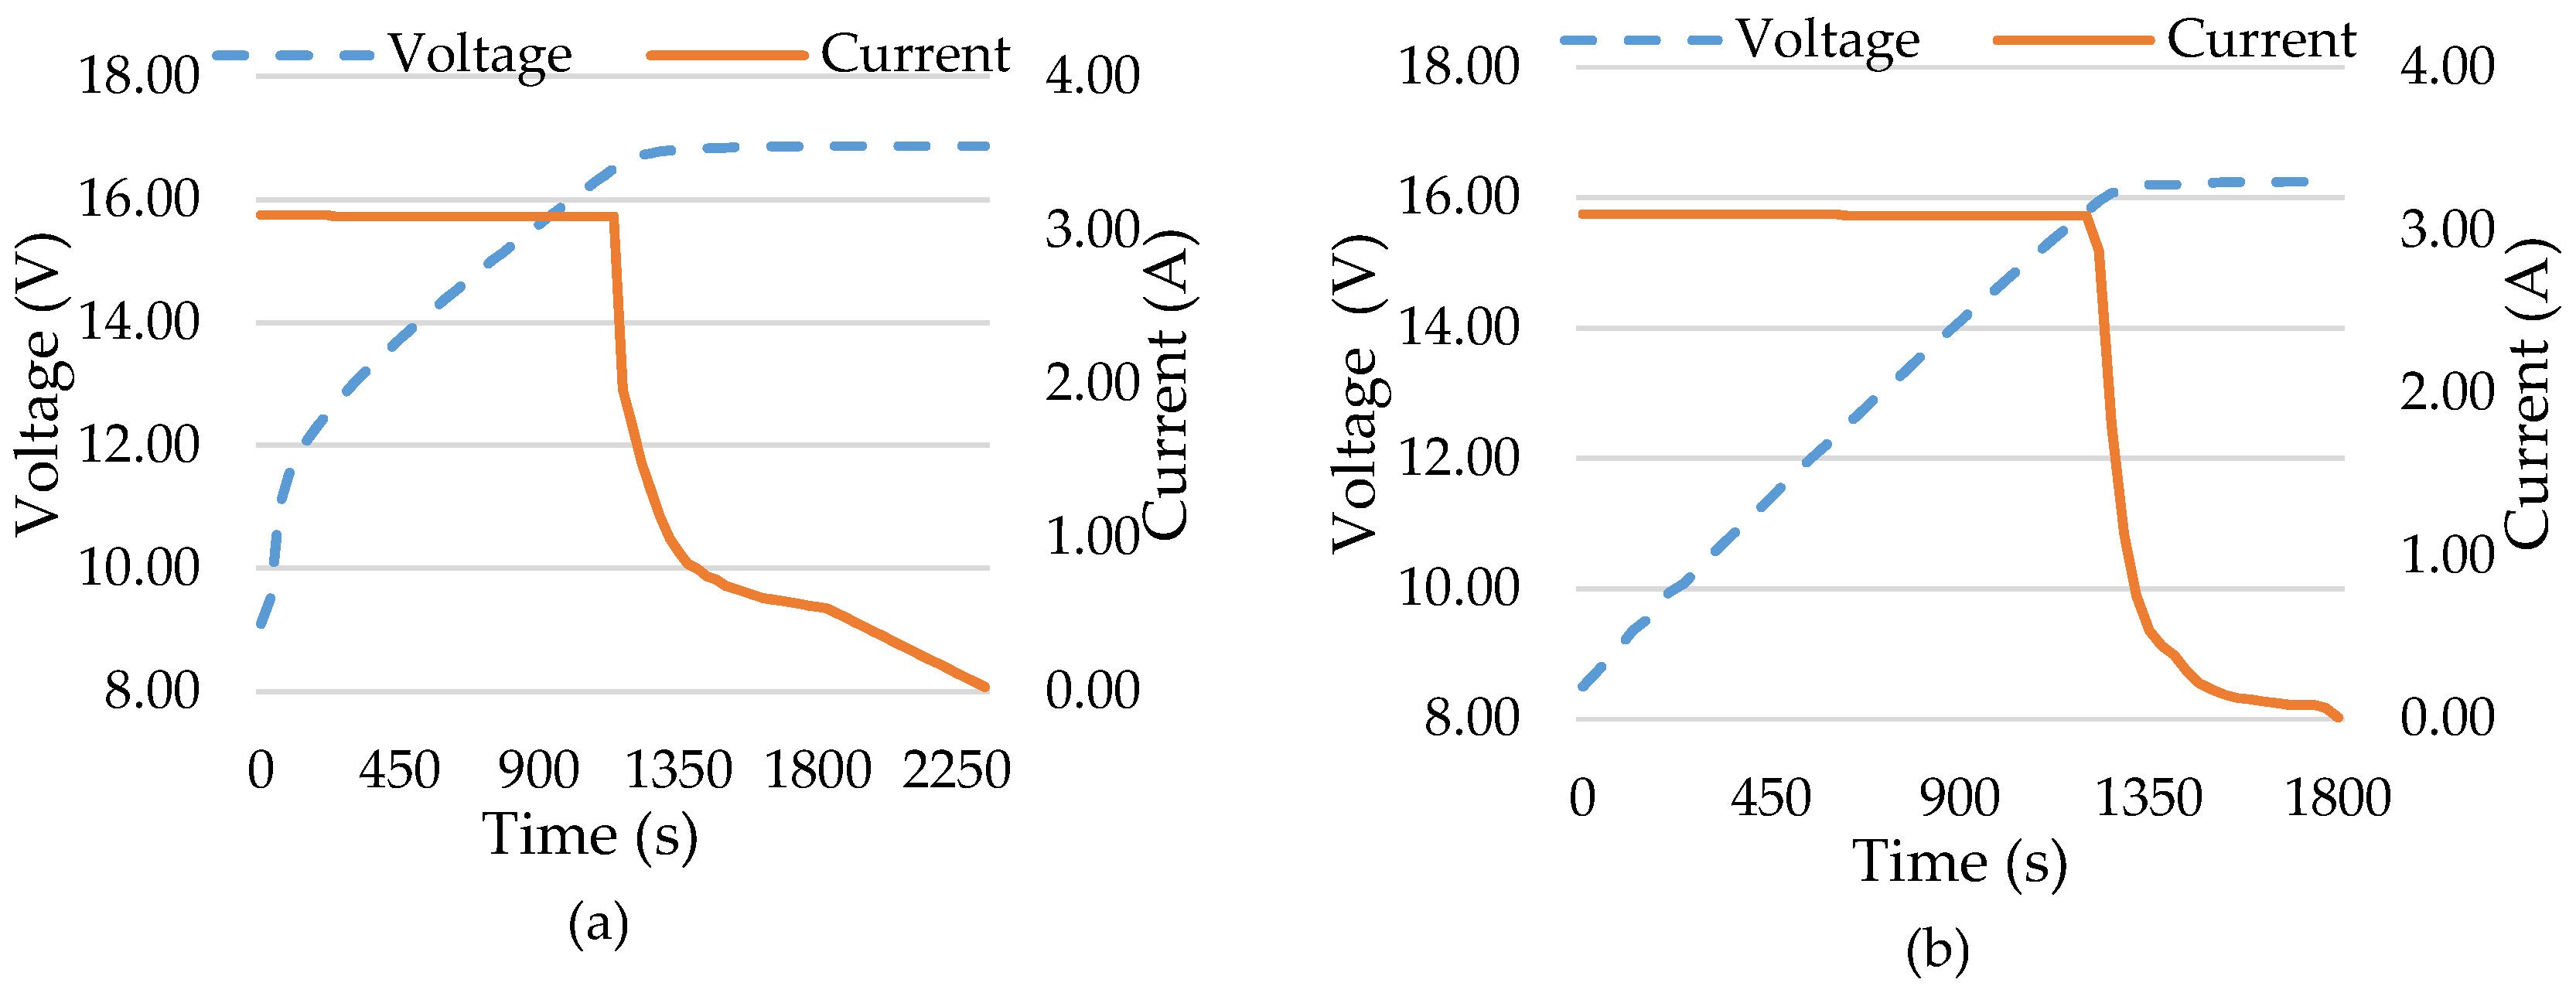
The charging of SC and HC was done similarly to, but a little differently from the battery. To charge SC or HC, first you start with a constant current with the charging voltage limited to the maximum bank voltage. This is done to allow the flow of charges from the charger into the SC or HC banks due to the potential difference. When the respective bank voltages begin to approach the maximum bank voltage, there is a decrease in the potential difference; therefore, the current begins to drop, and constant voltage charge begins to facilitate trickle charging until there is no potential difference between the charger and SC or HC; thus, the current falls to zero when charging is complete. As can be observed in Figure 7a for SC and Figure 7b for HC, charging started at a low voltage of about 8.5 V; at this voltage, the capacitors are discharged up to about 90% capacity. The current was constant at 3 A when the capacitors reached their full charge; the current began to reduce to allow the trickle charging to take place. Charging of SCs and HCs was carried out using a laboratory power supply; this was to allow the limiting of the charging voltage to 16.8 V so that the cells were not damaged by overcharging. The charging time of the capacitors under the 3-A current lasted for about 30 min for the SC and about 40 min for the HC bank; these results are different from the less than 20 min reported by [33,37]; however, this is very likely due to the trickle charging carried out in this research because it was not reported by the authors in [33,37] that trickle charging was done in their research.
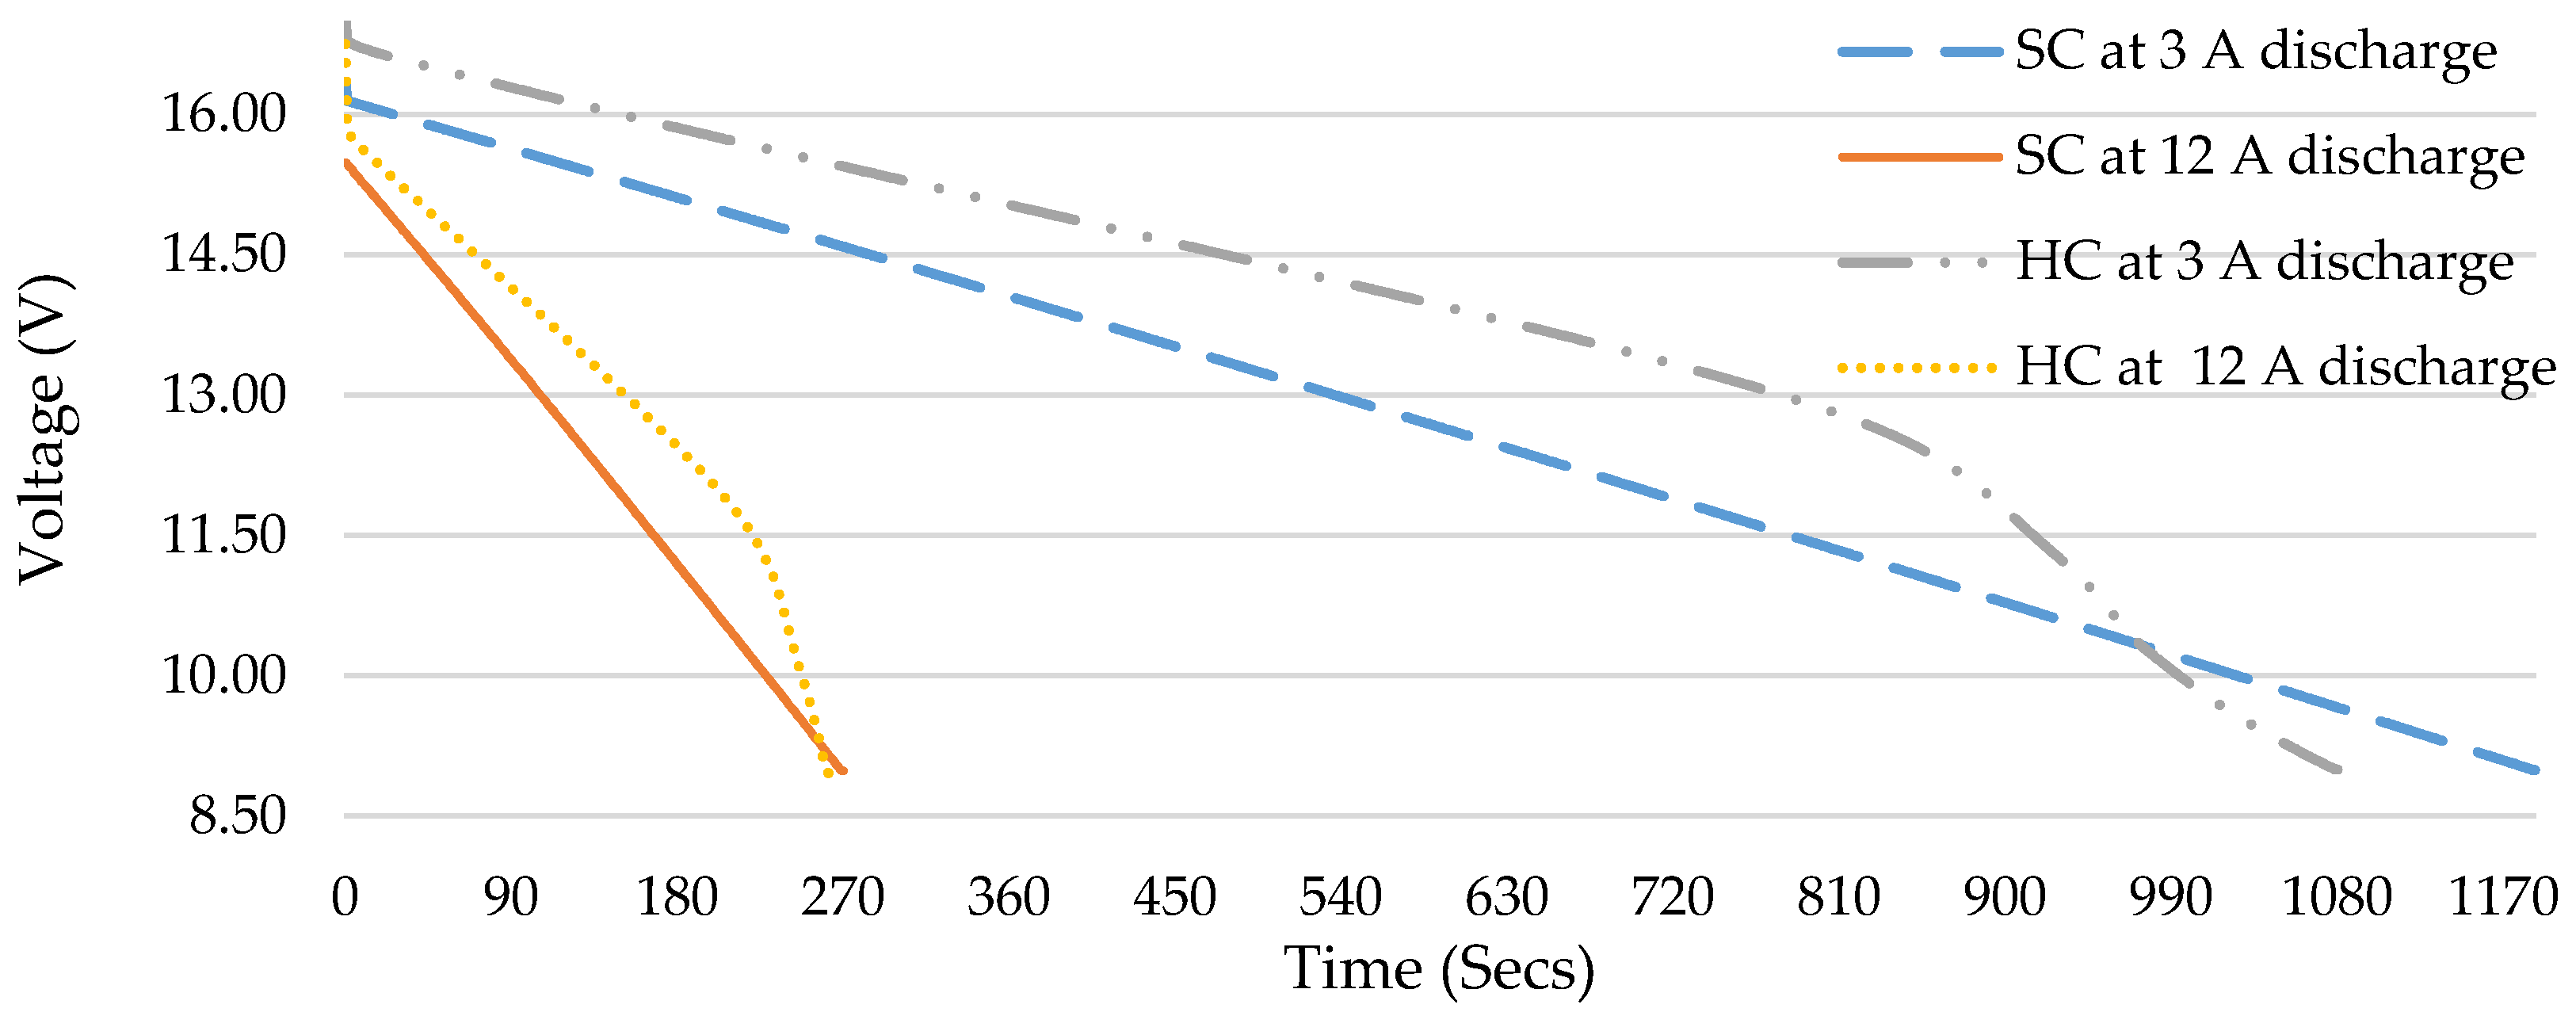
In Figure 8, the discharge results obtained for SC and HC are presented; the discharge was carried out at 3 A and 12 A using a B&K Precision 8602 electronic load. The discharging times of SCs are much longer than the discharge time reported by [33,37]. Specifically, under 12 A, SC and HC lasted more than two minutes longer, while under a 3-A load, they lasted over eight minutes longer than the 11 min reported by [33,37]. This shows the huge importance of trickle charging in the use of SCs and HCs.
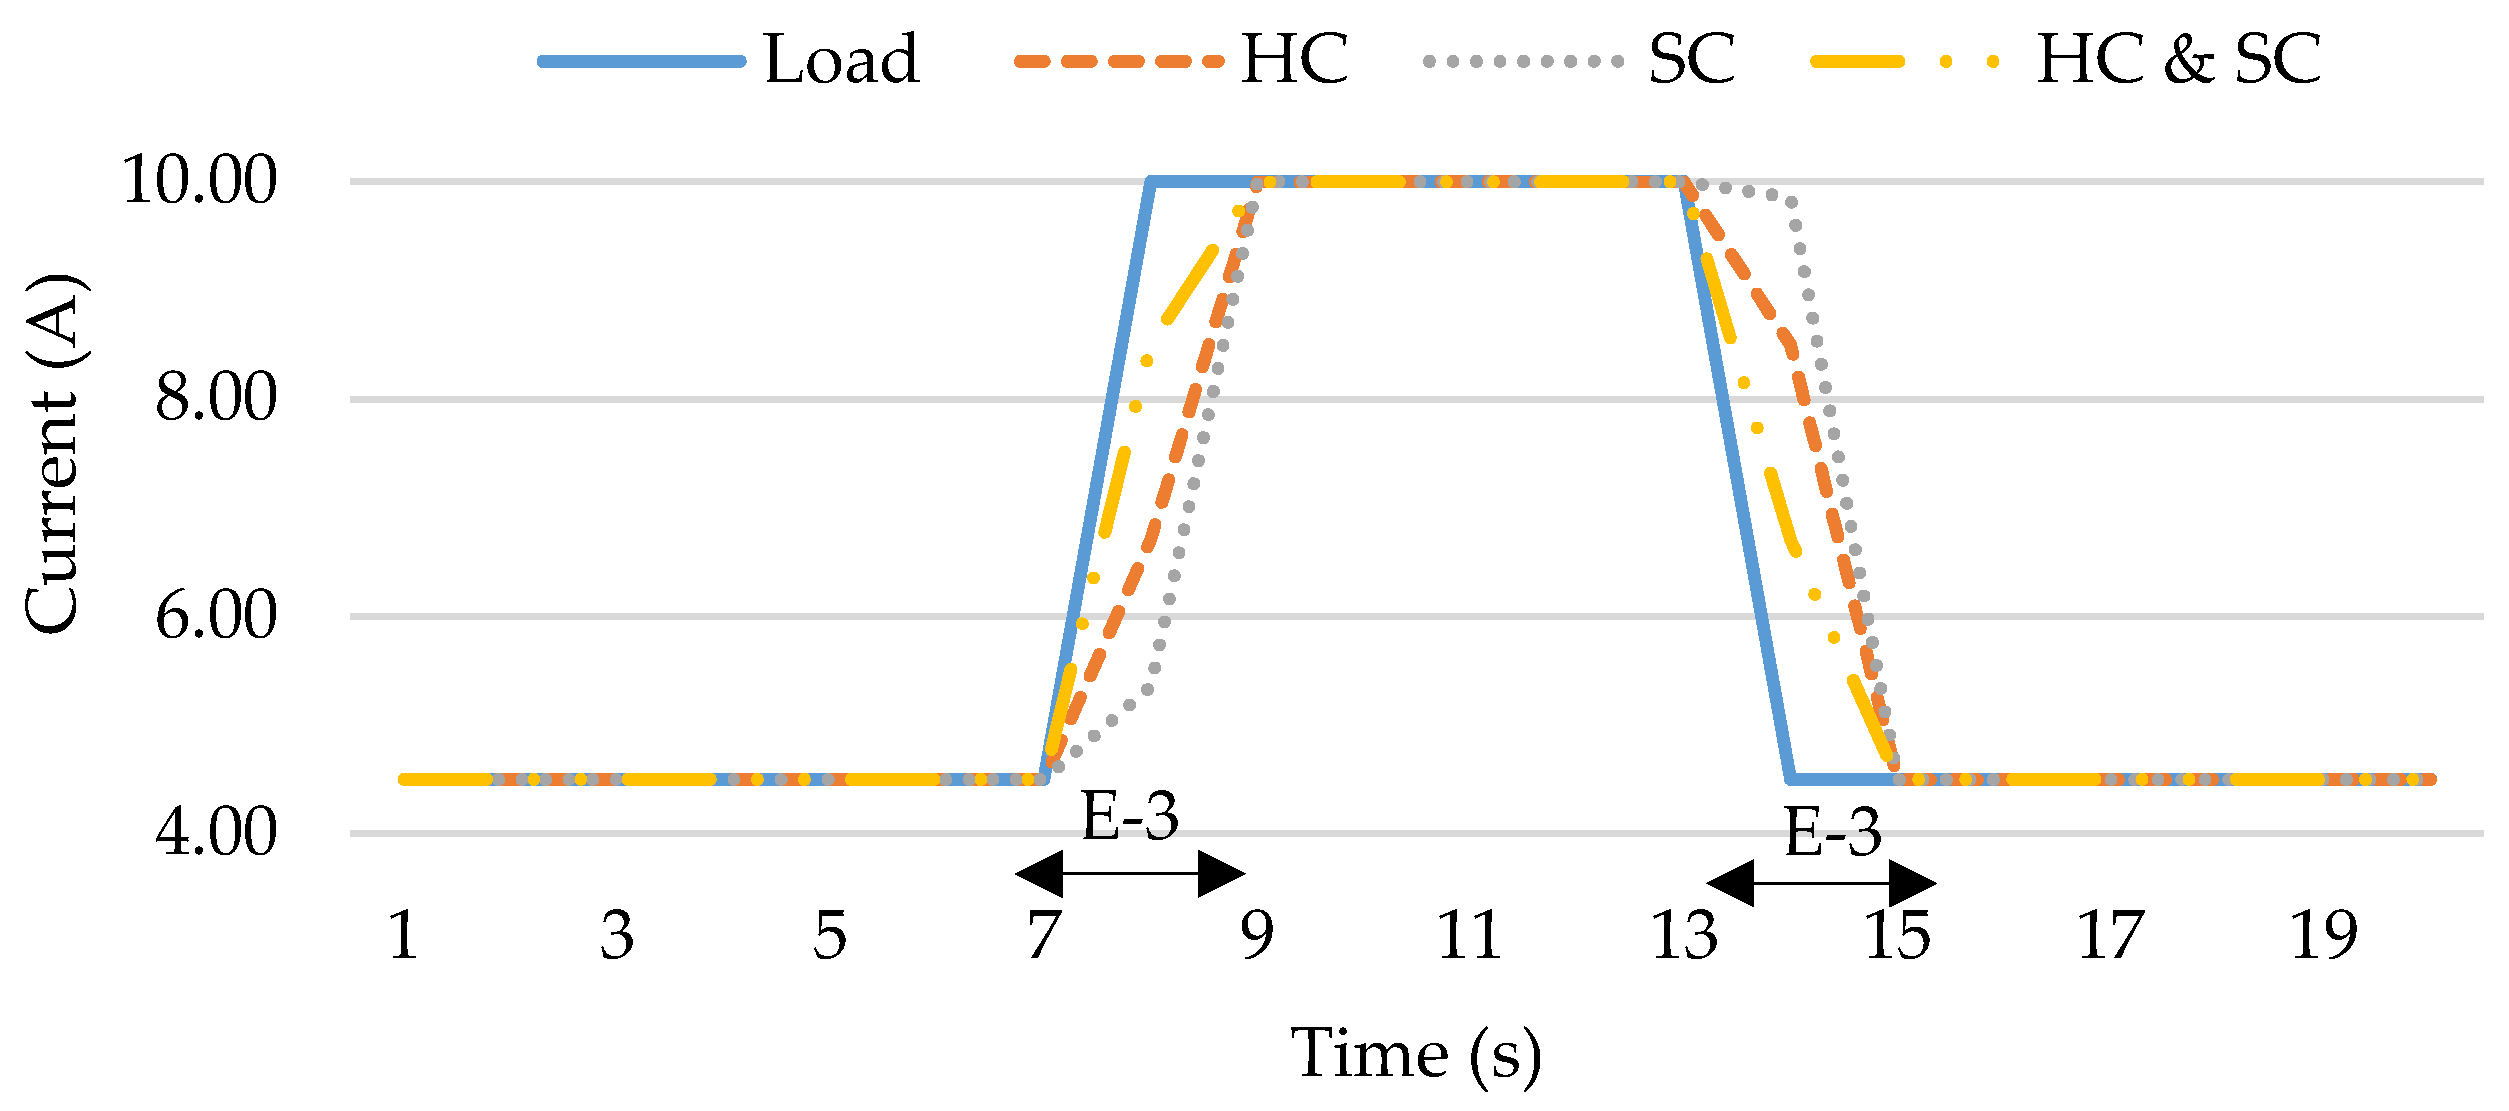
After the validation of the energy storages, HC and SC were further tested to see their transient response to steep changes in the load. The transient test was a constant load current of 4.5 A rising to a pulse of 10 A with a rise time of 1 µs, and the results are presented in Figure 9. For SC, when the load changed from a low current load of 4.5 A to 10 A, there was a lag of about one third of a second in which SC was supplying about 5.5 A before SC started to meet the load requirement of 10 A and when the load changed back to 4.5 A. This perceived lag was observed again where it was briefly supplying about 9.8 A to the load. One very notable point to observe is that the average voltage changed when the transient occurred is about 0.27 V, which is a drop from 12.75 V to 12.48 V, which is an indication of the low internal resistance and high power density of the SC bank. In the case of HC, when the transient occurred, it also lagged slightly for about a third of a second in which it was supplying 6.7 A to the load instead of the required 10 A. During the transient period, the voltage difference of 0.41 V was observed, which is a drop from 11.79 V to 11.38 V. At the end of the pulse when the load returned to 4.5 A, the SC bank lagged again for about one-third of a second, and in this time, it was supplying about 8.5 A to the load before reaching the 4.5-A load demand; thus, an indication of the higher internal resistance and, therefore, much less power capacity of the HC bank when compared to the SC bank.
A further test was carried out combining both HC and SC by connecting them directly in parallel. During the ramp from 4.5 A to 10 A, the current supplied by capacitors closely matched what was demanded by the load. This was a much better response than when each of the two capacitor banks supplied the load individually, although the lag time was almost the same. The capacitors were able to switch to 8.5 A during the lag with a voltage change of 0.20 V, and when the pulse was over, the capacitors supplied 6.69 A before beginning to supply the 4.5-A load demand. This is a verification of the reduced internal resistance of the capacitor banks when they are connected in parallel, thus offering higher power capacity when compared to the individual performances previously discussed. In Table 1, the internal resistance of the HC and SC banks are 3.3 mΩ and 1.74 mΩ, respectively, when they are connected in parallel, it is expected that the equivalent resistance becomes 1.14 mΩ; this will result in an even higher capacity than when the SC or HC banks were used separately, as observed in Figure 9. This is an indication that an effective way of using both SC and HC in the same energy storage system with many steep transients is to connect them directly in parallel, thus further supporting the topology being proposed in this research.
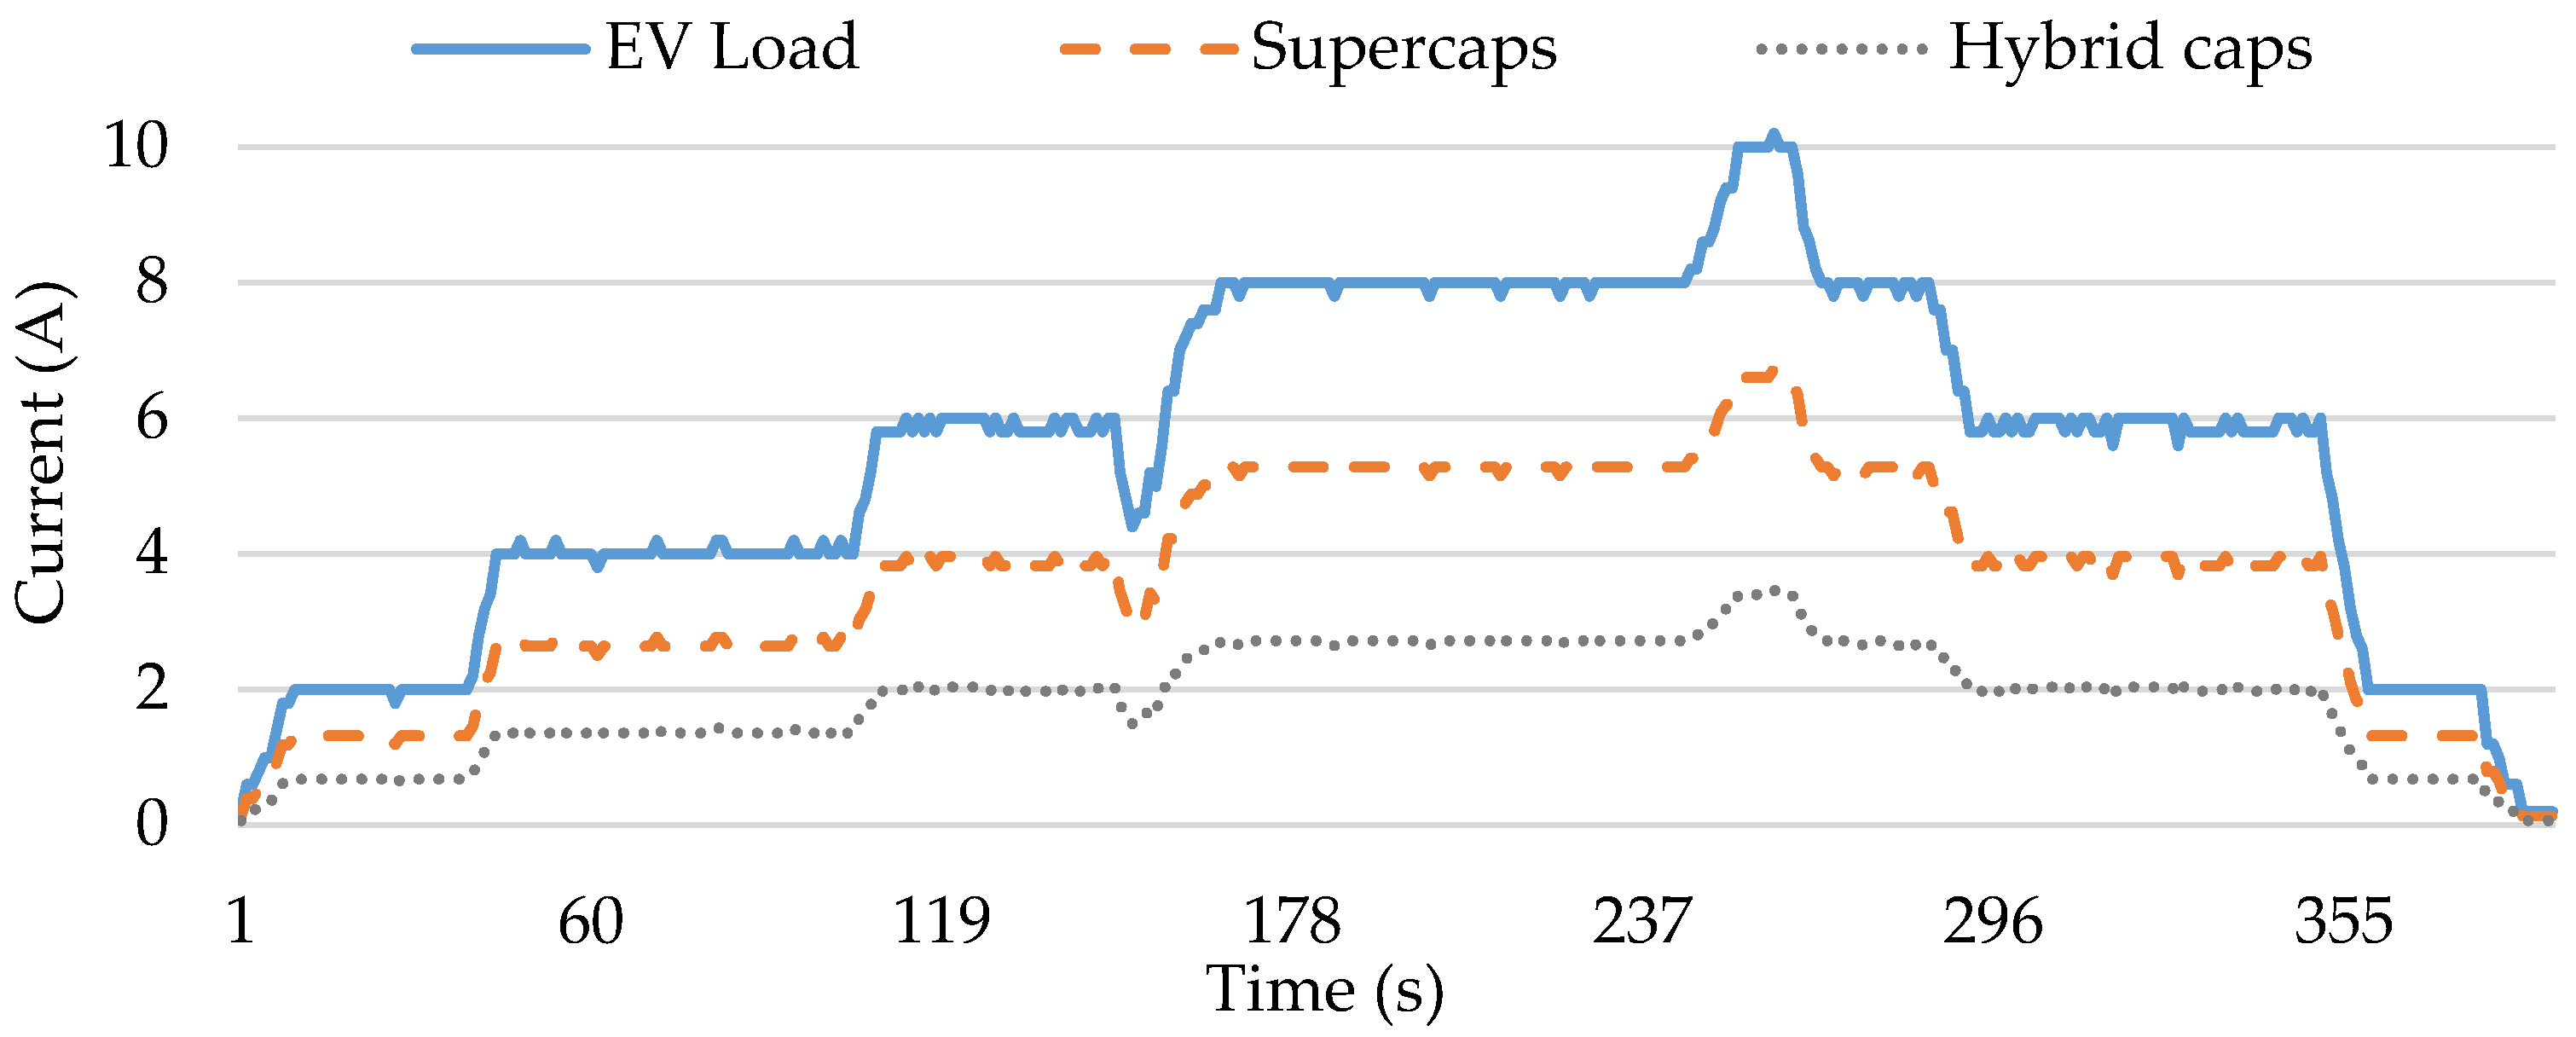
A final test was carried out on the energy storages to see the real response of SC and HC to a realistic electronic vehicle load profile. In this case, only SC and HC were involved, and they were connected directly in parallel; therefore, the voltage across them was equal. The B&K precision 8602 electronic load was used to model the electric vehicle, and the result is presented in Figure 10. The load profile used is a modified version of the load profile obtained in previous research by [33,37,45], and the modification was done to increase the load demand by a factor of two in order to match the energy storage control design. The load profile lasted for a total of 390 s and contained several driving schemes that were obtained in a real-life application of an electric vehicle driving cycle, from acceleration, constant speed, deceleration, and even repeated acceleration and deceleration action. In the result presented in Figure 10, it is observed throughout the load profile that SC delivered higher currents, while HC delivered lower currents to the load, and this means that their internal resistances were sufficient to divide the load currents effectively between them, allowing SCs to take the high power requirements.
It can be said summarily that, although each energy storage has its own unique merits, combining them effectively is very vital to achieving effective and efficient energy utilisation in terms of cost and performance. Specifically, in terms of performance, it is observed that in the response of both HCs and SCs to steep transients, the best results were obtained when both HCs and SCs were directly connected in parallel. Furthermore, when the electric vehicle load profile was applied, there was still an effective load sharing between the two capacitors without any controller; therefore, their internal resistances were sufficient to adequately distribute the load between them. All these point to the advantages of the hybridisation topology being proposed in this research.
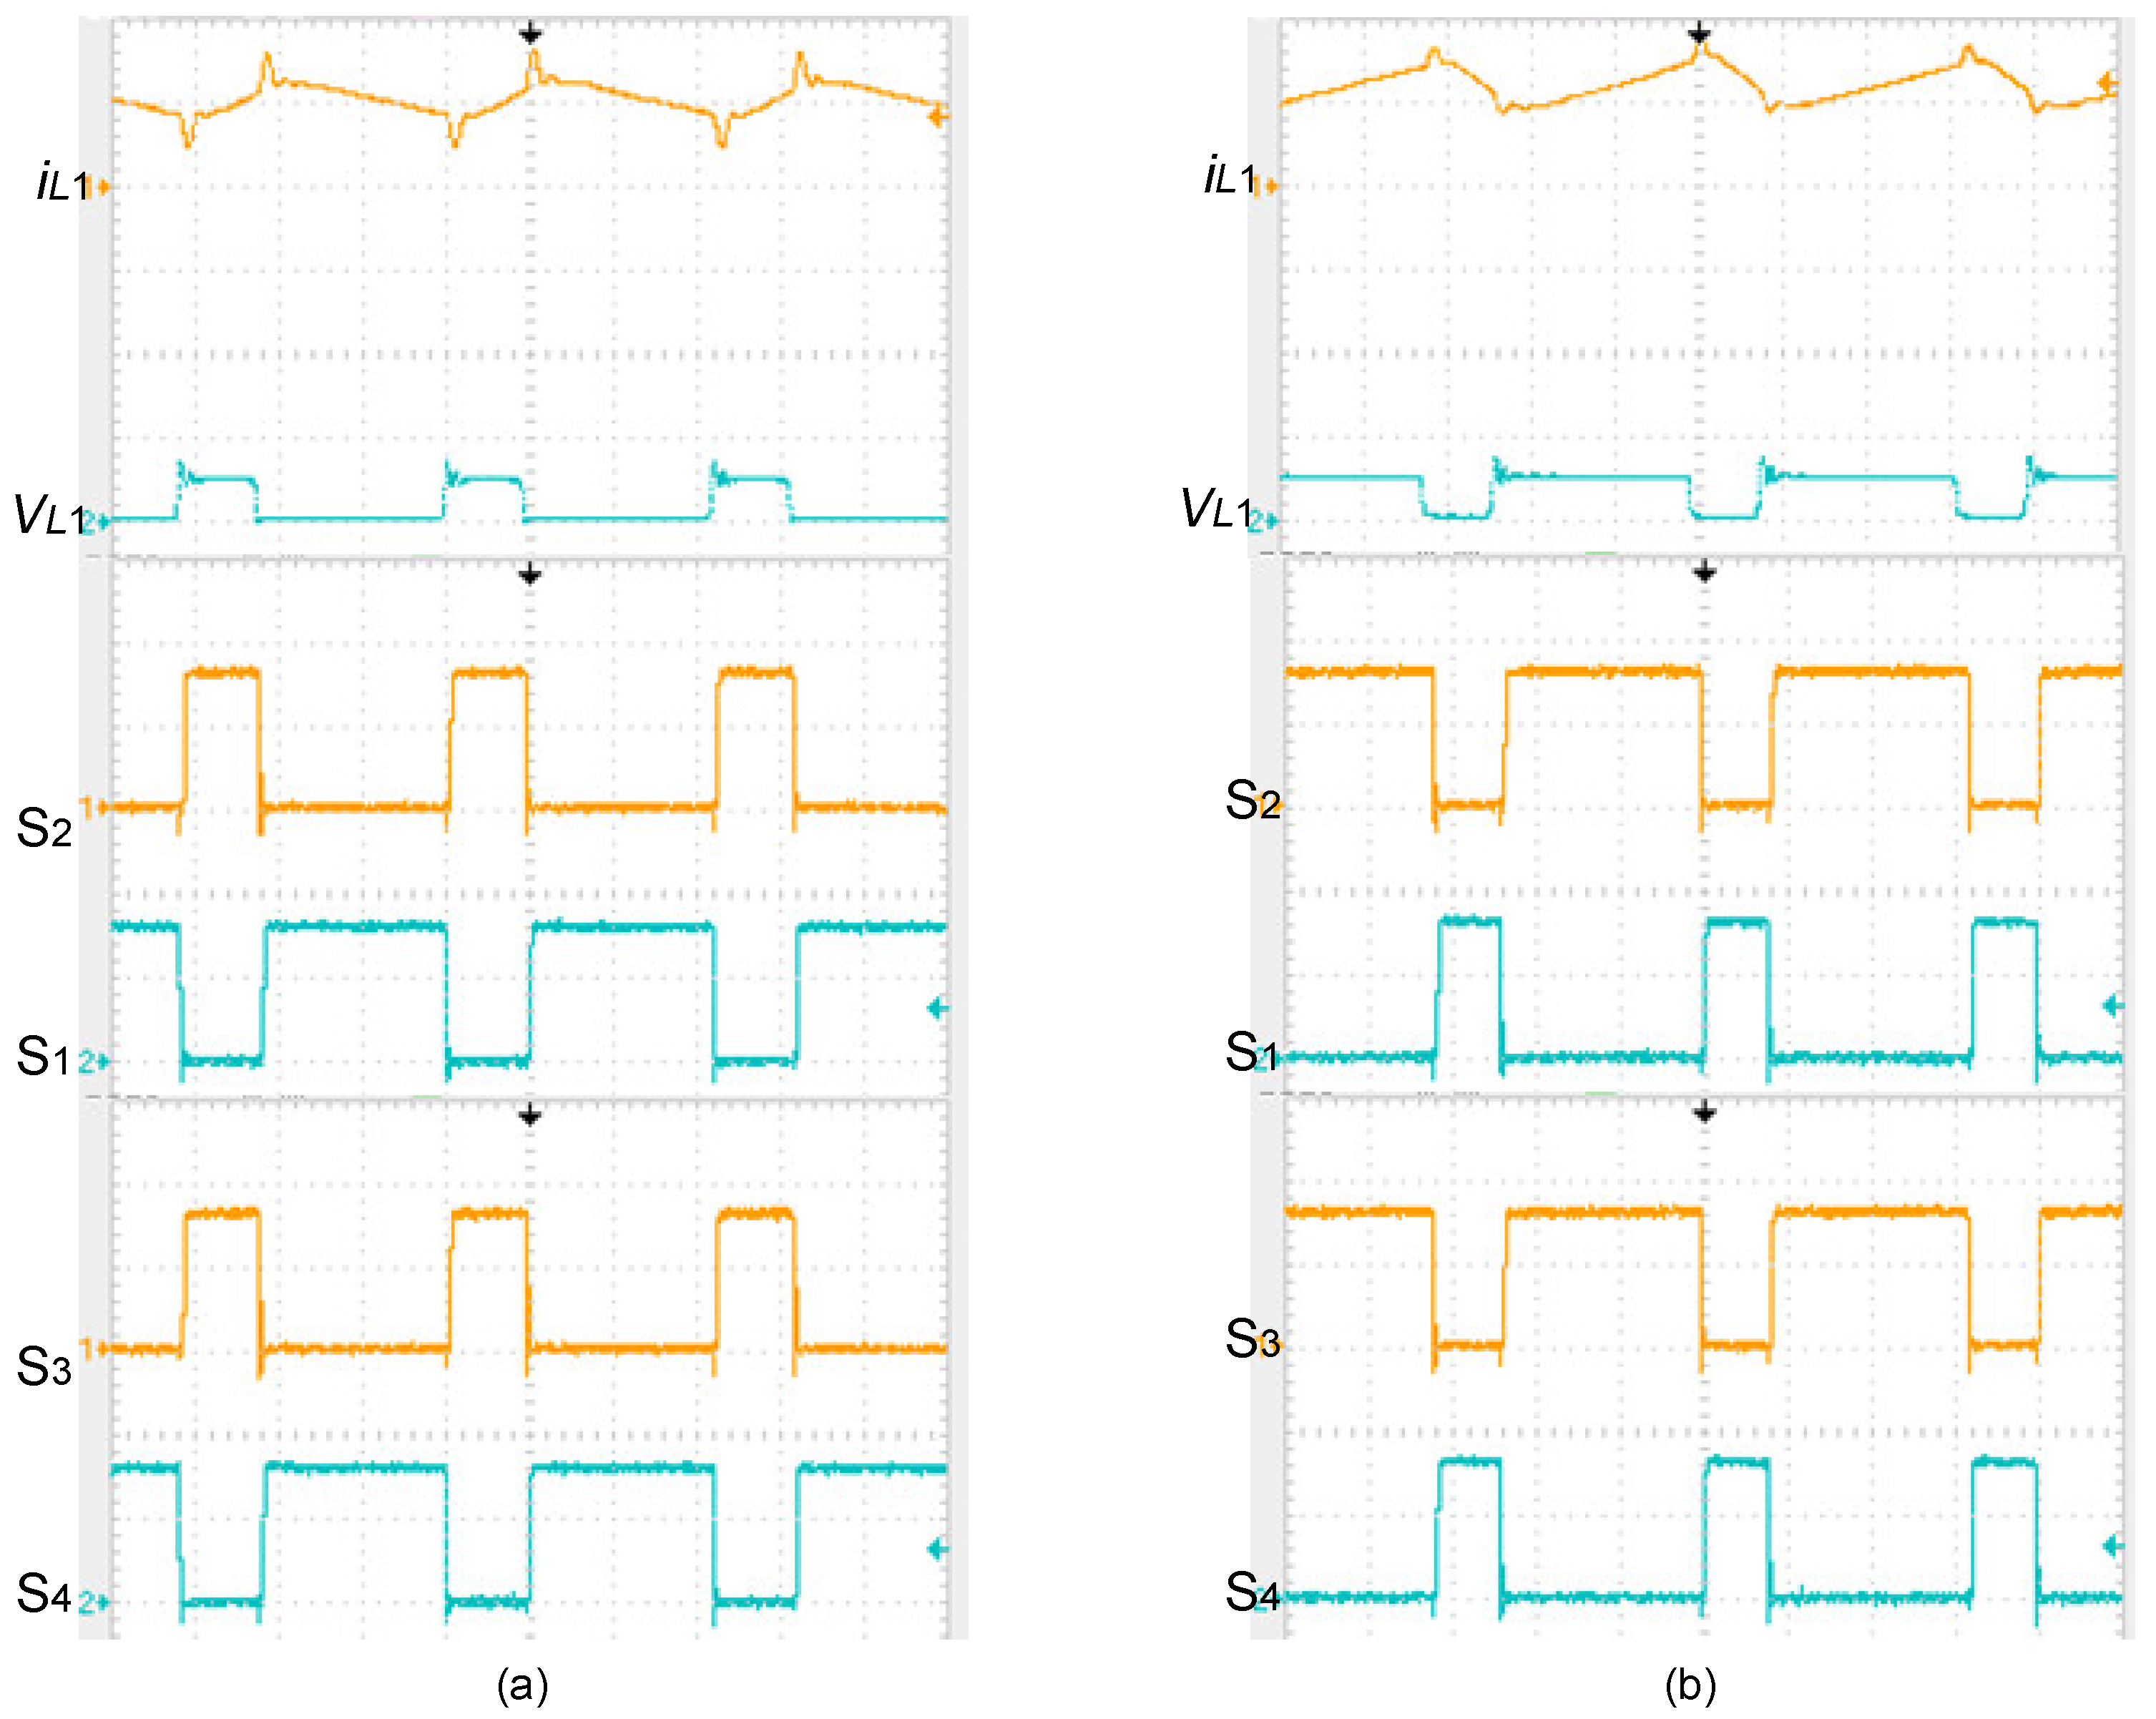
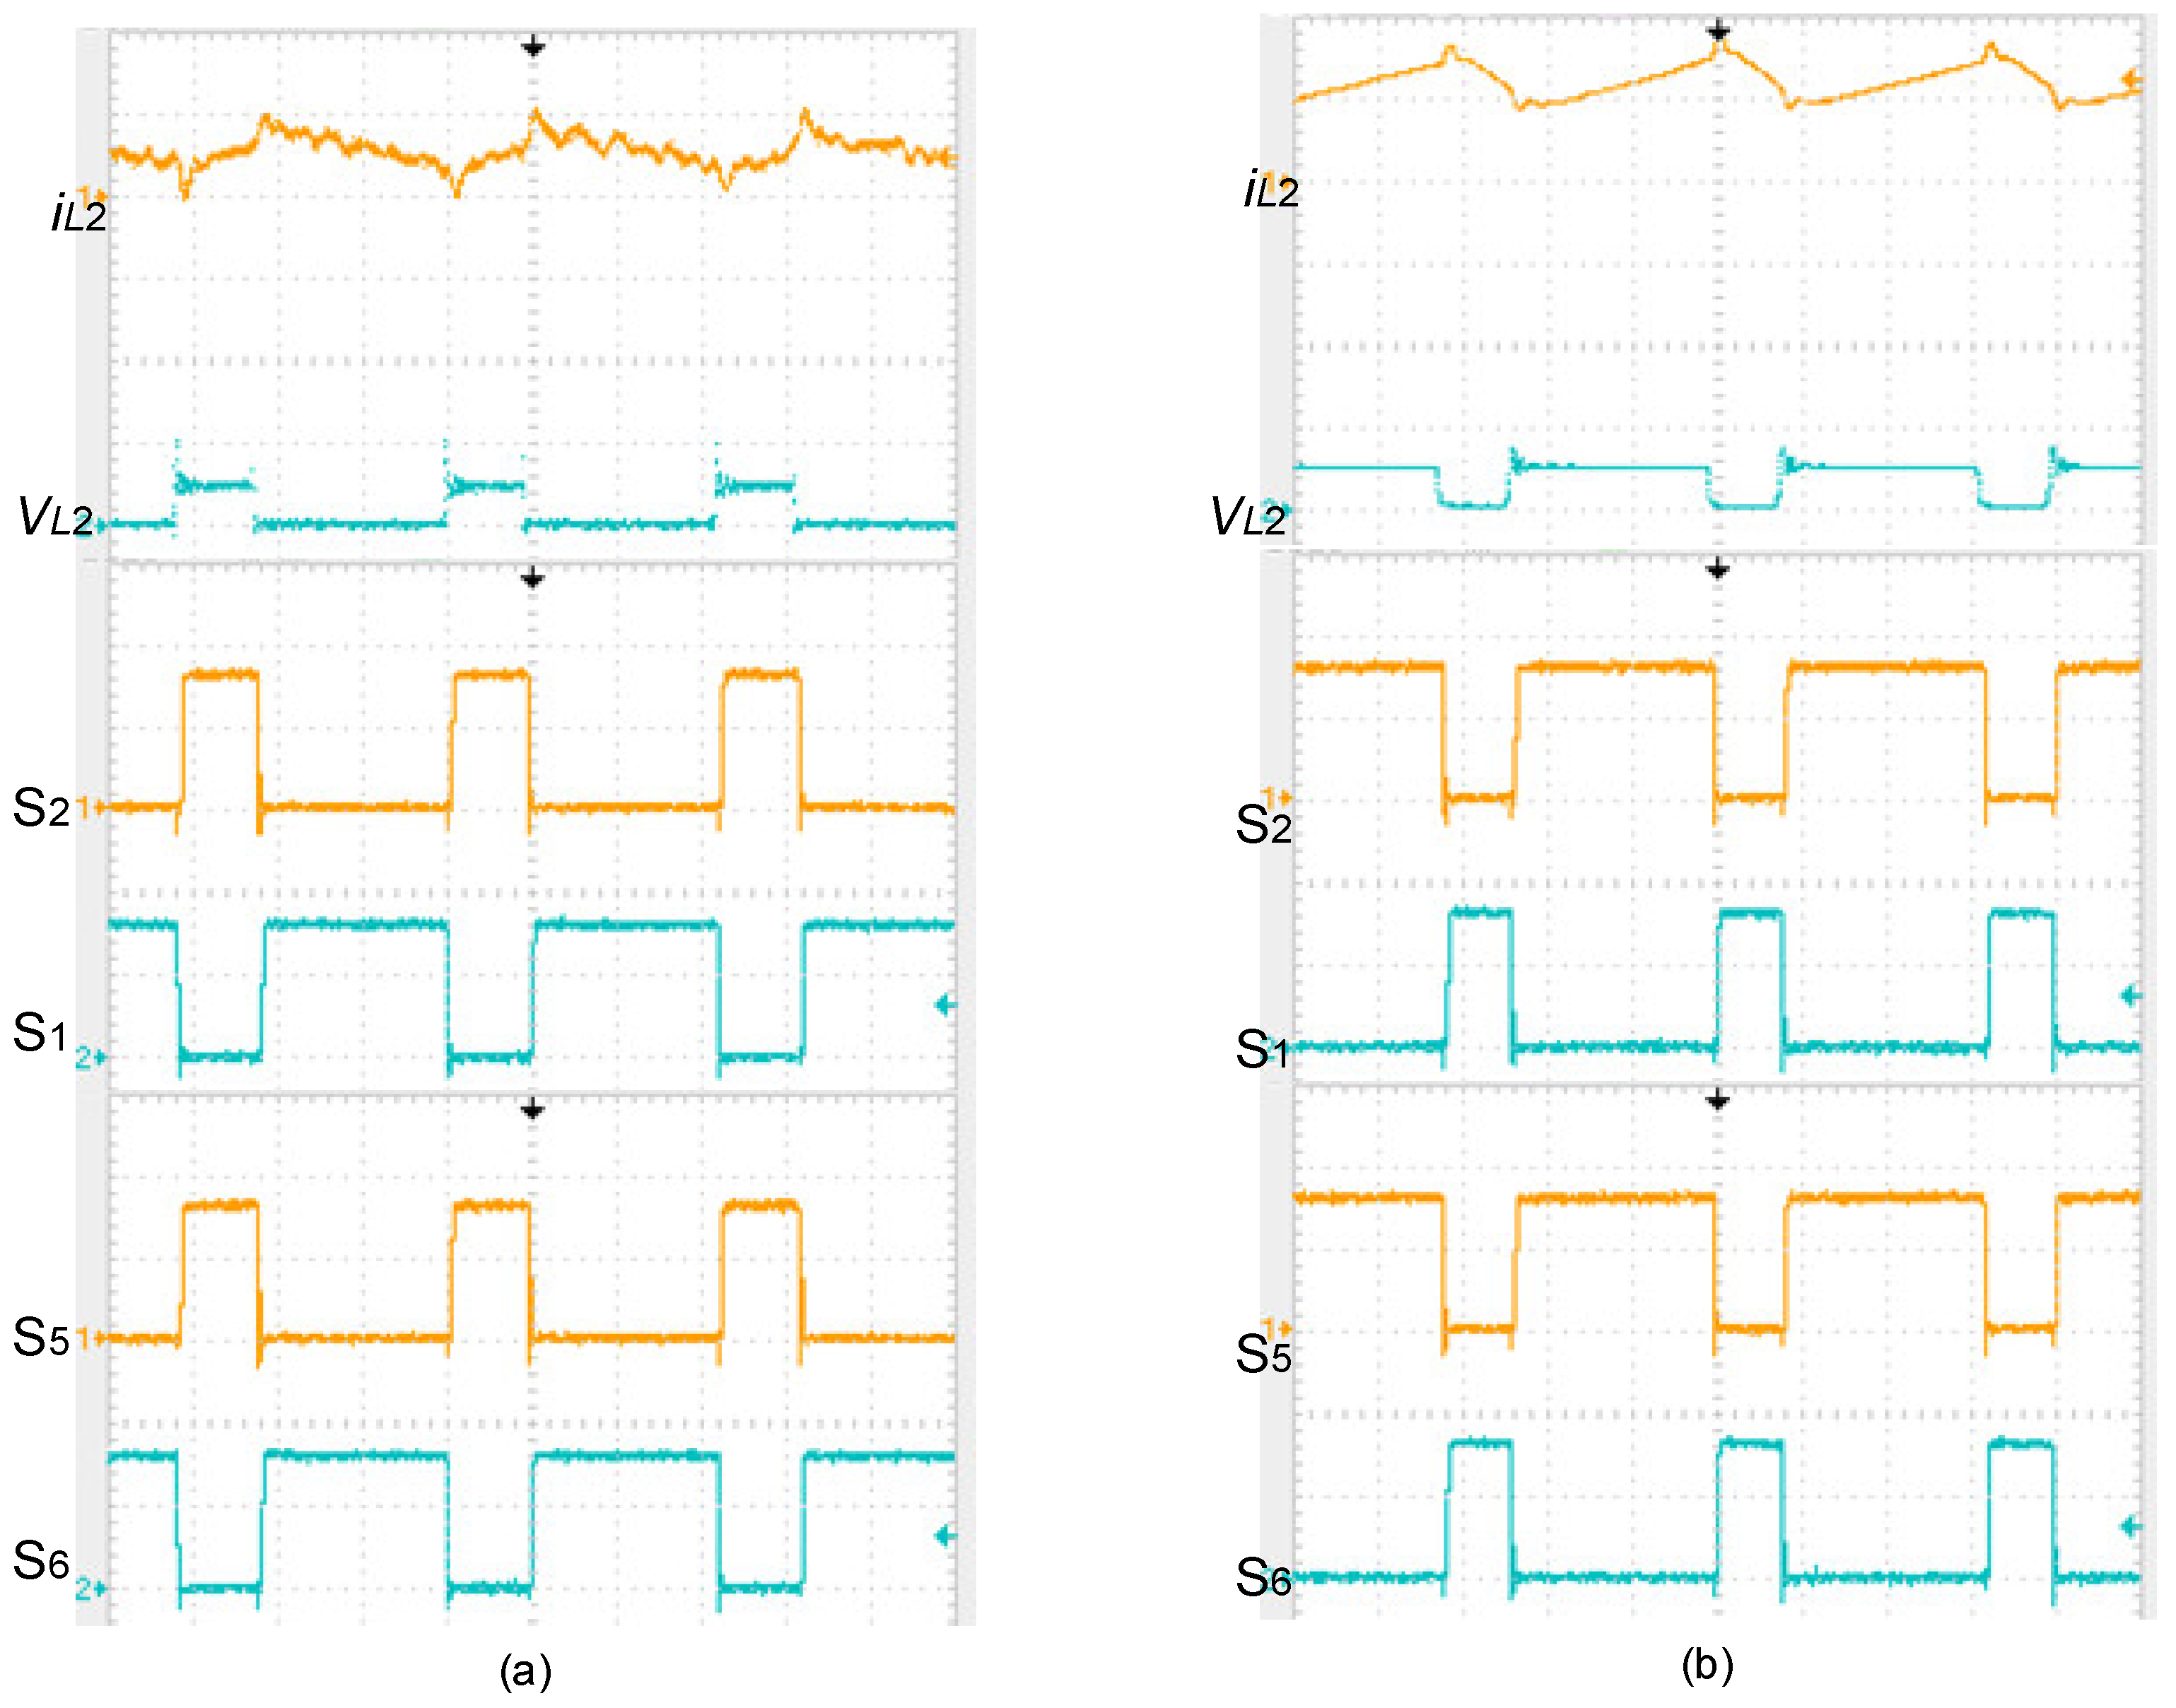
After having presented the results of the energy storage section of this research, the next thing is to look at the second major aspect, which is the multiple input converter system. A laboratory prototype of the two-input DC–DC converter, as presented in Figure 4b, with a capacity of 150 W, was built such that it could handle up to 12 A under 12 V. Although the converter was only operated in Modes A and B, the whole spectrum of the duty ratio from 15% to 90% in increments of 15% was covered in the test for each mode. At this point, the input of the DC–DC converter was supplied from a laboratory DC power supply such that the voltage could be regulated and kept constant throughout the test. Mode A was set at 5-V input, while Mode B was set at 10-V input. In Figure 11 and Figure 12, the scope results of the inductor current and inductor voltage are presented respectively for operating the multiple input converter in Modes A and B at a duty cycle of 30% and 75%, respectively. One common observation in both figures is that the inductor was operating in continuous conduction mode. Another observation is that the voltage of the inductor was reading zero when the inductor was discharging because the oscilloscope used did not have an isolated input; therefore, the reference ground was affecting the reading of the negative voltage. If an oscilloscope with ground isolation were to be used, the inductor voltages would reflect a negative voltage, reflecting the discharge of the inductor to the DC bus; however, this discharge was seen in the respective inductor currents when the inductor voltage was reading zero, and the inductor current was seen to be reducing, thus accurately reflecting the discharge of the energy stored in the inductor.
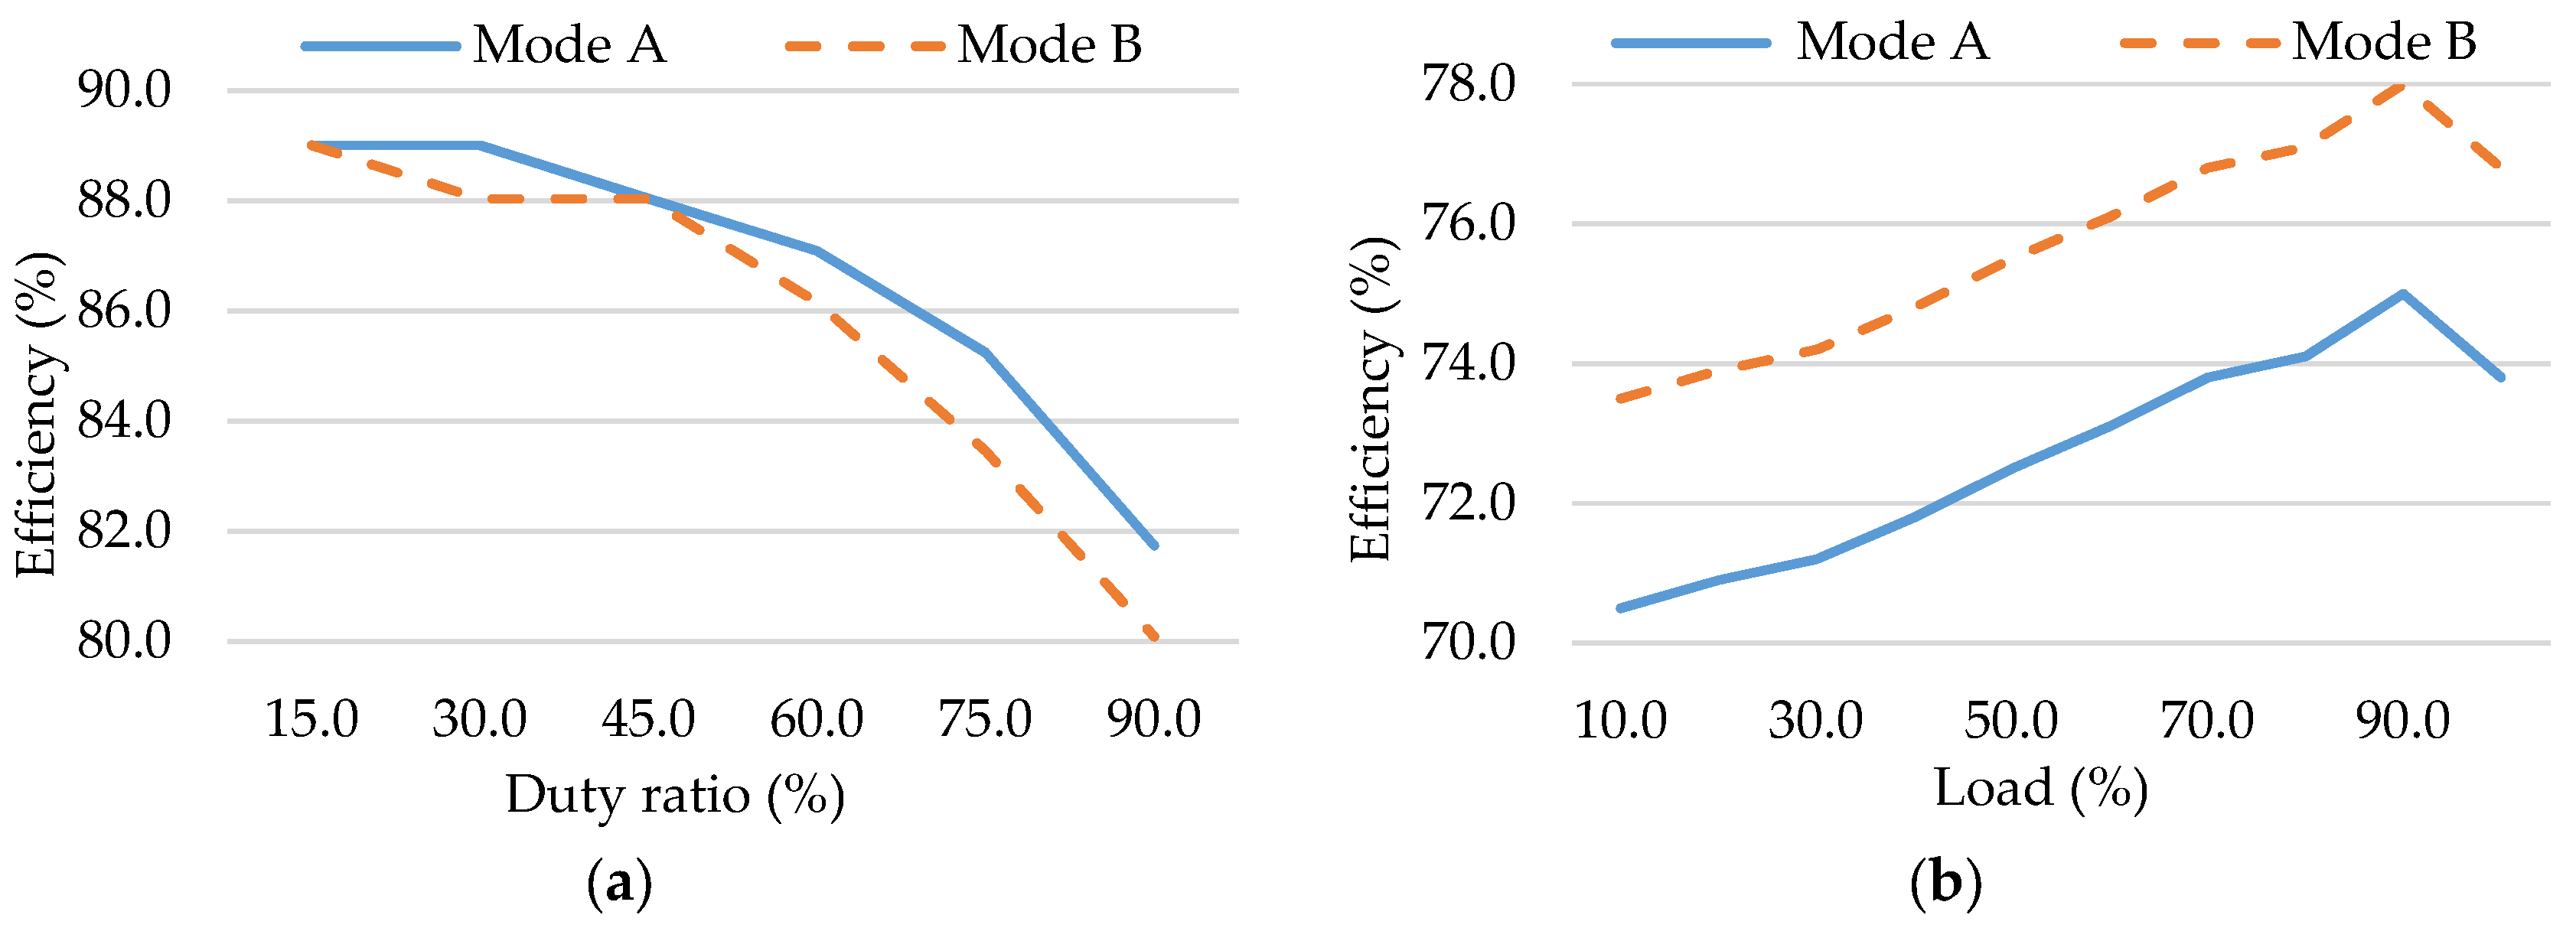
To test for the efficiency of the different inputs of the converter, two different tests were carried out: one was under a constant load current of 1 A, but varying duty cycles and, consequently, varying output voltages, and the second was at constant output voltage of 12 V, but varying load from 10% capacity loading to 100% load. Under the constant load current, the input power was compared to the output power under a constant load of 1 A, then the converter was made to operate over a duty cycle range of 15–90% in increments of 15%. The graph in Figure 13a present the efficiency results of each mode respectively for Modes A and B. As the duty cycle increased, the efficiency of the converter reduced; also, as the input voltage increased, the efficiency of the converter reduced. This shows that the converter was much more efficient for bucking than it was for boost mode operations; however, all of the efficiency values were above 75%.
Next was to test the efficiency of the converter under varying load conditions, and the results are presented in Figure 13b. Recall that the converter was designed for a maximum load of 12 A at 12-V output; therefore, the output voltage of the converter was kept constant at 12 V, and then, the electronic DC load was made to vary from 10% loading through to 100% in increments of 10%. This was done for Modes A and B, with the inputs of 5 and 10 V, respectively. It is seen in Figure 13b that the higher efficiencies were attained when the input voltage was the highest. Furthermore, when the load current increased, the efficiency also increased, but at 90% load, the highest efficiency was attained across all three modes of operation. This shows that in all modes of operation, the converter attained efficiency values higher than 70% and was most efficient at 90% loading. Therefore, the converter was most efficient when it was operated with a load current of about 10.8 A.
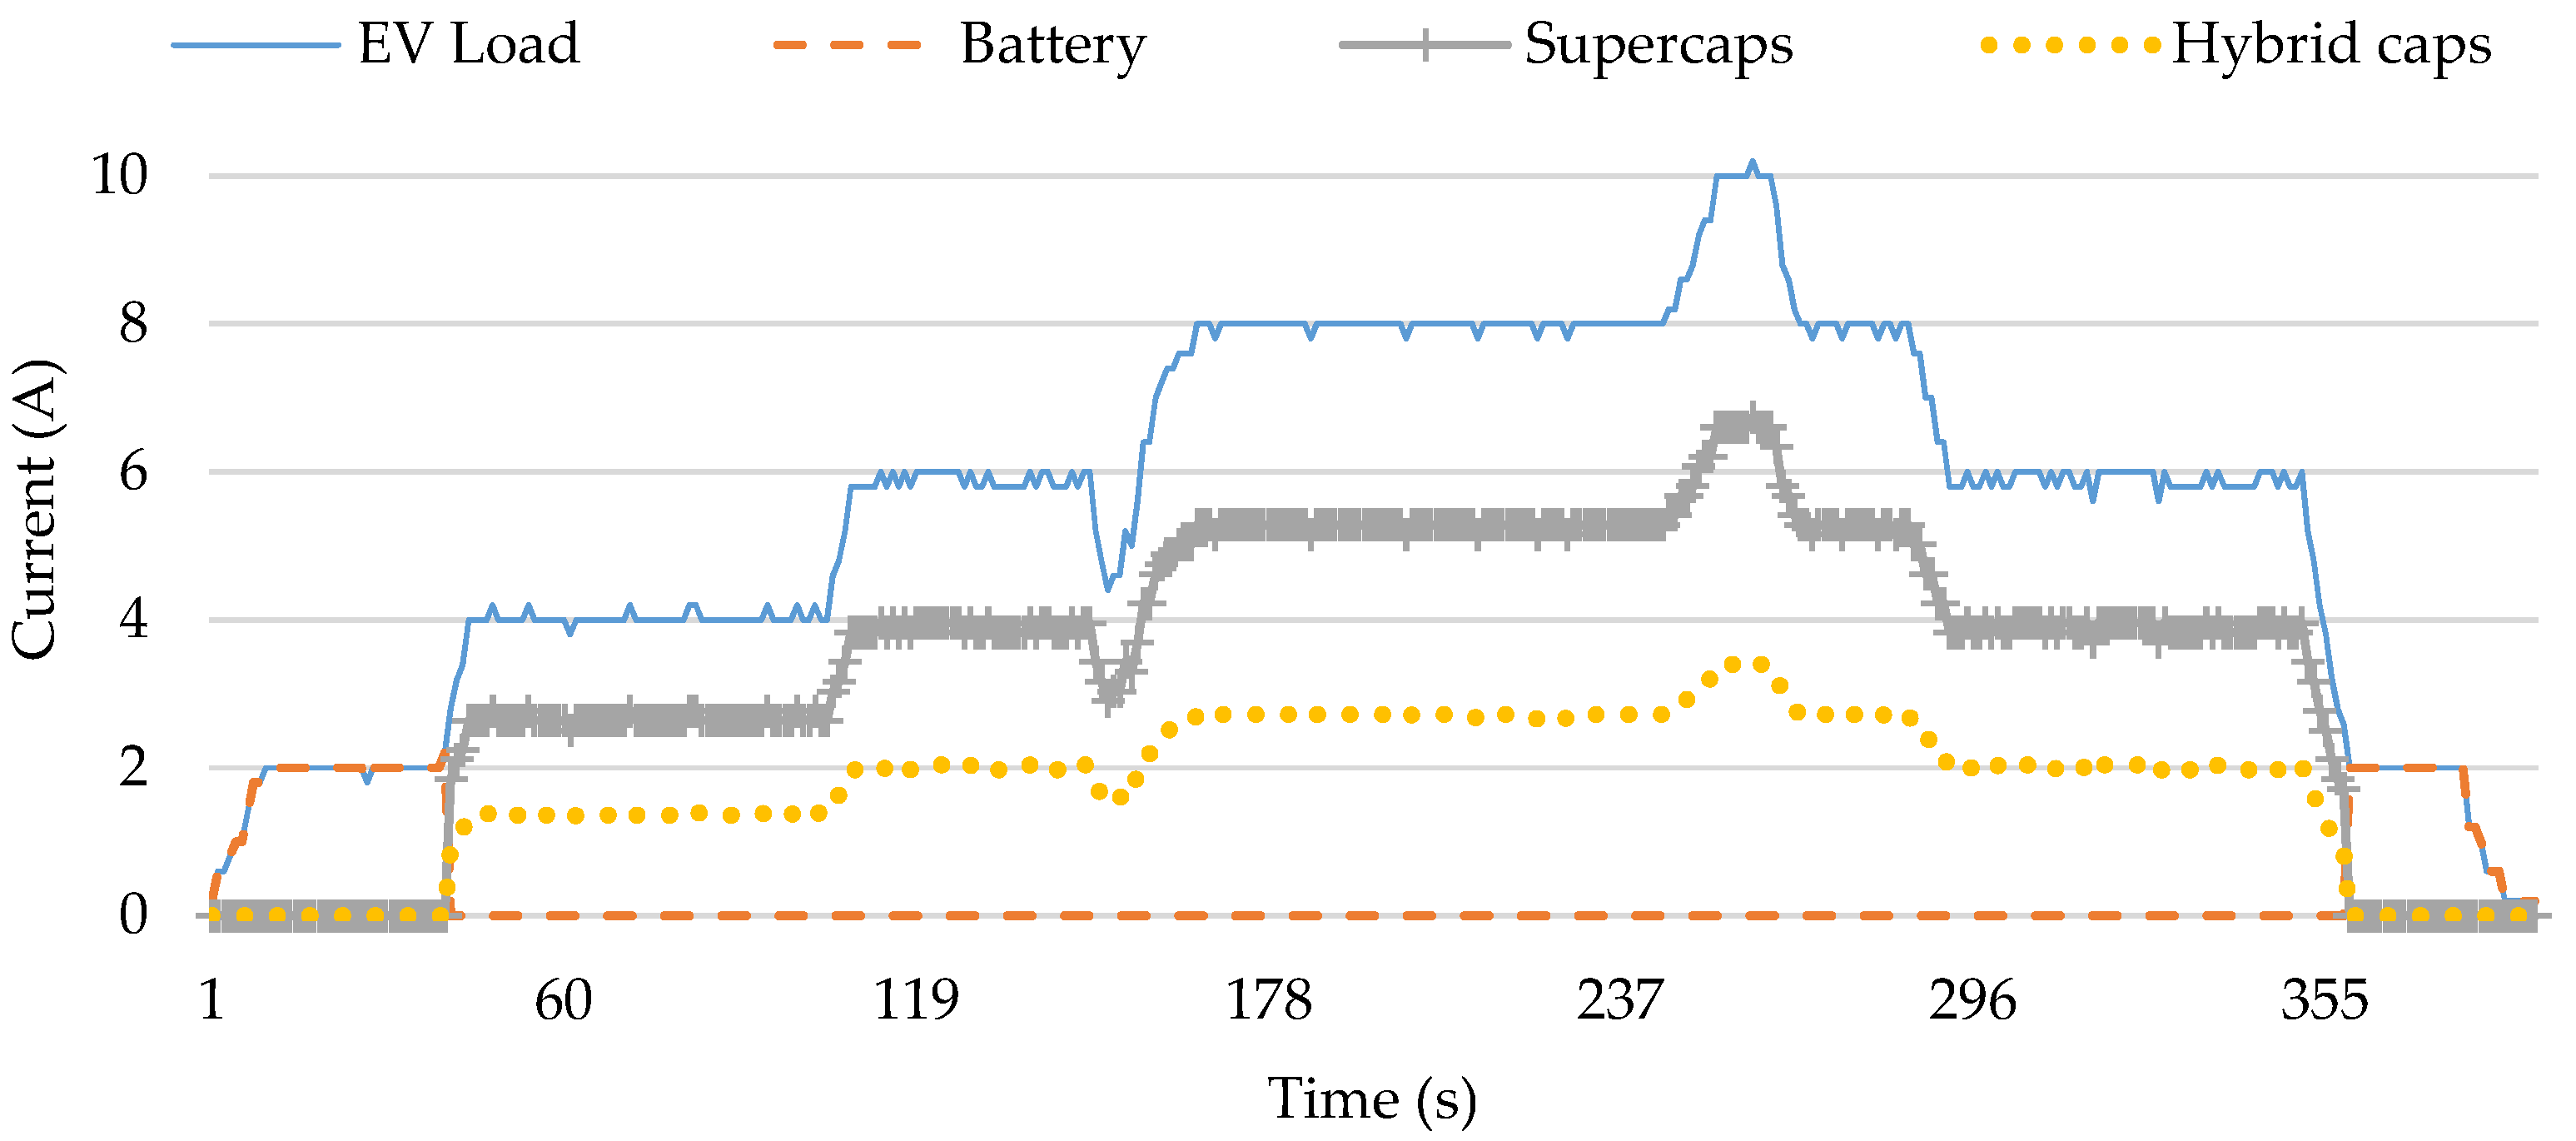
A test was carried out to see the response of the entire system to the realistic EV load profile as was used in the result presented in Figure 10. This EV profile has been used repeatedly in this research and was also validated in previous research [33,45]. The response of the hybridisation topology being proposed in this research to the electric vehicle profile used above is presented in Figure 14. In this topology, SC and HC were connected directly in parallel, and resultantly, the control became less complex. The battery supplied all load currents not exceeding 2 A, but instead of selectively choosing between SC and HC (which would have been more conventional), both of them were made to supply all load currents exceeding 2 A. This topology was able to supply the load adequately, and SC was seen to handle all of the higher currents when compared to HC. Using this proposed topology, the battery was less often required to supply energy to the electric vehicle, and so, its cycle life was preserved. Furthermore, since the battery was not used for the repeated acceleration and deceleration in the entire driving cycle, the temperature increments that would have arisen as a result were avoided; hence, the battery life was further preserved. Thirdly, now that the battery was not the sole energy storage in the energy storage system, it could be further downsized to best fit the required base load, thereby further reducing the weight and volume of space occupied by the energy storage system.
Lastly, having considered all of the nitty gritty of the energy storages and the multiple input converter, it is important to draw a big picture on why it is being proposed that SC and HC be connected directly in parallel instead of using the conventional hybridisation topology of each energy storage, having its own input port. Table 4 presents a comparison of resource use between the conventional hybridisation topology (with a three-input converter) and the proposed hybridisation topology (with a two-input converter). From Table 4, it is seen that the resource use of the proposed hybridisation topology was much less than in the conventional hybridisation topology. This can potentially transcend directly into reduced costs and weights, which are very huge factors that must be considered when looking into the adoption of the technology in the EV industry.
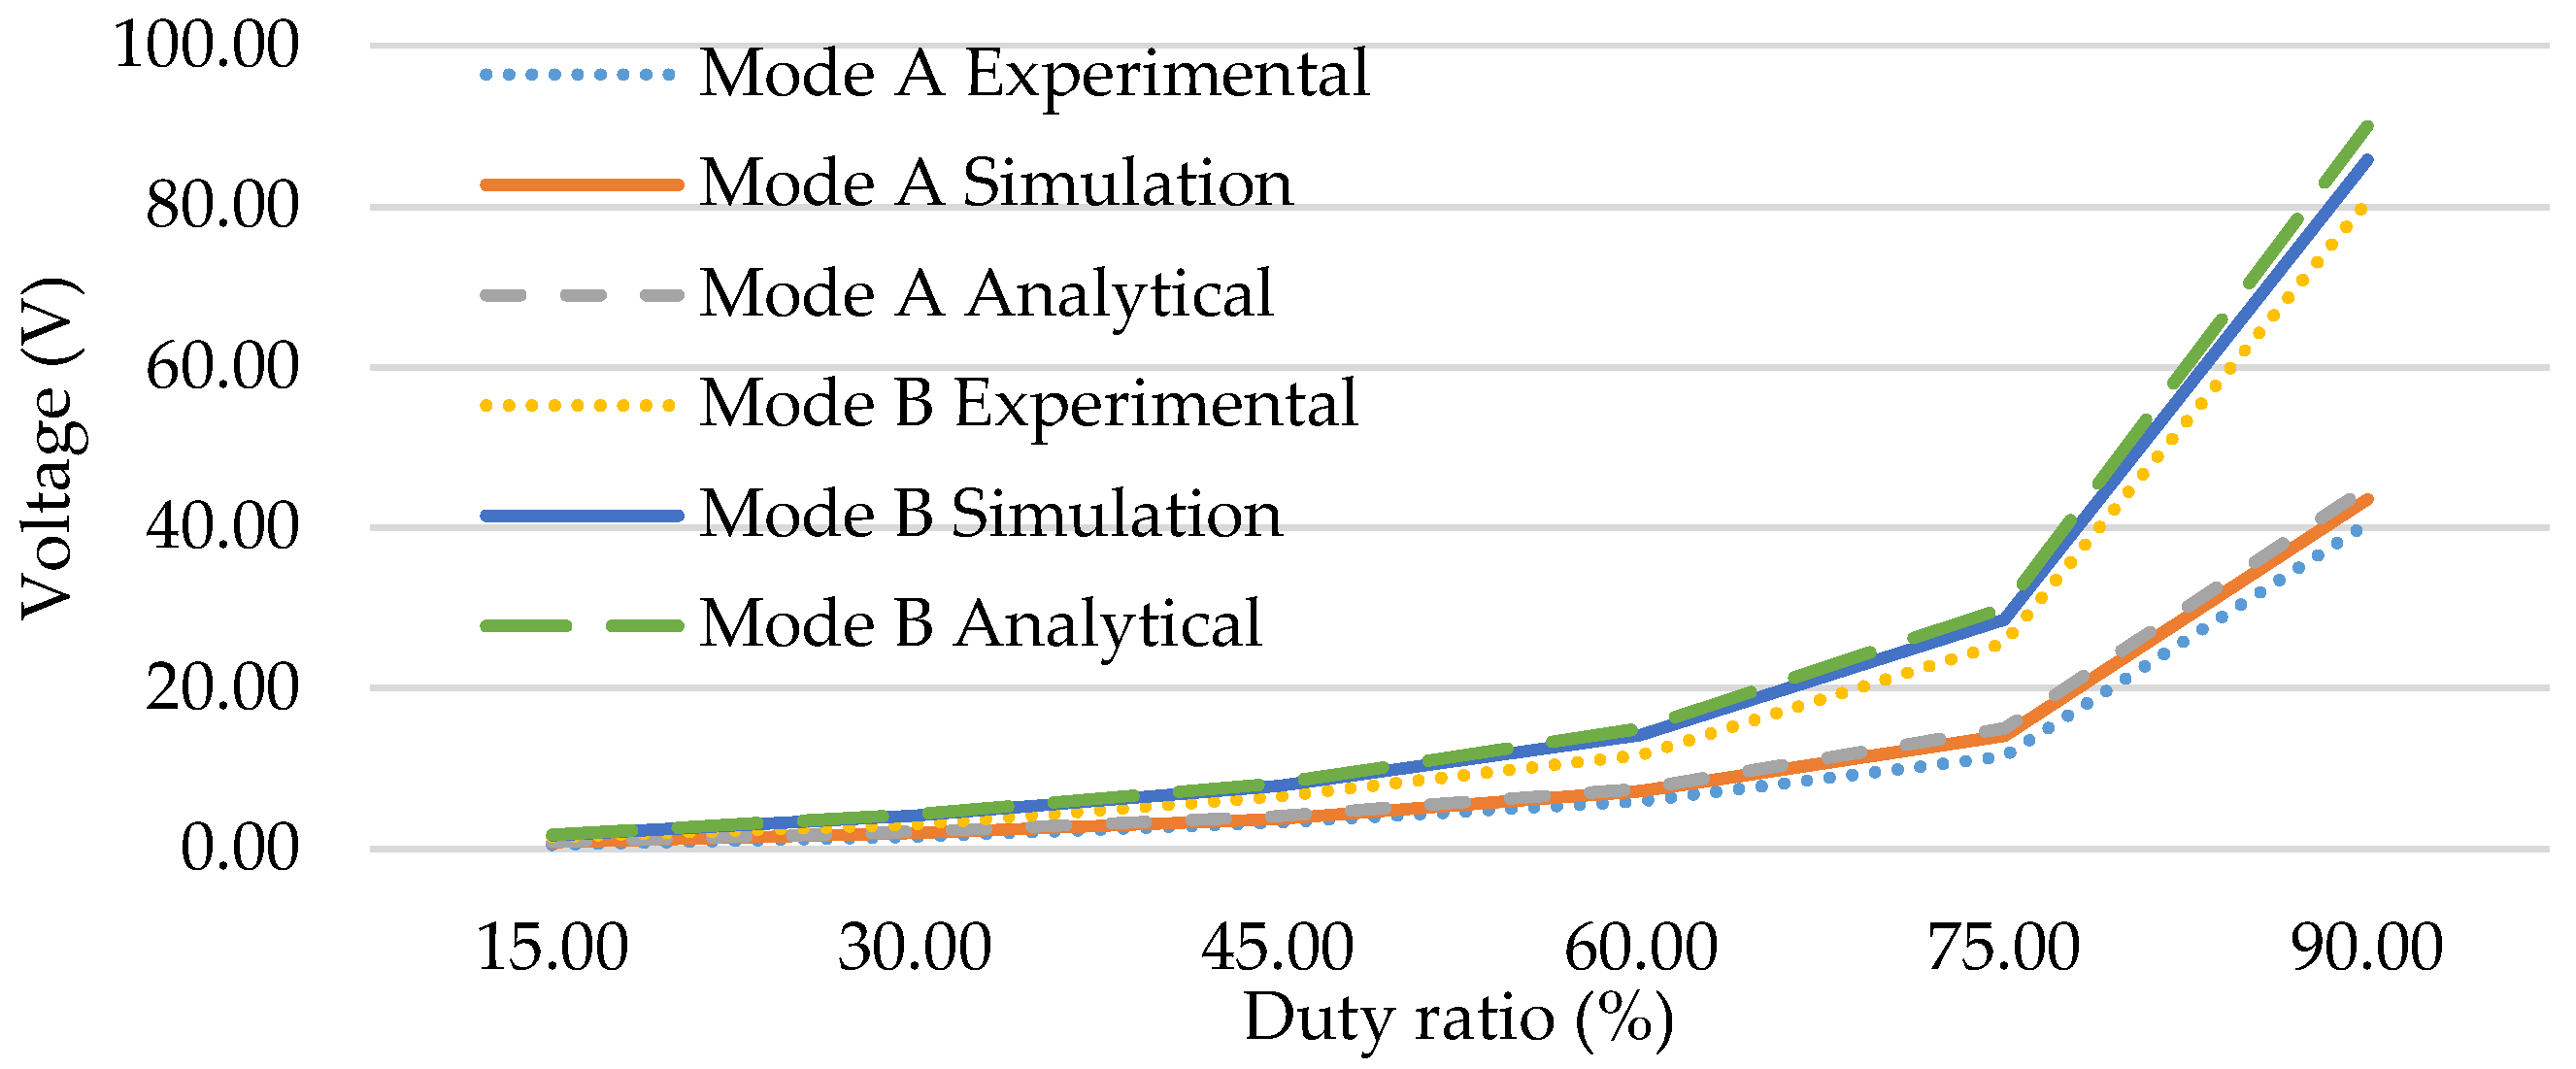
To verify and validate the experimental implementation of the converter, the experimental results were compared to the simulation results and also the mathematical analysis. The results of this verification and validation are presented in Figure 15 for Modes A and B. Furthermore, in Table 5, the percentage error of the experimental results when compared to the simulation and analytical calculations is presented. From these results, it is observed that the experimental results obtained very closely matched what was obtained in simulation, thus validating the design and implementation of the multiple input converter.
Furthermore, it is observed that as the input voltage increased from 5 V to 10 V, the difference between the experimental, simulation results and the analytical calculations also reduced. During the boost mode, which was at duty cycles above 50%, a higher difference between the analytical calculations, simulation results, and the experimental measurement was observed as the duty ratios increased. In all the modes of operation and throughout all the duty cycles, the difference between the experimentally-measured voltage and the analytically-calculated voltage was less than 17%. In all the cases, the experimentally-measured voltage was less than the values obtained from simulation and the analytical calculations. In the buck mode of operation, as the duty ratios increased, the percentage deviation of the experimental results from the simulation and analytical calculations reduced; however, this condition is opposite for the boost mode of operation.
These results are within acceptable limits and were also observed in previous research by [46] in their research. Furthermore, comparing the efficiency results presented in Figure 13, it is seen to be congruent with the results reported by [41,46] in the literature, thus validating the experimental system implemented.

4. Conclusions

In this paper, three energy storage devices have been considered for hybridisation, a battery, an SC and an HC bank. Different possible combinations of these energy storage devices were analysed for both the performance and cost implications. It was deduced from the results of the analysis that the most effective use of energy would be obtained from an efficient combination of the three energy storages. This efficient combination was facilitated using a multiple input DC–DC converter. The effect of allowing trickle charging to take place in the charging of SCs and HCs was highlighted, as it has been unduly overlooked in previous research.
In this research, it was proposed that the SC and HC banks be connected directly in parallel and hybridised with the battery pack through a DC–DC converter such that only a two-input converter is needed. This was instead of each energy storage having its own input port, which would result in the need for a three-input converter. The two- and three-input converter topologies were compared, and from the results obtained, the two-input converter was not only sufficient for the effective hybridisation of the three energy storage devices considered, but also amounted to less resource use and consequently cost savings. In the implementation of the multiple input converter, the efficiency of the converter was tested at different duty cycles and different load conditions, as well. The efficiency values in all cases were above 70%, which is within acceptable limits. In the hybridisation topology proposed in this research, a specific power of 13.53 kW/kg was attained, which is much higher than the 7.83 or 7.69 kW/kg that would have been obtained in a battery-SC or a battery–HC hybrid energy storage system.
In conclusion, the results obtained in this experimental implementation prove categorically that:
  • An effective combination of SC, battery, and HC through the use of a multiple input DC-DC converter is the most efficient hybridisation topology.
  • The combination of HC and SC in one energy storage system does not need to come with an increase in the input ports of the DC-DC converter. Since the energy can be utilised effectively from both of them while they are connected directly in parallel, there is no need for an increase in the resource requirement.

Author Contributions

Conceptualization and writing, original draft preparation, I.J. Writing, review and editing, and supervision, N.G. and R.G.

Funding

This material is based on research/work supported wholly/in part by the National Research Foundation (NRF) of South Africa (Grant Numbers: 112236). The research findings are those of the authors and not of the NRF.

Conflicts of Interest

The authors declare no conflict of interest.

References

  1. Whittingham, M.S. History, evolution, and future status of energy storage. Proc. IEEE 2012, 100, 1518–1534. [Google Scholar] [CrossRef]
  2. Nehrir, M.H.; Wang, C.; Strunz, K.; Aki, H.; Ramakumar, R.; Bing, J.; Miao, Z.; Salameh, Z. A review of hybrid renewable/alternative energy systems for electric power generation: Configurations, control, and applications. IEEE Trans. Sustain. Energy 2011, 2, 392–403. [Google Scholar] [CrossRef]
  3. Khaligh, A.; Li, Z. Battery, ultracapacitor, fuel cell, and hybrid energy storage systems for electric, hybrid electric, fuel cell, and plug-in hybrid electric vehicles: State of the art. IEEE Trans. Veh. Technol. 2010, 59, 2806–2814. [Google Scholar] [CrossRef]
  4. Ju, F.; Zhang, Q.; Deng, W.; Li, J. Review of structures and control of battery-supercapacitor hybrid energy storage system for electric vehicles. In Proceedings of the 2014 IEEE International Conference on Automation Science and Engineering (CASE), Taipei, Taiwan, 18–22 August 2014; pp. 143–148. [Google Scholar]
  5. Etxeberria, A.; Vechiu, I.; Camblong, H.; Vinassa, J.M.; Camblong, H. Hybrid energy storage systems for renewable energy sources integration in microgrids: A review. In Proceedings of the 2010 Conference Proceedings IPEC, Singapore, 27–29 October 2010; pp. 532–537. [Google Scholar]
  6. Lai, J.; Levy, S.; Rose, M.F. High energy density double-layer capacitors for energy storage applications. IEEE Aerosp. Electron. Syst. Mag. 1992, 7, 14–19. [Google Scholar] [CrossRef]
  7. Sharma, P.; Bhatti, T.S. A review on electrochemical double-layer capacitors. Energy Convers. Manag. 2010, 51, 2901–2912. [Google Scholar] [CrossRef]
  8. Aravindan, V.; Gnanaraj, J.; Lee, Y.S.; Madhavi, S. Insertion-type electrodes for nonaqueous Li-ion capacitors. Chem. Rev. 2014, 114, 11619–11635. [Google Scholar] [CrossRef] [PubMed]
  9. Le Comte, A.; Reynier, Y.; Vincens, C.; Leys, C.; Azaïs, P. First prototypes of hybrid potassium-ion capacitor (KIC): An innovative, cost-effective energy storage technology for transportation applications. J. Power Sources 2017, 363, 34–43. [Google Scholar] [CrossRef]
  10. Jiya, I.N.; Gurusinghe, N.; Gouws, R. Electrical circuit modelling of double layer capacitors for power electronics and energy storage applications: A review. Electronics 2018, 7, 268. [Google Scholar] [CrossRef]
  11. Chemali, E.; Preindl, M.; Malysz, P.; Emadi, A. Electrochemical and electrostatic energy storage and management systems for electric drive vehicles: State-of-the-art review and future trends. IEEE J. Emerg. Sel. Top. Power Electron. 2016, 4, 1117–1134. [Google Scholar] [CrossRef]
  12. Ostadi, A.; Kazerani, M.; Chen, S.-K. Hybrid energy storage system (HESS) in vehicular applications: A review on interfacing battery and ultra-capacitor units. In Proceedings of the 2013 IEEE Transportation Electrification Conference and Expo (ITEC), Detroit, MI, USA, 16–19 June 2013; pp. 1–7. [Google Scholar]
  13. Liu, J.; Dong, Z.; Jin, T.; Liu, L. Recent advance of hybrid energy storage systems for electrified vehicles. In Proceedings of the 2018 14th IEEE/ASME International Conference on Mechatronic and Embedded Systems and Applications (MESA), Oulu, Finland, 2–4 July 2018; pp. 1–2. [Google Scholar]
  14. Amjadi, Z.; Williamson, S.S. Review of alternate energy storage systems for hybrid electric vehicles. In Proceedings of the 2009 IEEE Electrical Power & Energy Conference (EPEC), Montreal, QC, Canada, 22–23 October 2009; pp. 1–7. [Google Scholar]
  15. Cao, J.; Emadi, A. A new battery/ultracapacitor hybrid energy storage system for electric, hybrid, and plug-in hybrid electric vehicles. IEEE Trans. Power Electron. 2012, 27, 122–132. [Google Scholar]
  16. Neenu, M.; Muthukumaran, S. A battery with ultracapacitor hybrid energy storage system in electric vehicles. In Proceedings of the 2012 International Conference on Advances in Engineering, Science and Management (ICAESM), Nagapattinam, India, 30–31 March 2012; pp. 731–735. [Google Scholar]
  17. Khan, M.A.; Zeb, K.; Sathishkumar, P.; Ali, M.U.; Uddin, W.; Hussain, S.; Ishfaq, M.; Khan, I.; Cho, H.G.; Kim, H.J. A novel supercapacitor/lithium-ion hybrid energy system with a fuzzy logic-controlled fast charging and intelligent energy management system. Electronics (Switzerland) 2018, 7, 63. [Google Scholar] [CrossRef]
  18. Kagiri, C.; Xia, X. Optimal control of a hybrid battery/supercapacitor storage for neighborhood electric vehicles. Energy Procedia 2017, 105, 2145–2150. [Google Scholar] [CrossRef]
  19. Wang, X.; Yu, D.; le Blond, S.; Zhao, Z.; Wilson, P. A novel controller of a battery-supercapacitor hybrid energy storage system for domestic applications. Energy Build. 2017, 141, 167–174. [Google Scholar] [CrossRef] [Green Version]
  20. Huang, S.; Member, S.; Pai, F.; Huang, B. A matching design for ultracapacitor and Li-ion battery cooperation in electric wheel motors. In Proceedings of the SICE Annual Conference 2010, Taipei, Taiwan, 18–21 August 2010; pp. 2646–2649. [Google Scholar]
  21. Kouchachvili, L.; Yaïci, W.; Entchev, E. Hybrid battery/supercapacitor energy storage system for the electric vehicles. J. Power Sources 2018, 374, 237–248. [Google Scholar] [CrossRef]
  22. Yin, H.; Zhao, C.; Li, M.; Ma, C. Optimization based energy control for battery/super-capacitor hybrid energy storage systems. In Proceedings of the IECON 2013—39th Annual Conference of the IEEE Industrial Electronics Society, Vienna, Austria, 10–13 November 2013; pp. 6764–6769. [Google Scholar]
  23. Song, Z.; Li, J.; Hou, J.; Hofmann, H.; Ouyang, M.; Du, J. The battery-supercapacitor hybrid energy storage system in electric vehicle applications: A case study. Energy 2018, 154, 433–441. [Google Scholar] [CrossRef]
  24. Tran, D.-D.; Barrero, R.; Hegazy, O.; Omar, N.; van Mierlo, J. An evaluation study of hybrid energy storage system for plug-in hybrid electric buses. In Proceedings of the 2017 IEEE Vehicle Power and Propulsion Conference (VPPC), Belfort, France, 11–14 December 2017; pp. 1–7. [Google Scholar]
  25. Jing, W.; Lai, C.H.; Wong, W.S.H.; Wong, M.L.D. A comprehensive study of battery-supercapacitor hybrid energy storage system for standalone PV power system in rural electrification. Appl. Energy 2018, 224, 340–356. [Google Scholar] [CrossRef]
  26. Lambert, S.M.; Pickert, V.; Holden, J.; He, X.; Li, W. Comparison of supercapacitor and lithium-ion capacitor technologies for power electronics applications. In Proceedings of the 5th IET International Conference on Power Electronics, Machines and Drives (PEMD 2010), Brighton, UK, 19–21 April 2010; p. 241. [Google Scholar]
  27. AsahiKasei-Corporation. Dissolution of Joint-Venture Company for Lithium Ion Capacitor Business. Press Release. 2015. Available online: https://www.asahi-kasei.co.jp/asahi/en/news/2014/e150319.html (accessed on 16 September 2018).
  28. Energystoragenews.com. Lithium Ion Capacitors. Energy Storage News. 23 December 2014. Available online: http://www.energystoragenews.com/Lithium Ion Capacitors.html (accessed on 15 September 2018).
  29. Kollmeyer, P.; Wootton, M.; Reimers, J.; Stiene, T.; Chemali, E.; Wood, M.; Emadi, A. Optimal performance of a full scale Li-ion battery and li-ion capacitor hybrid energy storage system for a plug-in hybrid vehicle. In Proceedings of the 2017 IEEE Energy Conversion Congress and Exposition (ECCE), Cincinnati, OH, USA, 1–5 October 2017; pp. 572–577. [Google Scholar]
  30. Hemmati, R.; Saboori, H. Emergence of hybrid energy storage systems in renewable energy and transport applications—A review. Renew. Sustain. Energy Rev. 2016, 65, 11–23. [Google Scholar] [CrossRef]
  31. Snoussi, J.; Benelghali, S.; Benbouzid, M.; Mimouni, M. Auto-adaptive filtering-based energy management strategy for fuel cell hybrid electric vehicles. Energies 2018, 11, 2118. [Google Scholar] [CrossRef]
  32. Ayad, M.Y.; Becherif, M.; Paire, D.; Djerdir, A.; Miraoui, A. Passivity-based control of hybrid power sources using fuel cell, supercapacitors, and batteries on the DC link for energy traction system. In Proceedings of the IEEE International Electric Machines and Drives Conference, IEMDC 2007, Antalya, Turkey, 3–5 May 2007; pp. 453–458. [Google Scholar]
  33. Rautenbach, H.J.; Gouws, R.; Bessarabov, D.; Kruger, A.; Human, G. Development of smart controller for fuel cell and supercapacitor application in electric vehicles. In Proceedings of the 23rd Southern African Universities Power Engineering Conference, Johannesburg, South Africa, 28–30 January 2015; pp. 87–92. [Google Scholar]
  34. Chong, L.W.; Wong, Y.W.; Rajkumar, R.K.; Isa, D. Modelling and simulation of standalone PV systems with battery-supercapacitor hybrid energy storage system for a rural household. Energy Procedia 2017, 107, 232–236. [Google Scholar] [CrossRef]
  35. Cabrane, Z.; Ouassaid, M.; Maaroufi, M. Analysis and evaluation of battery-supercapacitor hybrid energy storage system for photovoltaic installation. Int. J. Hydrogen Energy 2016, 41, 20897–20907. [Google Scholar] [CrossRef]
  36. Esmaili, A.; Novakovic, B.; Nasiri, A.; Abdel-Baqi, O. A hybrid system of Li-ion capacitors and flow battery for dynamic wind energy support. IEEE Trans. Ind. Appl. 2013, 49, 1649–1657. [Google Scholar] [CrossRef]
  37. Rautenbach, H.J. Development of smart controller for fuel cell and supercapacitor application in electric vehicles. In Proceedings of the South African Universities Power Engineering Conference (SAUPEC), Vanderbijlpark, South Africa, 30–31 January 2014. [Google Scholar]
  38. Maxwell.com. Datasheet K2 Ultracapacitors 2.7 V Series Features and Benefits. Datasheet. Available online: http://www.maxwell.com/images/documents/K2Series_DS_1015370_5_20141104.pdf (accessed on 15 September 2018).
  39. Samhwa-Capacitor. New Product: Energy Storage Capacitor. News (New Product). Available online: http://www.samwha.com/capacitor/news/news_product5.aspx (accessed on 8 September 2018).
  40. Hobbyking.com. Turnigy Nano-Tech 6000 mAh 4S 25~50C LiPo Pack. Product Description. Available online: https://hobbyking.com/en_us/turnigy-nano-tech-6000mah-4s-25-50c-lipo-pack-xt-90.html (accessed on 15 September 2018).
  41. Hintz, A.; Prasanna, U.R.; Rajashekara, K. Novel modular multiple-input bidirectional DC-DC power converter (MIPC). In Proceedings of the 2014 International Power Electronics Conference (IPEC-Hiroshima 2014-ECCE ASIA), Hiroshima, Japan, 18–21 May 2014; pp. 2343–2350. [Google Scholar]
  42. Hintz, A.; Prasanna, U.R.; Rajashekara, K. Novel modular multiple-input bidirectional DC-DC power converter (MIPC) for HEV/FCV application. IEEE Trans. Ind. Electron. 2015, 62, 3163–3172. [Google Scholar] [CrossRef]
  43. Severns, R. Design of Snubbers for Power Circuits. Application Note. 2012. Available online: http://www.cde.com/resources/technical-papers/design.pdf (accessed on 16 September 2018).
  44. Cornell-Dubilier Electronics Inc. Snubber Capacitors. Application Guide. Available online: http://www.cde.com/resources/catalogs/igbtAPPguide.pdf (accessed on 16 September 2018).
  45. Jiya, I.N.; Gurusinghe, N.; Gouws, R. Hybridization of battery, supercapacitor and hybrid capacitor for electric vehicles. In Proceedings of the 2018 IEEE PES/IAS PowerAfrica, Cape Town, South Africa, 28–29 June 2018; pp. 19–24. [Google Scholar]
  46. Kumar, L.; Jain, S. Multiple-input DC/DC converter topology for hybrid energy system. IET Power Electron. 2013, 6, 1483–1501. [Google Scholar] [CrossRef]
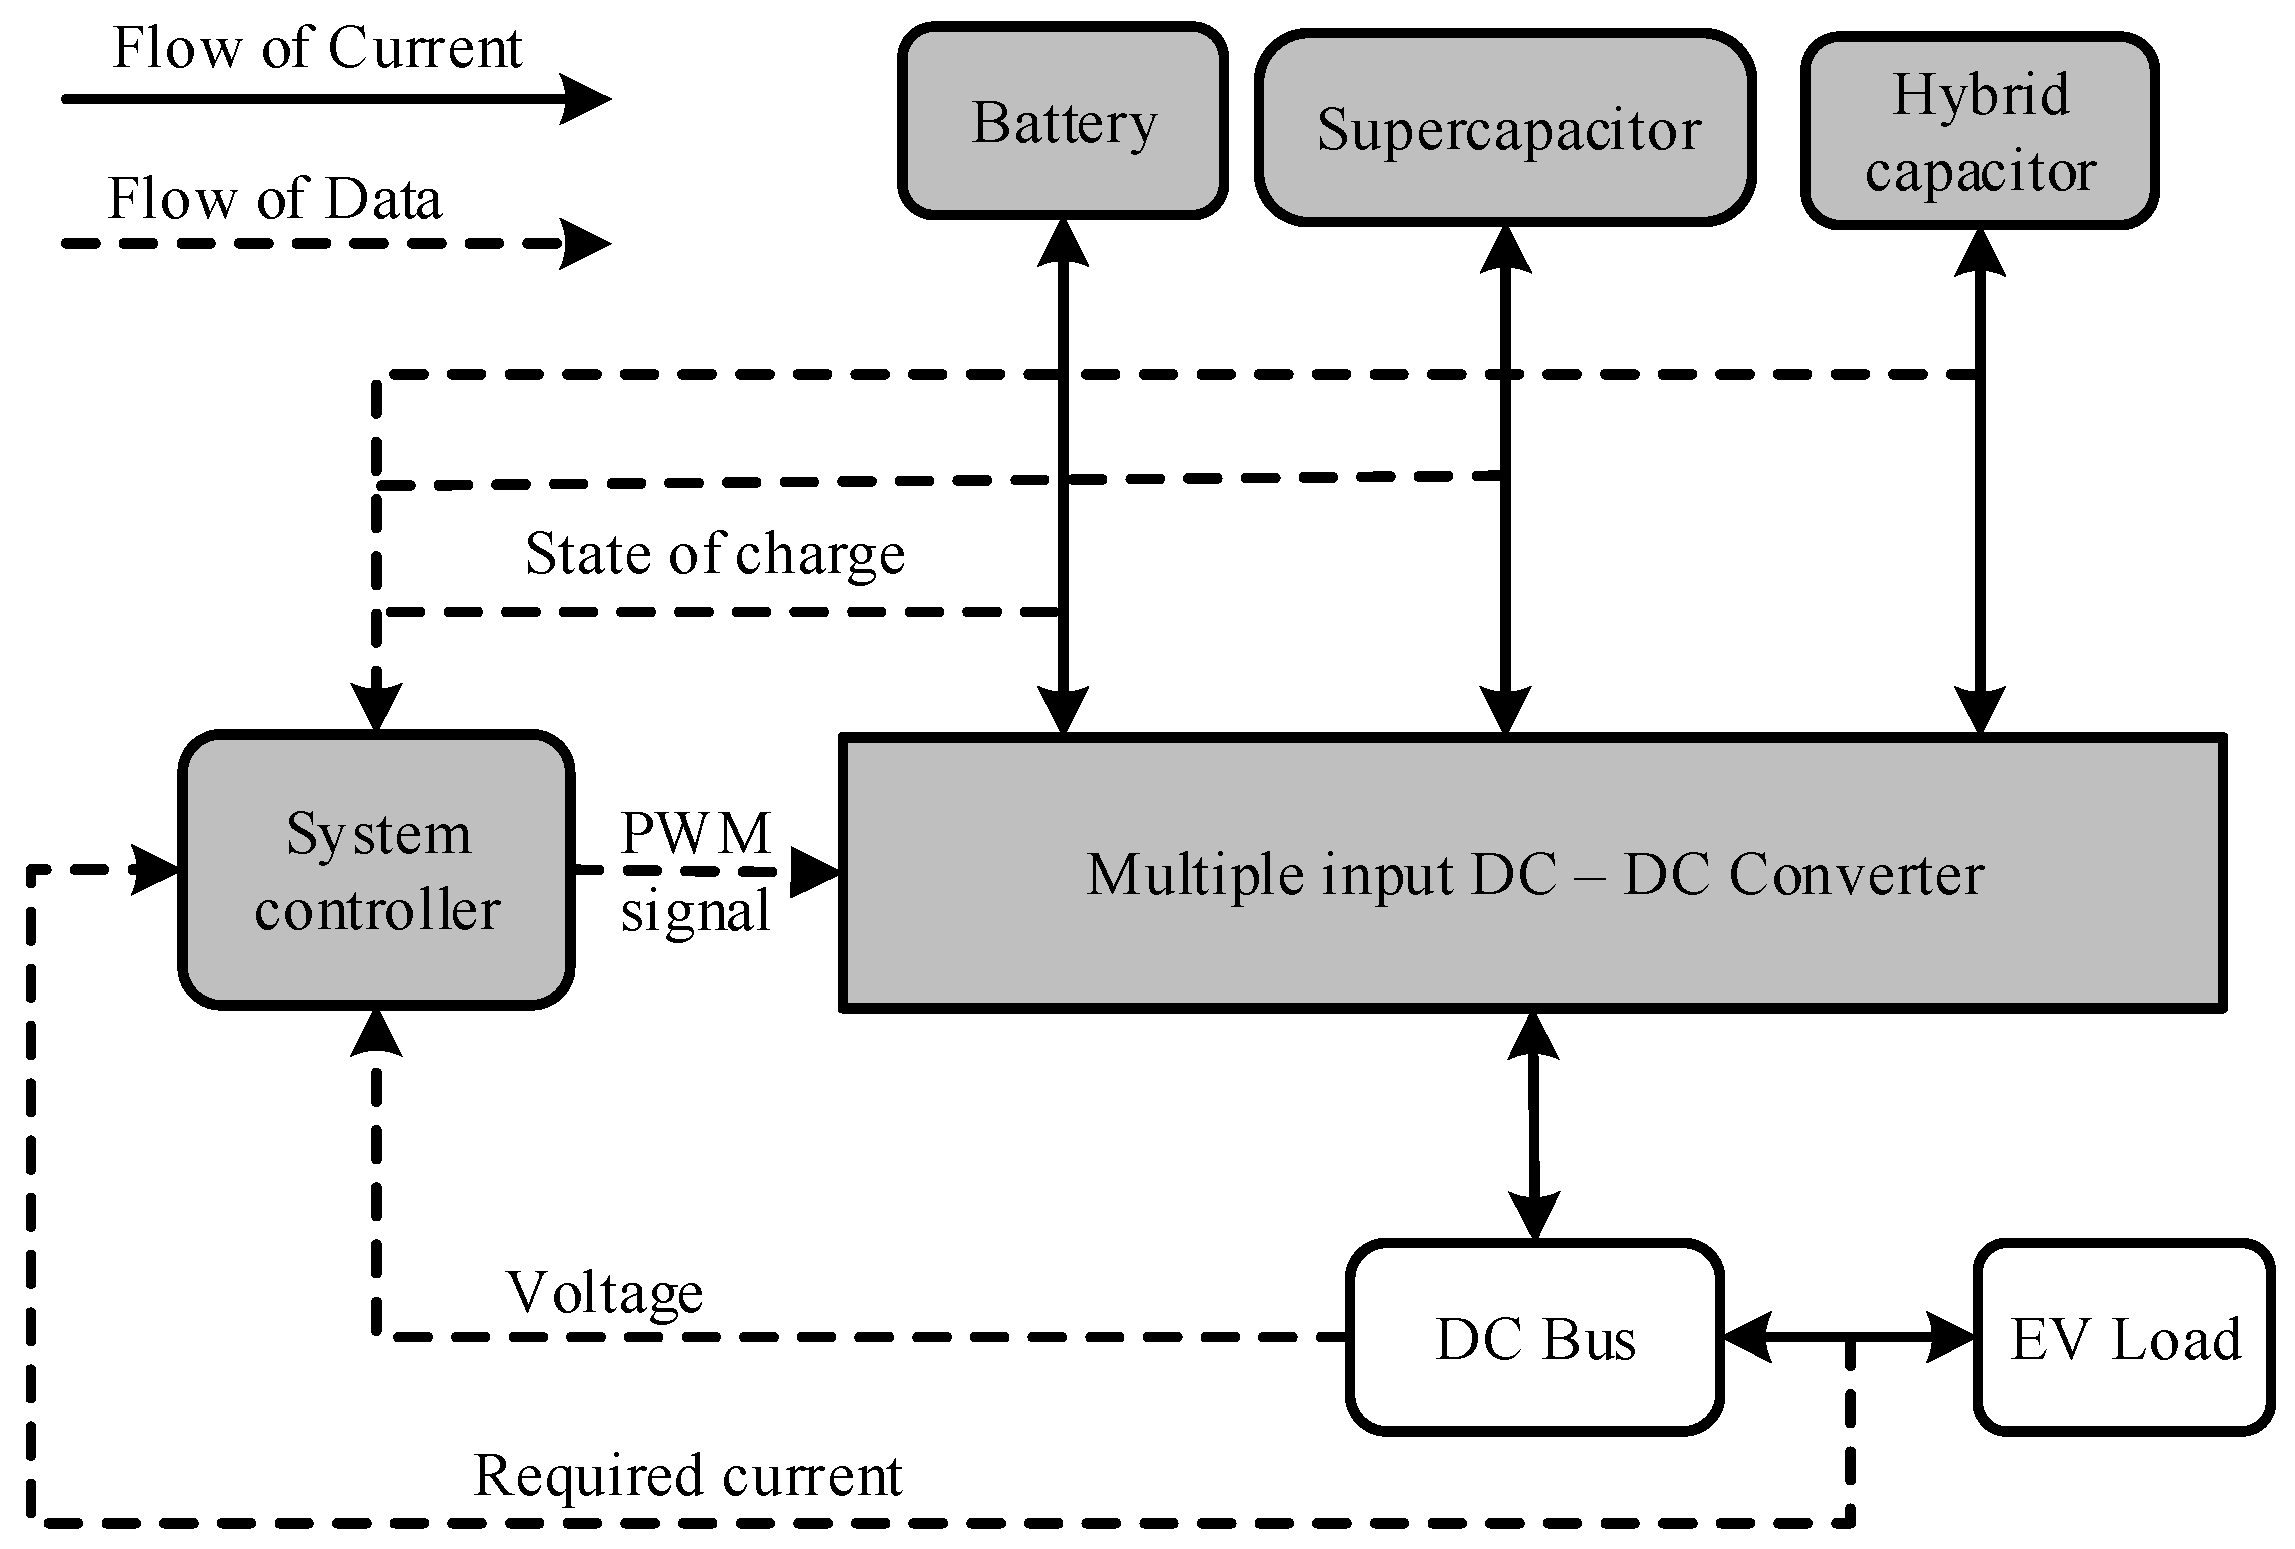
Figure 1. Overview of the concept design, highlighting the major focus areas of this research.
Wevj 09 00047 g001
Figure 2. Comparison of the physical sizes of the supercapacitor (SC) and hybrid capacitor (HC) banks.
Wevj 09 00047 g002
Figure 3. Normalized comparison of the normalized characteristics of the energy storage regimes.
Wevj 09 00047 g003
Figure 4. The implementation circuit of (a) the conventional hybridisation topology using a three-input converter; (b) the proposed hybridisation topology having SC and HC directly connected in parallel; and (c) the experimental implementation of the converter high side and low side switches with the MOSFET driver.
Wevj 09 00047 g004
Figure 5. Steady-state waveforms of the operation of the multiple input converter for the proposed energy storage hybridisation topology.
Wevj 09 00047 g005
Figure 6. The experimental validation of the battery showing the charging and discharging curves under a 2-A current source and load, respectively.
Wevj 09 00047 g006
Figure 7. The experimental validation of the charging of (a) HC and (b) SC under a 3-A source.
Wevj 09 00047 g007
Figure 8. The experimental validation of the SC and HC banks showing the discharging curves under a 3-A and a 12-A load.
Wevj 09 00047 g008
Figure 9. The experimental transient response of the SC bank, HC bank, and parallel arrangement of the SC and HC bank to a constant load current of 4.5 A rising to a pulse of 10 A with a rise time of 1 µs.
Wevj 09 00047 g009
Figure 10. Performance of the experimental SC and HC when directly connected in parallel to a realistic electronic EV load profile.
Wevj 09 00047 g010
Figure 11. Scope results showing the inductor L1 current and voltage alongside the associated switching signals of the MOSFETs for operating the multiple input converter in Mode A at (a) 30% duty and (b) 75% duty.
Wevj 09 00047 g011
Figure 12. Scope results showing the inductor L2 current and voltage alongside the associated switching signals of the MOSFETs for operating the multiple input converter in Mode B at (a) 30% duty and (b) 75% duty.
Wevj 09 00047 g012
Figure 13. The efficiency results of the multiple input converter operating in Modes A and B (a) under varying duty cycles at a constant load and (b) under varying load currents at a constant output voltage.
Wevj 09 00047 g013
Figure 14. Experimental result of the hybridisation topology with SC and HC connected directly in parallel and hybridised through one port; a test using a realistic EV profile.
Wevj 09 00047 g014
Figure 15. Validation of the converter output voltage for its operation in Mode A (having an input voltage of 5 V) and Mode B (having an input voltage of 10 V) against the simulation results and analytical calculations.
Wevj 09 00047 g015
Table 1. Electrical characteristics of the battery, SC, and HC used for the experimental implementation.
DeviceParameterValue
SC (Maxwell Technologies BCAP3000) [38]Cell internal resistance0.29 mΩ
(Bank internal resistance)(1.74 mΩ)
Cell voltage2.7 V
(Max. bank voltage)(16.2 V)
Cell capacitance3000 F
(Bank capacitance)(500 F)
HC (Samwha capacitor ESD-SCAP CL 3000 F) [39]Cell internal resistance0.55 mΩ
(Bank internal resistance)(3.3 mΩ)
Cell voltage2.8 V
(Max. bank voltage)(16.8 V)
Cell capacitance3000 F
(Bank capacitance)(500 F)
Battery (Turnigy nano-tech Li-Po 6.0 Battery) [40]Rated voltage14.8 V
Capacity6000 mAh
Internal resistance12 mΩ
Table 2. Conduction of devices for the operating modes of the multiple input converter.
ModeT1T2
AS3S2S1S4
BS5S2S1S6
CS1S4S2S3
DS1S6S2S5
Table 3. List of parameters and their specifications used for the implementation of the multiple input converter.
DeviceManufacturer IDParameterValue
QH = QLIXTQ 36N30PDrain-source voltage300 V
Gate source voltage±30 V
ON-state resistance110 mΩ
Drain current36 A
DH = DL
Schottky diode
DSTF30100SPeak reverse voltage100 V
Forward current30 A
L1 = L2 = L3
Ring core inductor
B82726S2243A020Inductance0.75 mH
Voltage, current250 V, 24 A
Co (electrolytic)LH.NOVACapacitance, voltage33 µF, 400 V
Cs (mica)CD19FD242GO3Capacitance, voltage2400 pF, 500V
RsCF14JT51R0Resistance, power51 Ω, 2 W
Ds
Rectifier diode
1N4004-TPPeak reverse voltage400 V
Forward current1 A
D1 = D2
Fast switching diode
1N4148TRPeak reverse voltage100 V
Forward current150 mA
CB (tantalum)TAP226K025SRWCapacitance, voltage22 µF, 25 V
C1 = C2 (electrolytic)ESK226M025AC3AACapacitance, voltage22 µF, 25 V
C (ceramic) Capacitance, voltage224 pF, 25V
ParameterNominal Value
Minimum (V)Maximum (V)
VDDVSS + 3VSS + 20
VSS−55
DC1020
VCC1020
VS-600
HOVSVB
LO0VCC
HINVSSVDD
LINVSSVDD
VBVS + 10VS + 20
Table 4. Comparison of resource use for the conventional and the proposed hybridisation topology.
ParameterQuantity
Conventional TopologyProposed Topology
MOSFET switches86
Snubber circuits86
MOSFET drivers (Half bridge)43
Switching circuits86
Inductors32
Output capacitor11
Table 5. Percentage deviation of the output voltage of the converter measured experimentally from the results obtained in the simulation and analytical calculations.
Duty Ratio (%)Mode A (%)Mode B (%)
AnalyticalSimulationAnalyticalSimulation
15.0011.024.286.162.76
30.0010.123.513.611.62
45.008.093.094.061.38
60.0010.536.685.273.49
75.0014.478.969.575.38
90.0016.6013.9411.507.01