Article

Scaling Trends of Electric Vehicle Performance: Driving Range, Fuel Economy, Peak Power Output, and Temperature Effect

1
CE-CERT, University of California Riverside, Riverside, CA 92507, USA
2
Department of Mechanical Engineering, University of California Riverside, Riverside, CA 92521, USA
*
Author to whom correspondence should be addressed.
World Electr. Veh. J. 2018, 9(4), 46; https://doi.org/10.3390/wevj9040046
Submission received: 16 October 2018 / Revised: 29 October 2018 / Accepted: 6 November 2018 / Published: 9 November 2018

Abstract

:
This study investigated scaling trends of commercially available light-duty battery electric vehicles (BEVs) ranging from model year 2011 to 2018. The motivation of this study is to characterize the status of BEV technology with respect to BEV performance parameters to better understand the limitations and potentials of BEV. The raw data was extracted from three main sources: INL (Idaho National Laboratory) website, EPA (Environmental Protection Agency) Fuel Economy website, and the websites BEV manufacturers and internet in general. Excellent scaling trends were found between the EPA driving range per full charge of a battery and the battery capacity normalized by vehicle weight. In addition, a relatively strong correlation was found between EPA city fuel economy and vehicle curb weight, while a weak correlation was found between EPA highway fuel economy and vehicle curb weight. An inverse power correlation was found between 0–60 mph acceleration time and peak power output from battery divided by vehicle curb weight for 10 BEVs investigated at INL. Tests done on the environmentally controlled chamber chassis dynamometer at INL show that fuel economy drops by 19 ± 5% for the summer driving condition with air conditioner on and 47 ± 7% for the winter driving condition.

Graphical Abstract

1. Introduction

The Earth is currently undergoing climate change due to the increase of anthropogenic emissions of greenhouse gases such as CO2 [1]. Thus, many nations around the globe are making efforts to reduce their carbon footprint [2]. The U.S. Energy Information Administration (EIA) estimates that motor vehicles contribute to about 30% of total U.S energy-related CO2 emissions [3]. Hence, over the years, the U.S. has attempted to reduce the amount of CO2 emitted by Internal Combustion Engines (ICEs). ICE vehicles (ICEVs) are also a major source of air pollution in many urban areas. Many “green” methods of propulsion have been developed and improved over the past 20 years such as hydrogen fuel cell and electric vehicles [4]. In an effort to reduce air pollution and emissions of greenhouse gases, the California Air Resources Board aims to increase the sales of Zero Emission Vehicles (ZEVs) significantly by 2050 [5].
Original Equipment Manufacturers (OEMs) have chosen Battery Electric Vehicles (BEVs) over hydrogen fuel cell technology for light duty vehicles in recent years considering the former has been more widely commercialized than fuel cell models. This phenomenon is intriguing because besides very luxurious models such as Tesla model X and S, selling other battery-powered vehicles is not very economically profitable for OEMs at the current volume of sales and prices. True vehicle costs over a 20-year lifetime for a 2015 mid-sized ICEV and BEV are estimated to be $19,000 and $38,000 respectively. The majority of the BEVs cost results from the battery fabrication process [6] which utilizes lithium, a scarce resource. At current lithium extraction levels, the production of BEV at significant annual vehicle sales market share is not likely [7]. In the U.S. over 1 million vehicles were sold in 2017 and approximately 12,000 of those vehicles were BEVs [8]. This means that less than 1% of vehicles sold in the U.S. were BEVs and yet, OEMs have produced and sold more BEVs in the past few years than at any time in history.
Mass production of battery for vehicle use will lead to price reduction due to the increased scale, cost saving, and improved manufacturing technologies. The Joint Agency Draft Technical Assessment Report [9] predicts an increase in battery content and associated costs even with the reduced battery prices for a BEV equivalent to an ICE vehicle. Battery technologies have improved and will continue to do so. However, there is no quantum leap yet in the energy density of the battery. The batteries OEMS use in their BEVs are all based on lithium ion battery technologies and there is no sign of big change for the commercially available and mass-produced batteries for now. The California Air Resource Board’s midterm review report on ZEV [5] states “while there are lots of promising advancements happening in research labs around the world every day, there is unlikely to be a ‘silver bullet’ that will suddenly meet the goals [10] for energy storage technology”.
While there are many BEVs commercially available, there is no standard which can regulate and promote high energy efficiency of BEV. The motivation of this study is to characterize the status of BEV technology with respect to BEV performance parameters so that the public and regulators can understand limitations and potentials of BEV. Components such as vehicle curb weight and battery capacity are important to determine a vehicle’s energy efficiency. An and Santini [11] compared the relationship between vehicle mass (or weight) and fuel economy for conventional vehicles (CV) and hybrid electric vehicles (HEV). They reported that fuel economy of HEVs is significantly improved with little or no change in vehicle mass (or weight) compared to CV. Once a switch to hybrid powertrain is made, then mass reduction in improving fuel economy is diminished relative to conventional vehicles. In a similar context, the vehicle mass vs. fuel economy relationship may be different for BEV compared to CV and HEV. This is an important topic to be investigated but there is no literature reporting on the impact of vehicle mass (or weight) to fuel economy for BEVs using data from multiple vehicles. The closest comparisons available in the literature were found to be: impact of vehicle weight on energy efficiency (which can be translated to fuel economy) at constant vehicle speeds for EV during 1994 Department of Energy (DOE) EV competition [12], and impact of two EV masses on energy consumption over different driving cycles [13].
Though BEVs themselves produce no emissions, they do consume electrical energy for charging and the battery fabrication process. This electricity is generated from power plants which burn fossil fuels. As such, BEVs are considered to be efficient as they compensate for this usage of electrical energy to minimize their impact on global warming. Regardless, there is no fuel economy standard for BEVs worldwide. Analysis of vehicle performance parameters with respect to fuel economy can be essential information if agencies are to consider legislating fuel economy standards for BEVs.
This paper investigates BEVs based on vehicle specification, fuel economy, and experimental testing data available to fill this gap in literature knowledge. The paper aims to find general relationships between vehicle performance parameters such as driving range, fuel economy, and vehicle parameters such as vehicle weight and battery capacity. As BEV manufacturers are not required to provide key vehicle parameters publicly, they often keep from disclosing them for marketing purposes, claiming them to be proprietary information. Hence, it has been challenging to collect data necessary for analysis. Vehicles of investigation in this study are all light duty passenger BEVs. The analysis is limited to commercially available BEVs due to the availability of the data. The results of this study will help the public to understand the current capabilities and limitations of the BEV technology and regulators to legislate fuel economy standards for BEVs.

2. Vehicle Data Collection

For the driving range per full charge and fuel economy investigation, commercially available light duty vehicles in the U.S. from 12 auto manufacturers with model years ranging from 2011 to 2018 were used (Table A1). Currently, there is a lack of information on the specification of BEVs, and BEV manufacturers should disclose more of the aforementioned in the near future for better analysis and studies. The data collected depended on the availability to the public. The raw data was extracted from three main sources: INL (Idaho National Laboratory) website, EPA Fuel Economy website, and the websites of BEV manufacturers and internet in general. INL had most of the vehicle specification data for the cars because of their advanced vehicle testing activity. EPA-rated vehicle performance data was obtained from the fuel economy website. Curb weight and other data were obtained from internet sources such as “vehicle history” or directly from the manufacturers’ websites. A small subset of data was also found from Argonne National Laboratory (ANL) website and the majority of their data overlapped with our existing data set in Table A1 and so the ANL data was not referred to in this analysis.
Peak battery power vs. 0–60 mph acceleration time (Table A2) and the influence of weather conditions on fuel economy (Table A3) used the data obtained from INL. The car models are from various manufacturers commercially available in the U.S. like Chevrolet, Kia, Mercedes, Volkswagen, BMW, Ford, Nissan, and Mitsubishi. The model years ranged from 2011 to 2015. Battery weight vs. battery capacity data were collected all above three sources and the raw data is provided in Table A4.

3. Results

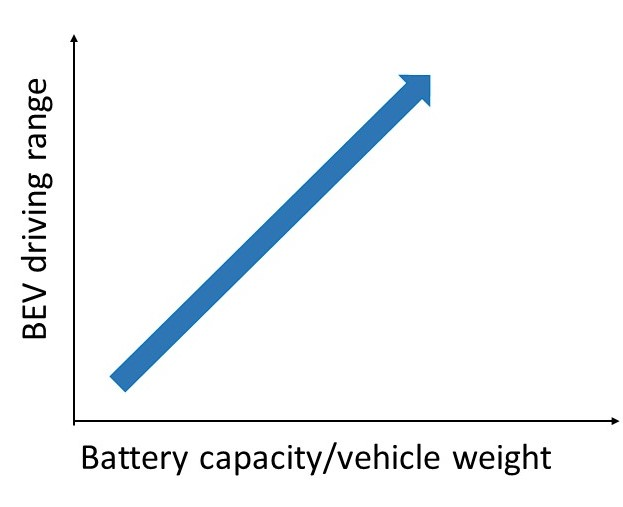
3.1. Scaling Trend of Driving Range

Driving range per full charge is one of the most important performance parameters which determines BEV sales and ownership. BEV owners charge their vehicles whenever and wherever possible, explaining anxiety over BEV’s driving range. First, Correlations (data not shown) were found between the EPA driving range per full charge of a battery (a.k.a. MMPC, Max Miles Per Charge) and battery capacity. Better correlations (R2 > 0.73) were found with MMPC when the battery capacity normalized by vehicle weight (i.e., battery capacity divided by vehicle curb weight), which makes sense intuitively, and was used as shown in Figure 1. It is noteworthy that two different trends were observed depending on the driving range of the vehicle. Three linear regression lines are presented: the solid line is fit to all data, the dotted line is fit to vehicles with a long driving range (>150 miles), and the dot-and-dash line is fit to vehicles with a short driving range (<150 miles). In addition, blue markers represent Tesla vehicles while red markers represent non-Tesla vehicles. Due to the abundance of data available over a range of vehicle weights, Tesla vehicles were separately categorized in the Figure. Circles represents short-range BEVs, and triangles represent long-range BEVs. All of Tesla vehicles, 2017 Chevy Bolt, and 2016 and 2017 BYD e6 belonged to the long-driving-range BEV while the rest of the BEVs investigated in the current study belonged to the short-driving-range BEV. Short-driving-range BEVs have a slope of 5002 miles/(kWh/kg) with R2 = 0.73; long-driving-range BEVs have a slope of 6074 miles/(kWh/kg) with R2 = 0.91. The regression line drawn for all vehicles had a slope of 8356 miles/(kWh/kg) with R2 = 0.96.
Jiménez-Palacios [14] first defined vehicle-specific power (VSP) as the instantaneous power per unit mass of the vehicle. Many studies [15,16] used VSP to relate emissions to vehicle driving conditions. If accurate values are known for input variables of VSP then one can obtain both driving range and fuel economy by modeling. Sripad and Viswanathan [17] used a standard dynamic model equation which is essentially a similar version of VSP to assess the battery power required for battery electric semi-truck. Figure 1 contains valuable data to model driving range of light duty BEVs. Simple, intuitive correlations can be extremely useful to develop and design a BEV. The data is also helpful to understand characteristics of BEVs, as no comparable graph or data was found in the literature search.

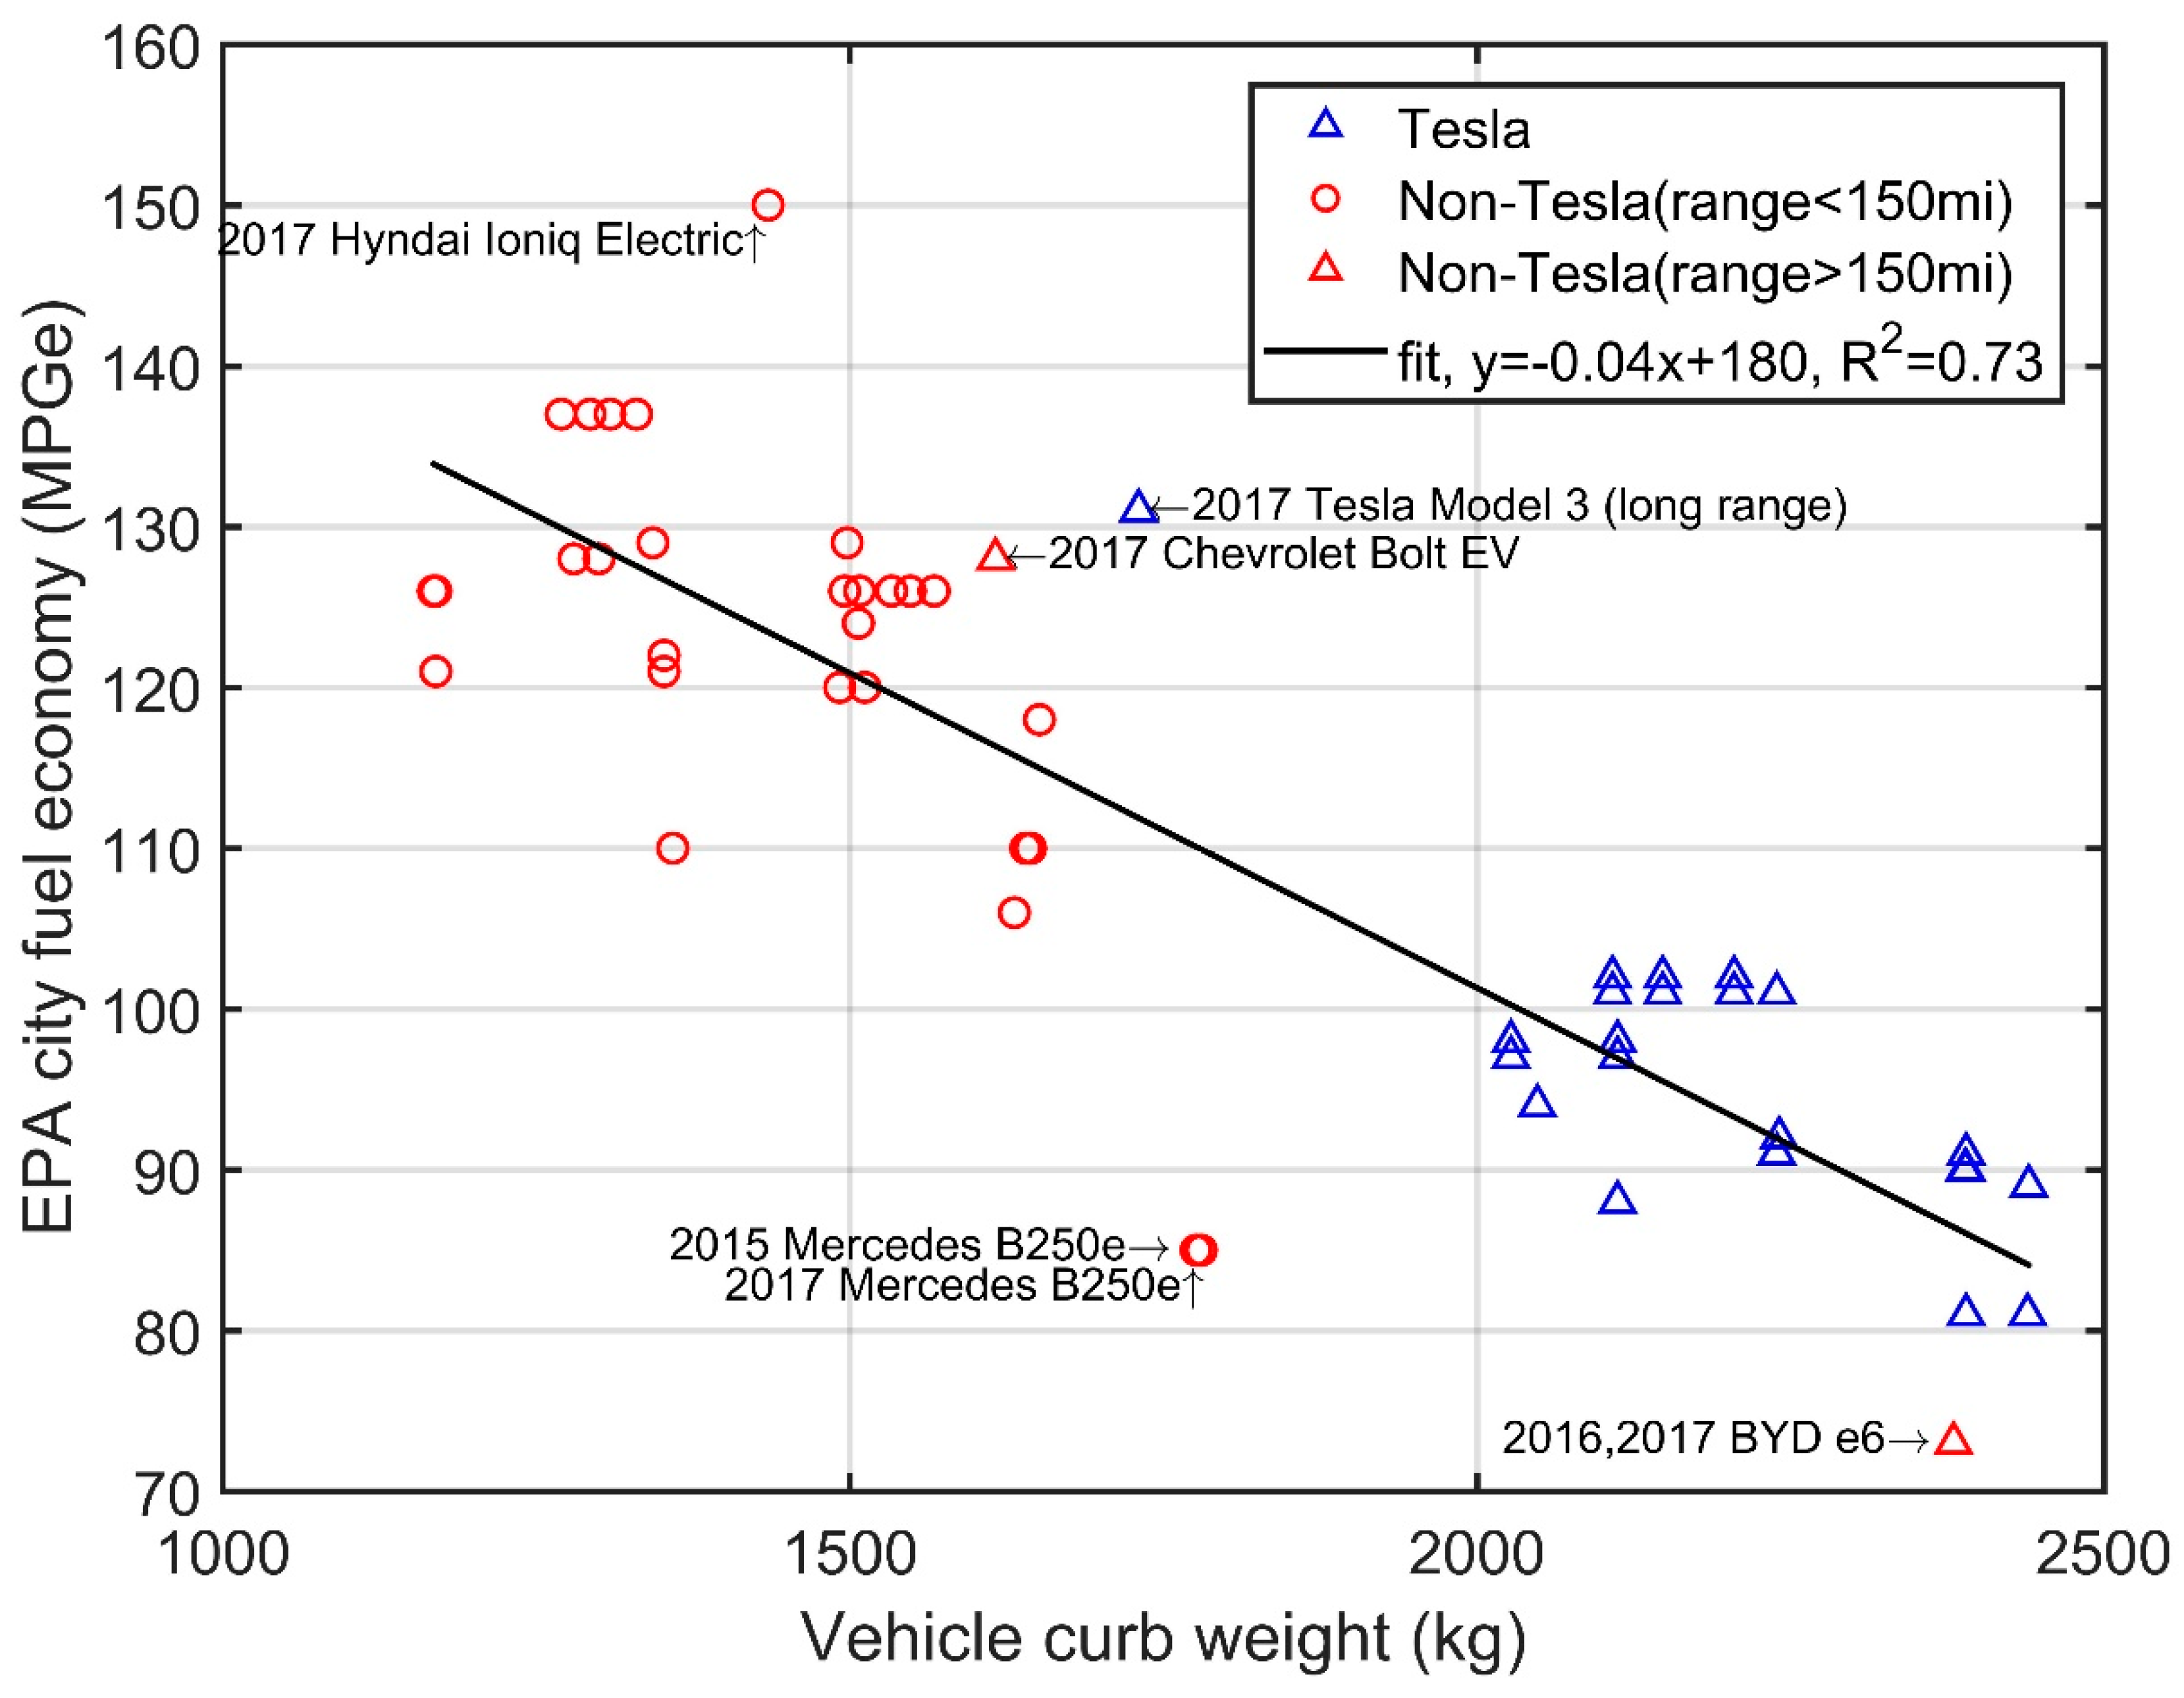
3.2. Scaling Trend of Fuel Economy

Many interesting trends were found for BEV fuel economy. EPA city, highway, and combined fuel economy data were reported in the MPGe unit. A relatively strong correlation was found between EPA city fuel economy (MPGe) and vehicle curb weight with a slope of −0.04 MPGe/kg and R2 = 0.73 as shown in Figure 2. Tesla Model 3 and Chevy Bolt showed the highest city fuel economy (131 and 128 MPGe) among the long range BEVs due to relatively lighter vehicle weights (1730 and 1616 kg). On the other hand, 2015 and 2017 Mercedes B250e showed relatively lower fuel economy (85 MPGe) among short-range BEVs. 2016 and 2017 BYD e6 ranked as the lowest city fuel economy (73 MPGe) while 2017 Hyundai Ionic Electric ranked as the highest city fuel economy (150 MPGe) among all the BEVs investigated in this study. EPA city driving cycle represents urban driving, in which a vehicle is typically started in the morning (after being parked all night) and driven in stop-and-go rush hour traffic. Barring Tesla Model 3, most of the Tesla vehicles were heavier than the other BEVs (>2027 kg in weight) and, therefore, not ideal to get the best city-fuel-economy for stop-and-go driving conditions.
A weak correlation was found between EPA highway fuel economy (MPGe) and vehicle curb weight with a slope of −0.01 MPGe/kg and R2 = 0.16 as shown in Figure 3. The negative slope for highway fuel economy was four times smaller than that of the city fuel economy, indicating highway fuel economy is less dependent on vehicle weight compared to city fuel economy. The 2017 Hyundai Ioniq and Tesla Model 3 showed the highest highway fuel economy among all BEVs with 122 and 120 MPGe, respectively. The 2016 and 2017 BYD e6 showed the lowest highway fuel economy (71 MPGe) followed by 2015 and 2017 Mercedes-Benz B250e (82 MPGe). The majority of BEVs had highway fuel economy in the range from 90 to 110 MPGe. The EPA highway fuel economy driving cycle represents a mixture of rural and interstate highway driving in a warmed-up vehicle, typical for longer trips in free-flowing traffic. Figure 2 and Figure 3 show that long-range BEVs, which tend to be heavy due to battery weight, were more efficient for highway fuel economy than for city fuel economy.
EPA combined fuel economy represents a combination of city and highway driving fuel economy at 55 and 45% weightings. A negative linear relationship was found between EPA combined fuel economy (MPGe) and vehicle curb weight with a slope of −0.025 MPGe/kg and R2 = 0.57 as shown in Figure 4. The 2017 Hyundai Ioniq showed the best combined fuel economy (136 MPGe) followed by the 2017 Tesla model 3 with a long-range package (126 MPGe) while 2016 and 2017 BYD e6 showed the least combined fuel economy (72 MPGe) followed by 2015 and 2017 Mercedez Benz B250e (84 MPGe). Apart from these, the long range BEVs (mainly Tesla and Chevrolet Bolt EV) had combined fuel economy ranging from 86 to 104 MPGe while short range BEVs had combined fuel economy ranging from 105 to 124 MPGe.
Vehicle weight vs. fuel economy relationship was extracted for conventional gasoline engine powered vehicles from the latest EPA report on fuel economy [18] for comparison. Their Figure 3.9 shows unadjusted laboratory fuel consumption vs. vehicle weight for model year (MY) 1975 and 2016. Their data showed good linearity for gasoline-powered vehicles and it can be expressed in the following equations.
y = 0.018 x + 71.7   for   MY   2016
y = 0.011 x + 40.3   for   MY   1975
where y is fuel economy in MPG and x is vehicle weight in kg.
The following equation from our analysis is the relationship between vehicle weight and fuel economy for BEVs:
y = 0.025 x + 150   for   BEV
where y is MPGe and x is vehicle weight in kg. It can be observed that the slopes are steeper in the order of BEV, 2016 MY gasoline vehicles, and 1975 MY gasoline vehicles.
Vehicle weight vs. fuel economy relationship was also extracted for BEVs from 1994 DOE competition [12] for comparison. The BEVs in this competition used DC-drive systems with lead-acid batteries. They were tested at three different constant vehicle speeds of 88, 64 and 40 km/h in a closed track for a fixed distance of 8 km. Their data is quite scattered and showed −0.16, −0.10 and −0.10 MPGe/kg at 88, 64 and 40 km/h, respectively. While direct comparison is difficult between fuel economy over a transient driving cycle and constant speeds, it can be inferred that fuel economy of BEVs in 1994 DOE competition was much more dependent on vehicle weight compared to BEVs of these days.
Unique trends were found when EPA city fuel economy was plotted against EPA highway fuel economy in Figure 5. Separate trend lines were found between Tesla and non-Tesla vehicles for correlations between city and highway fuel economy. Non-Tesla vehicles showed better city fuel economy for the vehicles with the same highway fuel economy as Tesla vehicles. This is because the majority of non-Tesla vehicles are lighter in weight (except BYD e6) and therefore yield better city fuel economy. On the other hand, Tesla vehicles are heavier (except model 3) with higher battery capacity and therefore longer driving range with emphasis on highway fuel economy. City fuel economy can also be related to the vehicle’s capability of recovering brake energy via regenerative braking in addition to the vehicle weight. This energy recovery capability for each EV was not readily available in the literature search; this parameter was neither tested by a standard method by any research organization nor specified by the manufacturer. More research is needed to establish the correlation between recovering brake energy and city fuel economy.
Acceleration performance is important for drivability and safety. Figure 6 shows that an inverse power correlation was found between 0–60 mph acceleration time and peak power output from battery/vehicle curb weight for 10 BEVs investigated in INL. Peak power output is another important measure of the battery performance.
A relationship between battery capacity and battery weight was graphed in Figure 7. Assuming a linear relationship, the slope was determined to be 0.18 kWh/kg. The value of the x-intercept was 124 kg, which is the average weight of inactive materials such as battery housing. Note, BEV makers are striving to increase the energy density of their batteries. More data from the latest BEVs might change the relationship in Figure 7 to be nonlinear. The linear line plotted in Figure 7 is merely a reference with the existing data set available.
INL determined BEV fuel economy under different weather conditions such as summer driving conditions at 95 F with solar load and AC on and winter driving at 20 F over UDDS (Urban Driving Dynamometer Schedule) cycle on an environmentally-controlled chamber chassis dynamometer. This data was further analyzed in this study. Fuel economy data was normalized against that of a normal temperature of 72 F with no AC on in Figure 8. On average, fuel economy drops by 19 ± 5% for the summer driving condition and 47 ± 7% for the winter driving condition. Southern states with short or no winters have huge advantages for BEV capacity compared to northern states with harsher winters.

4. Discussion and Conclusions

The results from this study can be used in many ways. BEV manufacturers can use the scaling relationships for preliminary designs of new BEVs. The public (and/or engineers and scientists) can use them to understand limitations and possibilities of current technologies and required improvement of BEV parts for the future, especially in terms of battery weight, power density, and power output for required and/or desired BEV performance. For instance, consider designing a BEV which has 400 miles driving range. Table 1 shows a sample calculation using regression lines in Figure 1, Figure 2, Figure 3, Figure 4, Figure 5, Figure 6 and Figure 7 with assumed vehicle weights. It provides required battery weights and capacities with expected fuel economies for different hypothetical vehicle weights. As expected, the results show that high power density of battery and low curb weight of the vehicle are key parameters for the increasing BEV efficiency. It is recommended to investigate other important aspects of BEV batteries especially in terms of charging and discharging abilities in the future research.
More models of electric vehicles are available in recent years and it is important for engineers, the public, and manufacturers to know the limitations and capabilities of the current technology. This study provided these answers by looking into scaling trends of electric vehicle performance parameters from model year 2011 to 2018. Excellent correlations were found between the EPA driving range per full charge of a battery and the battery capacity normalized by vehicle weight (i.e., battery capacity divided by vehicle curb weight). Short-driving-range BEVs (driving range < 150 miles) have a slope of 5002 miles/(kWh/kg) with R2 = 0.73 while long-driving-range BEVs (driving range > 150 miles) have a slope of 6074 miles/(kWh/kg) with R2 = 0.91. When a regression line was drawn for all vehicles, the slope was found to be 8356 miles/(kWh/kg) with R2 = 0.96. A relatively strong correlation was found between EPA city fuel economy (MPGe) and vehicle curb weight with a slope of −0.04 MPGe/kg and R2 = 0.73 while a weak correlation was found between EPA highway fuel economy (MPGe) and vehicle curb weight with a slope of −0.01 MPGe/kg and R2 = 0.16. Unique separate trend lines existed between Tesla and non-Tesla vehicles for correlations between city and highway fuel economy. Non-Tesla vehicles showed better city fuel economy for the vehicles with the same highway fuel economy as Tesla vehicles. An inverse power correlation was found between 0–60 mph acceleration time and peak power output from battery/vehicle curb weight for 10 BEVs investigated in Idaho National Laboratory. For a linear relationship, 0.18 kWh/kg, between battery capacity and battery weight, the value of the x-intercept was 124 kg, which is the average weight of inactive materials such as battery housing. Fuel economy data over the UDDS cycle was normalized against that of a normal temperature of 72 F with no AC on. On average, fuel economy drops by 19 ± 5% for the summer driving condition with AC on and 47 ± 7% for the winter driving condition.
A lot of researchers want to improve vehicle parameters such as range and fuel economy but do not have available material to refer to and draw assumptions from. With the graphs available from this study, researchers can focus on developing one parameter using expected results of other parameters. Battery technology varies with manufacturers and Tesla cars had the highest ranges. However, they had lower city fuel economy owing to higher vehicle curb weight. While most of the lighter cars were not as efficient as Tesla, there were some new vehicles like 2017 Hyundai Ioniq and 2017 Chevy Bolt EV that had better fuel economy with lower curb weight than Tesla. Battery technology used for these outlier cars can be investigated for future research. Improving battery technology and enabling a longer driving range has an effect on Li-ion extraction rates and might require technology beyond Li-ion. For this purpose, trends between current rates of Li-ion extraction, battery cost and capacity are all factors that need to be further analyzed. The results of this study follow our intuition with specific parameters and linear correlations. This study proposes key BEV specifications and performance test results to be made publicly available and required by regulations in the future to promote research and development of BEV technologies and to facilitate analysis like this study for the benefit of the public.

Author Contributions

Investigation, R.S. and M.H.; Writing—original draft, H.J.

Funding

R.S. and M.H. were supported by Research Apprentice Program (RAP) at CE-CERT for this work.

Conflicts of Interest

The authors declare no conflict of interest.

Appendix A

Table A1. Vehicle data for fuel economy and driving range analysis (Figure 1, Figure 2, Figure 3, Figure 4 and Figure 5).
Data SourceMYMakeModelBatt. Capacity (kWh)EPA Range (miles)EPA City (MPGe)EPA Highway (MPGe)EPA Combined (MPGe) Battery Type
INL2014BMWi318.881137111124Li-ion2850
Internet2014BMWi32281137111124Li-ion2635
Internet2015BMWi32281137111124Li-ion2932
Internet2016BMWi32281137111124Li-ion2799
FE2017BMWi3 (60 A-hr)2281137111124Li-ion2886
FE2017BMWi3 (94 A-hr)33114129106118Li-ion2961
FE2016BYDe661.4187737172Li-ion5247
FE2017BYDe661.4187737172Li-ion5247
INL2015ChevroletSpark EV18.482128109119Li-ion2821
FE2016ChevroletSprark EV1982128109119Li-ion2866
FE2017ChevroletBolt EV60238128110119Li-ion3563
INL2013FordFocus Electric237611099105Li-ion3616
Internet2014FordFocus Electric237611099105Li-ion2995
Internet2015FordFocus Electric237611099105Li-ion3624
FE2016FordFocus Electric237611099105Li-ion3622
FE2018FordFocus Electric3511511896107Li-ion3640
FE2017FordFocus Electric33.511511896107Li-ion3640
Internet2014Fiat500e2487122108116Li-ion2980
Internet2016Fiat500e2484121103112Li-ion2980
FE2017Fiat500e2484121103112Li-ion2980
FE2017HyundaiIoniq Electric28124150122136Li-ion3164
INL2015KiaSoul Electric32.59312092105Li-ion3334
FE2016KiaSoul Electric279312092105Li-ion3289
FE2017KiaSoul Electric279312092105Li-ion3289
INL2015MercedesB-Class3587858284Li-ion3916
FE2016MercedesB250e2887858284Li-ion3924
Internet2017MercedesB250e2887858584Li-ion3924
INL2012Mitsubishi I-MIEV166212699112Li-ion2574
FE2016Mitsubishii-MiEV166212699112Li-ion2579
FE2017Mitsubishii-MiEV1659121102112Li-ion2579
INL2011NissanLeaf247310692 Li-ion3595
INL2013Nissan Leaf2475129102115Li-ion3302
Internet2014NissanLeaf2484126101114Li-ion3298
Internet2015NissanLeaf2484126101114Li-ion3298
Internet2016NissanLeaf (24 kwh)2484126101114Li-ion3324
FE2016Nissan Leaf (30 kWh)30107124101112Li-ion3323
FE2017Nissan Leaf 30107124101112Li-ion3323
INL2015VWe-Golf24.283126105116Li-ion3412
Internet2015VWe-Golf24.283126105116Li-ion3380
FE2017VWe-Golf35.8125126111119Li-ion3455
FE2016VWe-Golf24.283126105116Li-ion3380
INL2014TeslaS85265949795Li-ion4514
FE2016TeslaS AWD-60D60218101107104Li-ion4861
FE2016TeslaS AWD-75D75259102105103Li-ion4861
FE2016TeslaS AWD-90D90294101107103Li-ion4936
FE2016TeslaS AWD-70D70240101102101Li-ion4861
FE2016TeslaS (60 kWh)602109810199Li-ion4656
FE2016TeslaS (70 kWh)70234889089Li-ion4656
FE2016TeslaS (75 kWh)752499710098Li-ion4656
FE2016TeslaS AWD-P90D902709110095Li-ion4936
FE2016TeslaX AWD-75D75238919593Li-ion5269
FE2016TeslaX AWD-90D90257909492Li-ion5269
FE2016TeslaX AWD-P90D90250899089Li-ion5379
FE2016Tesla X AWD-P100D100289819286Li-ion5269
FE2017TeslaS AWD-90D90294102107104Li-ion4736
FE2017TeslaS AWD-60D60218101107104Li-ion4647
FE2017TeslaS AWD-75D75259102105103Li-ion4647
FE2017TeslaS AWD-100D100335101102102Li-ion4736
FE2017TeslaS (60 kWh)602109810199Li-ion4469
FE2017TeslaS (75 kWh)752499710098Li-ion4469
FE2017TeslaS AWD-P100D1003159210598Li-ion4941
FE2017TeslaX AWD-90D90257909492Li-ion5267
FE2017TeslaX AWD-P100D100289819286Li-ion5377
FE2017Tesla3 (long range)74310131120126Li-ion3814
Table A2. Vehicle data for acceleration time vs. peak battery power (Figure 6).
Model YearMakeModelAcceleration (0–60 mph) (s)Peak Power from Battery (kW)
2015ChevroletSpark EV7.9133.3
2015KiaSoul EV10.589.8
2015MercedesB-Class7.5156.4
2015VolkswagenE-Golf12.294.8
2014BMWi37.2139.4
2014TeslaModel S5.5274.6
2013FordFocus Electric10.9117.2
2013NissanLeaf10.687.1
2012MitsubishiI-MIEV14.953.4
2011NissanLeaf10.585.6
Table A3. Vehicle data for weather conditions vs. fuel economy (Figure 8).
Model YearMakeModelMPGe @72FMPGe @95F with Solar LoadMPGe @20F
2015ChevroletSpark EV10.820.5
2015KiaSoul EV10.790.62
2015MercedesB-Class10.870.51
2015VolkswagenE-Golf10.790.64
2014BMWi310.840.48
2013FordFocus Electric10.780.49
2013NissanLeaf10.730.55
2012MitsubishiI-MIEV10.890.45
Average 10.810.53
Standard deviation 0.050.07
Table A4. Vehicle data for battery capacity vs. battery weight (Figure 7).
Model YearMakeModelBattery Capacity (kWh)Battery Weight (kg)Battery Type
2017KiaSoul Electric27277 Li-ion
2015KiaSoul EV32.5203 Li-ion
2015ChevroletSpark EV18.4215 Li-ion
2015MercedesB250e35290 Li-ion
2015VolkswagenE-Golf24.2313 Li-ion
2015NissanLeaf24295 Li-ion
2014NissanLeaf24300 Li-ion
2014BMWi318.8235 Li-ion
2014TeslaModel S85545 Li-ion
2013FordFocus Electric23303Li-ion
2013Nissan Leaf24290Li-ion
2012Mitsubishi I-MIEV16227Li-ion
2011NissanLeaf24294Li-ion

References

  1. Trenberth, K.E.; Jones, P.D.; Ambenje, P.; Bojariu, R.; Easterling, D.; Klein, T.; Parker, D.; Rahimzadeh, F.; Renwick, J.A.; Rusticucci, M.; et al. Observations: Surface and atmospheric climate change. In Climate Change 2007; Cambridge University Press: Cambridge, NY, USA, 2007; pp. 235–336. [Google Scholar]
  2. Schleussner, C.-F.; Rogelj, J.; Schaeffer, M.; Lissner, T.; Licker, R.; Fischer, E.M.; Knutti, R.; Levermann, A.; Frieler, K.; Hare, W.J.N.C.C. Science and policy characteristics of the Paris Agreement temperature goal. Nat. Clim. Chang. 2016, 6, 827–835. [Google Scholar] [CrossRef] [Green Version]
  3. Administration, U.E.I. How Much Carbon Dioxide Is Produced from Burning Gasoline and Diesel Fuel? Available online: https://www.eia.gov/tools/faqs/faq.php?id=307&t=10 (accessed on 19 May 2018).
  4. Chan, C.C. The state of the art of electric, hybrid, and fuel cell vehicles. Proc. IEEE 2007, 95, 704–718. [Google Scholar] [CrossRef]
  5. CARB. California’s Advanced Clean Cars Midterm Review: Appendix C: Zero Emission Vehicle and Plug-in Hybrid Electric Vehicle Technology Assessment. Available online: https://www.arb.ca.gov/msprog/acc/acc-mtr.htm (accessed on 8 November 2018).
  6. John, W.; Brennan, T.E.B. Battery Electric Vehicles vs. Internal Combustion Engine Vehicles: A United States-Based Comprehensive Assessment. Arthur D Little. 2016. Available online: http://www.adlittle.com (accessed on 9 November 2018).
  7. Hunt, T. Is There Enough Lithium to Maintain the Growth of the Lithium-Ion Battery Market? Available online: https://www.greentechmedia.com/articles/read/Is-There-Enough-Lithium-to-Maintain-the-Growth-of-the-Lithium-Ion-Battery-M#gs.2gLDboM (accessed on 2 June 2018).
  8. Shahan, Z. US Electric Car Sales up 59% in January 2017. Available online: https://cleantechnica.com/2017/02/04/us-electric-car-sales-59-january-2017 (accessed on 4 February 2017).
  9. Draft Technical Assessment Report: Midterm Evaluation of Light-Duty Vehicle Greenhouse Gas. Emission Standards and Corporate Average Fuel Economy Standards for Model Years 2022–2025; EPA-420-D-16-900; U.S. Environmental Protection Agency: Research Triangle Park, NC, USA, 2016.
  10. EV Everywhere Grand Challenge Blueprint; U.S. Department of Energy: Washington, DC, USA, 2013.
  11. An, F.; Santini, D.J. Mass Impacts on Fuel Economies of Conventional vs. Hybrid Electric Vehicles; SAE Technical Paper 2004–01-0572; Argonne National Laboratory: Lemont, IL, USA, 2004. [Google Scholar] [CrossRef]
  12. Quong, S.; Duoba, M.; Larsen, R.; LeBlanc, N.; Gonzales, R.; Bultrago, C. Electric Vehicle Performance in 1994 DOE Competitions; SAE Technical Paper 950178; Argonne National Laboratory: Lemont, IL, USA, 1995. [Google Scholar] [CrossRef]
  13. Raslavičius, L.; Starevičius, M.; Keršys, A.; Pilkauskas, K.; Vilkauskas, A.J.E. Performance of an all-electric vehicle under UN ECE R101 test conditions: A feasibility study for the city of Kaunas, Lithuania. Energy 2013, 55, 436–448. [Google Scholar] [CrossRef]
  14. Jimenez-Palacios, J.L. Understanding and Quantifying Motor Vehicle Emissions with Vehicle Specific Power and TILDAS Remote Sensing. Ph.D. Thesis, Massachusetts Institute of Technology, Department of Mechanical Engineering, Cambridge, MA, USA, 1999. [Google Scholar]
  15. Qu, L.; Li, M.; Chen, D.; Lu, K.; Jin, T.; Xu, X.J.A.E. Multivariate analysis between driving condition and vehicle emission for light duty gasoline vehicles during rush hours. Atmos. Environ. 2015, 110, 103–110. [Google Scholar] [CrossRef]
  16. Kuhns, H.D.; Mazzoleni, C.; Moosmüller, H.; Nikolic, D.; Keislar, R.E.; Barber, P.W.; Li, Z.; Etyemezian, V.; Watson, J.G. Remote sensing of PM, NO, CO and HC emission factors for on-road gasoline and diesel engine vehicles in Las Vegas, NV. Sci. Total Environ. 2004, 322, 123–137. [Google Scholar] [CrossRef] [PubMed]
  17. Sripad, S.; Viswanathan, V. Performance metrics required of next-generation batteries to make a practical electric semi truck. ACS Energy Lett. 2017, 2, 1669–1673. [Google Scholar] [CrossRef]
  18. Light-Duty Automotive Technology, Carbon Dioxide Emissions, and Fuel Economy Trends: 1975 through 2017; EPA-420-R-18-001; U.S. Environmental Protection Agency: Research Triangle Park, NC, USA, 2018.
Figure 1. Scaling trend of EPA driving range (miles) per charge vs. battery capacity/vehicle curb weight (kWh/kg). Blue represents Tesla vehicles, red represents non-Tesla vehicles, circle represents short-range BEVs, and triangle represents long-range BEVs.
Wevj 09 00046 g001
Figure 2. Scaling trend of EPA city (MPGe) fuel economy with vehicle curb weight (kg). Blue represents Tesla vehicles, red represents non-Tesla vehicles, circle represents short-range BEVs, and triangle represents long-range BEVs.
Wevj 09 00046 g002
Figure 3. Scaling trend of EPA highway fuel economy (MPGe) with vehicle curb weight (kg). Blue represents Tesla vehicles, red represents non-Tesla vehicles, circle represents short-range BEV, and triangle represents long-range BEV.
Wevj 09 00046 g003
Figure 4. Scaling trend of EPA combined fuel economy (MPGe) with vehicle curb weight (kg). Blue represents Tesla vehicles, red represents non-Tesla vehicles, circle represents short-range BEV, and triangle represents long-range BEV.
Wevj 09 00046 g004
Figure 5. Correlation between EPA city mileage and EPA highway mileage for light duty BEVs.
Wevj 09 00046 g005
Figure 6. Acceleration for 0–60 mph (s) as a function of peak power from battery normalized by vehicle curb weight.
Wevj 09 00046 g006
Figure 7. Battery capacity over battery weight relationship.
Wevj 09 00046 g007
Figure 8. Effect of ambient conditions on BEV fuel economy. Yellow and green lines represent average values for MPGe at 95 F with solar load and 20 F respectively. The fuel economy was over the UDDS cycle.
Wevj 09 00046 g008
Table 1. Hypothetical calculation to design 400 miles driving range BEV.
Vehicle Weight (kg)Highway Fuel Economy (MPGe)City Fuel Economy (MPGe)Battery Capacity (kWh)Battery Weight (kg)
100010814154437
150010312181593
200098101108749
25009381135905
300088611621061
350083411891217
400078212171373

