Article

Sensitivity Analysis of the Battery Model for Model Predictive Control: Implementable to a Plug-In Hybrid Electric Vehicle

1
Energy Production and Infrastructure Center, University of North Carolina, Charlotte, NC 28223, USA
2
Center for Advanced Vehicular Systems, Mississippi State University, Starkville, MS 39759, USA
3
Electrical and Computer Engineering Department, California State University, Los Angeles, CA 90032, USA
*
Author to whom correspondence should be addressed.
World Electr. Veh. J. 2018, 9(4), 45; https://doi.org/10.3390/wevj9040045
Submission received: 11 September 2018 / Revised: 29 October 2018 / Accepted: 30 October 2018 / Published: 6 November 2018

Abstract

:
Developing an efficient online predictive modeling system (PMS) is a major issue in the field of electrified vehicles as it can help reduce fuel consumption, greenhouse gasses (GHG) emission, but also the aging of power-train components, such as the battery. For this manuscript, a model predictive control (MPC) has been considered as PMS. This control design has been defined as an optimization problem that uses the projected system behaviors over a finite prediction horizon to determine the optimal control solution for the current time instant. In this manuscript, the MPC controller intents to diminish simultaneously the battery aging and the equivalent fuel consumption. The main contribution of this manuscript is to evaluate numerically the impacts of the vehicle battery model on the MPC optimal control solution when the plug hybrid electric vehicle (PHEV) is in the battery charge sustaining mode. Results show that the higher fidelity model improves the capability of accurately predicting the battery aging.

1. Introduction

To reduce fuel consumption, greenhouse gasses (GHG) emission and battery aging, researchers have formerly investigated new power management designs [1,2] as the main technology for future electrified vehicles. Various on-line and off-line control strategies have been examined for enhancing the efficiency of power distribution in-between onboard power/energy sources. Model Predictive Control is accepted as a general optimization-based control design for online PMS. The first implementation of MPC goes back to the 1980s in process industries for oil refineries and power plants [3,4]. Currently, MPC is developed for online vehicle management systems in both hybrid electric vehicles (HEVs) and plug-in HEVs (PHEVs) [5] and equivalent fuel consumption minimization strategy (ECMS)-based [6,7,8] is recognized as the main on-line management design for HEVs. In [9], an MPC aims at maximizing the overall power efficiency of a series HEV. In [10], an MPC minimizes the cost of the energy use for a series PHEV based on the fluctuating price of electricity and gas. In another publication, engine transient characteristic is integrated into an MPC for parallel HEV [11]. In other papers [12,13], the goal of MPC is to decrease the energy usage and CO2 emissions.
In real-time application, the process of modeling represents the most critical point of any MPC algorithm design [14]. The model accuracy, by imitating the system behavior adequately, may greatly impact the performance and the reliability of the control design as it offers the significant information to track current system states and forecast future system actions. At the same time, as an optimization-based control, the MPC performance relies on solving a linear/nonlinear programming problem at each sample time. It then becomes obvious that the computational burden of the control solution has to be directly related to the system model fidelity as well. This is why choosing a pertinent compromise between computational complexity and model accuracy is one of the major decisions that needs to be made during the MPC design stage.
In the manufacturing and chemical industry, a convenient solution to this problem during the MPC design has been found [15,16,17,18,19,20]. In fact, plant dynamics are modeled by linear equations and once the model-plant mismatch appears, a simple re-identification of the model parameters is performed. This way, the accuracy of the model is guaranteed over time for a relatively low computational complexity as the form of the plants dynamics is based on linear equations. However, in automotive application, the issue is fairly different. Rather than looking for clues to determine and analyze the model-plant mismatch at the time control performance degrades, this manuscript attempts to provide a method and highlights quantifiable metrics to help choose a model allowing the MPC to perform with adequate accuracy and computational efficiency when different model fidelities are available.
In automotive related scenarios provided in the literature such as [21,22], ad-hoc experiments need to be performed to conclude if a definite level of model fidelity can fit the criteria for a specific control design. However, to the authors’ understandings, no peculiar research effort has yet been performed to analyse this correlation comprehensively whereas it is a crucial concern for practical and real-time design of vehicle powertrain control. For instance, in papers [9,10,11,12,13], the effects of a new objective have been studied, but no consideration is given to the potential gain in MPC performance of using a high-fidelity battery model. In fact, battery models usually implemented in MPC are less accurate than the one presented in [23] for automotive applications. Most of the time, for MPC purposes, the battery model is restricted to an equivalent series resistance impedance model.
To address the challenges summarized above, the main contribution of this manuscript consists of quantifying the effect of different battery models of a PHEV on the performance of the MPC controller through a sensitivity analysis when the PHEV is in the battery charge sustaining mode. The MPC controller intends to diminish simultaneously the battery aging and the equivalent fuel consumption. In this manuscript, we aim to refine and extend the previous effort presented in [24] focusing on the impact of the battery model fidelity on the MPC controller performance in a more comprehensive and meaningful way. More specifically, we have extended the look-ahead horizon and the engine speed variation considered in the controller design to provide a more accurate and close-to-reality driving scenario in which such a PHEV is commonly operated. We added the quantitative comparison of computational effort along with the comparison of battery model fidelity to accurately portray the impacts of model complexity. To adapt to the aforementioned changes, we have also updated the proposed methodology to provide additional details and eliminate preliminary assumptions made in [24] that simplified the analysis process. Thus, new results, evidence, and insights are obtained and presented in this manuscript to further support the conclusion drawn.
The remainder of the manuscript is organized as follows. In Section 2, a description of the PHEV model studied is given. In Section 3, the MPC strategy is detailed. In Section 4, the different battery models on MPC are described. Finally, the simulation results and the conclusions are provided in Section 5 and Section 6 respectively.

2. Vehicle Model

2.1. Overview

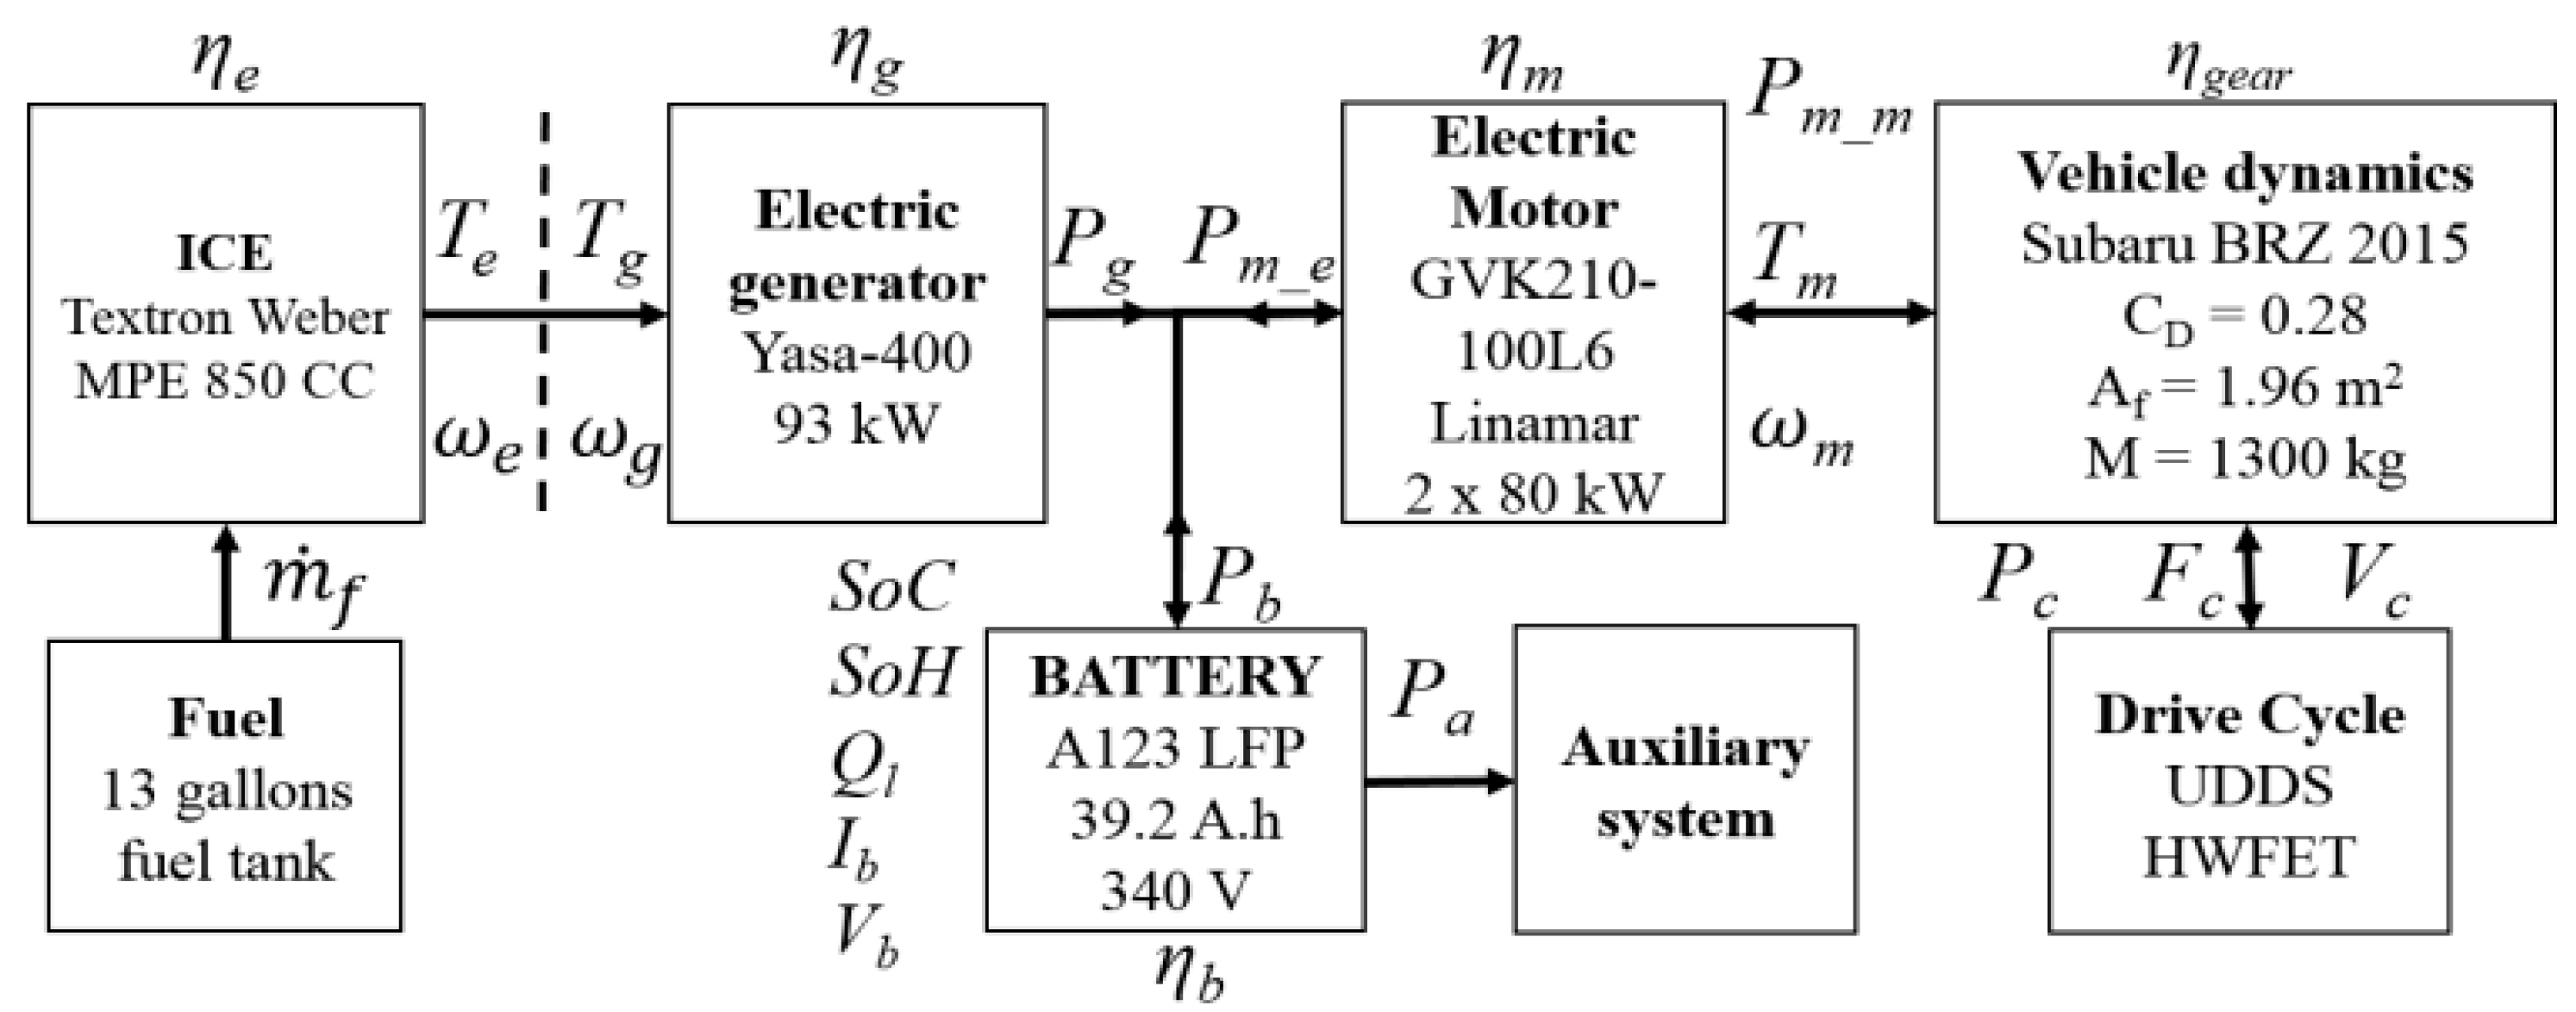
The vehicle shown in Figure 1 has already been described in [24,25,26,27]. It is a series PHEV and its powertrain is composed of an electric generator, an Energy Storage System (ESS) made of a lithium iron phosphate battery, and an electric motor connected to a DC bus. The schematic and specifications of the vehicle model are given in Figure 2 and Table 1.

2.2. Vehicle Dynamics Model: State Space Equations

This section details the vehicle dynamic equations. The nomenclature is provided at the end of this manuscript. The power that the vehicle powertrain has to provide can be computed as follows:
P c ( t ) = [ F r ( t ) + F g ( t ) + F w ( t ) + F a ( t ) ] v c ( t )
The rolling resistance of the vehicle is defined by Equation (2):
F r ( t ) = ( C r 0 + C r 1 [ v c ( t ) 44.44 ] 1.2 ) Mg cos ( α ( t ) )
The grading resistance of the vehicle is defined by Equation (3):
F g ( t ) = Mg   sin   ( α ( t ) )
The aerodynamics drag resistance is defined as follows:
F w ( t ) = 0.5   ρ a ( t )   A f   C D   ( v c ( t ) ) 2
The vehicle’s acceleration resistance is defined by Equation (5):
F a ( t ) = [ M + M i ] v ˙ c ( t )
The electric motor power demand at the wheels can be calculated by Equations (6) and (7):
P m _ m ( t ) = { P c ( t ) / η gear , if   P c ( t )   0 (6) P c ( t )   η gear , if   P c ( t ) < 0 (7)
The motor speed and torque are computed as follows:
ω m ( t ) = v c ( t ) ε 0 / rd .
T m ( t ) = P m _ m ( t )   / ω m ( t )
The electric power requested by the electric motor is computed as follows:
P m _ e ( t ) = { ω m ( t )   T m ( t ) η m ( ω m , T m )   , if   P m _ m ( t ) 0 (10) ω m ( t ) T m ( t ) η m ( ω m , T m ) , if   P m _ m ( t ) < 0 (11)
The motor efficiency ηm is computed by interpolating the manufacturer look-up table over torque and speed. The electric power generated by the electric generator can be computed as follows:
P g _ e ( t ) = T g ( t ) ω g ( t )   η g ( ω g , T g )
ω g ( t ) = ω e ( t )
The generator efficiency ηg is calculated by interpolating the manufacturer look-up table over torque and speed. The speed of the engine is already known as it is controlled by the MPC. Only the engine torque needs to be computed. In a discrete domain, it can be computed by Equation (14):
T e ( t + Δ t ) = J f l w h l ω e ( t + Δ t ) ω e ( t ) Δ t + T g ( t + Δ t ) .
The fuel consumption is then computed by interpolating the manufacturer look-up table over engine torque and speed.

3. Model Predictive Control Strategy

3.1. Overview

In this section, the MPC-based control strategy is explained. The primary module, presented in Figure 3, is composed of an input generator, a vehicle dynamic model, an optimization solver, an objective function, and an environment speed profile. The inputs generator contains all the possible control inputs that the MPC algorithm can select. The vehicle dynamic model, detailed in Section 2.2, represents mathematically the real vehicle behavior. The optimization solver aims at determining the associated control inputs that minimize the objective function within the minimum computation possible. The environment speed profile provides the forecasted linear vehicle speed.
In this manuscript, the vehicle dynamic model is described by state space equations in the following general form:
X ( t + Δ t ) = F ( X ( t ) ,   U ( t ) ,   W ( t ) )
In this study, X, U and W represents respectively the states variables produced by the vehicle dynamic model, the two control inputs, the engine speed ω e ( t ) and generator torque T g ( t ) , and the disturbance vector, the linear vehicle speed. Using the predicted speed for next time instant and the current feedback measurements from the vehicle physical model, the vehicle dynamic model estimates the next state variables regarding the control inputs. Then the objective function is computed using the predicted vehicle state variables for the next time instant and the current control inputs for the whole prediction horizon. Finally, the associated control inputs minimizing the objective function are selected by the optimization solver. The following constraints are considered for this paper:
0 N.m ≤ Tg (t) ≤ 70 N.m
1500   rpm ω e ( t ) 6000   rpm

3.2. Objective Function

The objective of the controller is to optimize the performance of the vehicle in terms of battery aging and fuel consumption. It considers the fuel consumption, the power going through the battery and the battery aging. This objective function is minimized for the prediction horizon and is calculated through Equation (18)
J ( t + Δ t ) = J ( t ) + m ˙ f ( t ) e d _ f Δ t + P b ( t ) Δ t + EOL st EOL ev [ Q l ( t + Δ t ) Q l ( t ) ] ε gate   E b
The battery aging has been linked to the vehicle energy consumption through Equation (18). To do so, it has been assumed that each degradation of the battery is equivalent to the amount of energy required to process the building of a battery. This amount of energy is equal to [ Q l ( t + Δ t ) Q l ( t ) ] . Furthermore, an adjustment factor equal to EOL st EOL ev is used to take into account the capacity fade percentage from which the battery reaches the end of life (EOL). An EOL of 20% for HEVs and 50% for stationary application has been chosen. Then, a coefficient to link the nominal energy capacity of the battery ( E b ) and the required energy to build the battery is used. It is named the cradle to gate embodied primary energy per unit of electrical energy capacity, noted ε gate , and is described precisely in [28].

3.3. Optimization Solver

Once the optimization problem is formulated based on the previous discussion, a numerical solver is needed to solve it and provide the control solution. In this manuscript, the function “fmincon”, included in the Matlab Global Optimization Toolbox, is used [29]. As a gradient-based algorithm, “fmincon” is adequate to find a local minimum of a constrained nonlinear multivariable function if it is smooth. It has been preferred to a standard tree search algorithm [30], such as a pruning tree search, to speed up the search of the optimal solution. This way, the prediction horizon of the MPC can be increased to more than one lookahead step. As a gradient-based algorithm, “fmincon” is adequate to find a local minimum of a constrained nonlinear multivariable function if it is smooth. Moreover, if the function is convex, the minimum found would be necessarily global. Furthermore, the “fmincon” function has already been used in [31] for a similar problem as the one described in this paper. Parameters of “fmincon” have been selected such that the computation does not take more time to compute than the simulation time. Those parameters are described in Table 2.

4. Battery Models for the Sensitivity Analysis

4.1. Methodology

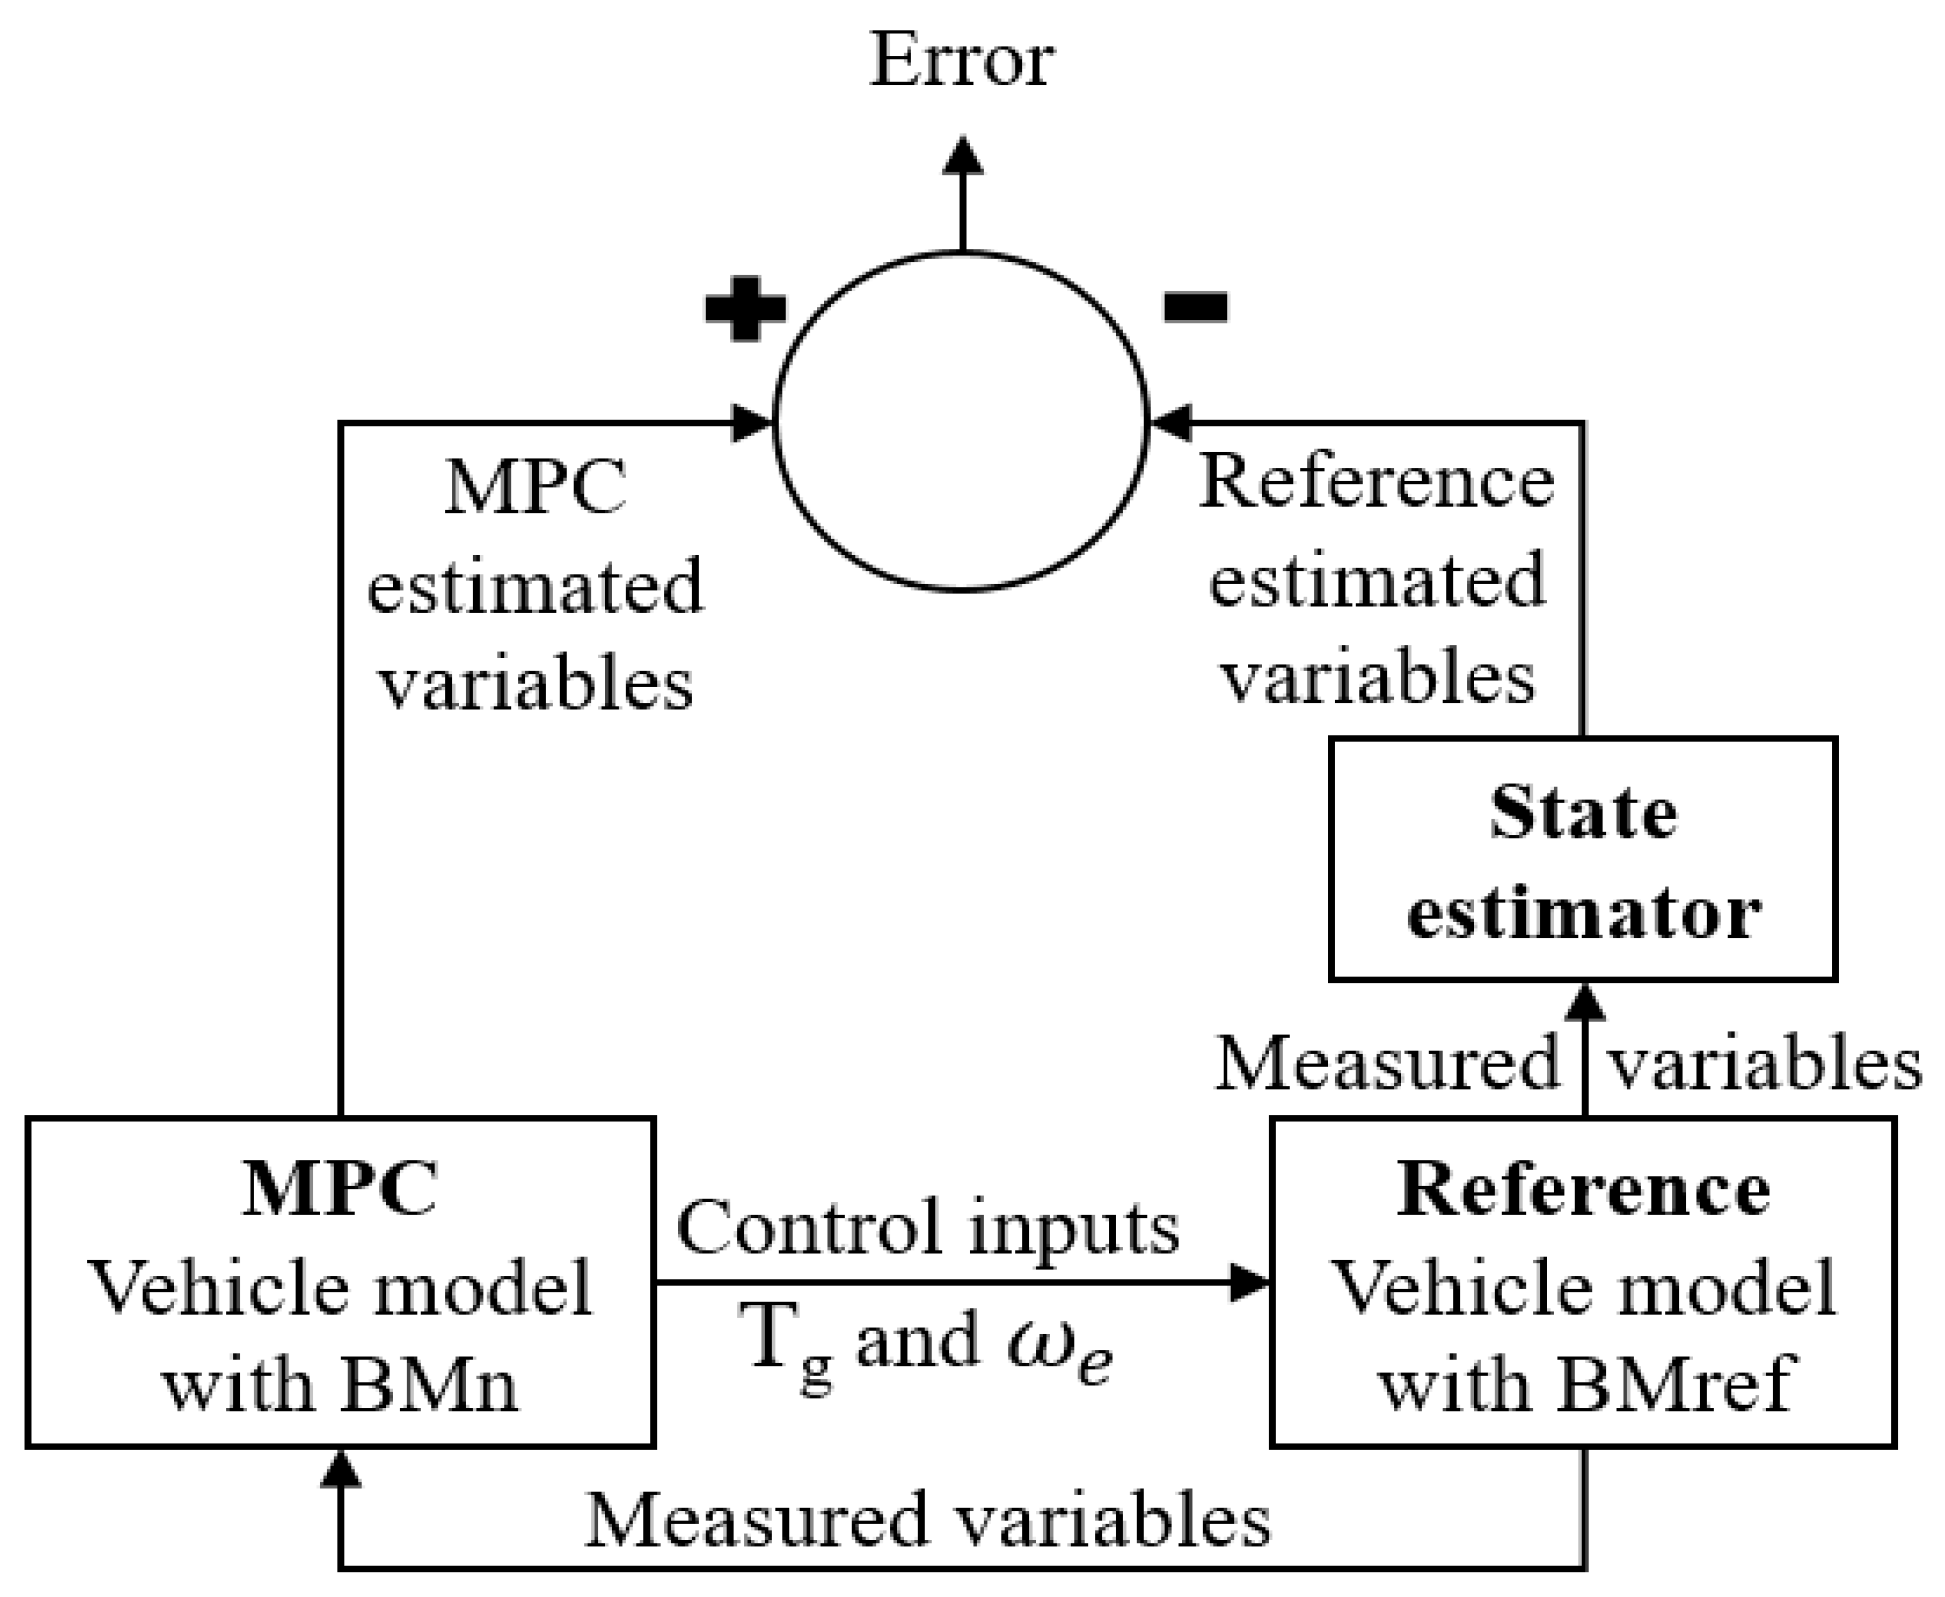
This section describes the methodology employed to investigate the effect of model fidelity on MPC performance (cf. Figure 4). It is considered that the real vehicle behaviors can be fully duplicated by the vehicle model using the highest battery fidelity model, denoted “BMref”. This reference vehicle model has been developed and validated in [25]. At the MPC controller side, the vehicle model uses different battery fidelity model, denoted “BMn”. A more precise description of those different battery models is provided in the next section. It can be noticed that the only difference between the MPC and the reference vehicle model is the battery fidelity model. This way, this sensitivity analysis can capture precisely the impact of the battery model fidelity on the performance of the MPC controller.
Since precise on-line estimation of the capacity fade or battery SoC are not available from the BMS, only measurable variables from the vehicle are fed back to the MPC algorithm, where the problem of internal state variable estimation from measured data is handled with a separate state estimator module. Then estimated variables, such as the battery aging, the SoC, or the objective function, computed by the MPC controller is compared to the ones produced by the reference vehicle model, and the absolute error is calculated.
To simulate the only realistic scenario for this manuscript, it is assumed that the linear vehicle speed can be precisely forecasted only 10 s ahead. As the MPC intends to minimize an objective function summing the equivalent fuel consumption and the battery aging, it makes sense that such a controller is only relevant while the battery is in charge sustaining mode. Indeed, during the battery depletion mode, only the battery is used and the engine is switched-off. Consequently, in this case, the MPC cannot have any influence on the vehicle powertrain: the fuel consumption is null and the battery aging only depends on the linear vehicle speed. This is why the following constraint is considered in this manuscript:
15 % SoC ( t ) 20 %
In fact, to make the MPC worth for a full SoC interval, it is necessary to predict the linear speed of the vehicle at least an hour in advance, which is unrealistic. In addition, the vehicle model state time has been set for 1 s, meaning that the speed profile received by the MPC algorithm is sampled once every second. The vehicle states update time has been fixed at 10 s, meaning that the vehicle is feeding back measured data every 10 s, at the beginning of every MPC controller prediction.

4.2. Development of Battery Models

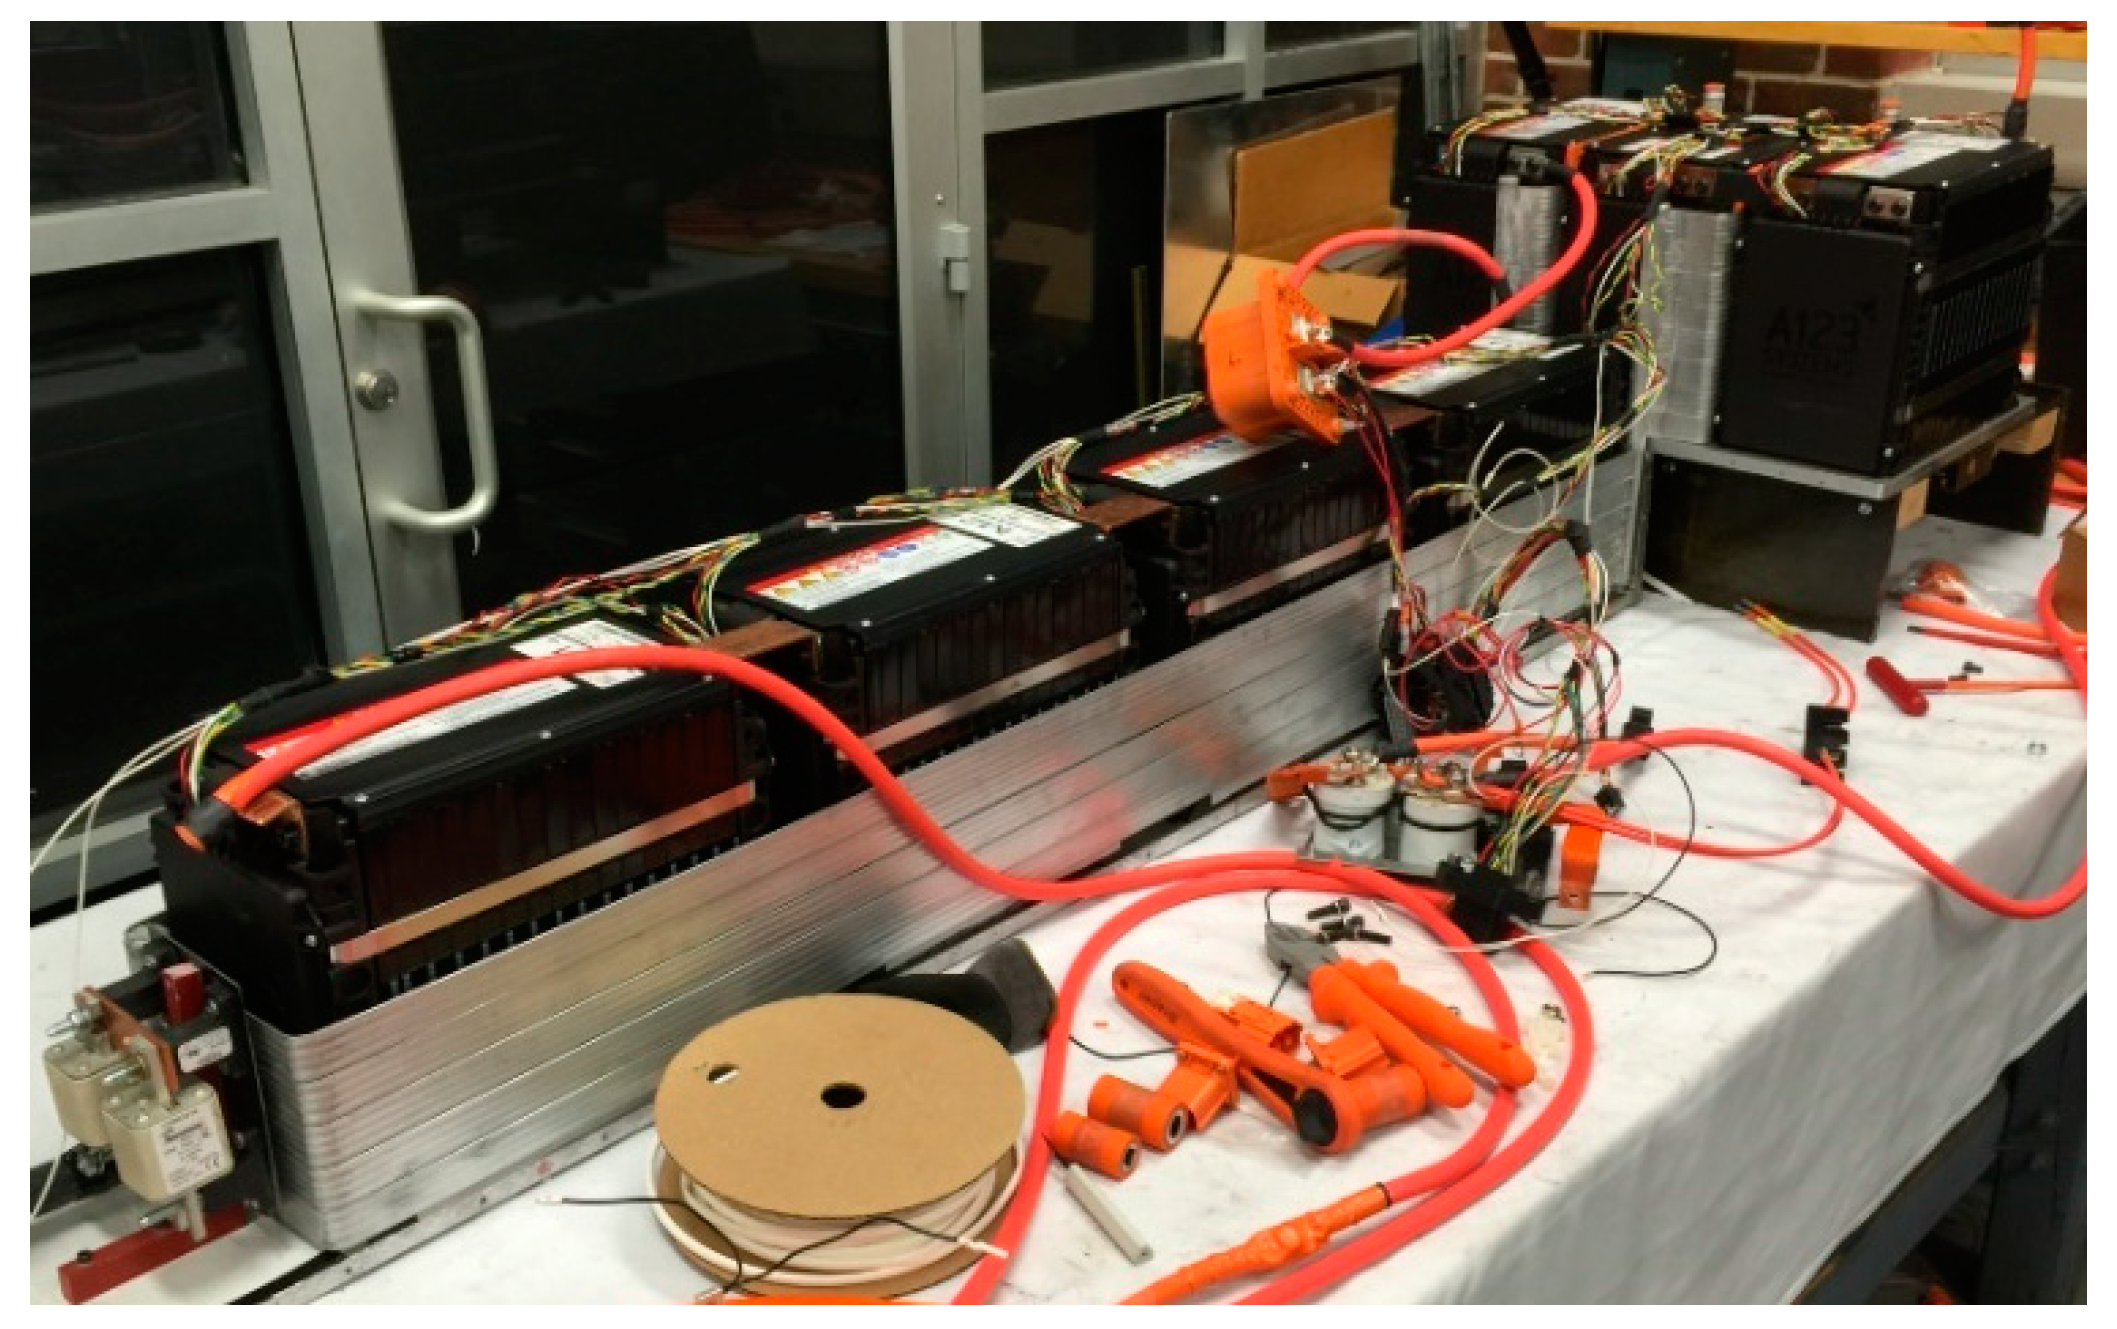
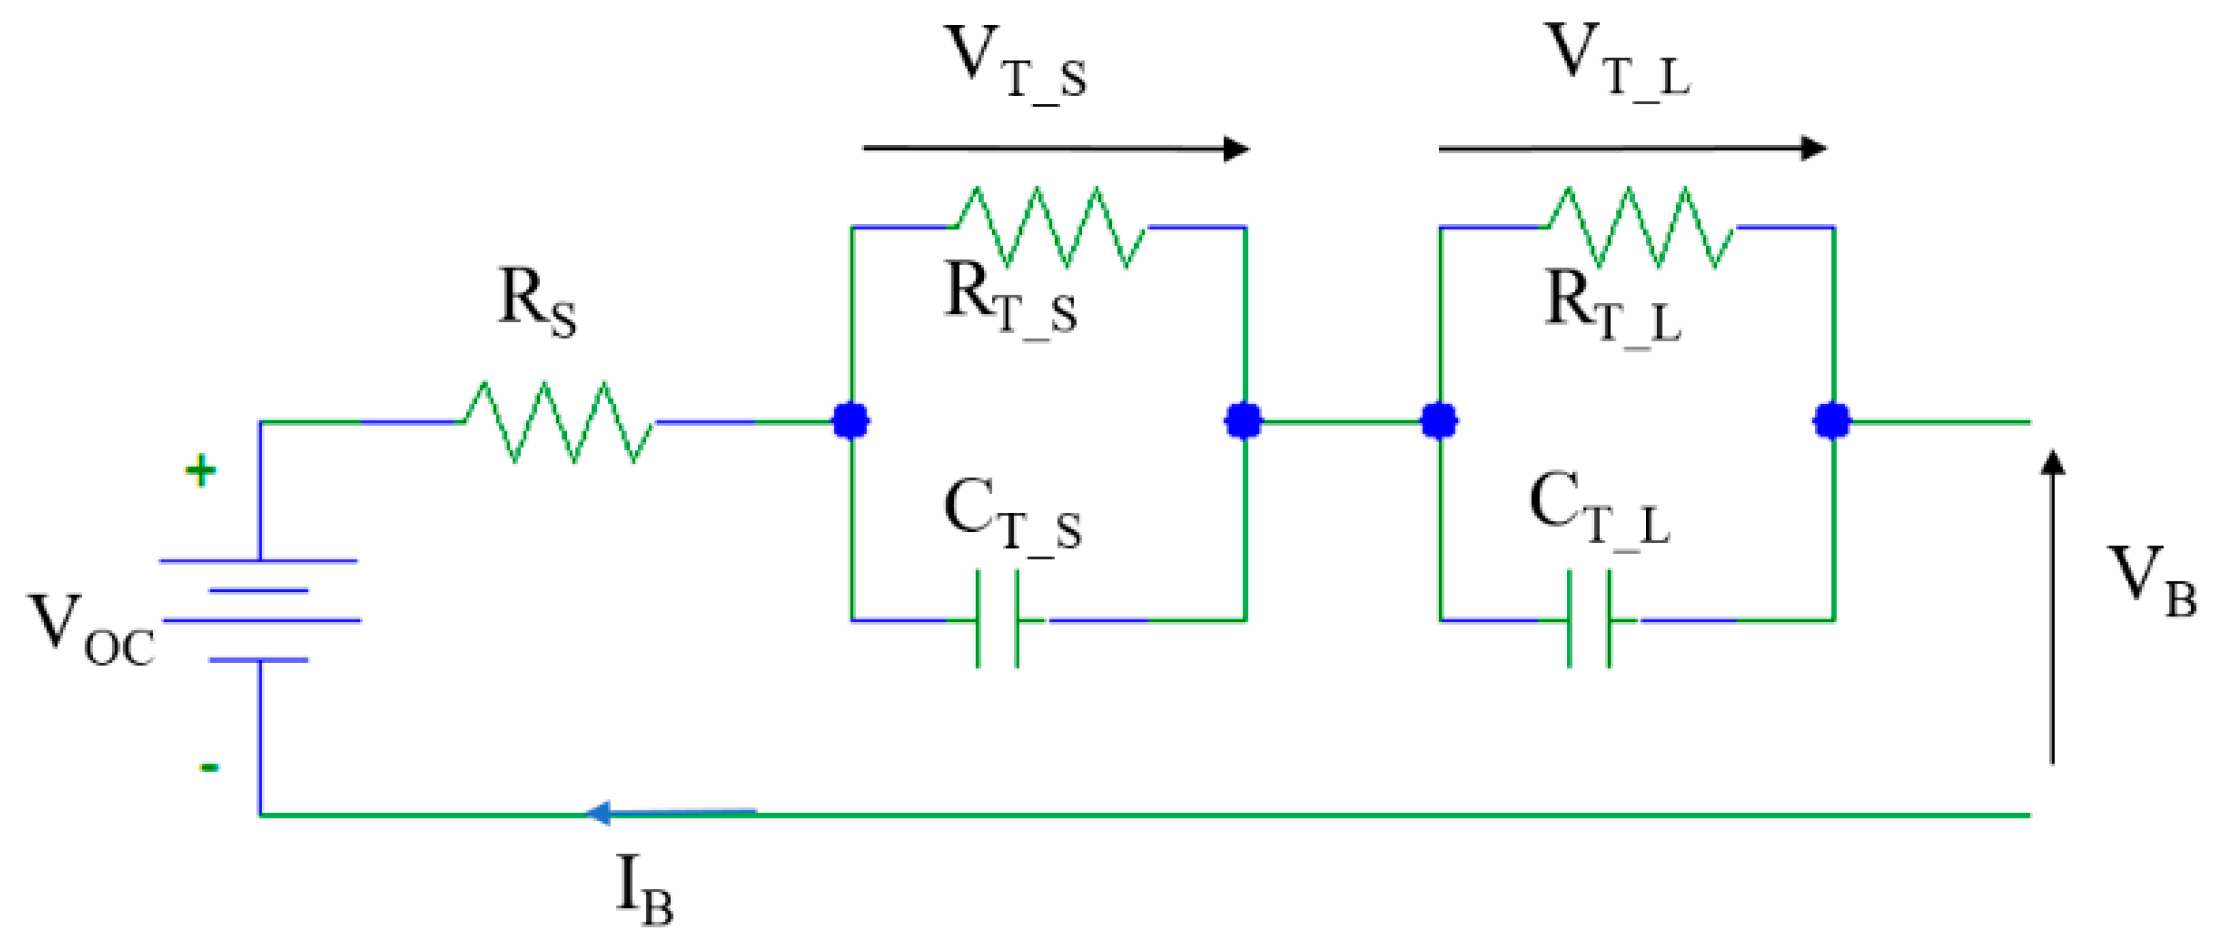
To reproduce the battery dynamic precisely (see Figure 5), an equivalent series resistance in series with two Resistances/Capacitances network, as drawn in Figure 6, is regularly adopted to design a battery impedance model for automotive applications [32,33,34,35,36].
To demonstrate the effect of model fidelity, different battery models, from the lowest to the highest fidelity, denoted from “BM1” to “BM5” and “BMref”, are used in the dynamic vehicle models within the MPC. For BM1, the battery model is reduced to its constant nominal voltage. For BM2, the battery model is simplified to its open circuit voltage, which depends on the battery SoC. The open circuit voltage of the battery, g(SoC), is a polynome of order eight evolving over the SoC [37]. For BM3, an internal resistance model is considered with a constant equivalent resistance value. BM4 is equivalent to BM4 at the difference that the equivalent resistance value is a function of SoC (f(SoC)) provided by the battery manufacturer A123 Systems. BM5 is a one RC network model, whose data come from [38,39]. Finally, BMref is a two RC network model, whose data comes from [25]. The specifications of those battery models are detailed in Table 3.

4.3. Battery Dynamics Model Equations

The power provided or received by the battery is computed as follows:
P b ( t ) = { [ P m _ e ( t )     P g _ e ( t ) + P a ] η b if   P b ( t ) 0 (20) η b [ P m _ e ( t ) P g _ e ( t ) + P a ] if   P b ( t ) < 0 (21)
In Equations (20) and (21), the battery is charging when Pb is negative and is discharging when Pb is positive. The battery current is then computed as follows:
I B ( t + Δ t ) = P b ( t + Δ t ) V B ( t )
Here, I B ( t + Δ t ) is computed by using V B ( t ) whereas, in theory, V B ( t + Δ t ) is necessary because V B ( t + Δ t ) is unknown at this stage. However, as the voltage varies slowly over time and Δ t is small enough (1 s), the inaccuracy caused by this approximation should be negligible. Then, V B ( t + Δ t ) is calculated through Equations (23)–(25):
V T _ S ( t + Δ t ) = V T _ S ( t ) [ 1 Δ t R T _ S   C T _ S ] Δ t   I B ( t ) C T _ S
V T _ L ( t + Δ t ) = V T _ L ( t ) [ 1 Δ t R T _ L   C T _ L ] Δ t   I B ( t ) C T _ L
V B ( t + Δ t ) = V OC ( t + Δ t ) R S   I B ( t + Δ t ) + V T _ S ( t + Δ t ) +   V T _ L ( t + Δ t )
For every battery model, The SoC is computed by the Coulomb counting Equation (26) in the discrete time domain
SoC ( t + Δ t ) = SoC ( t ) I b ( t )   Δ t 3600   ( 1 Q l ( t ) )   C b

4.4. Aging of Battery Models

Through Equations (27)–(32), the battery capacity fade is computed as a function of the temperature, the cumulative SoC variation, and the C-rate. Those equations come from [40].
Δ SOC ( t ) = [ Q l ( t ) / B ( t ) exp ( E a ( t ) R   T bat ( t ) ) ] 1 / z
Δ SOC ( t + Δ t ) = Δ SOC ( t ) + | SOC ( t + Δ t ) SOC ( t ) |
Q l ( t + Δ t ) = B ( t ) exp ( E a ( t ) R   T bat ( t ) ) ( Δ SOC ( t + Δ t ) ) z
B ( t ) = f ( C rate ( t ) )
E a ( t ) = 31700 + 370.3   C rate ( t )
C rate ( t ) =   | I b ( t ) | C b   ( 1 Q l ( t ) )
According to paper [40], the value of z is 0.55. In this manuscript, the B value is linearly interpolated as a function of C-rate using data given in [40], leading to Equation (30). The C-rate is defined through Equation (32). Δ SOC ( t ) is recomputed at every instant t (Equation (27)), to match the equivalent cumulative SoC the battery would have been through if the temperature and Crate were constant and equal to the current temperature and Crate, knowing the battery capacity fades at time instant t. This way the battery aging model takes into account the history of the battery (previous current and temperature).
As a BMS regulates homogenously the current going through the different battery, it can be expected that the aging of cells is similar throughout the battery pack. Consequently, it can be assumed that the capacity fade should be identical for two batteries with the same chemistry (LiFePO4) and manufacturer (A123) exposed to the same discharge and charge conditions (depth of discharge (DOD), C-rate, number of cycles, temperature, etc.) independently of their nominal capacity.

5. Simulation Results

The sensitivity analysis has been conducted for two cases. The first one has been done while running two consecutive Urban Dynamometer Driving Schedule (UDDS) drive cycles and the second while running two consecutive Highway Fuel Economy Test (HWFET) drive cycles. The conclusions are the same in both cases, but both results are presented in this manuscript. The look-ahead step time has been fixed at 10 s for both cases.
The different figures in this section show the error between the estimated variables such as the SoC, the fuel consumption, the SoH and the cost function, computed by the MPC and those computed by the vehicle with the highest battery fidelity, the latter are treated in this study as the known values.
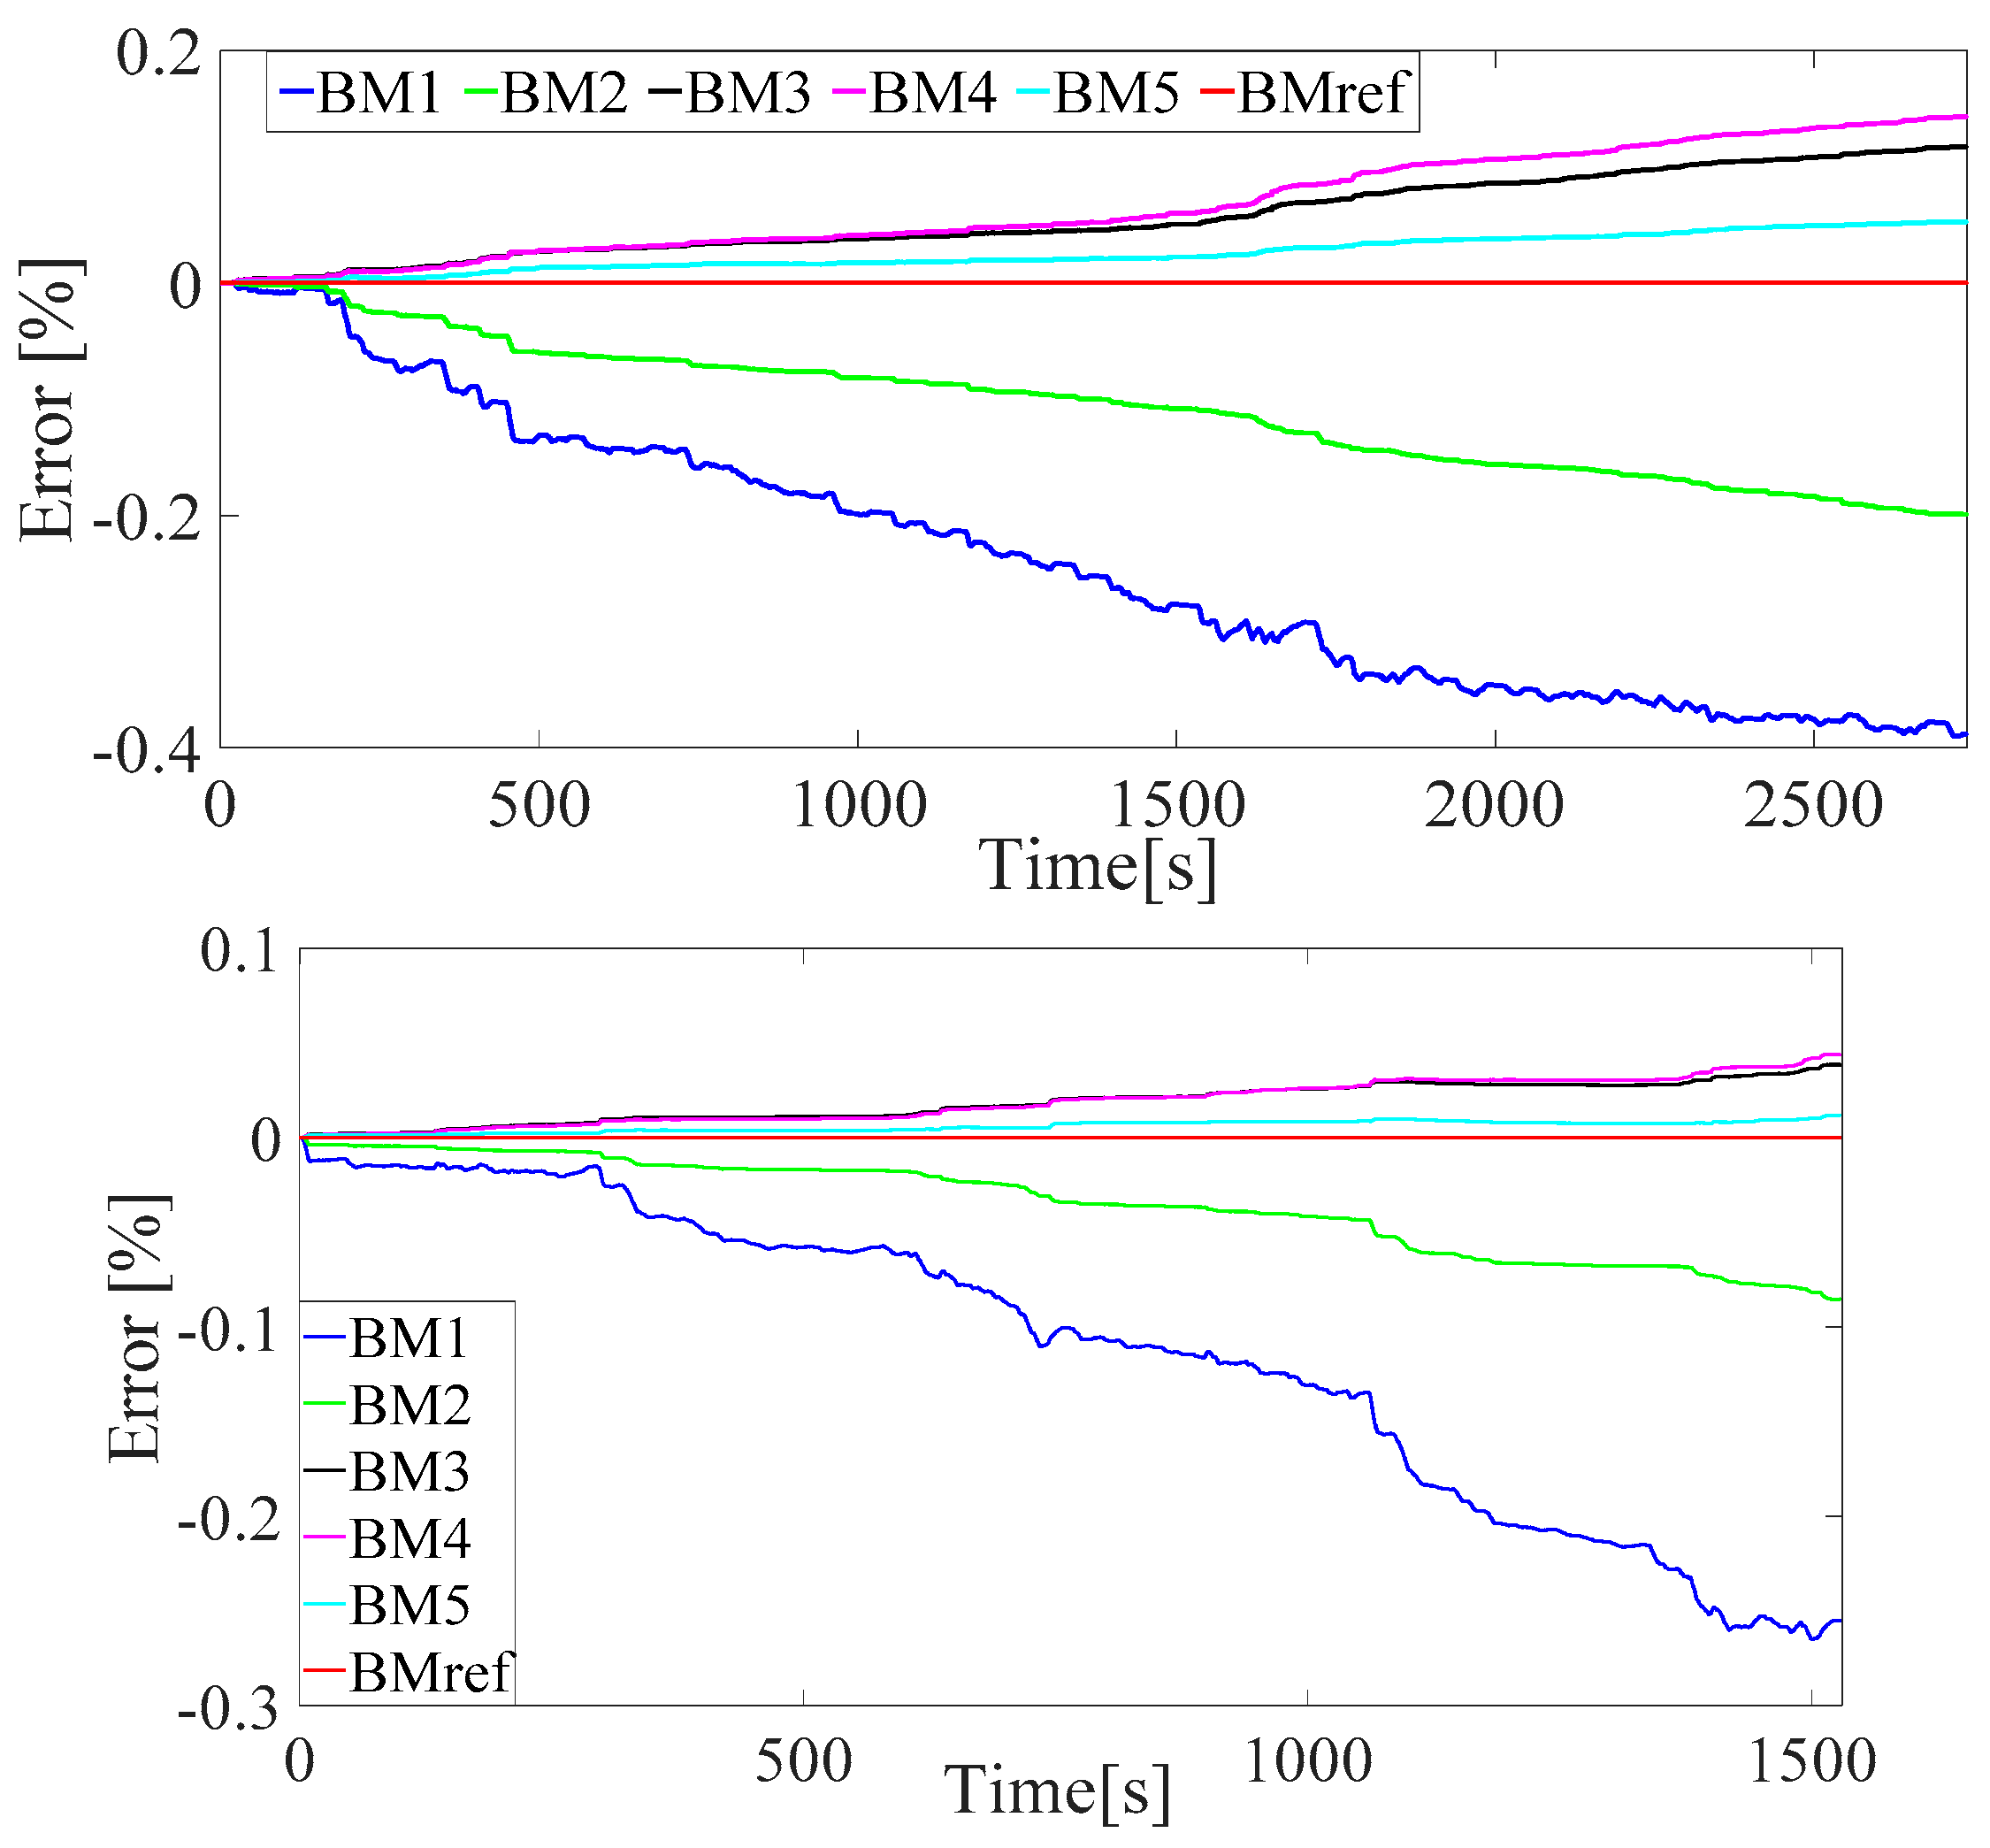
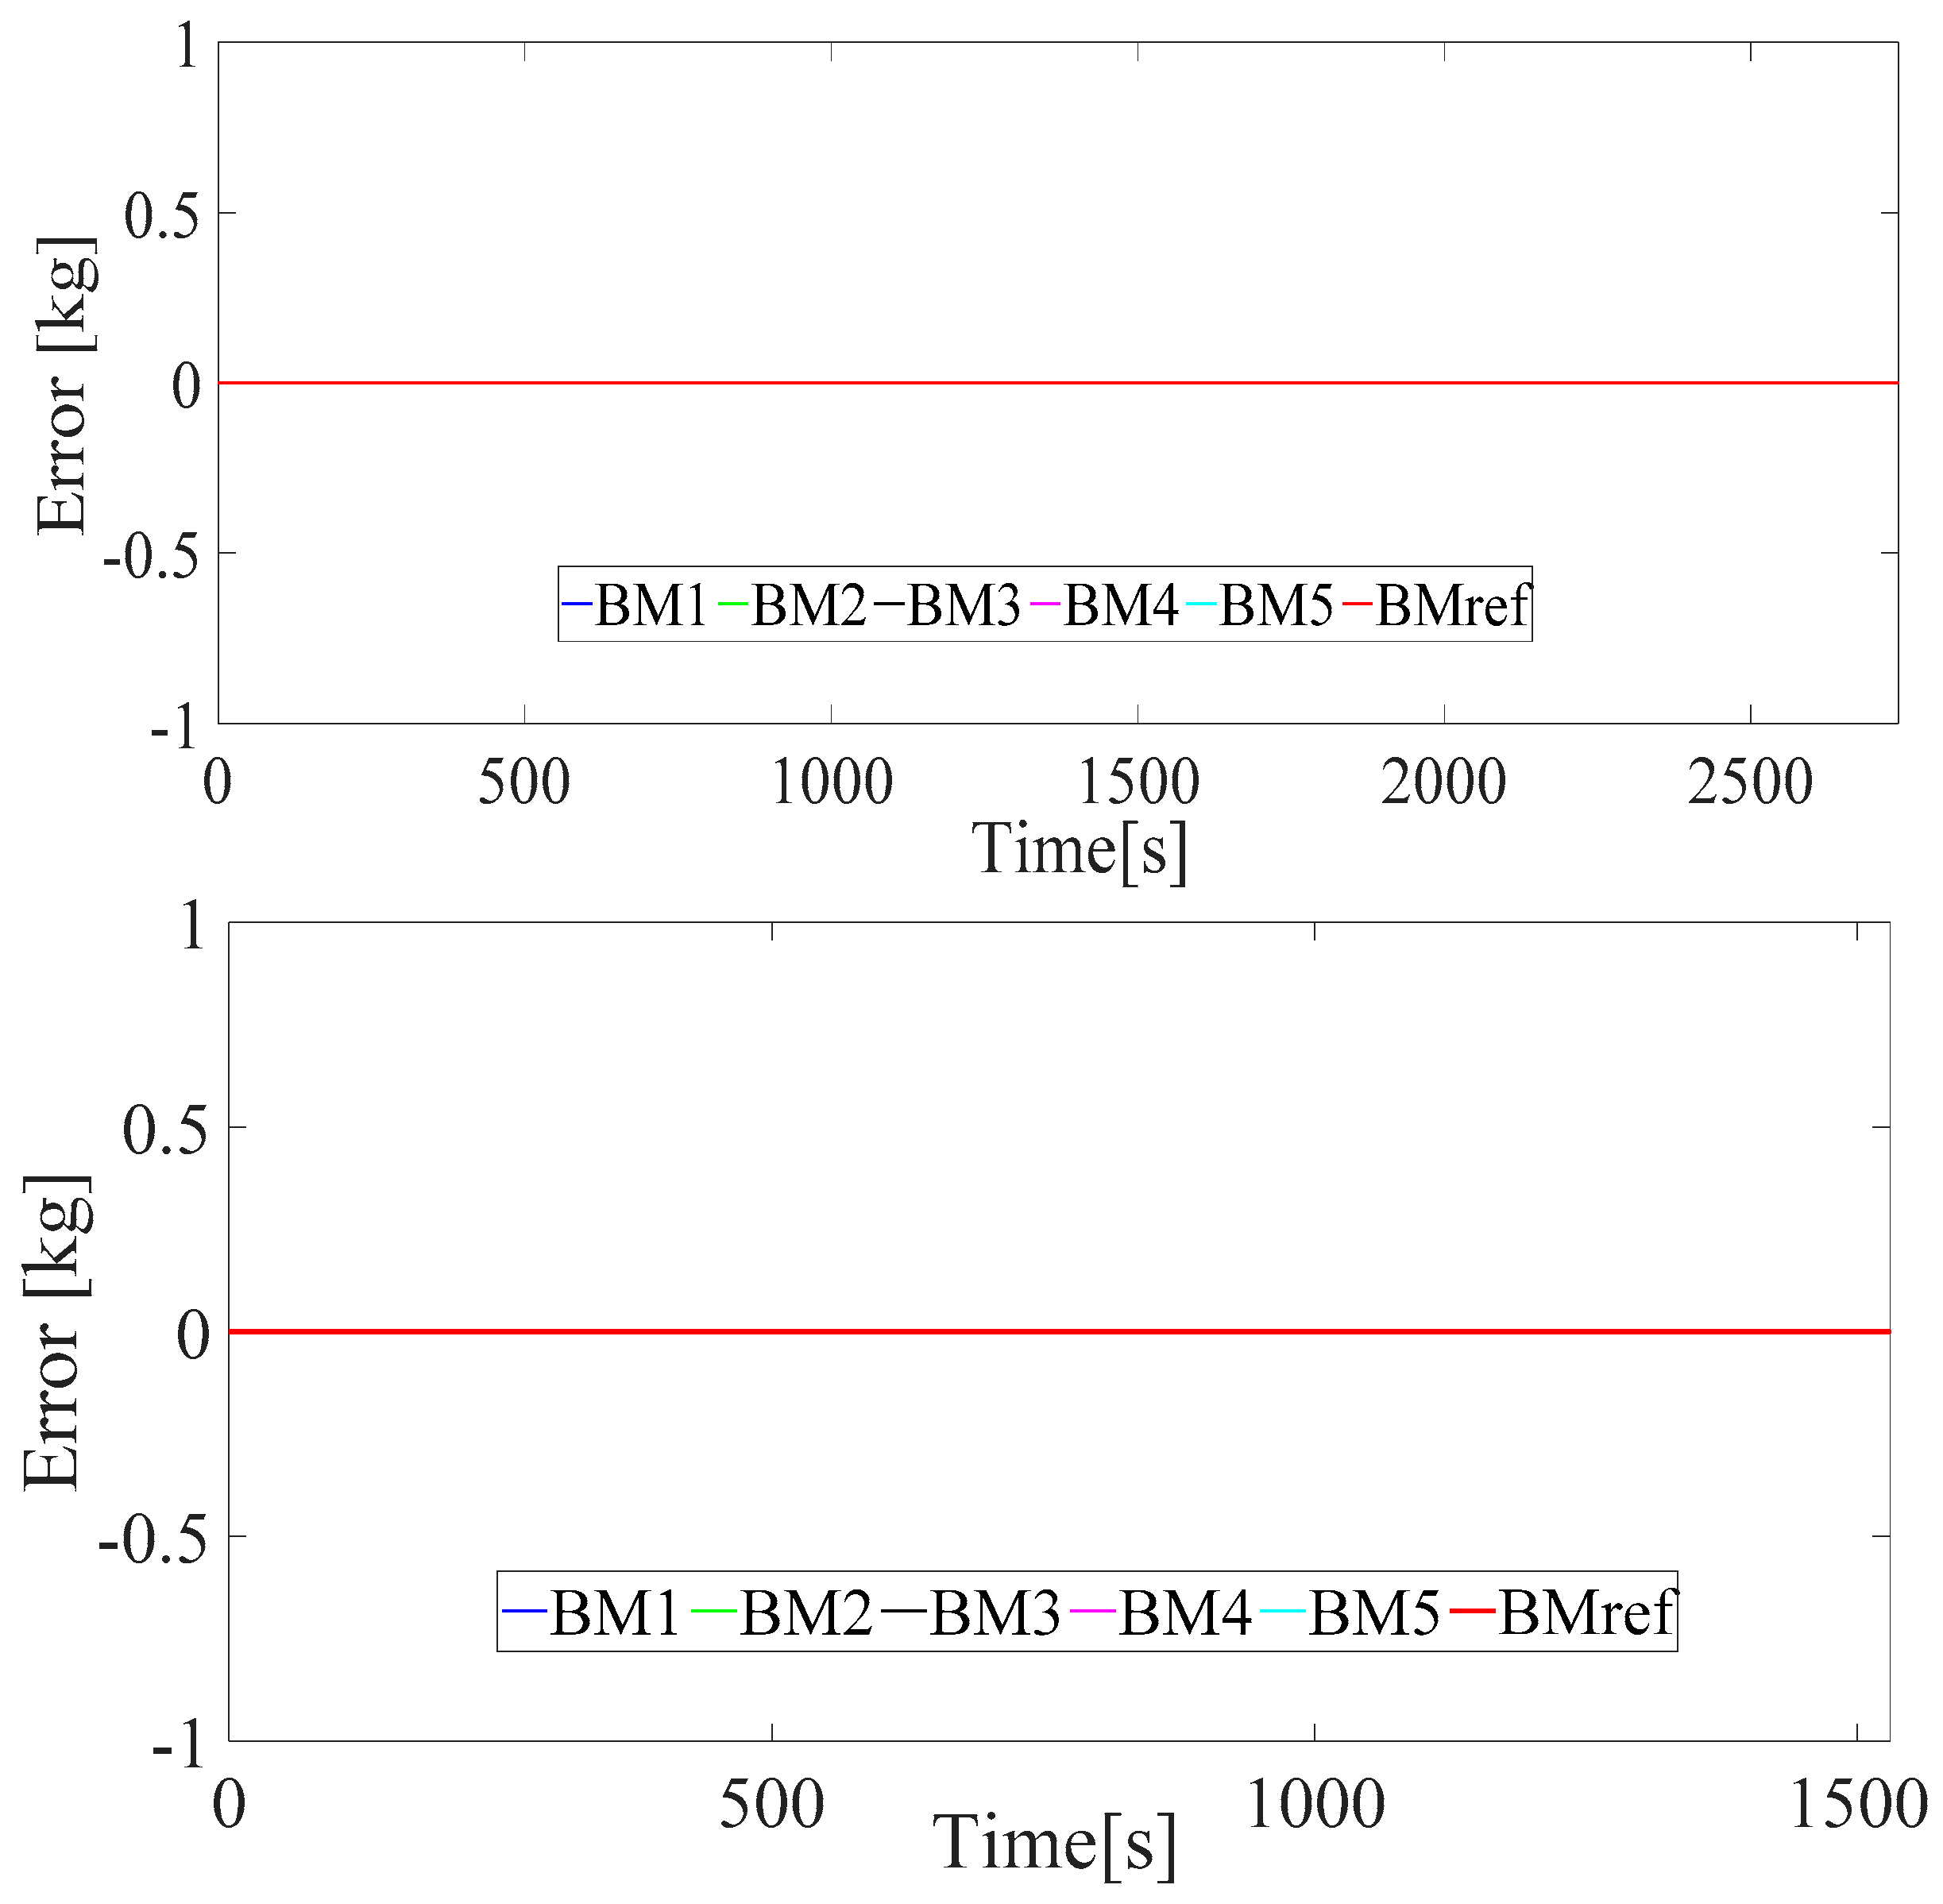
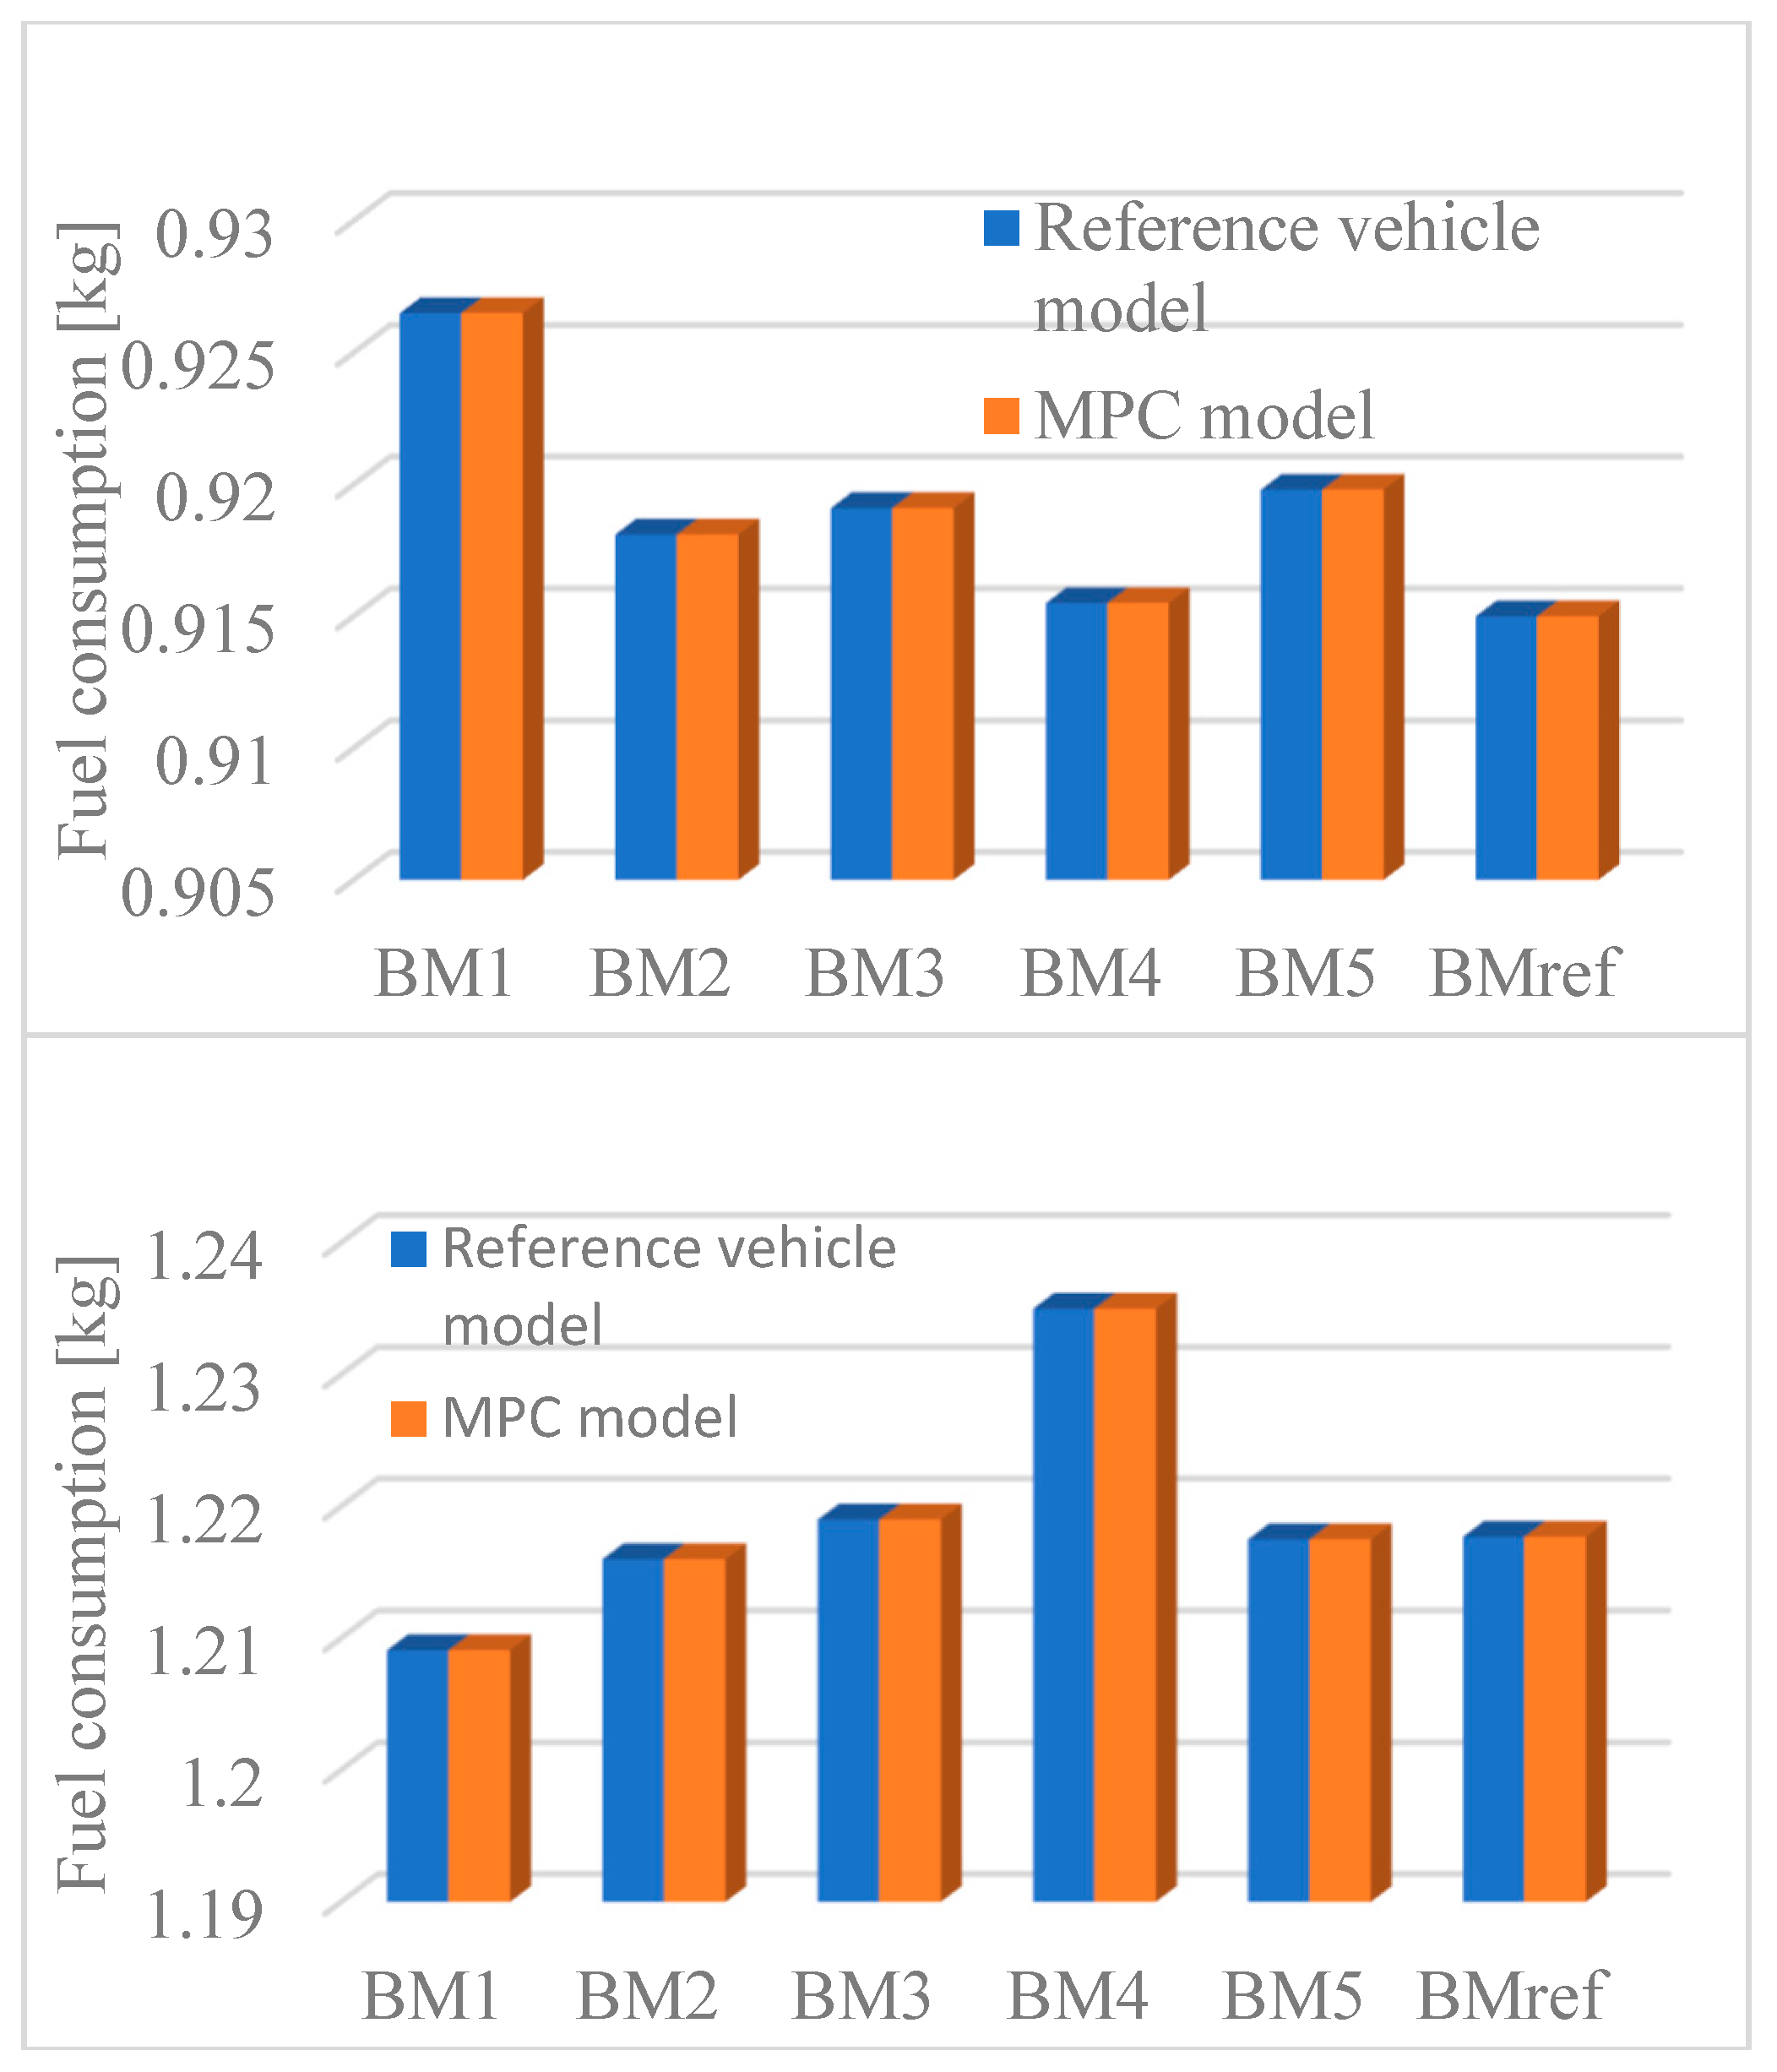
From Figure 7 to Figure 13, some conclusions can be drawn. First of all, it can be observed that the battery model only has an impact on the estimated state directly related to the battery model such as SoC, SoH and the objective function. However, the fuel consumption is only dependent on engine speed and torque, which are entirely managed by the MPC control inputs (generator torque and engine speed). The link between those control inputs and battery states only exists through the SoC constraint and the objective function written respectively in Equations (19) and (18). In fact, difference in fuel consumption between the model and the reference vehicle can only be due to imprecision in the engine model given in Section 2.2. This explains why the fuel consumption at the MPC level does not differ from the fuel consumption at the reference vehicle level in this study. However, if both the model and reference battery are different, both energy consumptions are different. As it has been shown and proved that model and reference vehicle fuel consumption are the same, it follows that only the battery can compensate the difference between the energy required by the MPC and the one needed by the real vehicle. It can even be concluded that if the battery model overestimates/underestimates the battery energy losses, the MPC will order more/less energy coming from the engine than the one really needed, and so the reference battery will save/provide this extra-energy. As a consequence, the current going through the reference battery and its SoC is higher/lower than the ones computed by the MPC. This is why the following causal link is true: the lower the vehicle model fidelity, the larger the gap between reference current and SoC and the ones computed by the MPC. It follows that lower model fidelity could lead to the violation of the SoC constraints, which is not desirable. In fact, this constraint is usually defined by battery manufacturers for safety and battery aging management reasons.
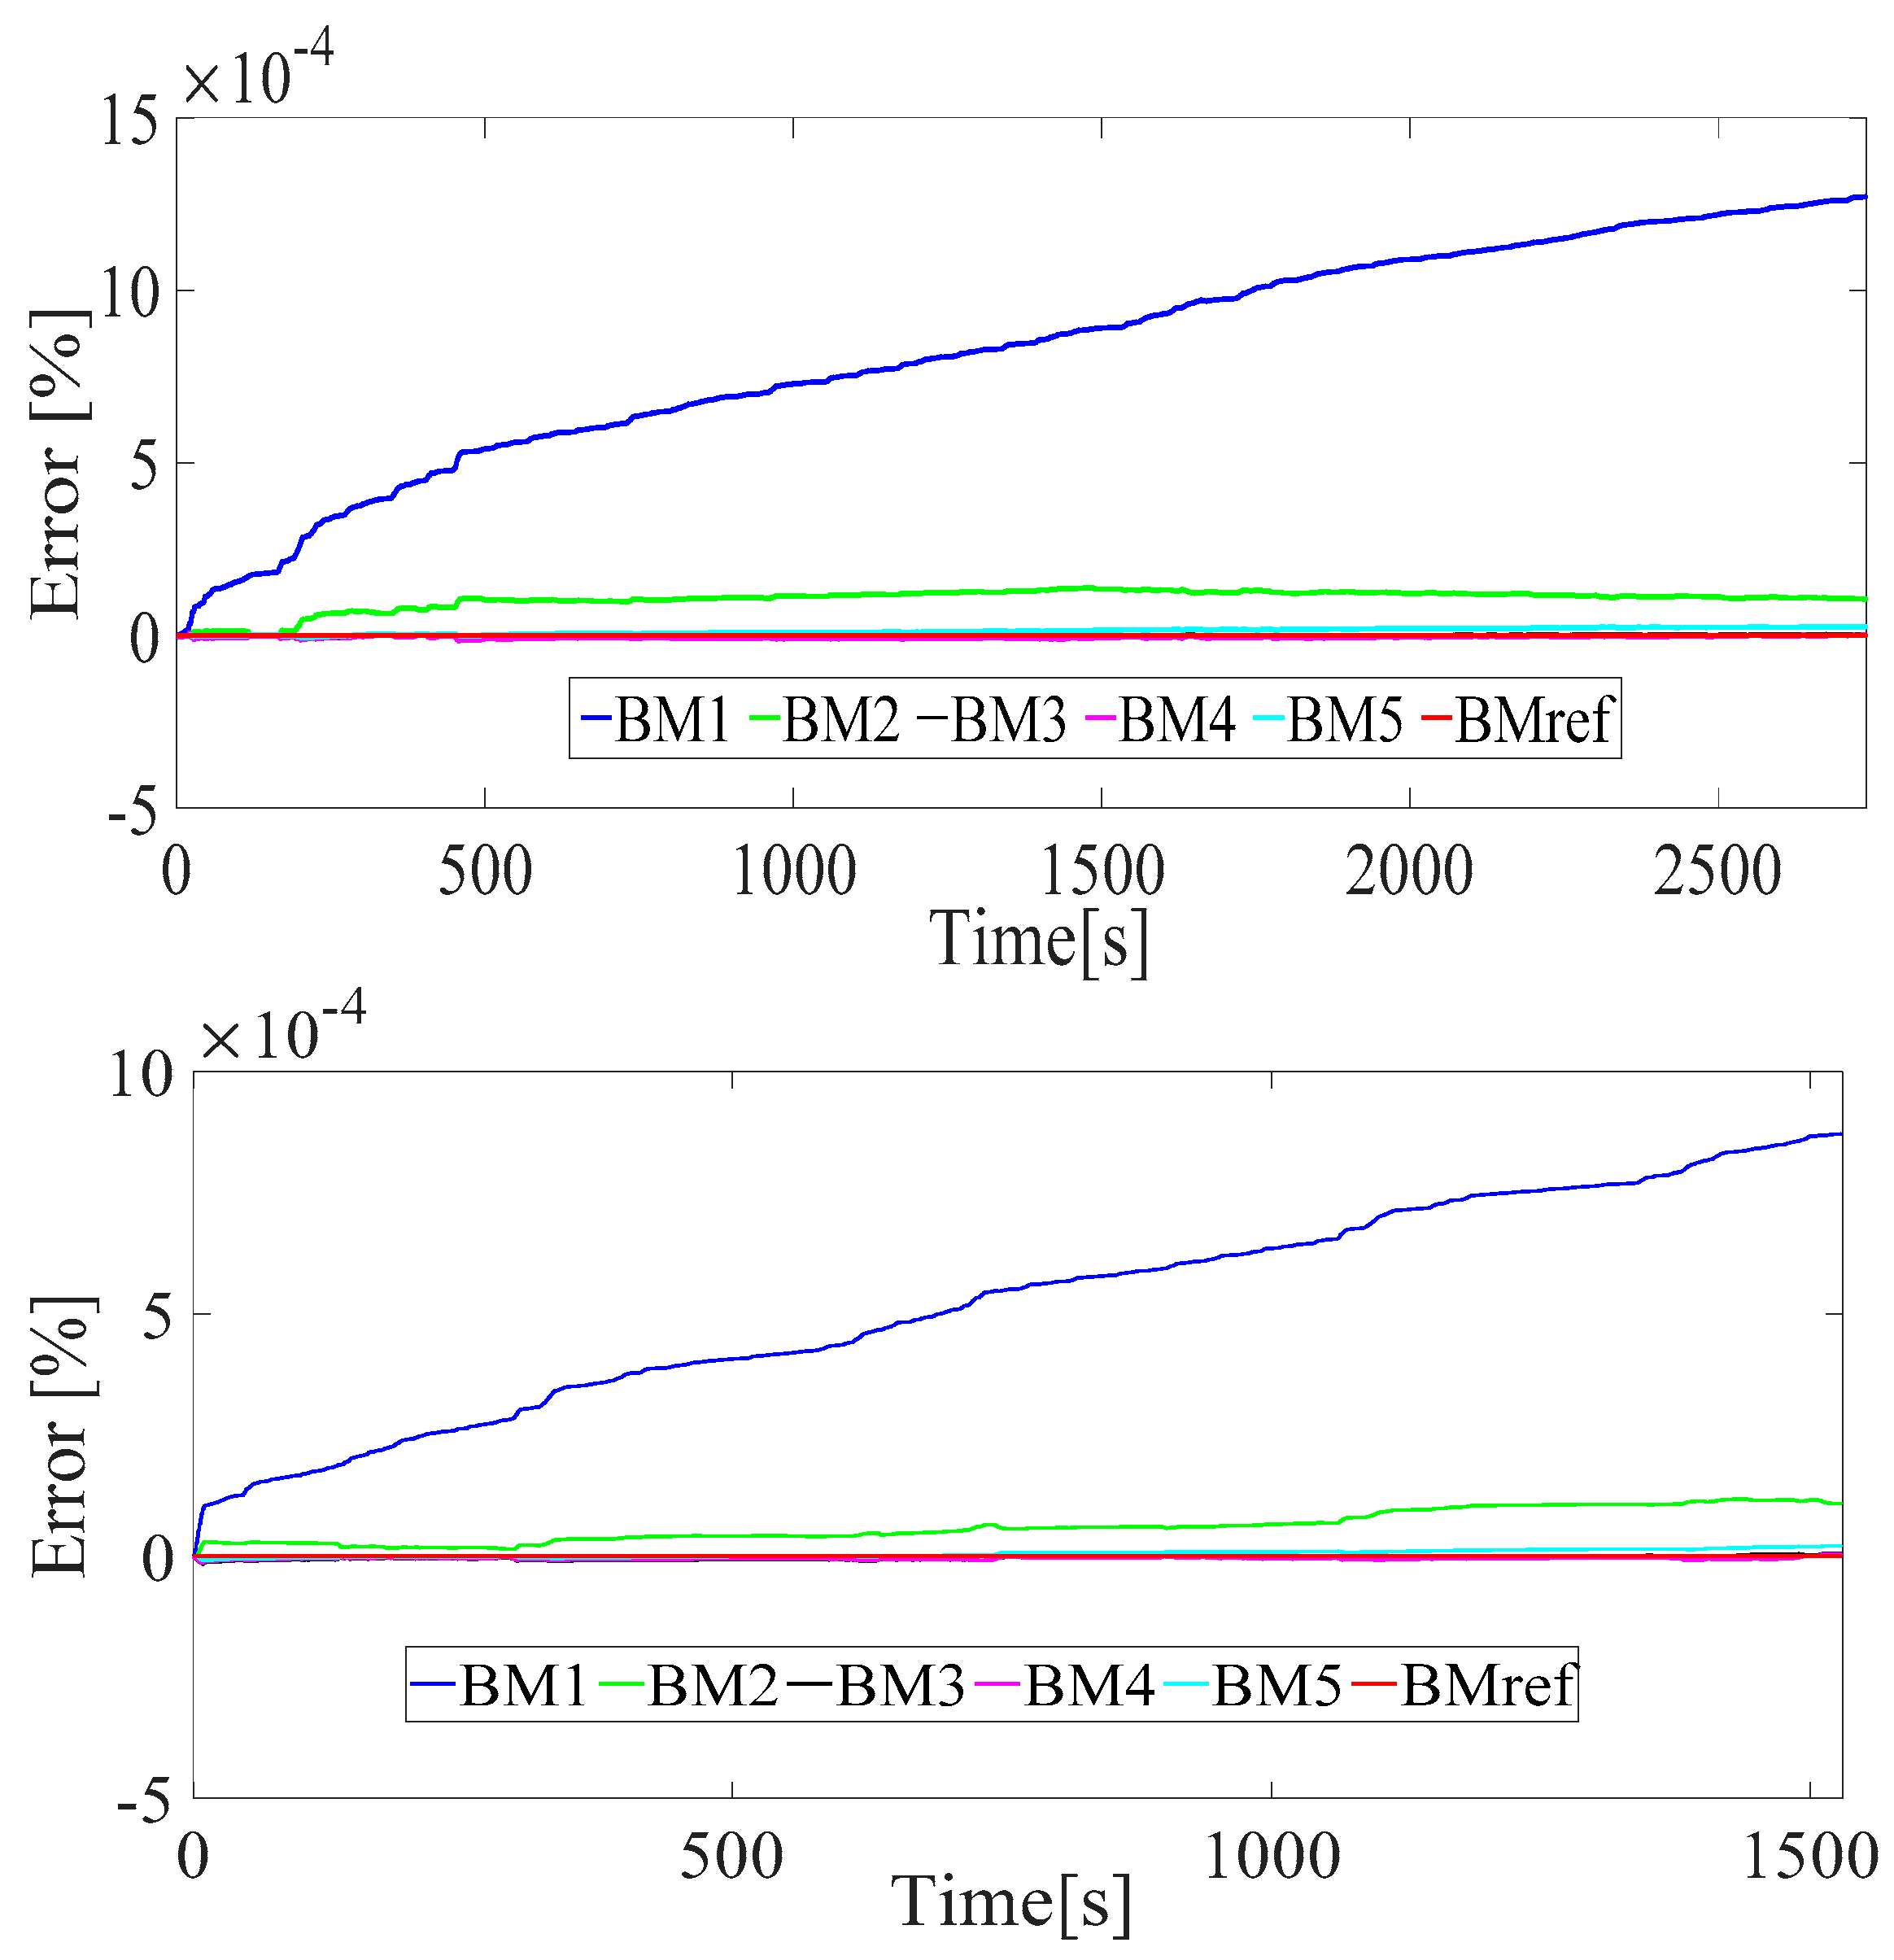
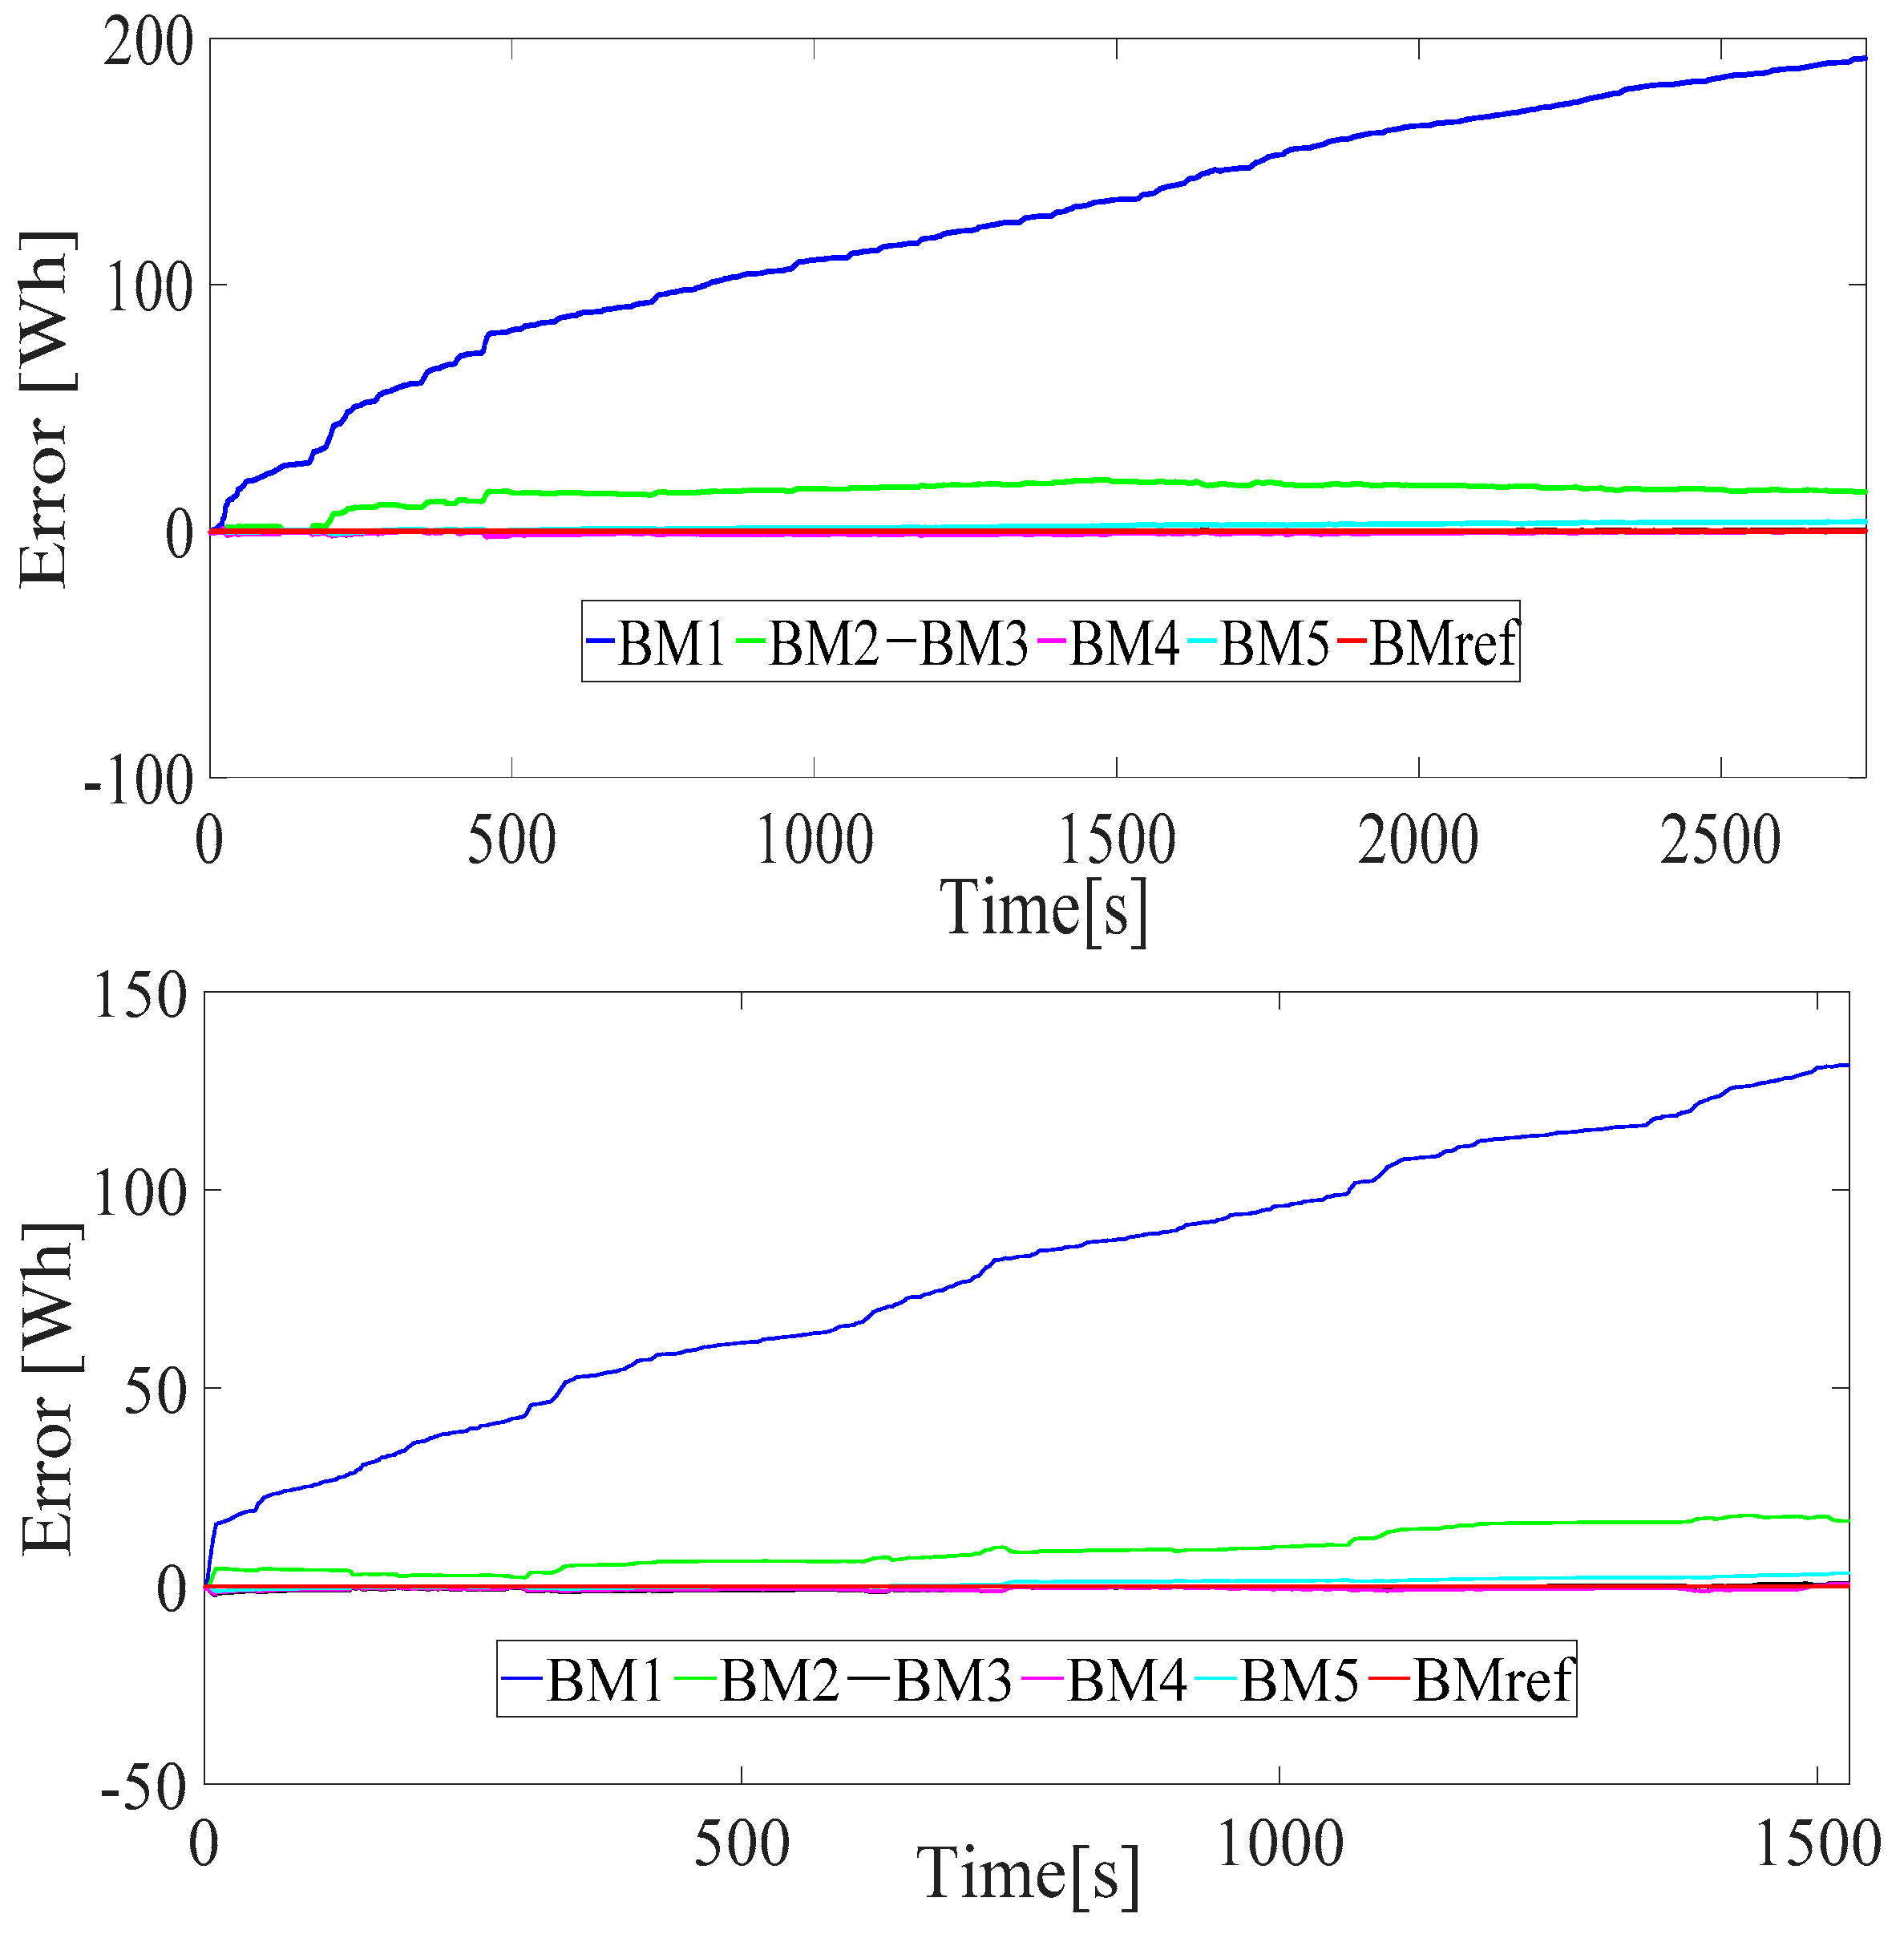
A point made in the previous paragraph leads to a second one: the impact of the battery modeling for the MPC controller depends on the objective function. In this manuscript, the objective function is based on fuel consumption, but also on the battery power and capacity fade as shown in Equation (18). As the capacity fade is directly related to battery modeling through the current and battery capacity, battery modeling has necessarily impacts on the cost function. Moreover, as only the capacity fade depends on the battery model for computing the objective function, the error in objective function and capacity fade are proportional to each other as strongly suggested by Figures 9 and 10. Indeed, it has been explained that the fuel consumption is independent of the battery model (see Figure 8). Moreover, the same can be proven for the battery power defined in Equations (20) and (21). In fact, the battery power depends on:
  • the electric generator power entirely dependent on the fuel consumption as shown in Figure 2,
  • the auxiliary power defined as the same constant for the MPC model and the real vehicle,
  • the electric motor power depending on its efficiency, the vehicle dynamics, and the speed profile, which are the same between the MPC model and the real vehicle.
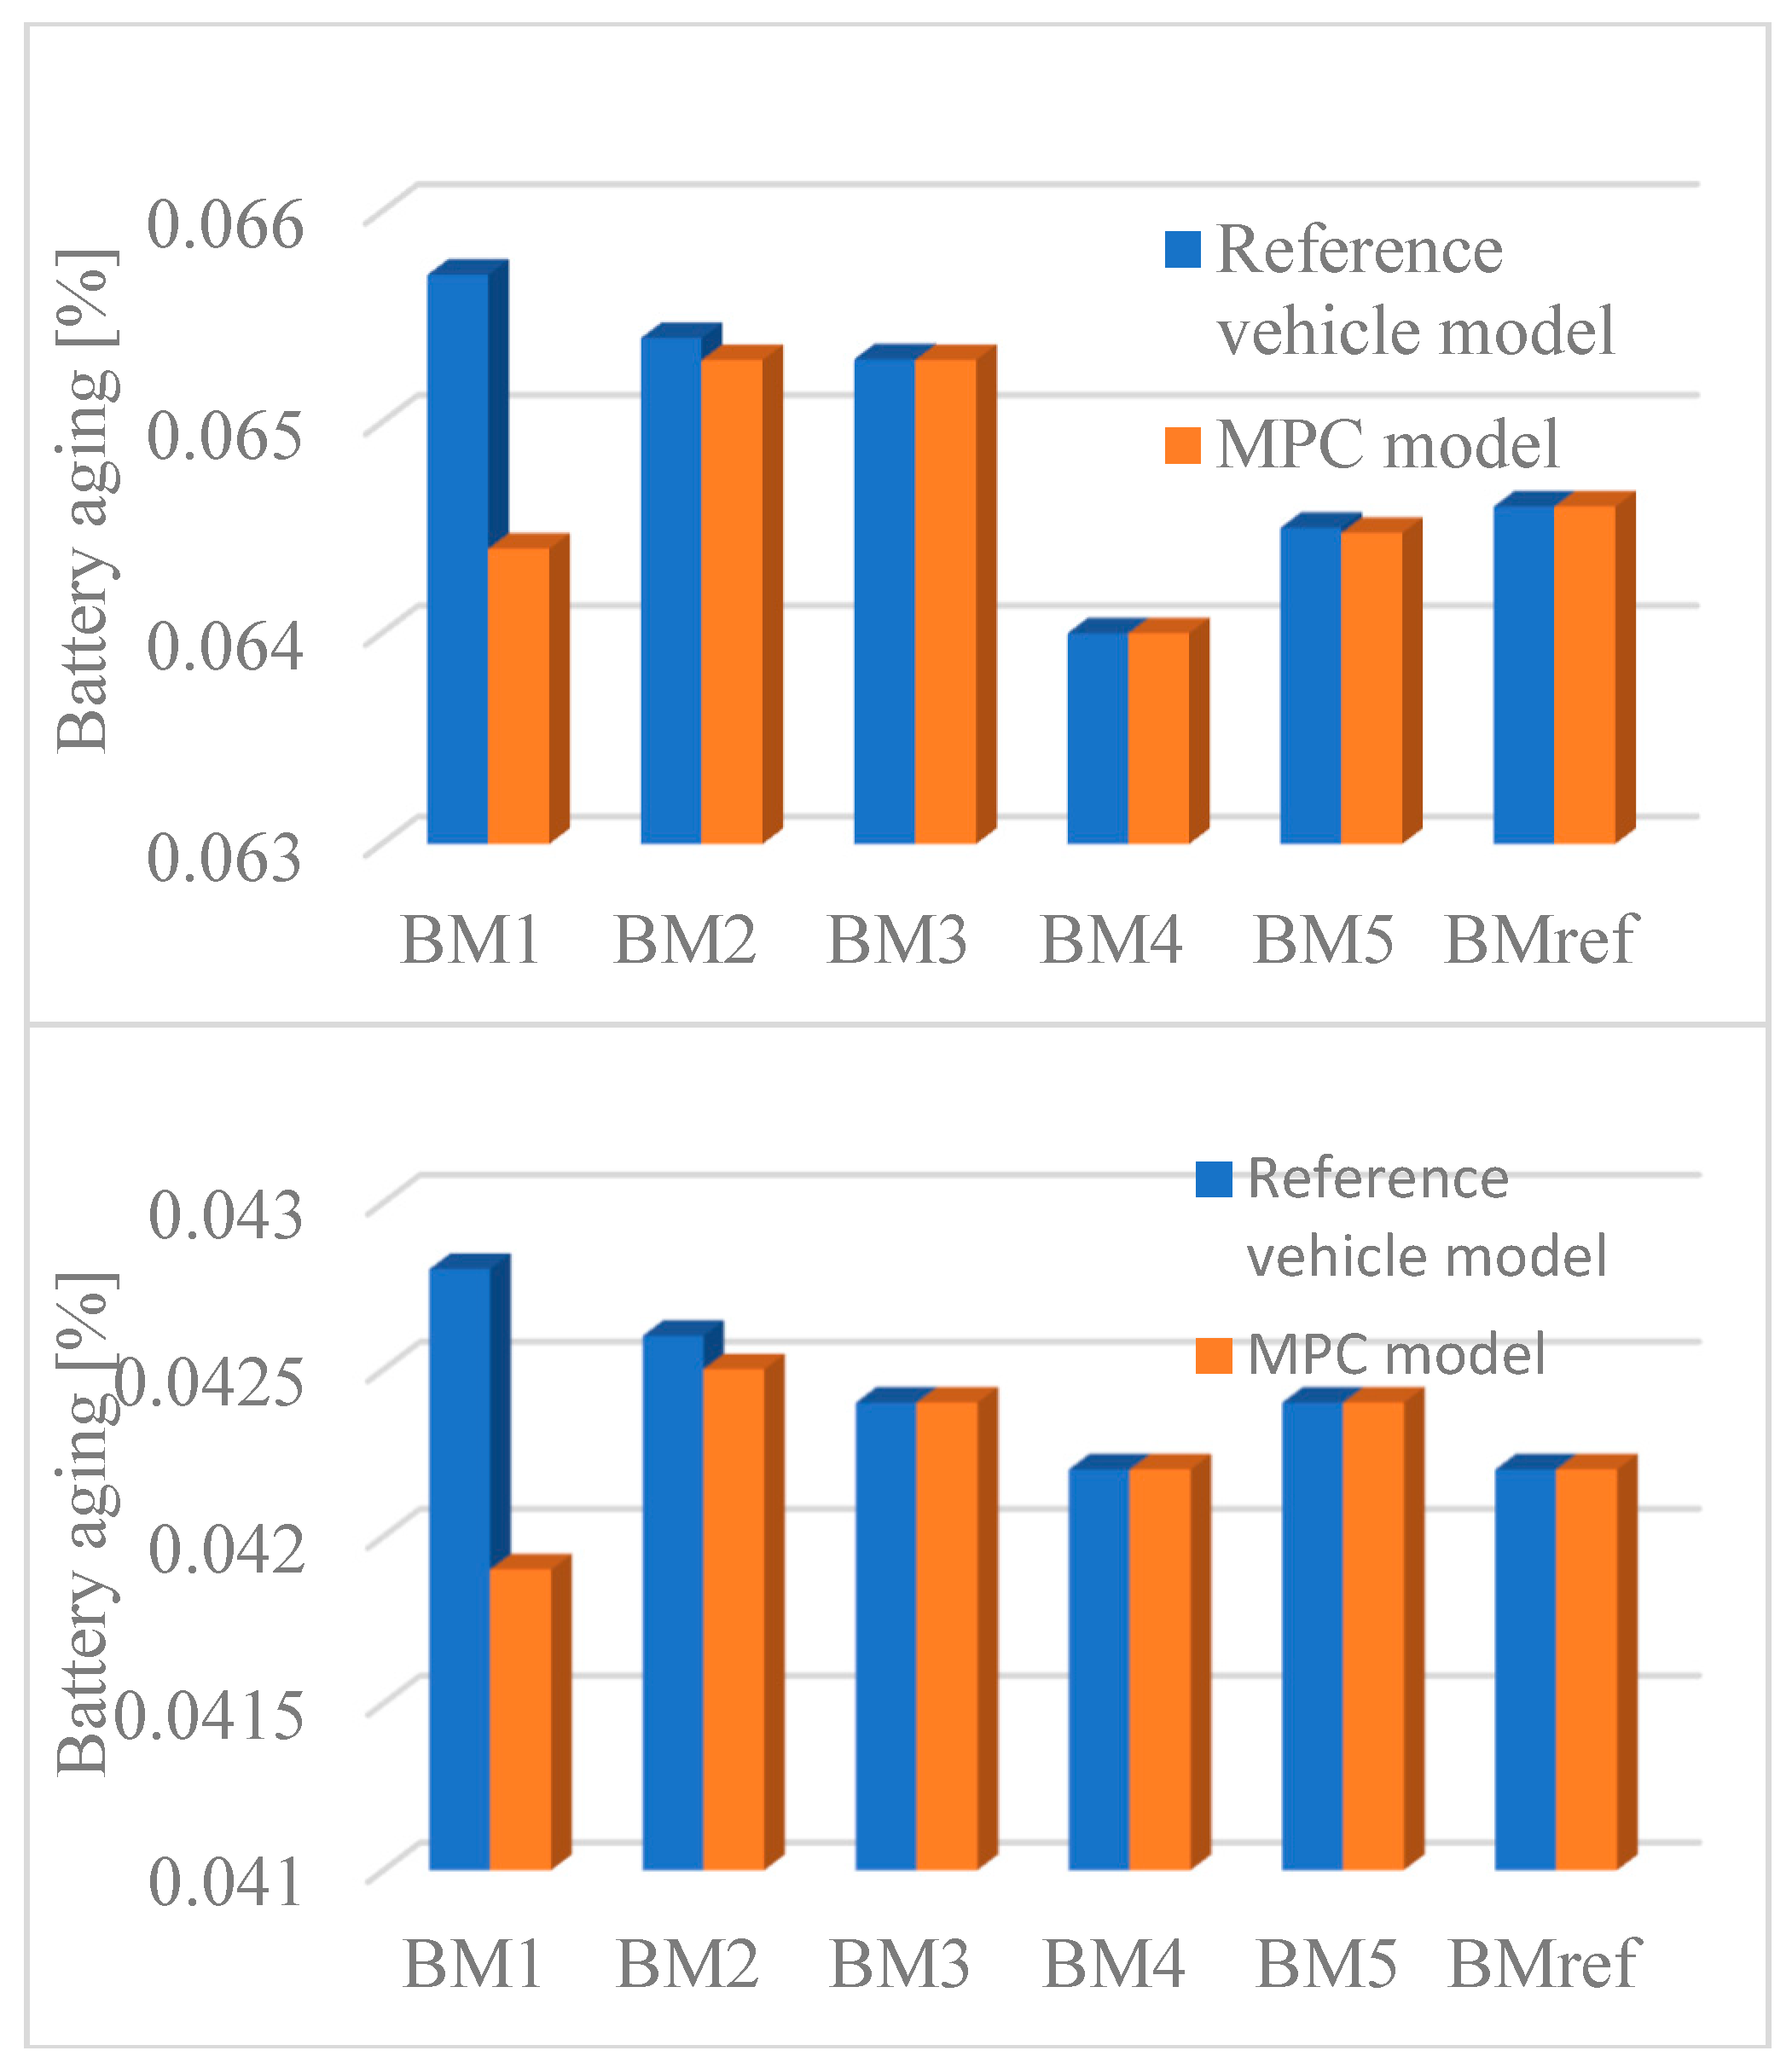
It follows that all of them are identical between the MPC model and the real vehicle. This is why it can be concluded that the battery power is independent of the battery model. As the fuel consumption and the battery power are independent of the battery model, it can be deduced that the absolute error between cost function estimated by the MPC and the real vehicle, only depends on the battery capacity fade. It explains why the error in objective function and capacity fade are proportional. Moreover, it can be deduced from Equation (18) that the coefficient of proportionality is EOL st EOL b ε gate   E b if the battery aging is expressed between 0 and 1 and the cost function is expressed in Joules. Using the results of Figures 12 and 13, this proportional coefficient can be found. This explanation highlights the main finding of this manuscript: the higher the battery model fidelity is, the better the battery aging can be predicted. As the battery pack is currently one of the most expensive components of the electric vehicle and lithium is a limited natural resource, being able to manage precisely the battery aging is a crucial point for automotive companies and battery manufacturers. According to Figures 7, 8, 12, and 13, the error in objective function or in battery capacity fade between the MPC model and the real vehicle does not decrease significantly from BM3 to BMref and no significant additional computational cost is added when increasing the battery fidelity from BM3 to BM5 or BMref.
Table 4 shows that the computation time per call of battery model is not strictly related to its fidelity. We can summarize those last lines of this table as follows:
time ( BM 1 )   <   time ( BM 2 ,   BM 3 ,   BM 5 ,   BMref )   <   time   ( BM 4 )
This observation can be easily explained. The computation time and cost are mainly due to the evaluation of the Voc using “polyfit” function. Indeed, BM1 is defined as a simple constant. From BM2 to BMref, those models require the use of the Matlab function “polyval” [41] and “polyfit” [42] to compute the Voc in function of SoC. Moreover, BM4 requires a linear interpolation function of Matlab, named “interp1” [43] to calculate the internal series resistance. All of those approximation functions are computationally intense compared with other functions in the controller. More precisely, table III, providing the computational cost of each battery model, shows that “polyfit” is the most computationally demanding function.
Our last observation is that the higher battery fidelity model does not necessarily lead to a reduction of the reference vehicle fuel consumption, battery aging or objective function according to Figures 11–13. This observation has been noticed for different drive cycle, parameters of “fmincon”, look-ahead step, and even by fixing the engine speed as a constant. It can be explained by the following. In this study, the problem is set this way: the energy objective function over two drive cycles is minimized. Considering a real time implementation, this optimization is limited by two major constraints: the reliability of the vehicle speed prediction and the computation cost. Both constraints lead to the reduction of the lookahead steps to a realistic or feasible value. For this study, a lookahead step time of 10 s has been selected. This means that to optimize the cost function on the overall simulation (two drive cycles), the algorithm is finding the global minimum at every lookahead step time (10 s). However, the optimality of the solution on the entire simulation cannot always be guaranteed. The only fact that can be certainly shown (cf. Figure 7, Figure 8, Figure 9, Figure 10, Figure 11, Figure 12 and Figure 13) is that different fidelity models lead to different paths of optimization and lower fidelity models make the predictability of the vehicle states more difficult, in particular the battery aging.

6. Conclusions

The main contribution of this manuscript consists of evaluating the impact of different battery models of a PHEV on the performance of the MPC controller through a sensitivity analysis when the PHEV is in the battery charge sustaining mode. The MPC controller aims at minimizing the equivalent fuel consumption and battery aging at the same time. Compared to the original conference paper, this study has been conducted in a more realistic way. More specifically, we have extended the look-ahead horizon and the engine speed variation considered in the controller design to provide a more accurate and close-to-reality driving scenarios where such a PHEV is commonly operated within. We added the quantitative comparison of computational effort along with the comparison of battery model fidelity to accurately portray the impacts of model complexity. We have also updated the proposed methodology to provide additional details and eliminate preliminary assumptions made in the previous conference paper that simplified the analysis process. In this study, it has been shown that the higher battery fidelity model improves the capability to predict accurately the battery aging, which is a crucial point for automotive companies and battery manufacturers as the battery pack is currently one of the most expensive components of electric vehicles and lithium is a limited natural resource. Another important aspect highlighted by this manuscript is that the higher battery fidelity model reduces the possibility of violating the SoC constraint, which is greatly desirable. In fact, this constraint is usually defined by battery manufacturers for safety and battery aging management reasons. Furthermore, it has been demonstrated that the impact of the battery modeling for the MPC controller depends on the objective function. Last but not least, the computation time and cost are mainly due to the evaluation of the Voc using “polyfit” function. So, increasing the battery model fidelity from BM2 to BMref does not add significant additional computation.

Author Contributions

N.S. and J.S. wrote the manuscript and performed the experiment. M.S. analyzed simulation results and edited the manuscript with M.M.

Funding

This work has been mainly supported by the Center for Advanced vehicular System at Mississippi State University and partially supported by the Center for Energy and Sustainability at California State University, Los Angeles (NSF HRD-1547723) and Energy Production and Infrastructure Center at University of North Carolina, Charlotte.

Conflicts of Interest

The authors declare no conflict of interest.

Nomenclature

SymbolNameUnits
t Discrete time[s]
Δ t Step time[s]
XState variables-
UControl input-
WDisturbance vector-
F r Rolling resistance[N]
F g Grading resistance[N]
F w Aerodynamic drag resistance[N]
F a Acceleration ristance[N]
F c Sum of every resistant force applied to the car[N]
P b Power provided by the battery[W]
P m _ e Electric power requested by the motor[W]
P g _ e Power provided by the generator[W]
P a Constant power consumed by the auxiliary electric system[W]
P b Power provided by the battery[W]
P c Power requested by the car[W]
P m _ m Mechanical power provided by the motor[W]
v c Car speed[m/s]
v ˙ c Caacceleration[m/s2]
g Earth gravitational constant[m/s2]
ω m Motor speed[rads/s]
ω g Generator speed[rads/s]
ω e Engine speed[rads/s]
T g Generator torque[N.m]
T e Engine torque[N.m]
T m Motor torque[N.m]
J f l w h l Sum of the engine and generator flywheel moment of inertia[kg/m2]
M i Inertia mass due to all rotating parts[kg]
M Car mass[kg]
η b Battery coulomb efficiency-
η g Generator efficiency-
η g e a r Motor gear ratio efficiency-
η m Motor efficiency-
η e Enge efficiency-
V B Battery voltage[V]
V o c Battery open circuit voltage[V]
RSSeries resistance[Ω]
RT_SShort transient voltage response resistance[Ω]
CT_SShort transient voltage response capacitance[F]
RT_LLong transient voltage response resistance[Ω]
CT_LLong transient voltage response capacity[F]
I B Current provided/received by the battery[A]
S o C Battery State of Charge-
C b Nominal battery capacity[A.h]
Q l Battery capacity fades-
ΔSoCEquivalent cumulative SoC variation for a given Crate-
E b Nominal energy capacity of the battery[J]
E O L e v End of life percentage of a battery for EVs-
E O L s t End of life percentage of a battery for stationary applications
ε g a t e Cradle-to-gate embodied primary energy per unit of electrical energy capacity for lithium battery-
e d _ f Energy density of the fuel[J/kg]
J Energy cost function[J]
m ˙ f Instant fuel consumption[kg/s]
C r 0 Car static rolling coefficient-
C r 1 Car dynamic rolling coefficient-
C D Car drag coefficient-
ε 0 Gear reduction-
r d Wheels radius[m]
A f Car front size surface[m2]
ρ a Air density[kg/m3]
RPerfect gas constant[J/mol·K]
EaActivation energyJ/mol
zPower law factor-
BPre-exponent factor-

References

  1. Shahverdi, M.; Mazzola, M.S.; Grice, Q.; Doude, M. Pareto Front of Energy Storage Size and Series HEV Fuel Economy Using Bandwidth-Based Control Strategy. IEEE Trans. Transp. Electr. 2016, 2, 36–51. [Google Scholar] [CrossRef]
  2. Shahverdi, M.; Mazzola, M.; Grice, Q.; Doude, M. Bandwidth-Based Control Strategy for a Series HEV with Light Energy Storage System. IEEE Trans. Veh. Technol. 2016, 66, 1040–1052. [Google Scholar] [CrossRef]
  3. Overall Objectives of Model Predictive Control. Course of the University of California. Available online: https://chemengr.ucsb.edu/~ceweb/faculty/seborg/teaching/SEM_2_slides/Chapter_20%203-6-05.pdf (accessed on 19 March 2017).
  4. Qin, S.J.; Thomas, A.B. A survey of industrial model predictive control technology. Control Eng. Pract. 2003, 11, 733–764. [Google Scholar] [CrossRef] [Green Version]
  5. Malikopoulos, A. Supervisory power management control algorithms for hybrid electric vehicles: A survey. IEEE Trans. Intell. Transp. Syst. 2014, 15, 1869–1885. [Google Scholar] [CrossRef]
  6. Kermani, S.; Delprat, S.; Guerra, T.M.; Trigui, R. Predictive Control for HEV Energy Management: Experimental Results. In Proceedings of the IEEE Vehicle Power and Propulsion Conference (VPPC), Dearborn, MI, USA, 7–11 September 2009. [Google Scholar]
  7. Yu, K.; Xu, X.; Liang, Q.; Hu, Z.; Yang, J.; Guo, Y.; Zhang, H. Model Predictive Control for Connected Hybrid Electric Vehicle. Math. Probl. Eng. 2015, 2015. [Google Scholar] [CrossRef]
  8. Shahverdi, M.; Mazzola, M.; Abdelwahed, S.; Doude, M.; Zhu, D. MPC-based power management system for a plug-in hybrid electric vehicle for relaxing battery cycling. In Proceedings of the IEEE Transportation Electrification Conference and Expo (ITEC), Chicago, IL, USA, 27–29 June 2016. [Google Scholar]
  9. Di Cairano, S.; Liang, W.; Kolmanovsky, I.V.; Kuang, M.L.; Phillips, A.M. Power smoothing energy management and its application to a series hybrid powertrain. IEEE Trans. Control Syst. Technol. 2013, 21, 2091–2103. [Google Scholar] [CrossRef]
  10. Patil, R.M.; Filipi, Z.; Fathy, H.K. Comparison of Supervisory Control Strategies for Series Plug-In Hybrid Electric Vehicle Powertrains through Dynamic Programming. IEEE Trans. Control Syst. Technol. 2014, 22, 502–509. [Google Scholar] [CrossRef]
  11. Yan, F.; Wang, J.; Huang, K. Hybrid electric vehicle model predictive control torque-split strategy incorporating engine transient characteristics. IEEE Trans. Veh. Technol. 2012, 61, 2458–2467. [Google Scholar] [CrossRef]
  12. Patil, R.M.; Kelly, J.C.; Filipi, Z.; Fathy, H.K. A Framework for the Integrated Optimization of Charging and Power Management in Plug-in Hybrid Electric Vehicles. IEEE Trans. Veh. Technol. 2013, 62, 2402–2412. [Google Scholar] [CrossRef]
  13. Malikopoulos, A.A.; Smith, D.E. An optimization model for plug-in hybrid electric vehicles. In Proceedings of the ASME Internal Combustion Engine Division Fall Technical Conference, Morgantown, WV, USA, 2–5 October 2011. [Google Scholar]
  14. Mayne, D.Q.; Rawlings, J.B. Model Predictive Control: Theory and Design; Nob Hill Publishing, LLC: Madison, WI, USA, 2009. [Google Scholar]
  15. Yip, W.S.; Marlin, T.E. The Effect of Model Fidelity on Real-time Optimization Performance. Comput. Chem. Eng. 2004, 28, 267–280. [Google Scholar] [CrossRef]
  16. Nafsun, A.I.; Yusoff, N. Effect of Model-Plant Mismatch on MPC Controller Performance. J. Appl. Sci. 2011, 148, 3579–3585. [Google Scholar] [CrossRef]
  17. Badwe, A.S.; Shah, S.L.; Patwardhan, S.C.; Patwardhan, R.S. Model-Plant Mismatch Detection in MPC Applications using Partial Correlation Analysis. IFAC Proc. 2008, 41, 14926–14933. [Google Scholar] [CrossRef]
  18. Tufa, L.D.; Ka, C.Z. Effect of Model Plant Mismatch on MPC Performance and Mismatch Threshold Determination. In Proceedings of the 4th International Conference on Process Engineering and Advanced Materials, Kuala Lumpur, Malaysia, 15–17 August 2016; pp. 1008–1014. [Google Scholar]
  19. Patwardhan, R.S.; Shah, S.L. Issues in performance diagnostics of model-based controllers. J. Process Control 2002, 12, 413–427. [Google Scholar] [CrossRef]
  20. Badwe, A.S.; Patwardhan, R.S.; Shah, S.L.; Patwardhan, S.C.; Gudi, R.D. Quantifying the impact of model-plant mismatch on controller performance. J. Process Control 2010, 20, 408–425. [Google Scholar] [CrossRef]
  21. Ahmad, M.W.; Eftekhari, M.; Steffen, T.; Rowley, P. The Effect of Model and Objective Function Mismatch in Model Predictive Control (MPC) for a Solar Heating System with a Heat Pump. In Proceedings of the 2014 UKACC International Conference on Control, Loughborough, UK, 9–11 July 2014. [Google Scholar]
  22. Liu, J.; Jayakumar, P.; Stein, J.L.; Ersal, T. A study on model fidelity for model predictive control-based obstacle avoidance in high-speed autonomous ground vehicles. Veh. Syst. Dyn. 2016, 54, 1629–1650. [Google Scholar] [CrossRef]
  23. Michael, M.; Masood, S. Li-Ion Battery Pack and Applications. In Rechargeable Batteries; Springer International Publishing: Cham, Switzerland, 2015; pp. 455–476. [Google Scholar]
  24. Nicolas, S.; Jian, S.; Masood, S.; Michael, M. Sensitivity analysis of the battery model for model predictive control implemented into a plug-in hybrid electric vehicle. In Proceedings of the IEEE Transportation Electrification Conference and Expo (ITEC), Chicago, IL, USA, 22–24 June 2017. [Google Scholar]
  25. Sockeel, N.; Shahverdi, M.; Mazzola, M.; Meadows, W. High-Fidelity Battery Model for Model Predictive Control Implemented into a Plug-In Hybrid Electric Vehicle. Batteries 2017, 3, 13. [Google Scholar] [CrossRef]
  26. Nicolas, S.; Jian, S.; Masood, S.; Michael, M. Pareto front analysis of the objective function in model predictive based power management system of a plug-in hybrid electric vehicle. In Proceedings of the IEEE Transportation Electrification Conference and Expo (ITEC), Long Beach, CA, USA, 13–15 June 2018. [Google Scholar]
  27. Nicolas, S.; Jian, S.; Masood, S.; Michael, M. Sensitivity analysis of the vehicle model mass for model predictive based power management system of a plug-in hybrid electric vehicle. In Proceedings of the IEEE Transportation Electrification Conference and Expo (ITEC), Long Beach, CA, USA, 13–15 June 2018. [Google Scholar]
  28. Charles, J.; Benson, S.M. On the importance of reducing the energetic and material demands of electrical energy storage. Energy Environ. Sci. 2013. [Google Scholar] [CrossRef]
  29. MathWorks. Fmincon. 2018. Available online: https://www.mathworks.com/help/optim/ug/fmincon.html (accessed on 31 October 2018).
  30. Bai, J.; Abdelwahed, S. Efficient Algorithms for Performance Management of Computing Systems. In Proceedings of the IEEE Fourth International Workshop on Feedback Control Implementation and Design in Computing Systems and Networks (FeBID), San Francisco, CA, USA, April 2009. [Google Scholar]
  31. Meyer, R.; DeCarlo, R.A.; Meckl, P.H.; Doktorcik, C.; Pekarek, S. Hybrid Model Predictive Power Flow Control of a Fuel Cell-Battery Vehicle. In Proceedings of the IEEE American Control Conference, San Francisco, CA, USA, 29 June–1 July 2011. [Google Scholar]
  32. Einhorn, M.; Conte, F.V.; Kral, C.; Fleig, J. Comparison, Selection, and Parametrization of Electrical Battery Models for Automotive Applications. IEEE Trans. Power Electron. 2013, 28, 1429–1437. [Google Scholar] [CrossRef]
  33. He, H.; Xiong, R.; Fan, J. Evaluation of Lithium-Ion Battery Equivalent Circuit Model for State of Charge Estimation by an Experimental Approach. Energies 2011, 4, 582–598. [Google Scholar] [CrossRef]
  34. Chen, M.; Rincon-Mora, G.A. Accurate Electrical Battery Model Capable of Predicting Runtime and I-V Performance. IEEE Trans. Energy Convers. 2006, 21, 504–511. [Google Scholar] [CrossRef]
  35. Orcioni, S.; Buccolini, L.; Ricci, A.; Conti, M. Lithium-ion Battery Electrothermal Model, Parameter Estimation, and Simulation Environment. Energies 2017, 10, 375. [Google Scholar] [CrossRef]
  36. Cicconi, P.; Germani, M.; Landi, D.; Mengarelli, M. Virtual Prototyping Approach to Evaluate the Thermal Management of Li-Ion Batteries. In Proceedings of the 2014 IEEE Vehicle Power and Propulsion Conference (VPPC), Coimbra, Portugal, 27–30 October 2014. [Google Scholar]
  37. Li, J.; Mazzola, M.S. Accurate battery pack modeling for automotive applications. J. Power Sources 2013, 237, 215–228. [Google Scholar] [CrossRef]
  38. Sockeel, N.; Ball, J.; Shahverdi, M.; Mazzola, M. Passive tracking of the electrochemical impedance of a hybrid electric vehicle battery and state of charge estimation through an extended Kalman filter. In Proceedings of the IEEE Transportation Electrification Conference and Expo (ITEC), Chicago, IL, USA, 22–24 June 2017. [Google Scholar]
  39. Sockeel, N.; Ball, J.; Shahverdi, M.; Mazzola, M. Passive tracking of the electrochemical impedance of a hybrid electric vehicle battery and state of charge estimation through an extended and unscented Kalman filter. Batteries 2018, 4, 52. [Google Scholar] [CrossRef]
  40. Wang, J.; Liu, P.; Hicks-Garner, J.; Sherman, E.; Soukiazian, S.; Verbrugge, M.; Tataria, H.; Musser, J.; Finamore, P. Cycle-life model for graphite-LifePO4 cells. J. Power Sources 2010, 196, 3942–3948. [Google Scholar] [CrossRef]
  41. MathWorks. Polyval. 2018. Available online: https://www.mathworks.com/help/matlab/ref/polyval.html?searchHighlight=polyval&s_tid=doc_srchtitle (accessed on 31 October 2018).
  42. MathWorks. Polyfit. 2018. Available online: https://www.mathworks.com/help/matlab/ref/polyfit.html?searchHighlight=polyfit&s_tid=doc_srchtitle (accessed on 31 October 2018).
  43. MathWorks. Interp1. 2018. Available online: https://www.mathworks.com/help/matlab/ref/interp1.html?searchHighlight=interp1&s_tid=doc_srchtitle (accessed on 31 October 2018).
Figure 1. Picture of the car of the future plug-in series hybrid electric vehicle.
Wevj 09 00045 g001
Figure 2. Series PHEV block diagram of the Subaru BRZ 2015 Urban Dynamometer Driving Schedule (UDDS).
Wevj 09 00045 g002
Figure 3. Model predictive control based power management system.
Wevj 09 00045 g003
Figure 4. Control loop for the sensitivity analysis.
Wevj 09 00045 g004
Figure 5. Picture of the real battery pack assembly.
Wevj 09 00045 g005
Figure 6. Impedance model of the battery.
Wevj 09 00045 g006
Figure 7. Error between the SoC computed by the model predictive control (MPC) model and the reference vehicle during two Urba n Dynamometer Driving Schedule (UDDS, up) and Highway Fuel Economy Test (HWFET, down) drive cycles.
Wevj 09 00045 g007
Figure 8. Error between the fuel consumption computed by the MPC model and the reference vehicle during two UDDS (up) and HWFET (down) drive cycles.
Wevj 09 00045 g008
Figure 9. Error between the battery capacity fade computed by the MPC model and the reference vehicle during 2 UDDS (up) and HWFET (down) drive cycles.
Wevj 09 00045 g009
Figure 10. Error between the objective function computed by the MPC model and the reference vehicle during two UDDS (up) and HWFET (down) drive cycles.
Wevj 09 00045 g010
Figure 11. Fuel consumption comparison at the end of the two UDDS (up) and HWFET (down) drive cycles.
Wevj 09 00045 g011
Figure 12. Battery aging comparison at the end of the two UDDS (up) and HWFET (down) drive cycles.
Wevj 09 00045 g012
Figure 13. Objective function comparison at the end of the two UDDS (up) and HWFET (down) drive cycles.
Wevj 09 00045 g013
Table 1. Specification of power-train components of the plug-in hybrid electric vehicle (PHEV).
Power-Train ComponentsNameCharacteristics
Energy Storage System (ESS)Lithium iron phosphate (LFP) prismatic cells from A123Capacity = 39.2 Ah; nominal voltage = 340 V; nominal energy = 13.3 kWh; configuration: 7×15s2p.
Internal Combustion Engine (ICE)Model MPE850 from Weber41 kW, 2 cylinders, 850 cc.
Electric GeneratorModel YASA-40093 kW, axial flux permanent magnet.
Electric Motors UnitModel GVK210-100L6 from Linamar2 × 80 kW, unit ratio = 8.49.
Vehicle dynamics2015 Subaru BRZ LimitedDrag coefficient = 0.28; frontal area = 1.9695 m2; PHEV mass = 1300 kg; wheel radius = 0.3 m.
Table 2. Selected parameters of fmincon.
NameNotationValue
Algorithm typeAlgorithmInterior-point
Step toleranceTolX1
Function toleranceTolFun0.01
Maximum IterationMaxIter1000
Maximum Function EvaluationMaxFunEval1000
Constraint ToleranceTolCon0.1
Table 3. Characteristic of battery impedance.
NameBM1BM2BM3BM4BM5BMref
Voc (V)350 g(SoC)
RS (Ω)000.15f(SoC)0.0950.1094
RT_S (Ω)00000.01180.1111
CT_S (F)0000287.8422.7
RT_L (Ω)000000.1115
CT_L (F)0000010,196
Table 4. Computational Cost of the Different Battery Models.
FunctionBM1BM2BM3BM4BM5BMref
Ib-119911
VocPolyfit-936936936936936
Polyval-3131313131
Vb---2234
RsInterp1---10--
VT_S-----44
VT_L------4
Total Computation Cost1968978988975980
Computation time512 s919 s921 s977 s903 s909 s
Simulation time2740 s2740 s2740 s2740 s2740 s2740 s
Battery model computation time0.0097 s0.0170 s0.0170 s0.0180 s0.0168 s0.0169 s