Article

Stochastic Modeling of the Charging Behavior of Electromobility

Institute of Energy Systems and Electrical Drives, TU Wien, 1040 Vienna, Austria
*
Author to whom correspondence should be addressed.
Current address: Gusshausstrasse 25-29/370-3, 1040 Vienna, Austria.
World Electr. Veh. J. 2018, 9(3), 44; https://doi.org/10.3390/wevj9030044
Submission received: 29 August 2018 / Revised: 12 October 2018 / Accepted: 17 October 2018 / Published: 22 October 2018

Abstract

:
As electric vehicle market penetration grows steadily and charging demand along with it, the analysis of daily usage gains in significance. We propose in this paper a simple yet powerful tool based on a Markov chain that can model the stochastic nature of day to day usage of a charging station if adequate datasets on travel patterns are available. The model is generic and therefore can be tailored to different locations with different features. Within this work, we conducted a case study with the aim to verify the algorithm. By an additional sensitivity analysis, impacts of the made assumptions are considered. With a final analysis of two charging tariff designs the model provides valuable stochastic information about electricity consumption and annual revenues at a location of interest.

1. Introduction

The rapidly increasing demand in mobility accounts for 25% of all CO2 emissions in Europe, causing dramatic environmental issues [1]. As the Earth’s climate shows signs of change, more and more states and organizations across the globe start to consider the electrification of the mobility sector as an opportunity to reduce the emission of greenhouse gases. This means a shift from conventional oil-based transportation towards electric grid as well as off-grid or H2-based supplied transportation.
Plug-in electric vehicles (PEVs) as well as plug-in hybrid electric vehicles (PHEVs) play a significant role in this trend, since light-duty vehicles (cars, vans) alone represent a 15% share of the overall CO2 emissions within Europe [1]. It is worth noting at this point that electrical drives in electric vehicles have an efficiency of up to 96%, no transmission at all and low noise emission. An internal combustion engine (ICE), on the other hand, only shows a 35% maximum efficiency in general [2]. However, to increase public trust in electric vehicles, battery technologies and charging infrastructure including fast charging stations must be further researched and developed.
According to a European Commission Report [1], the European Union aims to reach a 20% reduction in greenhouse gas emissions of the transport sector by 2030 and a 60% reduction by 2050 compared to the levels in 1990. As a response, Germany, for example, targets one million electric vehicles on the roads by 2020, possibly 5 million by 2030 and zero emission in urban areas by 2050 [3].
Austria sets goals as well: 19% emission reduction by 2025 and 60% by 2050 in the mobility sector [4]. Moreover, around 210 thousand electric vehicles are expected to occupy the roads in Austria by 2020. These goals assume public acceptance on a broader range along with a broad charging infrastructure [5]. A recent study [6] shows that around 3700 charging stations, of which 528 have fast charging capabilities, were publicly available in Austria at the end of 2017.
For PEVs to be competitive against conventional ICE vehicles, a well built, priced and organized charging infrastructure is necessary. This infrastructure must contain appropriately placed fast charging stations (20 kW or higher) as well so that it allows the battery to be filled up in no more than a few minutes, although ICEs are still characterized by a higher rate of energy exchange. This becomes important, for example, during long trips on highways or in emergency situations, where battery recharging times must not significantly differ from the refueling of conventional ICE vehicles at petrol stations [2].
Efficient, affordable batteries sided with an extensive charging infrastructure lead the way towards practical usability, hence towards public acceptance. However, if PEV market share keeps on growing, the impact of simultaneously charging a significant fleet on the current electric distribution grid is not neglectable. These grids in most cases bear specific load carrying capabilities designed upon typical consumption patterns. When suddenly more and more PEVs are deployed in the distribution grid, the patterns as mentioned earlier will change significantly due to additional loads [2].
To model the additional loads at different levels of PEV market penetration, we developed stochastic methods, while the driver behavior is randomly characterized. Analysis of parameters such as daily distance traveled, trip duration, charging location, charging time, charging power, state of charge (SOC), etc. provide the core information to calculate the impacts. There are country specific studies available, describing the typical PEV consumer (e.g., [7]).
In previous works [2,5,8,9,10], it is assumed that PEV usage does not differ from conventional ICE vehicle usage. In [5], real data from the city Graz have been used to generate random variables from probability distribution functions for extensive bottom-up calculations for three different charging power levels and different levels of PEV penetration. Yunus et al. utilized grid data, and Matlab generated load profiles to simulate impacts on distribution transformer loading and system bus voltage profiles. [2] A test distribution model with network topology, load profiles, load types and levels has been tested with the additional loads of a fast charging station design. Implementing a Monte Carlo simulation, the results show that, in the modeled network, 85% of the vehicles are charged only once a day at home. Only 15% was forced to use outside the home infrastructure to recharge due to longer trips.
The work in [9] proposes a stochastic method based on Monte Carlo simulations to extract the hourly aggregated load demand resulting from PEV charging and to quantify the power delivered to the fleet through a domestic transformer. The required datasets have been gathered through questionnaires to ICE owners.
Real life travel patterns from the National Household Travel Survey (NHTS) are processed in [10] to identify probability density functions for the model with the randomness of charging, together with the driving behavior of PEV owners kept in mind. In addition, Qian et al. took common battery types as well as their initial state of charge into account for the load curves [8].
A PEV Mobility and Charging Markov Model is developed in [11], where trip starting and ending times along with charging flexibility are considered. Statistics of private car behavior are available for the calculations. Moreover, in [12], stochastic household activity and power consumption patterns of individuals are simulated to gain an overall picture of the loads. The advantages of Markov Chain Models are that they are well described and tested for PEV charging applications in the literature. Thus, they are able to fully disaggregate year long EV patterns. On the downside, such models lacks on behavioural realism, which makes them questionable for policy sensitivity [13].
Since public PEV charging stations not only draw electric power from the distribution grid as long as a vehicle is appropriately deployed, it is of utmost importance to evaluate customer habits towards fast charging. New concepts investigate the use of batteries to reduce the stress on the grid [14]. Considering that rapid charging may negatively affect the lifespan of the battery [15], PEV drivers only tend to choose fast charging in the absence of other charging options or case of a quick recharge during a more extended trip for example on a motorway. Range anxiety plays a significant role in the utilization of public fast-charging facilities. As an example, Yunus et al. showed in a similar study that approximately 10% of PEV users recharge twice during a day to finish their trips [2]. If overnight home charging is available, 85% of the vehicles are charged at home, and merely 15% require the public charging infrastructure.
The three-phase AC fast charging represents powers around 10–20 kW [16]; however, even chargers with more than 100 kW DC power are available in some countries. Such stations are designed to increase the state of charge of an average PEV battery (up to 90 kWh capacity) to up to 80% in a few minutes, which comes near to the refueling time of conventional ICE cars at petrol stations [2,17].
Many papers have already analyzed the charging behavior at charging stations from the aspect of a PEV fleet. In this paper, however, a method is proposed, which generates daily and weekly load profiles based on a stochastic approach from the aspect of a fast charging station. The main contributions of this paper are:
  • The charging pattern of a charging station is described by a stochastic process implementing the Markov chain.
  • Based on the stochastic process, an algorithm designed for high performance and scalability is developed.
  • A case study, simulating a 22 kW charging station in Vienna, Austria considering weekdays and weekends to show typical occupation together with load patterns is conducted.
  • Finally, the charging pattern, the parameters’ variation, and the charging station operator’s (CSO) revenues are illustrated.
The remainder of this paper is organized as follows. In Section 2, we introduce the Markov chain model and describe the formulation in Matlab. Section 3 presents the assumptions and parameterization of a case study, while we show comprehensive results in Section 4. Section 5 discusses and concludes the paper.

2. Methods

As mentioned above, the model in this paper aims to investigate temporal occupational patterns from the aspect of a public fast charging station. To describe an accurate model at a specific location, we have to understand and implement the local charging characteristics customer behavior. The model itself is generic, thus can be tailored to different places with different driving habits.

2.1. Markov Chain

The time and state discrete Markov chain proved itself to be an ideal tool to represent the states and phases during charging activities [11,18] at each time step. A Markov chain is a sequentially generated stochastic process, which satisfies the Markov property [19], meaning that, at every individual time step t, only one state S i from a predefined set of states S = S 1 , , S m is allowed to follow. The current state S i , t at time t depends only on the previous state S i , t 1 at t 1 . In the proposed model, three states can occur:
  • “Unoccupied” S u : No PEV is connected to the charger.
  • “Charging” S c : A PEV is plugged-in to the station, and its battery is being charged (SOC < 100%).
  • “Plugged-in but not charging” S n : A PEV is still plugged-in to the station, however, its battery has already been fully charged (SOC = 100%).
The transition between the possible states S t = S u , t , S c , t , S n , t T at a given time t is mathematically described by the [ m × m ] transition matrix
T t = p u u , t p u c , t 0 p c u , t p c c , t p c n , t p n u , t 0 p n n , t
with
j = 1 m p i j , t = 1
and
S t + Δ t T = S t T · T ( t + Δ t ) ,
containing the transition probabilities p i j , t as elements [11]. The element p i j , t stands for the time dependent transition probability to move from state S i to state S j . Each row of the above matrix (Equation (1)) consists of the probabilities of conducting a transition from a given state to all the remaining states, hence the sum of the row elements must equal to 1 as shown in Equation (2). Moreover, according to Equation (3), the next state at t + Δ t is defined by the multiplication of the previous state with the transition matrix in Equation (1) at the appropriate time.
A visual representation is achievable by a state diagram in Figure 1 showing the states S = S u , S c , S n T in circles along with the transitions probabilities as directed arrows pointing from one state to the available next. Movement between the states is only permitted along the arrows. After a vehicle has arrived at the station, only the “charging” state can follow. During this period, no further vehicle can start to charge. In the case the charging process is complete, but the vehicle is still deployed, the “plugged-in but not charging” state follows. The PEV can also be disconnected even before reaching 100% SOC. In this case, the station becomes “unoccupied” once again. All transitions occur in the transition matrix (Equation (1)) accordingly.

2.2. Algorithm for Describing the Charging Process

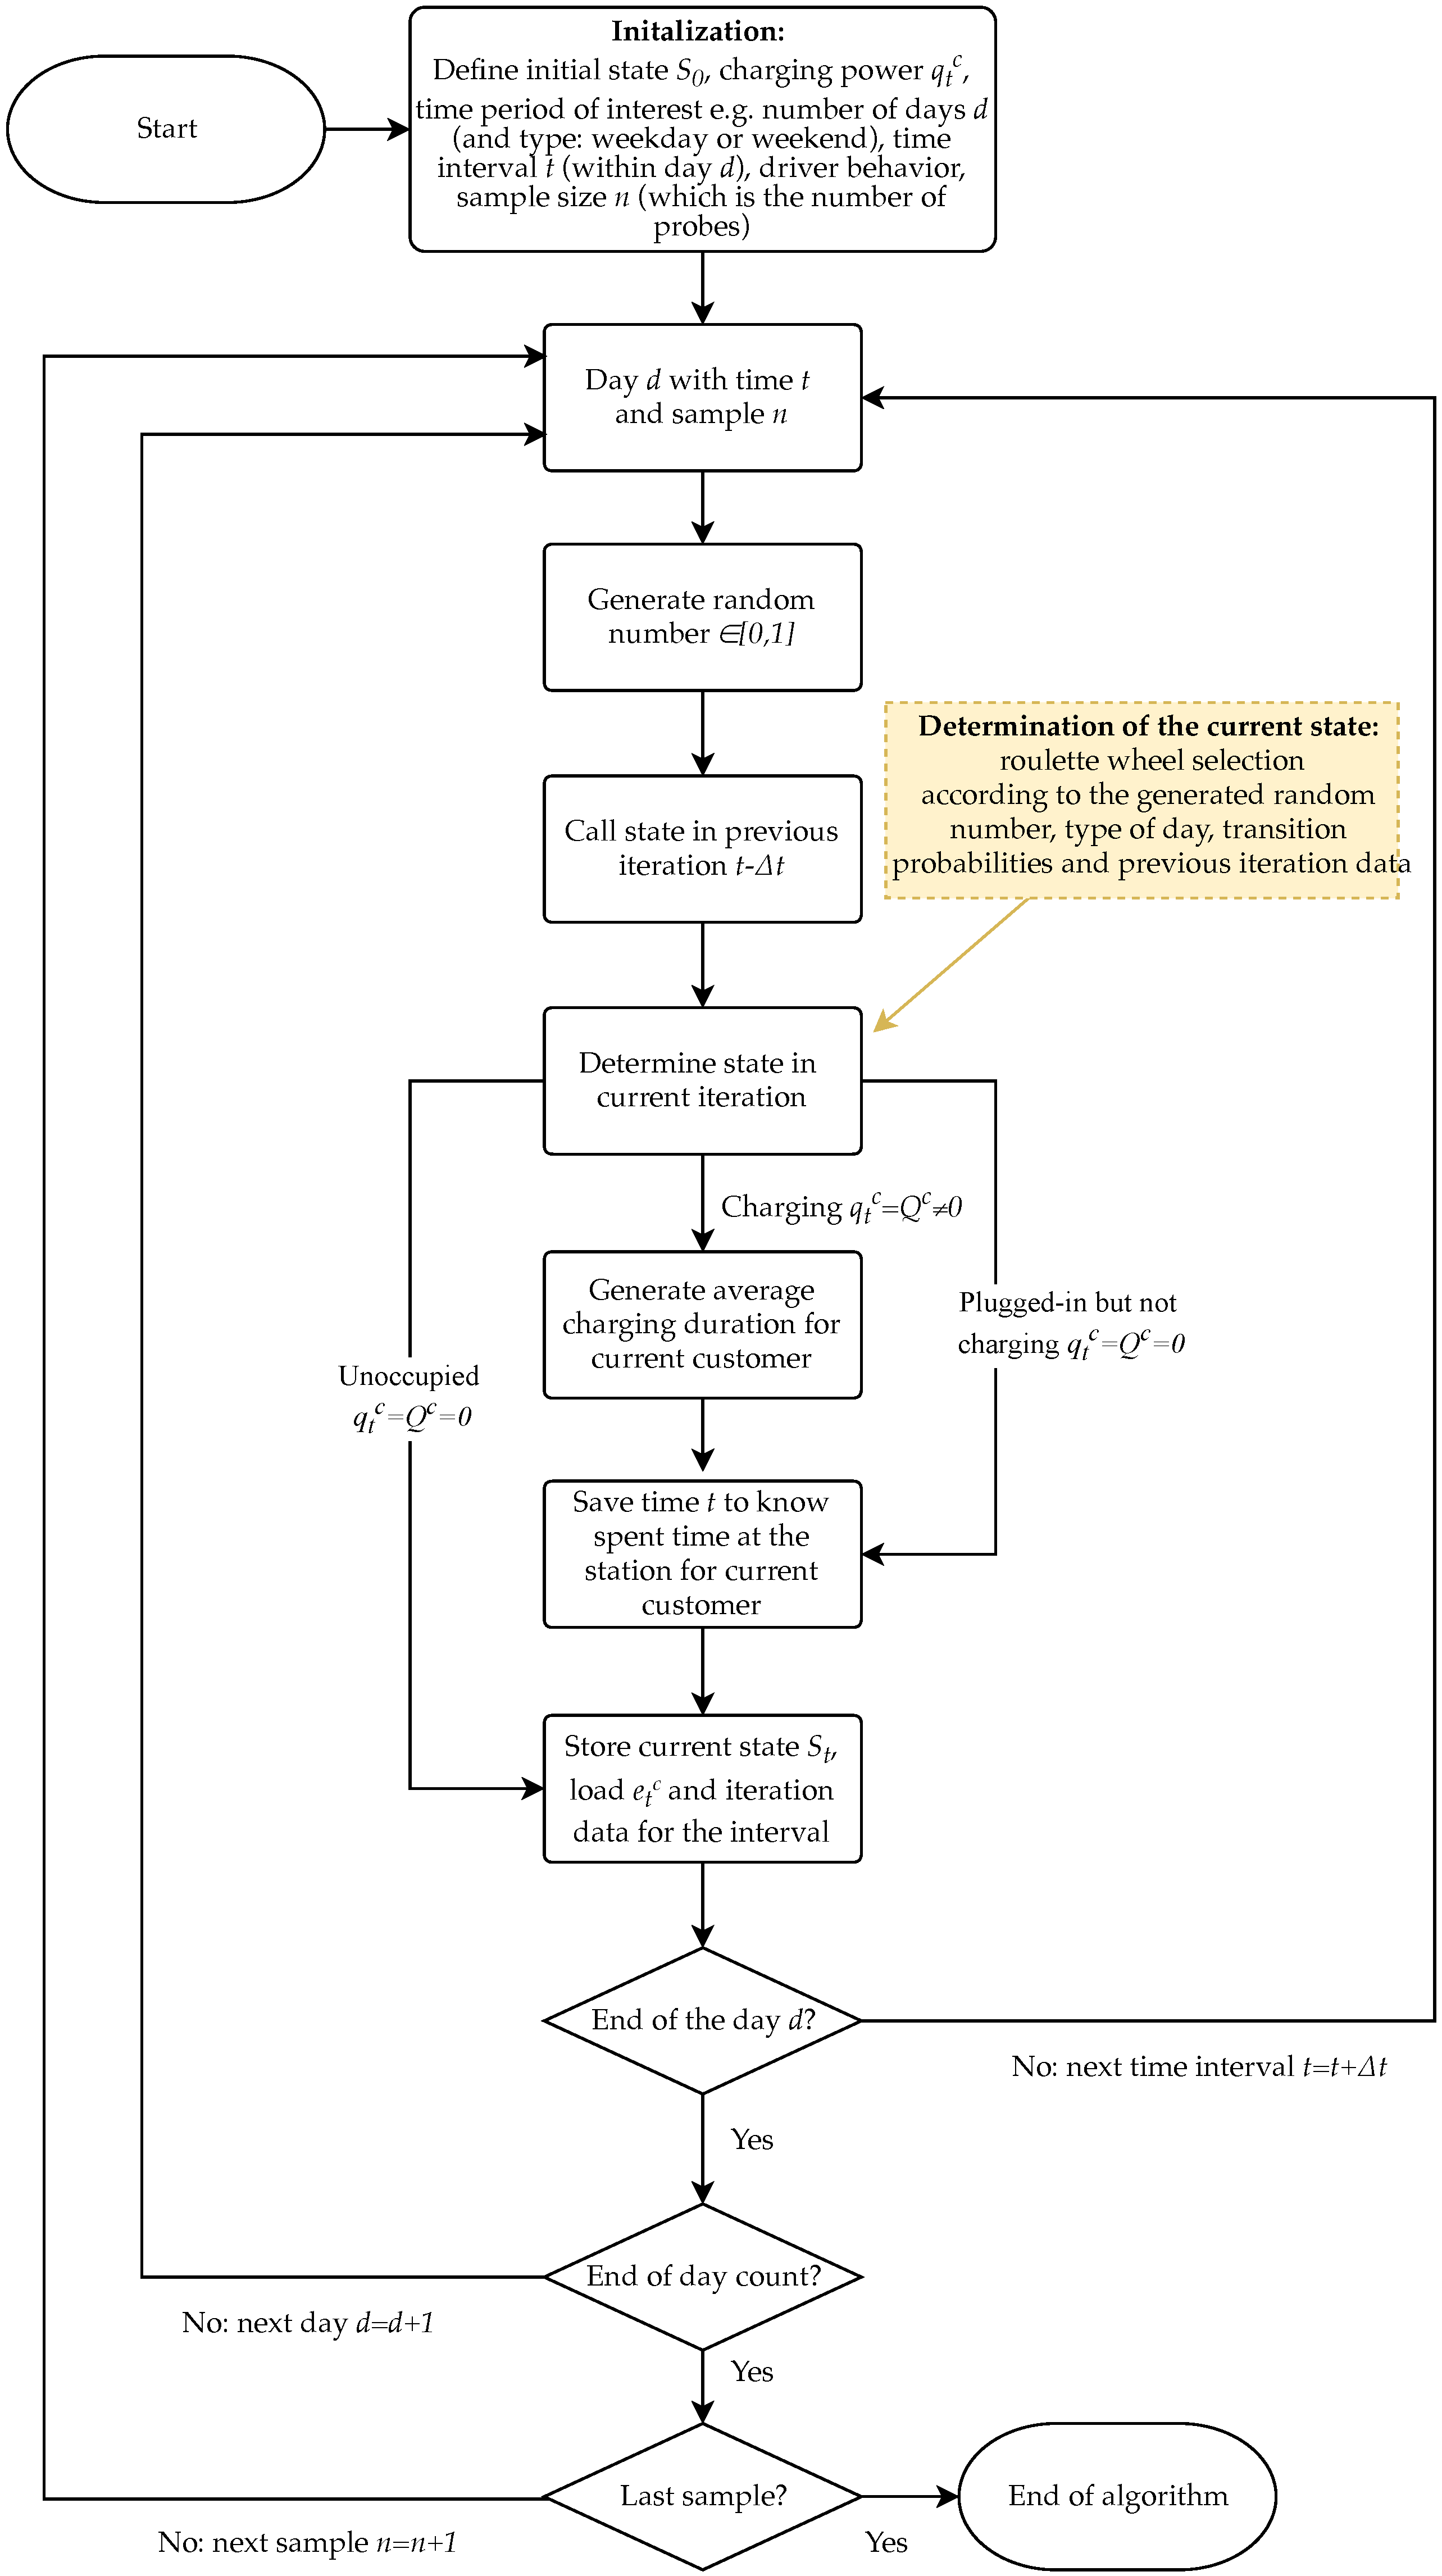
To implement the Markov chain with the proposed states S = S u , S c , S n T into the model, an algorithm is developed in Figure 2. It evaluates the stochastic state sequence for the charging processes during the tested period according to the transition probabilities used for the observed charging station location. The algorithm also stores the information regarding energy charged e t c together with energy not charged e t n when PEV is plugged-in but not charging.
The flowchart in Figure 2 depicts the algorithm: first, the initial state S 0 at time t = 0 must be chosen, which is the starting point of the sequential stochastic process. At this point, further charging characteristics must be defined, including charging power q t c , the simulated time period in days d { 0 , , d m a x } , observed time intervals t { 0 , , t m a x } , e.g., in minutes, and the sample size n { 1 , 2 , , N } .
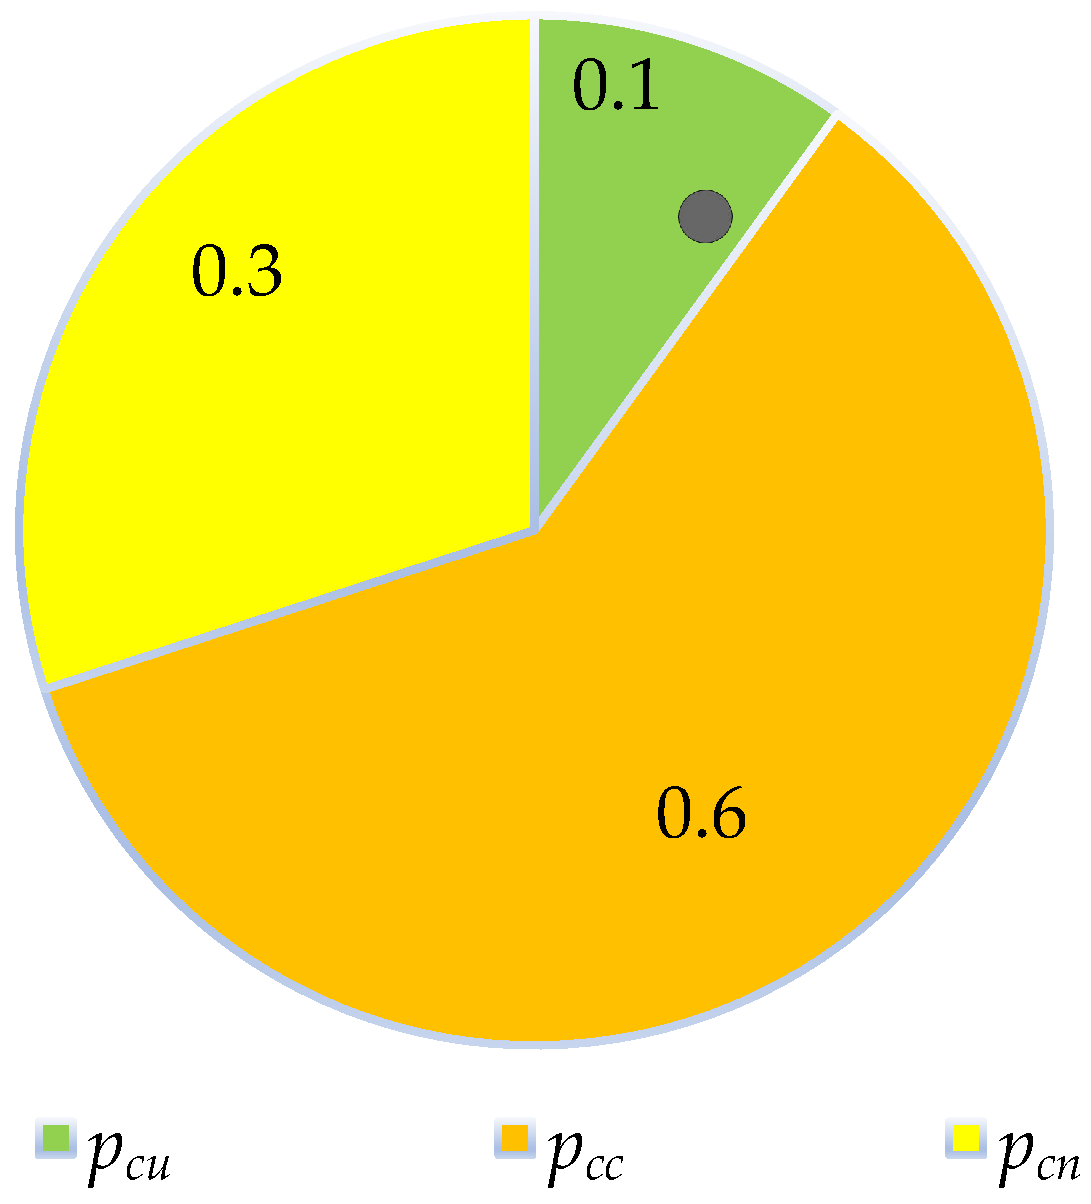
For a stochastic process to become meaningful, n { 1 , 2 , , N } probes should be conducted, thus the Markov chain must be run N times for the chosen number of days d m a x , after which an average value will be calculated from the iteration data for the observed time intervals t { 0 , , t m a x } . The time dependent elements of the transition matrix (Equation (1)) are derived from the driver behavior such as time of charging, type of day, average initial SOC, average charging duration. Next, the state S = S u , S c , S n T of the charging station is determined for every time interval within the simulated period using the Roulette wheel selection concept by allocating a randomly generated number [ 0 , 1 ] among the probabilities for the current time t and previous state S t Δ t . The transition probabilities depend on the time as well as the state in the iteration before, where the surface of the Roulette wheel [20] represents a specific row of the transition matrix (see Equation (2)) for the given time t, dividing the wheel into blocks with different surface shares. As Figure 3 also shows, if the generated number [ 0 , 1 ] falls on a block, the next state is found. For example, if the current state is “charging” S c and the ball falls on the green field according to the generated number, the next state is “unoccupied” S u . The data for every observed interval t are stored and analyzed for the given day, simulated time period along with the simulated sample size n. This includes state S t , charging power q t c , consumed energy e t c and energy not charged e t n for cases when PEV is plugged-in but not charging, where the charging power q t c is assumed to bear a constant value q t c = Q c 0 for state S c when energy is being consumed and q t c = Q c = 0 otherwise. The equation
e t c = q t c · Δ t
describes the consumed energy e t c for every interval t.

2.3. Revenues of the Charging Station Operator

As a last analysis, the CSO’s point of view will be taken into account. The CSO is interested in maximizing the revenues by selling electricity. For this paper, two simple typically used charging tariffs are considered [21]:
Tariff on energy consumption: The simplest tariff charges energy consumption only (e.g., EUR / kWh ). This kind of tariffs is often used, calculating the revenues in a given interval with the equation:
π e n e r g y = q t c · Δ t · c e n e r g y ,
where π e n e r g y represents the revenue as the product of the charged energy q t c · Δ t in the observed interval and the energy tariff c e n e r g y in EUR / kWh .
Tariff on plug-in duration: Consumption is only charged on a time basis (e.g., EUR / min ). Such a tariff helps to prevent PEV of being plugged but not charged. Equation
π t i m e = D p l u g i n · c t i m e
builds the basis of the method with π t i m e standing for the revenue as the product of the plug-in duration D p l u g i n for the customer and the tariff c t i m e in EUR / h . D p l u g i n will be increased by Δ t , when state is charging S c or plugged-in but not charging S n .

3. Case Study

We tested the proposed model algorithm in the urban area of Vienna, where the majority of residents park on the streets rather than in garages; therefore, no permanent charging opportunity may be available during nights. One convenient way for them to recharge their batteries is to seek out public fast-charging stations when needed, meaning that PEV drivers in Vienna are assumed to recharge when their battery SOC is around 20%. They are also willing to take shorter detours from their original route to reach a public charging station [22]. Furthermore, it is not likely for people to leave their PEVs for long periods at a fast charging station beyond the average charging duration. The behavior, as mentioned above, resembles ICE vehicle usage, where drivers tend to refuel only in case of an almost empty tank, and refueling only takes around 20 min.
One of the more used PEVs in Austria is the Nissan Leaf. Its most recent models come with a battery capacity of 40 kWh [23]. Considering an initial SOC of 20% at the beginning of the charging, it takes approximately 66 min to reach 80% SOC, if a constant charging power Q c of 22 kW is assumed throughout the charging process. These assumptions sufficiently approximate the situation in urban Vienna.
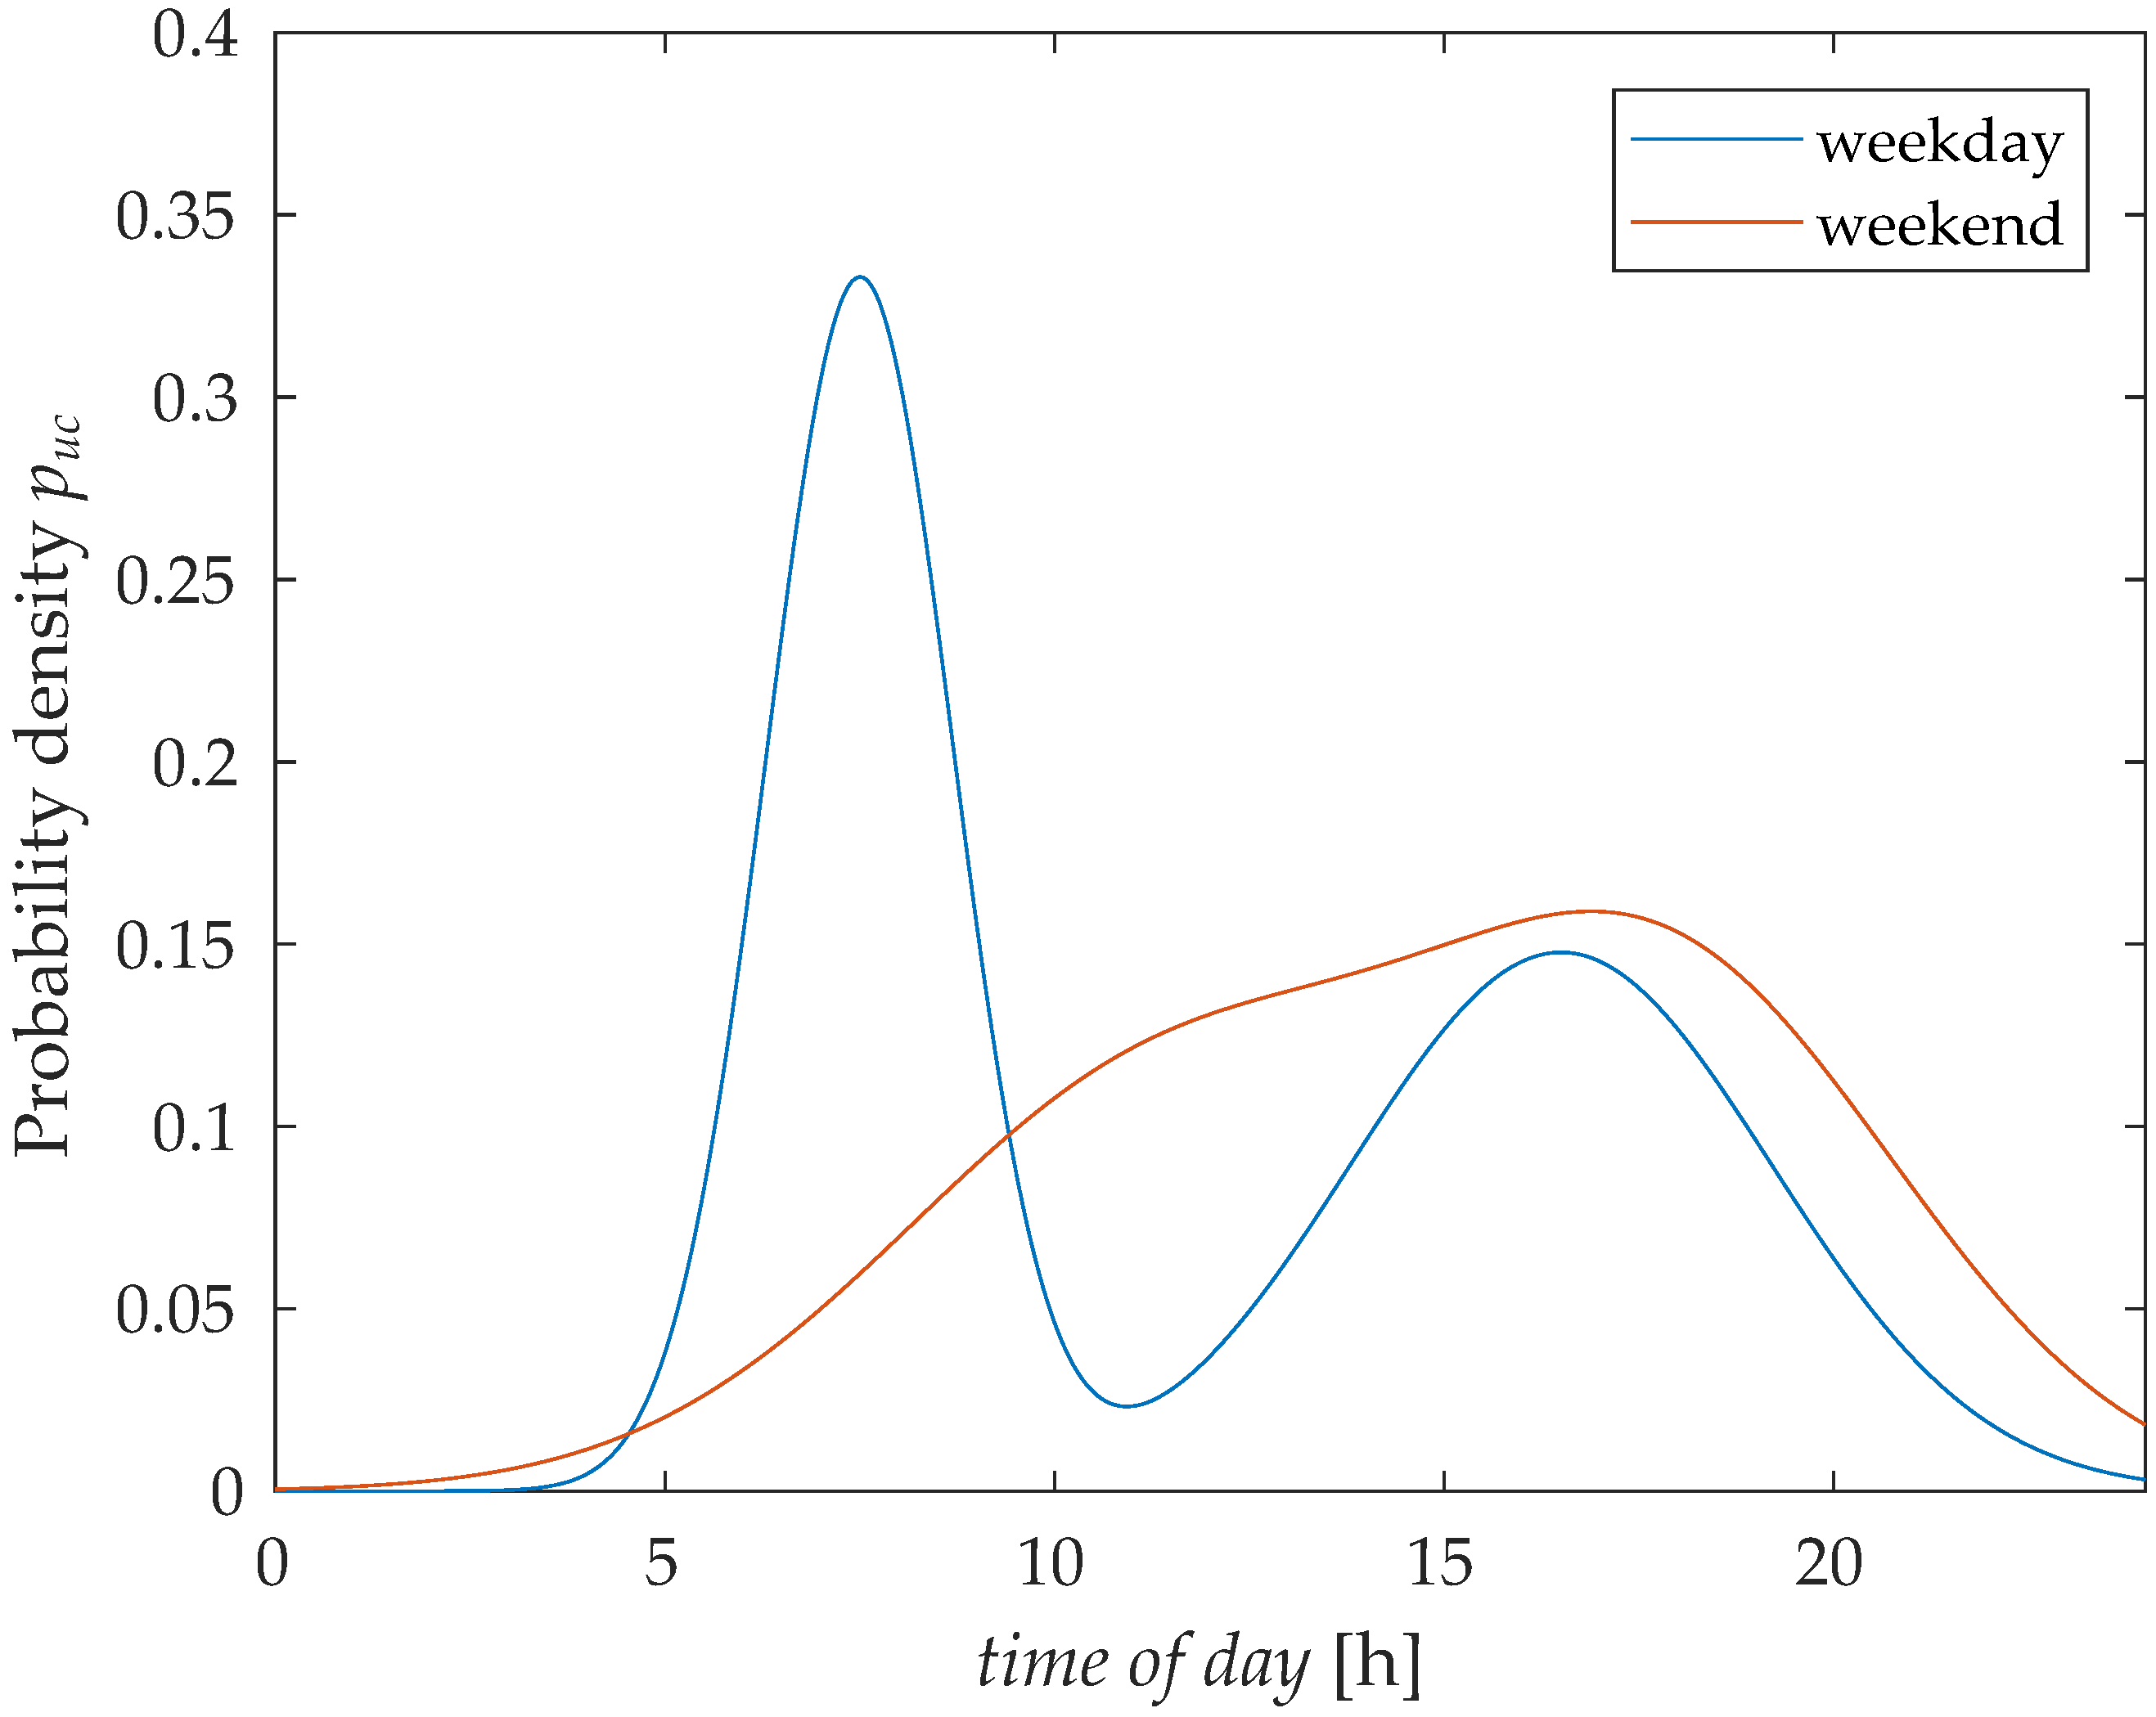
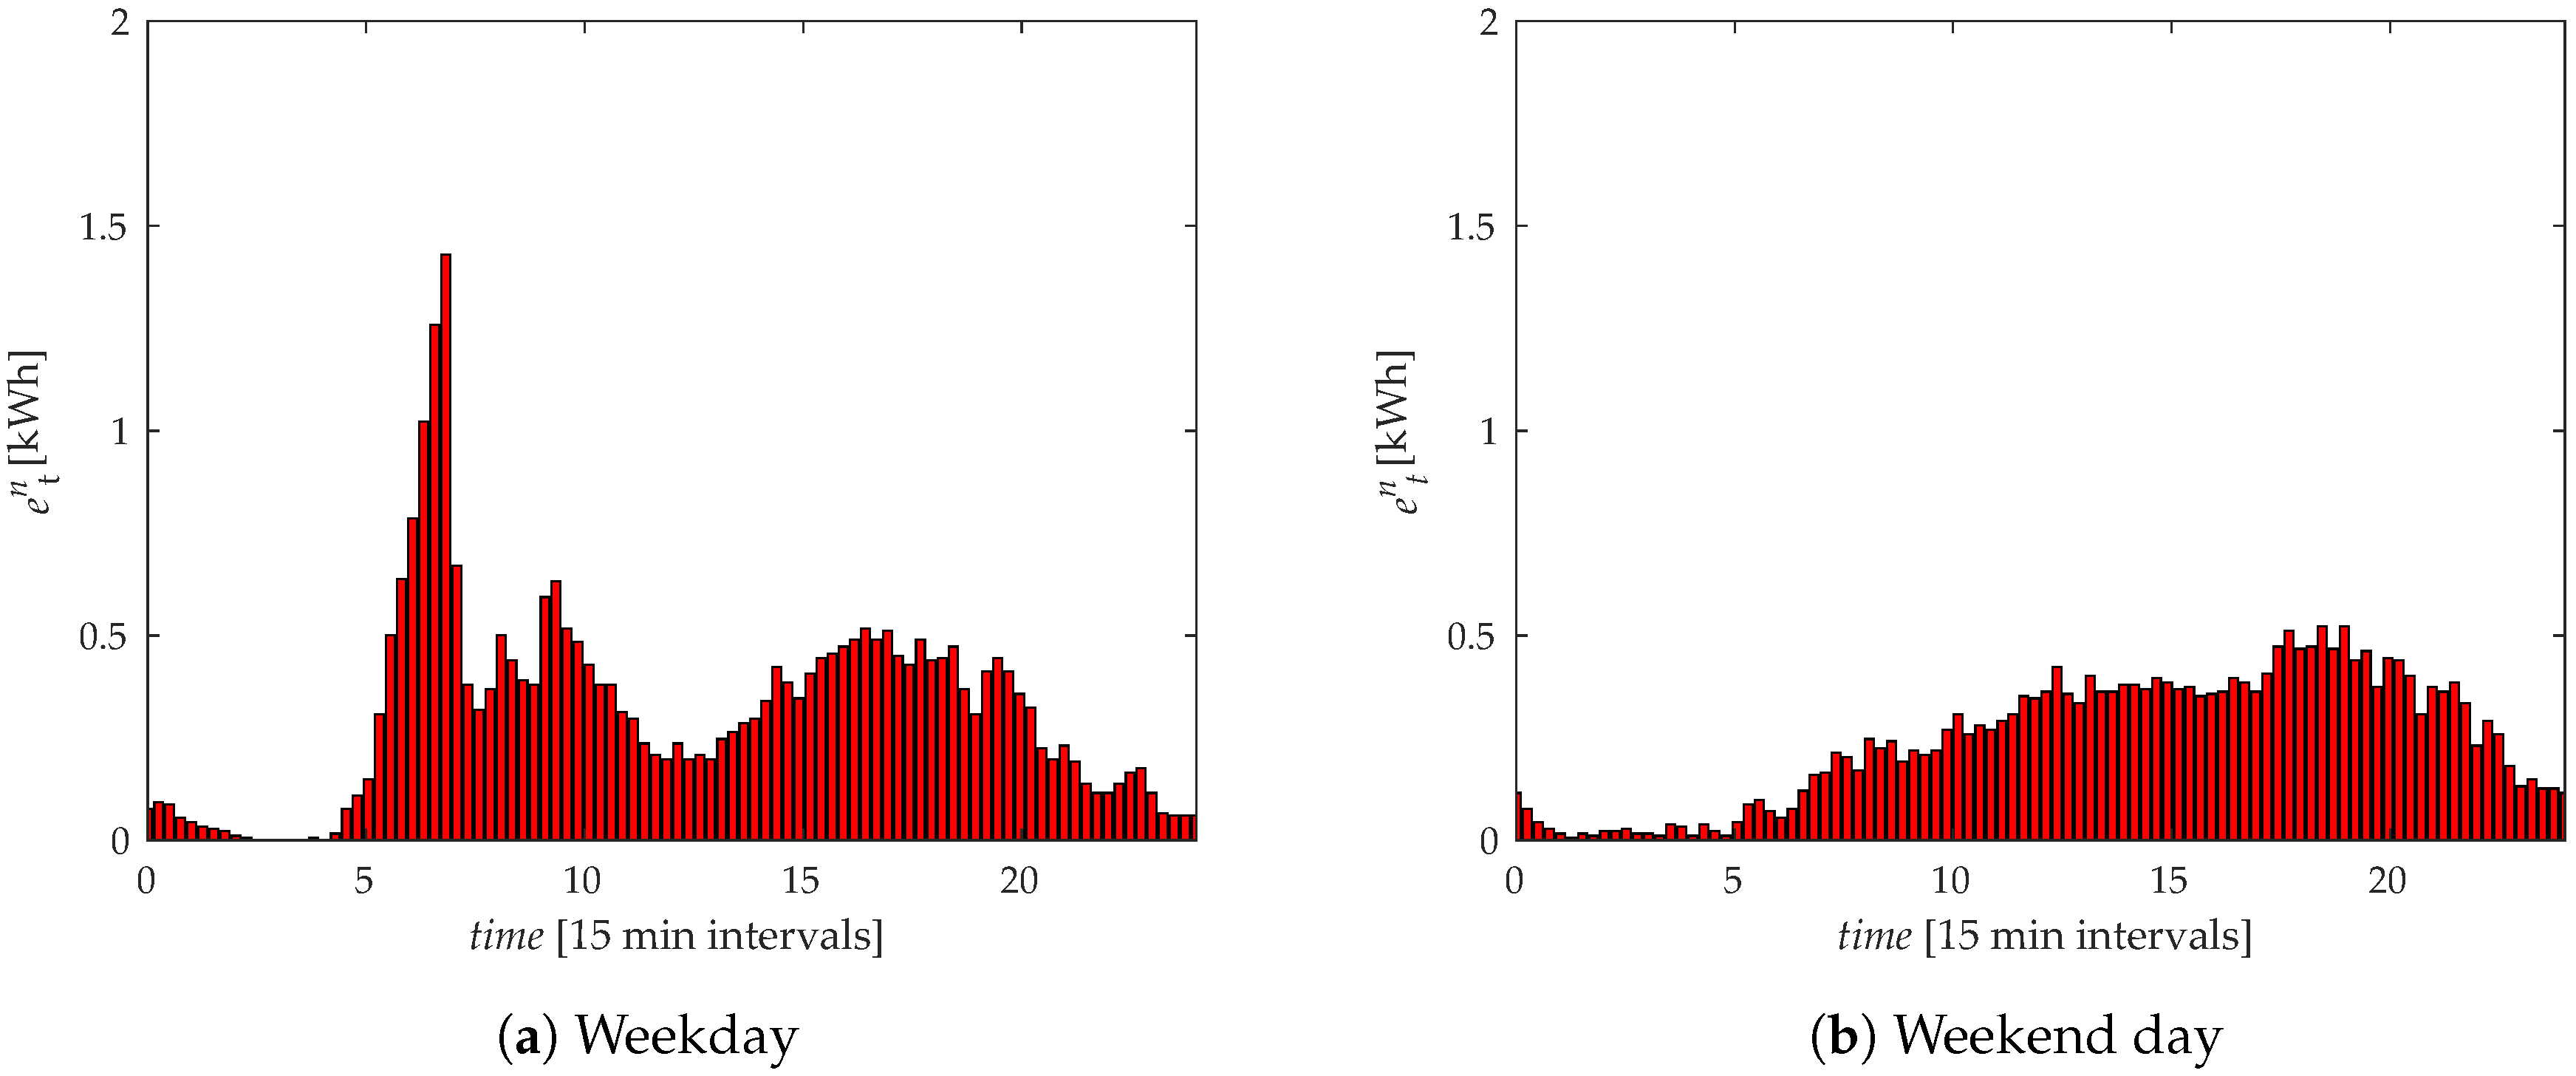
The accuracy of the model depends upon the chosen input parameters used in the algorithm. To identify the elements of the transition matrix (Equation (1)), the following assumptions are made: for the plug-in times of workday commuter traffic as well as for the weekend traffic normally distributed probability density functions from an Austrian study [7] are used. These functions are integrated for every hourly interval to calculate the transition probabilities p u c , t from state S u , t to S c , t . The curve for workdays suggests that five main periods are distinguished for the remaining sets of probabilities, p c c , t , p c u , t , p c n , t , p n n , t , and p n u , t : overnight (from 00:00 to 07:00), morning rush (from 07:00 to 09:00), working hours (from 09:00 to 17:00), evening commute (from 17:00 to 22:00) and evening (from 22:00 to 24:00). On the other hand, a weekend day has one assumed a general set of probabilities, p c c , t , p c u , t , p c n , t , p n n , t , and p n u , t . The probability density functions and the other sets of probabilities are shown in Figure 4 and Table 1, respectively.
The numbers in the table are assumed values for each time block, where earlier research results from [24,25] are considered. A clear variation of the probabilities according to the average charging duration is introduced in Table 1. Whether the actual charging is within or beyond the average duration in a specific moment, the probabilities differ in value. For example, if the charging duration is still within the average charging duration at a fast charging station, then generally there is a higher probability to be assumed, that the PEV remains plugged-in in the next time interval as well. If charging is beyond the average duration, the different times of day should be taken into account: as an example, to a PEV beyond the average charging in the morning rush belongs a lower probability of remaining in “charging”. In the case study, normally distributed average charging durations are used, which are generated right after the state jumps from “unoccupied” to “charging”. For the morning rush and evening commute, the distribution has a mean of 22.5 min, while for the remaining hours the distribution is defined with a mean of 40.5 min. For both cases, a standard deviation of 5 min is chosen.

4. Results and Discussions

In this section, we first verify the model for the case study. Secondly, we conduct a sensitivity analysis regarding the used probability density function, the time of the PEV being plugged-in along with the probabilities p c n , t and p n u , t . Finally, we elaborate on the revenues of the CSO in respect of two different tariff designs.

4.1. Verification of the Model

In a first step, we verify the model. Therefore, we use the initial state “unoccupied” in the very first time iteration of n. In future iterations, the Markov chain of Section 2.1 provides the states following the conditions of an algorithm in Section 2.2. For the next iteration, the last state from the previous one is inherited.
Calculations are conducted every 15 min within a workday, a weekend day and within a whole week for a sample size of N = 1000 . This means that the model runs N times for every tested day storing data in 15-min intervals. The performance of the model is high, e.g., the authors used an PC with an Intel i5 and 16 GB RAM and accomplished on model run ( N = 1 ) within 1.78 s and ( N = 1000 ) in 1359 s.
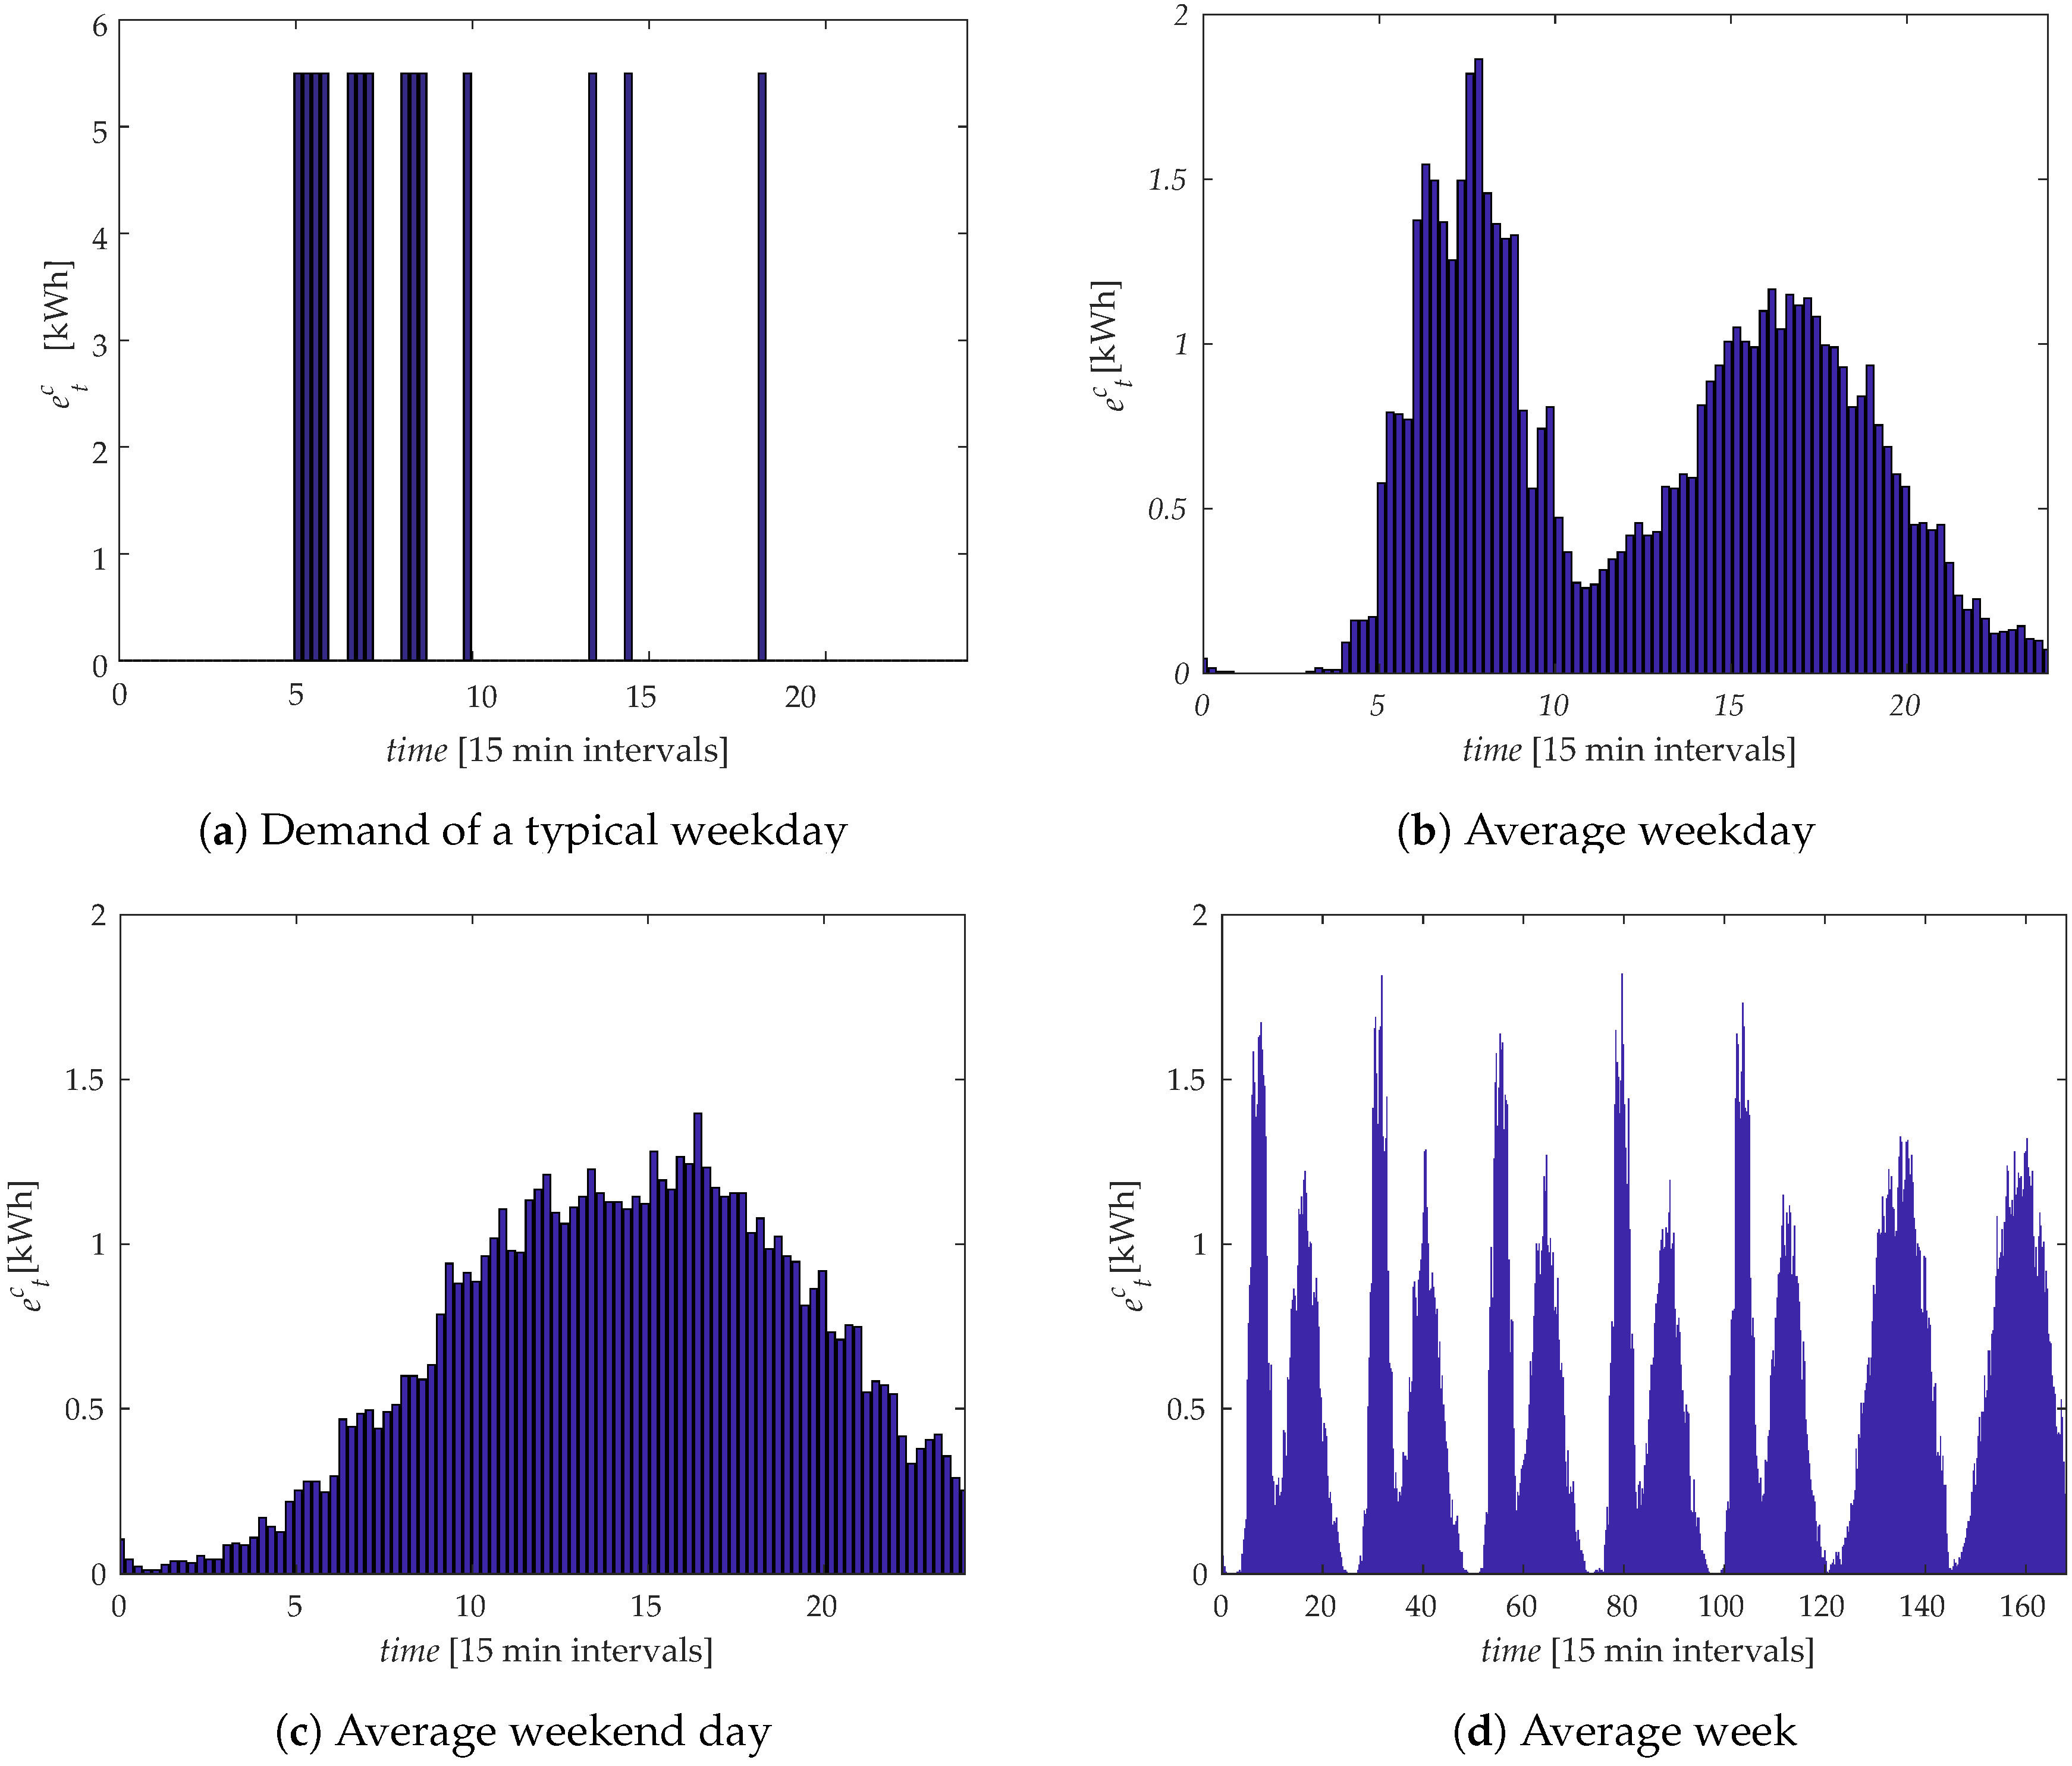
Figure 5a shows the typical consumption of one weekday. As the charging station is either charging a PEV or not, the power is either 22 kW or 0 kW. Thus, Figure 5b,c also shows the average consumed energy in each interval for N runs for the two different types of day. It is important to note that caused by the random number generation in the time intervals, each run of the algorithm in Figure 2 brings a slightly different result; nonetheless, all results follow the curves in Figure 4 apart from slight deviations. For example, before and after the morning rush, there is a higher assumed likelihood of leaving the PEV plugged-in without actual charging. This is shown in Figure 6a, where there are two peaks before (from 6:00 to 7:00) and after (from 9:00 to 10:00) the morning rush period, meaning a higher amount of energy not being sold, while the station is occupied. The total amount of energy not being sold may be calculated by the charging stations capacity and the charging demand. In fact, Figure 5 shows it indirectly by the difference in electricity demand and charging station’s capacity times Δ t (in our case, 22   kW × 15   min = 5.5   kWh ). In this case, monetary energy losses for the CSO of the charging station occurs.
Power consumption for a full week starting with a Monday is demonstrated in Figure 5d. One takeaway of the model’s verification is the fact that the proposed model based on the Markov chain brings charging and occupational patterns which follow the plug-in probability density functions in Figure 4.

4.2. Sensitivity Analysis

As has already been stated above, the accuracy of the model depends upon the chosen input parameters used in the algorithm. The probabilities introduced in the case study description (Table 1) were based on qualitative results of [24,25]. To verify the proposed model, we conducted a sensitivity analysis for a weekday, where the influence of an input parameter on the output is calculated. Thus, we alternated the following parameters to get a better understanding of the model:
  • the mean and the deviation of the charging distribution;
  • times of the PEV being plugged in; and
  • the probabilities p c n , t and p n u , t within and beyond the average charging duration.
Consequentially, we ran the whole model 100 times with a sample size of N = 1000 for all parameter variations and compared it to the model with the original input. This is important, since each time the model is run for a specific sample size N, it provides a different result caused by the random number generation in the iterations. Thus, for this purpose, mean values out of the 100 runs are determined and compared for the original as well as for the altered parameters.

4.2.1. Sensitivity of the Charging Duration

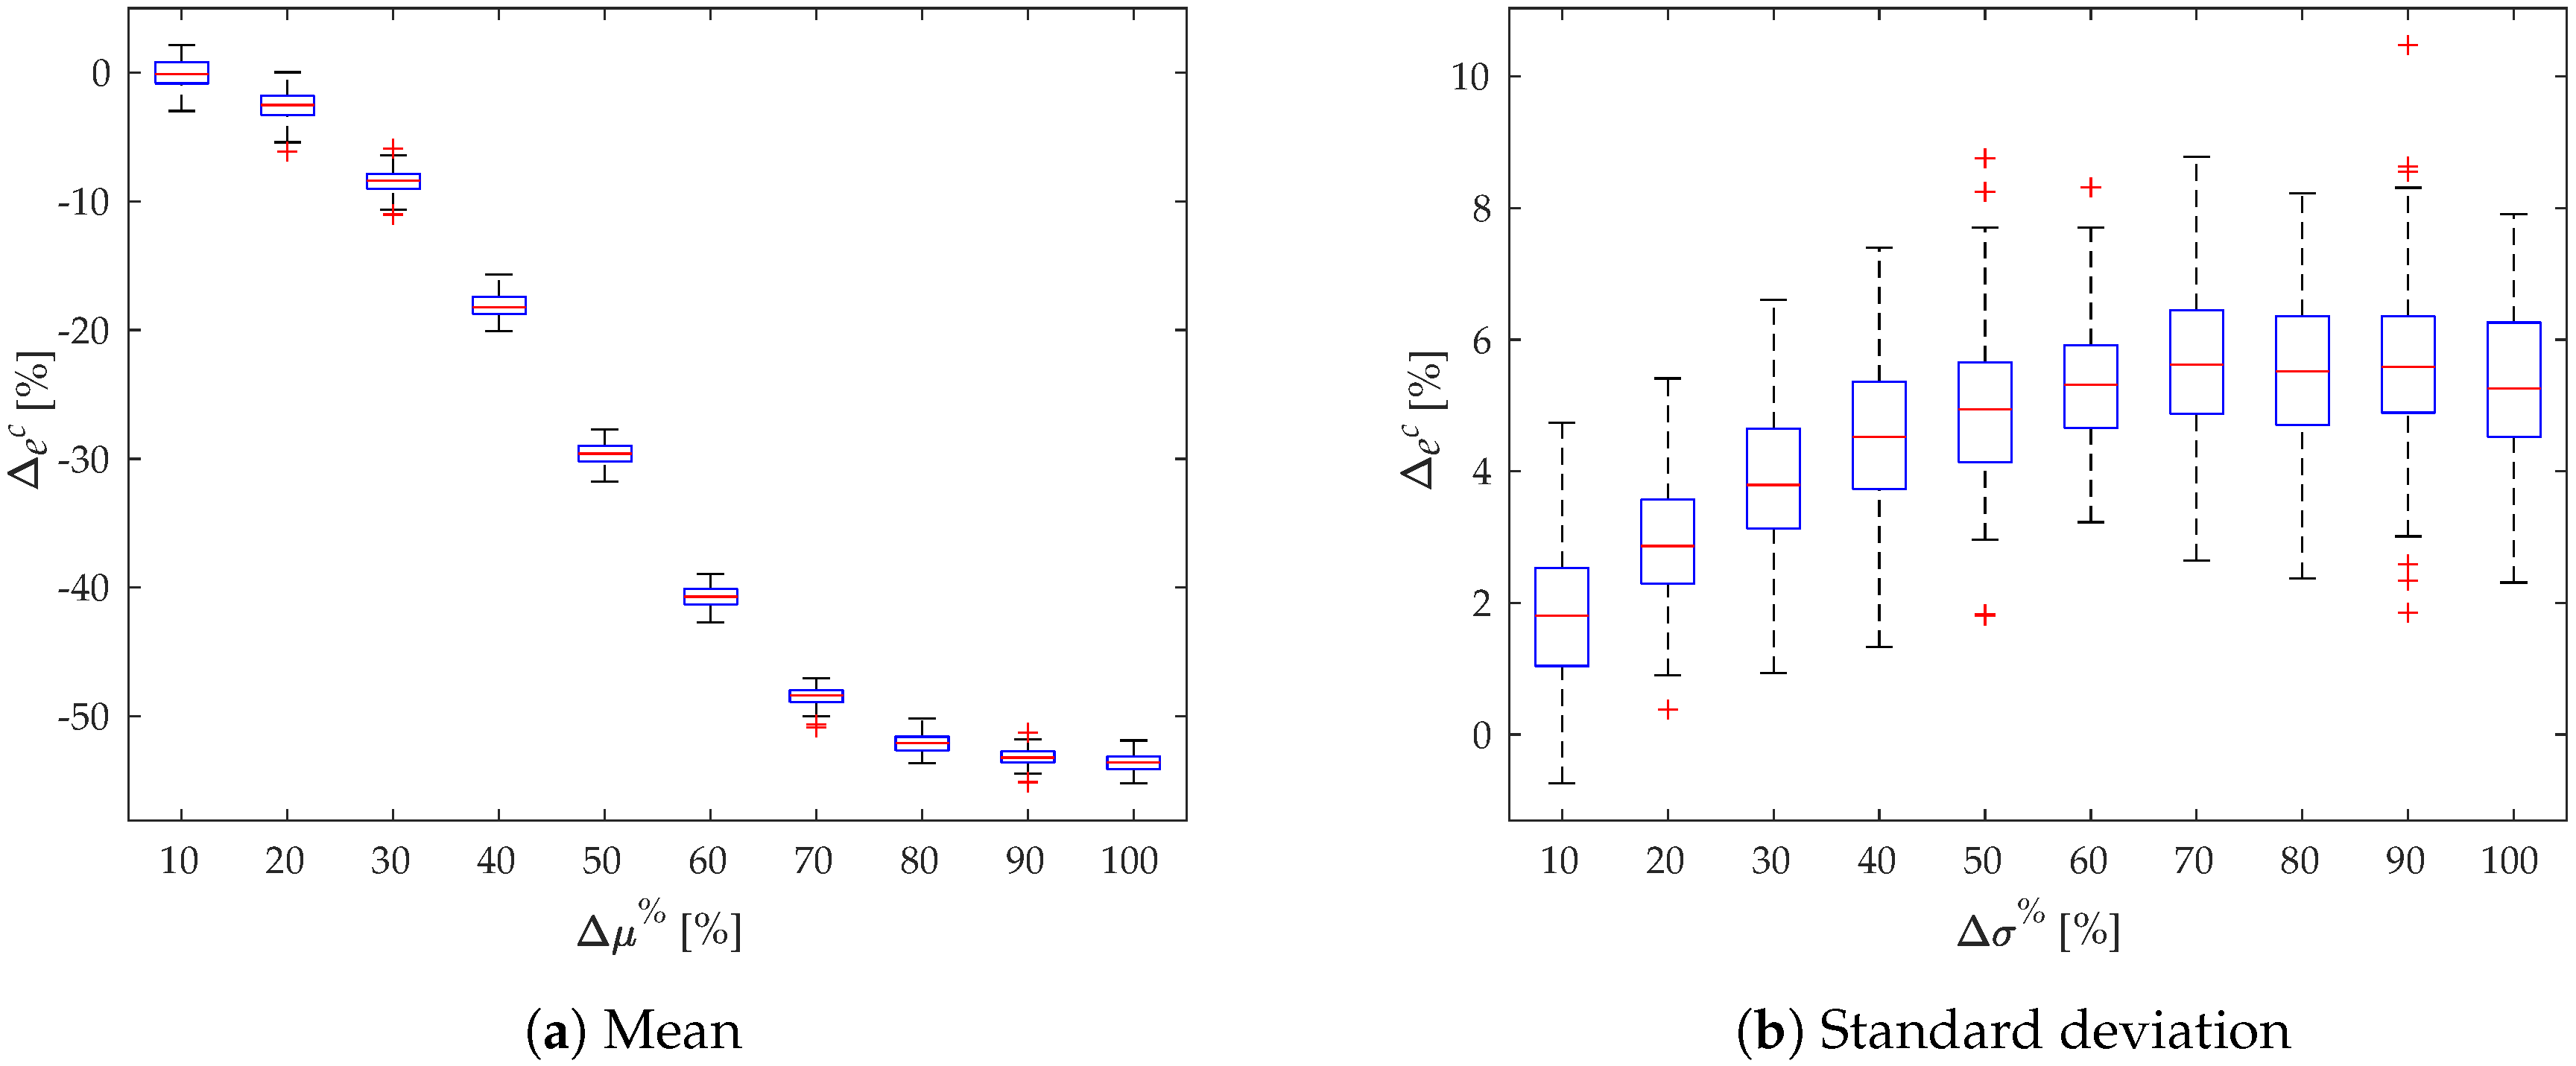
Whether the charging process is still within the average charging duration has a huge impact on the probabilities used (see also Table 1). The box plots in Figure 7 show to what percentage the consumed energy in a weekday responds to changes in parameters of the normal distributions in Section 3. If the mean is increased in 10% steps μ · ( 1 + Δ μ % ) , then the mean of the consumed energy is also rising in Figure 7a. On the other hand, a similar increase in the standard deviation values σ · ( 1 + Δ σ % ) does not implicate a rise in consumption Figure 7b.

4.2.2. Sensitivity of the Plug-in Time

The consequence of altering the distribution parameters for plug-in times (Figure 4) are shown in Figure 8. Increasing the mean values μ · ( 1 + Δ μ % ) result in a decrease in the energy loads during the day, whereas changes in the standard deviations σ · ( 1 + Δ σ % ) show an opposite trend. The drastic decrease in Figure 8a is explainable by the plug-in times being shifted to the next day causing the loads on a tested day to fall.

4.2.3. Sensitivity of the Probabilities p c n , t , p n u , t

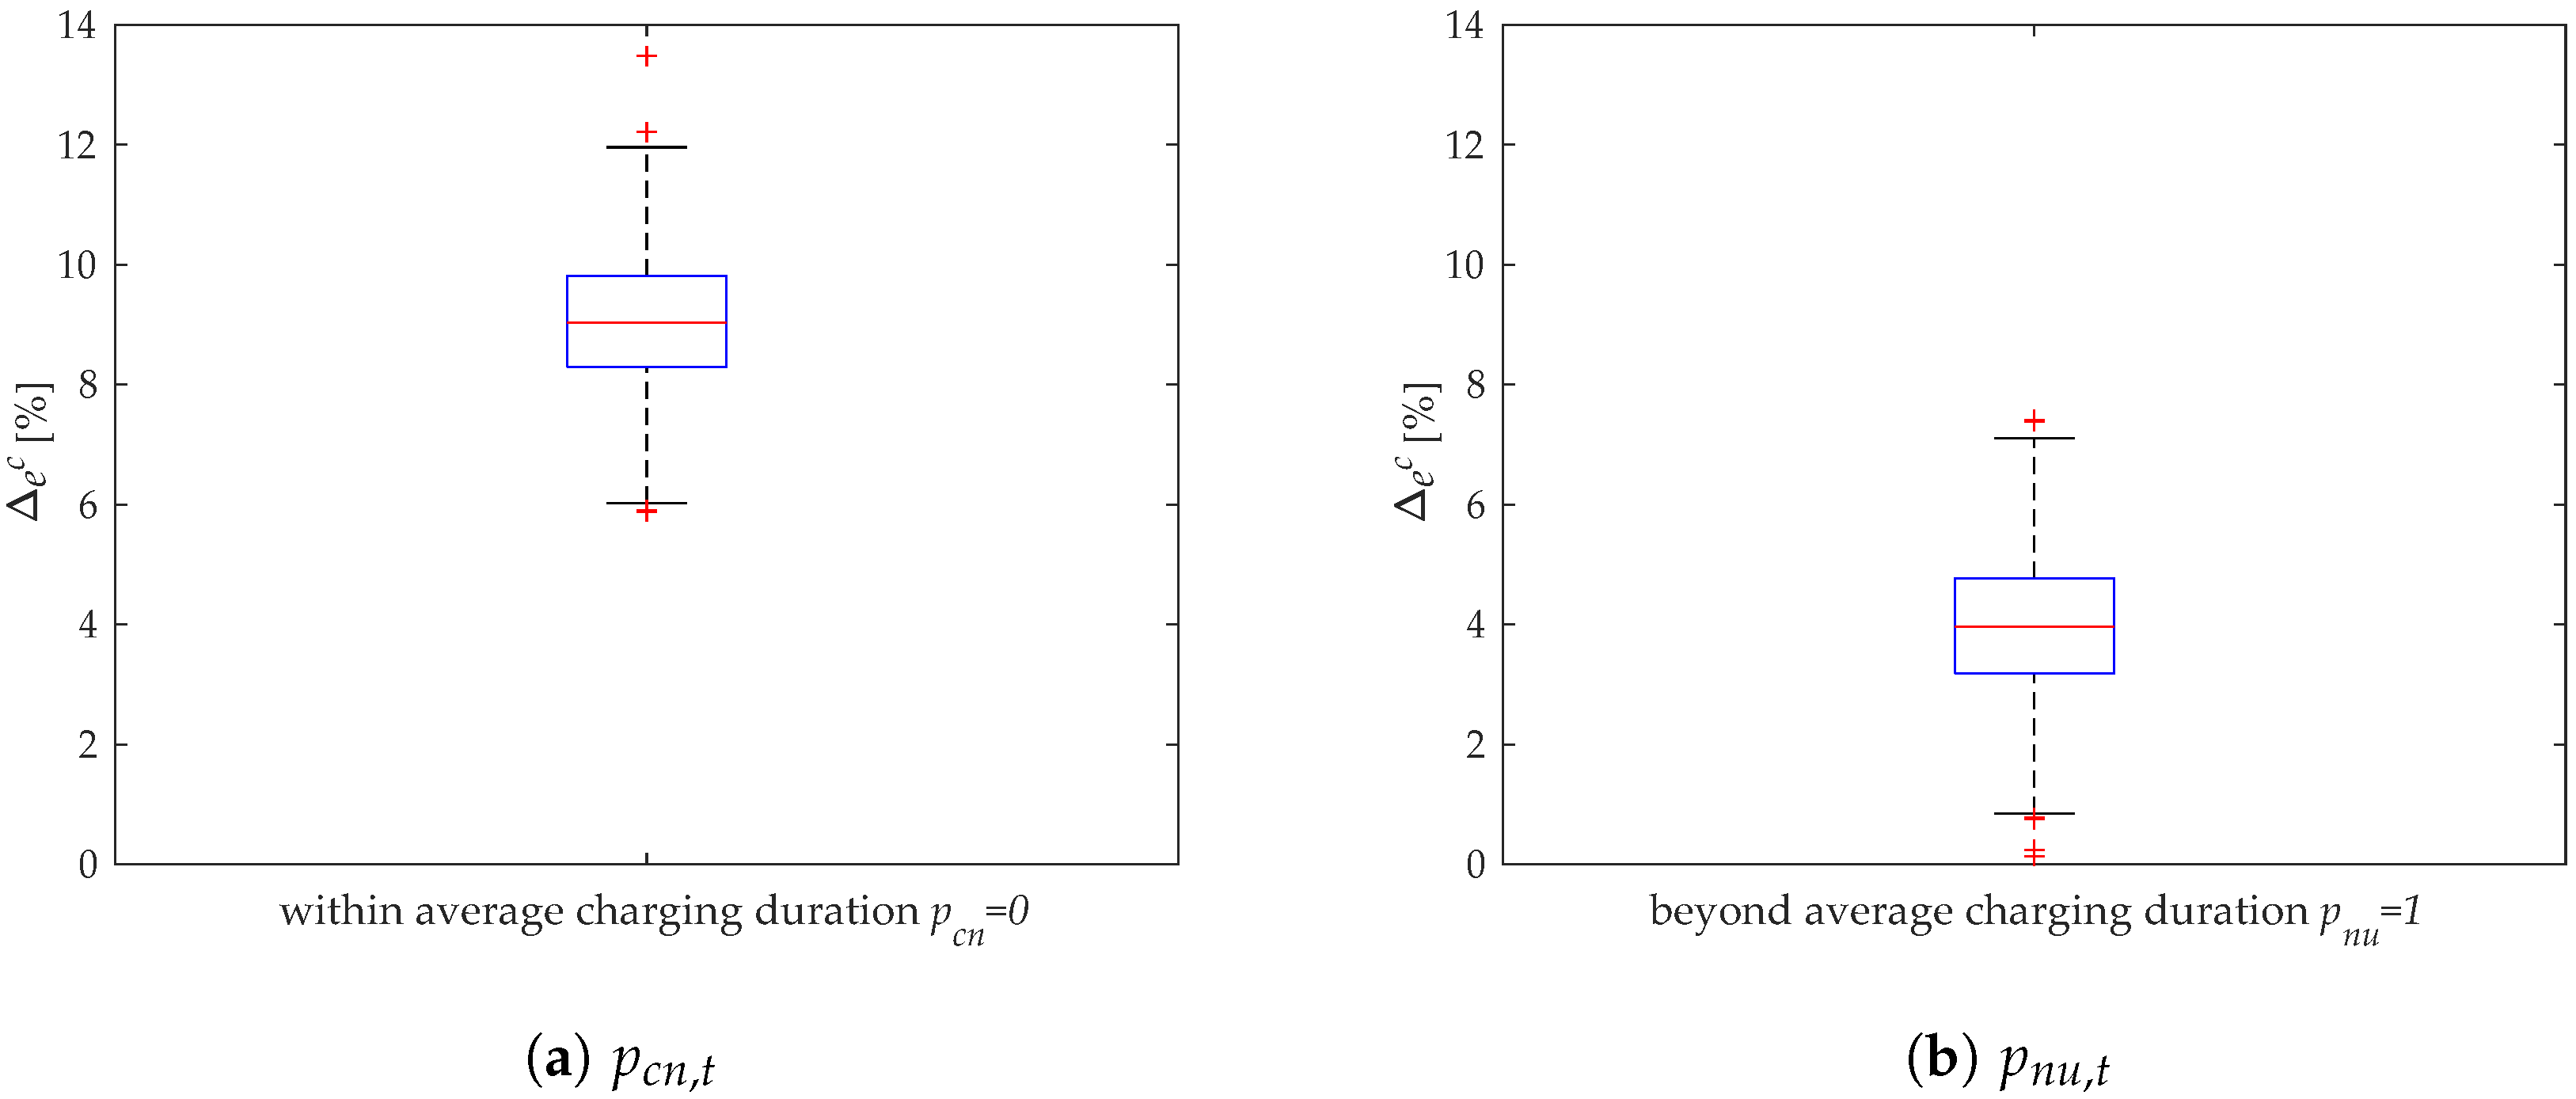
Time intervals under the condition “plugged-in but not charging” mean that no energy can be withdrawn, even though the station is occupied (Figure 6). The following considerations try to eliminate the huge impact of the state S n in the Markov chain results. Thus, we assume that only the two states “unoccupied” and “charging” exist. In the case of the probability p c n , t set to 0 within the average charging duration (see Table 1), the energy consumption shows a significant increase according to Figure 9a. If the probability p n u , t of jumping back from S n to S u beyond the average duration is set to 1, the load slightly increases as Figure 9b depicts.

4.3. Monetary Impact of Different Tariff Designs to the Charging Station Operator

The assumptions of the case study are applied to calculate the annual revenues of the CSO. The model is run for a sample size of N = 1000 , after which Equations (5) and (6) in Section 2.3 are utilized for the retrieved results. Figure 10 shows the resulting box plots for the CSO’s annual revenues for the introduced two energy charging tariffs. In this case, c e n e r g y = 0.308 EUR/kWh [21], c t i m e = 4.8 EUR/h [26] (both from Austrian based CSOs).
Here, the energy based system serves with a smaller deviation than the time based according to the model. These results are very surprising, as a lower standard deviation of the revenues of the time-based tariffs has been assumed. On the contrary, the standard deviation of the energy based tariff serves with a smaller deviation than the time-based. The explanation is that the states S c , t + S n , t (time based) have a higher standard deviation than the state S c , t (energy based). Another scaling (Table 1) of the model may provide different results.

5. Conclusions

Widespread PEV usage requires accurate spatial and temporal analysis of charging habits to maintain a stable charging infrastructure along with the electric distribution grid. To address the question of charging behavior and the charging profile, we developed a stochastic model based on Markov Chains. The results of the case study implicate that, in the case of an available dataset providing adequate PEV statistics and real probability values as an input for the model, the algorithm can serve with valuable stochastic information about electricity consumption at a given location. The application of this tool may help retailing companies or power traders to buy an appropriate volume of energy.
Furthermore, we showed that the annual revenues of the CSO tend to have higher standard deviation applying a time-based tariff system for the case study, although the consumers’ may adopt their charging behavior in respect of the tariff design. As the model is easily scalable, future work may use the algorithm to model PEV charging stations in a high temporal resolution, e.g., as an input of local trading or peer-to-peer optimization models. However, if PEV market penetration keeps its increasing trend, other aspects such as standardization procedures, smart charging, and the vehicle-to-grid charging scenarios cannot be neglected, and form the basis of future research as well. Another future application of the model addresses the tariff design. If information of the consumers is available, the model may help in designing the most economic tariff for the CSO. In the case that such a research may be conducted, consumer behavior has to be included as well, as they adopt their charging behavior to the tariff design.

Author Contributions

Conceptualization, P.S. and A.F.; Methodology, P.S. and A.F.; Software, P.S.; Validation, P.S. and A.F.; Formal Analysis, P.S. and A.F.; Investigation, P.S.; Resources, G.L.; Data Curation, A.F.; Writing—Original Draft Preparation, P.S.; Writing—Review and Editing, A.F., G.L. and H.A.; Visualization, P.S. and A.F.; Supervision, G.L. and H.A.; and Project Administration, G.L.

Funding

This research was funded by Austrian Research Promotion Agency (FFG) and Austrian Climate and Energy Fund grant number 864996.

Conflicts of Interest

The authors declare no conflict of interest. The founding sponsors had no role in the design of the study; in the collection, analyses, or interpretation of data; in the writing of the manuscript, and in the decision to publish the results.

Abbreviations

The following abbreviations are used in this manuscript:
ACAlternating Current
CSOCharging Station Operator
EVElectric vehicle
PEVPlug-in electric vehicles
PHEVPlug-in hybrid electric vehicles
SOCState of charge
ICEInternal combustion engine
NHTSNational Household Travel Survey

References

  1. European Commission. Electrification of the Transport System. Available online: ec.europa.eu/newsroom/horizon2020/document.cfm?doc_id=46368 (accessed on 21 July 2018).
  2. Yunus, K.; Parra, H.Z.D.L.; Reza, M. Distribution grid impact of Plug-In Electric Vehicles charging at fast charging stations using stochastic charging model. In Proceedings of the 2011 14th European Conference on Power Electronics and Applications, Birmingham, UK, 30 August–1 September 2011; pp. 1–11. [Google Scholar]
  3. MacDougall, W. Electromobility in Germany: Vision 2020 and Beyond; Technical Report; Germany Trade & Invest: Berlin, Germany, 2016. [Google Scholar]
  4. Bundesministerium für Verkehr, Innovation und Technologie. BMVIT—Gesamtverkehrsplan für Österreich. Available online: https://www.bmvit.gv.at/verkehr/gesamtverkehr/gvp/index.html (accessed on 21 July 2018).
  5. Wieland, T.; Reiter, M.; Schmautzer, E.; Fickert, L.; Fabian, J.; Schmied, R. Probabilistische Methode zur Modellierung des Ladeverhaltens von Elektroautos anhand gemessener Daten elektrischer Ladestationen—Auslastungsanalysen von Ladestationen unter Berücksichtigung des Standorts zur Planung von elektrischen Stromnetzen. e & i Elektrotechnik und Informationstechnik 2015, 132, 160–167. [Google Scholar] [CrossRef]
  6. Simer, A. Elektromobilität Österreich: Umweltargumente Stützen Investitionen ins Ladenetz. 2018. Available online: https://www.gtai.de/GTAI/Navigation/DE/Trade/Maerkte/suche,t=elektromobilitaet-oesterreich-umweltargumente-stuetzen-investitionen-ins-ladenetz,did=1887466.html (accessed on 20 July 2018).
  7. Litzlbauer, M. Erstellung und Modellierung von Stochastischen Ladeprofilen Mobiler Energiespeicher mit MATLAB; Technische Universität Wien: Vienna, Austria, 2009. [Google Scholar]
  8. Qian, K.; Zhou, C.; Allan, M.; Yuan, Y. Modeling of Load Demand Due to EV Battery Charging in Distribution Systems. IEEE Trans. Power Syst. 2011, 26, 802–810. [Google Scholar] [CrossRef]
  9. Pashajavid, E.; Golkar, M.A. Charging of plug-in electric vehicles: Stochastic modelling of load demand within domestic grids. In Proceedings of the 20th Iranian Conference on Electrical Engineering (ICEE 2012), Tehran, Iran, 15–17 May 2012; pp. 535–539. [Google Scholar]
  10. Yan, Q.; Qian, C.; Zhang, B.; Kezunovic, M. Statistical analysis and modeling of plug-in electric vehicle charging demand in distribution systems. In Proceedings of the 2017 19th International Conference on Intelligent System Application to Power Systems (ISAP), San Antonio, TX, USA, 17–20 September 2017; pp. 1–6. [Google Scholar]
  11. Grahn, P.; Alvehag, K.; Söder, L. Plug-in-vehicle mobility and charging flexibility Markov model based on driving behavior. In Proceedings of the 2012 9th International Conference on the European Energy Market, Florence, Italy, 10–12 May 2012; pp. 1–8. [Google Scholar]
  12. Grahn, P.; Munkhammar, J.; Widén, J.; Alvehag, K.; Söder, L. PHEV Home-Charging Model Based on Residential Activity Patterns. IEEE Trans. Power Syst. 2013, 28, 2507–2515. [Google Scholar] [CrossRef]
  13. Daina, N.; Sivakumar, A.; Polak, J.W. Modelling electric vehicles use: A survey on the methods. Renew. Sustain. Energy Rev. 2017, 68, 447–460. [Google Scholar] [CrossRef]
  14. Ligen, Y.; Vrubel, H.; Girault, H. Mobility from Renewable Electricity: Infrastructure Comparison for Battery and Hydrogen Fuel Cell Vehicles. World Electr. Veh. J. 2018, 9, 3. [Google Scholar] [CrossRef]
  15. Wang, S.; Meng, K.; Luo, F.; Xu, Z.; Zheng, Y. Stochastic collaborative planning method for electric vehicle charging stations. In Proceedings of the 2016 IEEE International Conference on Smart Grid Communications (SmartGridComm), Sydney, Australia, 6–9 November 2016; pp. 503–508. [Google Scholar]
  16. García-Villalobos, J.; Zamora, I.; San Martín, J.I.; Asensio, F.J.; Aperribay, V. Plug-in electric vehicles in electric distribution networks: A review of smart charging approaches. Renew. Sustain. Energy Rev. 2014, 38, 717–731. [Google Scholar] [CrossRef]
  17. Olivetti, E.A.; Ceder, G.; Gaustad, G.G.; Fu, X. Lithium-Ion Battery Supply Chain Considerations: Analysis of Potential Bottlenecks in Critical Metals. Joule 2017, 1, 229–243. [Google Scholar] [CrossRef]
  18. Moreira, C.; Lopes, J.P.; Almeida, P.R.; Seca, L.; Soares, F.J. A stochastic model to simulate electric vehicles motion and quantify the energy required from the grid. In Proceedings of the 17th Power Systems Computation Conference, Stockholm, Sweden, 22–26 August 2011. [Google Scholar]
  19. Kroese, D.P.; Rubinstein, R.Y. Monte Carlo methods. Wiley Interdiscip. Rev. Comput. Stat. 2012, 4, 48–58. [Google Scholar] [CrossRef]
  20. Leou, R.; Su, C.; Lu, C. Stochastic Analyses of Electric Vehicle Charging Impacts on Distribution Network. IEEE Trans. Power Syst. 2014, 29, 1055–1063. [Google Scholar] [CrossRef]
  21. Schroeder, A.; Traber, T. The economics of fast charging infrastructure for electric vehicles. Energy Policy 2012, 43, 136–144. [Google Scholar] [CrossRef]
  22. Wu, F.; Sioshansi, R. A stochastic flow-capturing model to optimize the location of fast-charging stations with uncertain electric vehicle flows. Transp. Res. Part D Transp. Environ. 2017, 53. [Google Scholar] [CrossRef]
  23. Varianten und Preise Der NISSAN LEAF 2018—Elektroauto. Available online: https://www.nissan.at/fahrzeuge/neuwagen/leaf/varianten-preise.html (accessed on 9 August 2018).
  24. Jiang, H.; Ren, H.; Sun, C.; Watts, D. The temporal-spatial stochastic model of plug-in hybrid electric vehicles. In Proceedings of the 2017 IEEE PES Innovative Smart Grid Technologies Conference Europe (ISGT-Europe), Torino, Italy, 26–29 September 2017; pp. 1–6. [Google Scholar]
  25. Fluhr, J.; Ahlert, K.; Weinhardt, C. A Stochastic Model for Simulating the Availability of Electric Vehicles for Services to the Power Grid. In Proceedings of the 2010 43rd Hawaii International Conference on System Sciences, Kauai, HI, USA, 5–8 January 2010; pp. 1–10. [Google Scholar]
  26. Tanke Wien Energie Tarifübersicht. Available online: https://www.tanke-wienenergie.at/tarifuebersicht/ (accessed on 28 August 2018).
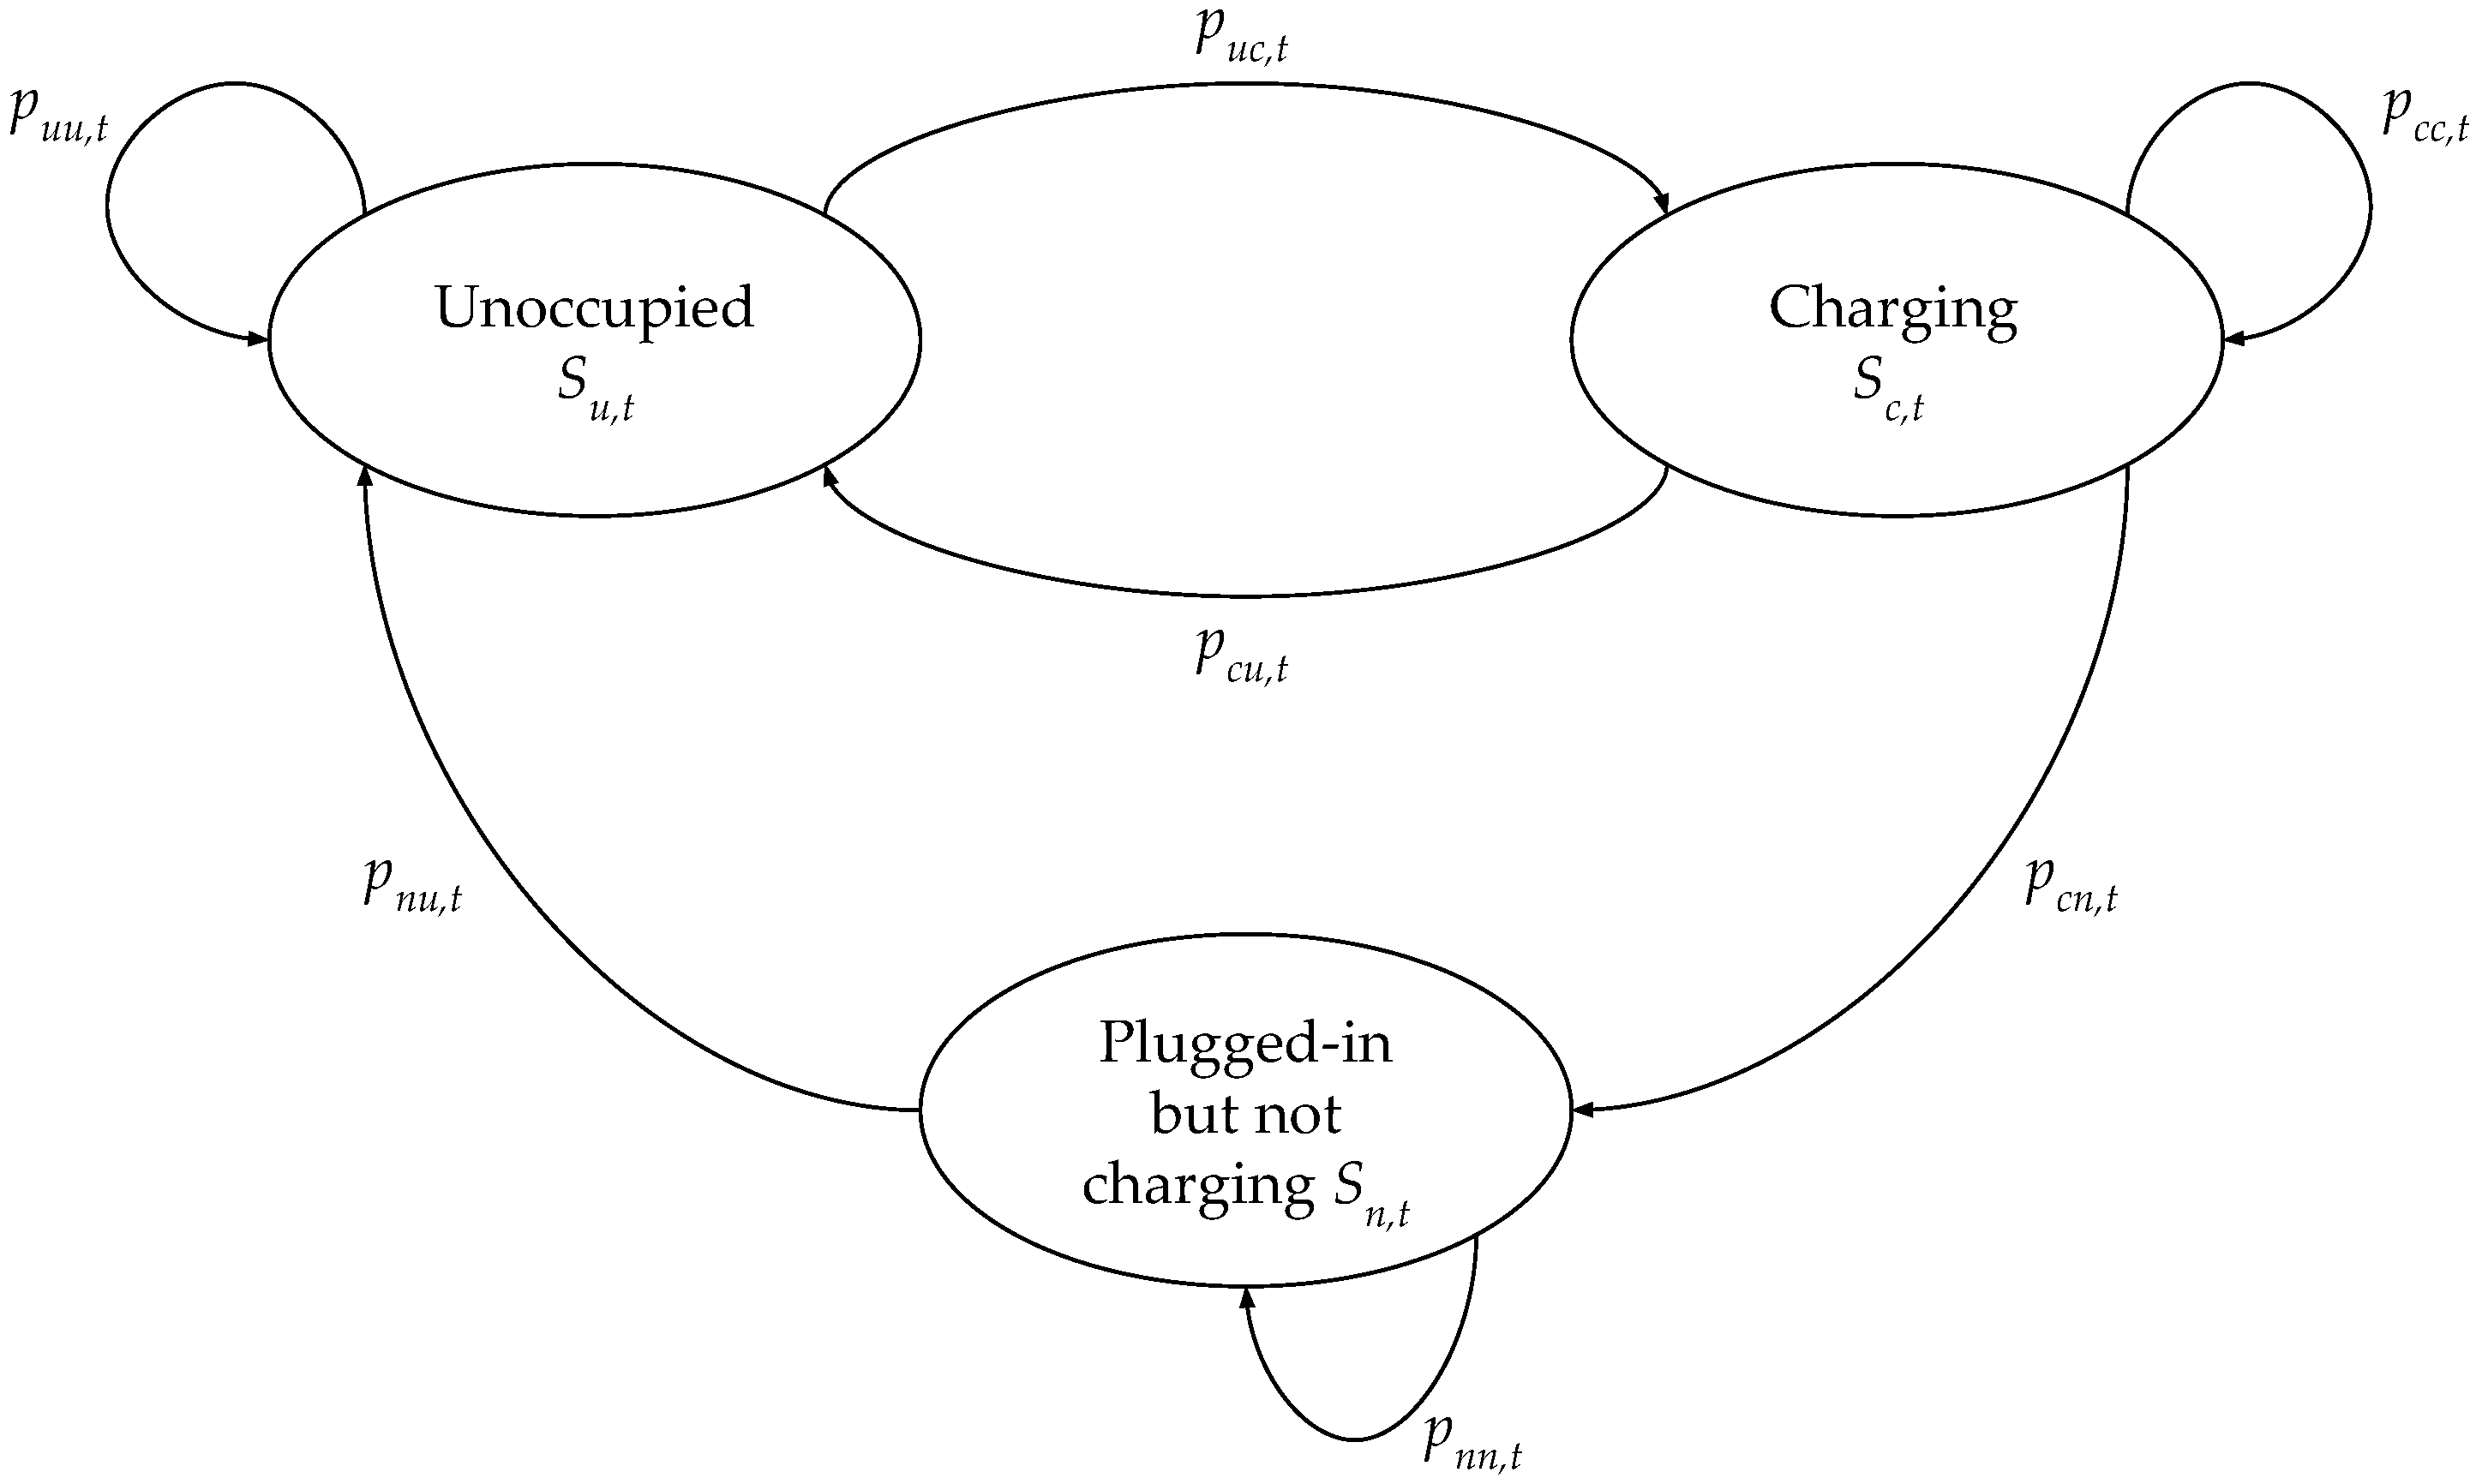
Figure 1. Markov chain transition states.
Wevj 09 00044 g001
Figure 2. Algorithm flowchart.
Wevj 09 00044 g002
Figure 3. Example for roulette wheel selection: generated number (gray dot) falls on “plugged in but not charging”.
Wevj 09 00044 g003
Figure 4. Probability density functions of plug-in times.
Wevj 09 00044 g004
Figure 5. Average consumed energy in each interval for a N = 1000 .
Wevj 09 00044 g005
Figure 6. Average energy not charged due to plugged-in fully charged PEVs in each interval for a N = 1000 .
Wevj 09 00044 g006
Figure 7. Variation of the parameters of the average charging duration.
Wevj 09 00044 g007
Figure 8. Variation of the plug-in time distributions in Figure 4.
Wevj 09 00044 g008
Figure 9. The parameters p c n , t and p n u , t in Table 1 are varied.
Wevj 09 00044 g009
Figure 10. Annual revenues of the CSO for the two types of tariffs.
Wevj 09 00044 g010
Table 1. Sets of probabilities for within and beyond average charging duration.
Witgin Average DurationOvernightMorning RushWorking HoursEvening CommuteEveningWeekend
p c c , t 0.60.450.50.60.60.6
p c u , t 0.10.450.40.30.10.3
p c n , t 0.30.10.10.10.30.1
p n n , t 0.70.60.60.60.70.6
p n u , t 0.30.40.40.40.30.4
Beyond Average DurationOvernightMorning RushWorking HoursEvening CommuteEveningWeekend
p c c , t 0.30.20.20.20.30.2
p c u , t 0.10.50.30.30.10.3
p c n , t 0.60.30.50.50.60.5
p n n , t 0.70.30.70.40.40.4
p n u , t 0.30.70.30.60.60.6