Stochastic Modeling of the Charging Behavior of Electromobility


Abstract
:1. Introduction
- The charging pattern of a charging station is described by a stochastic process implementing the Markov chain.
- Based on the stochastic process, an algorithm designed for high performance and scalability is developed.
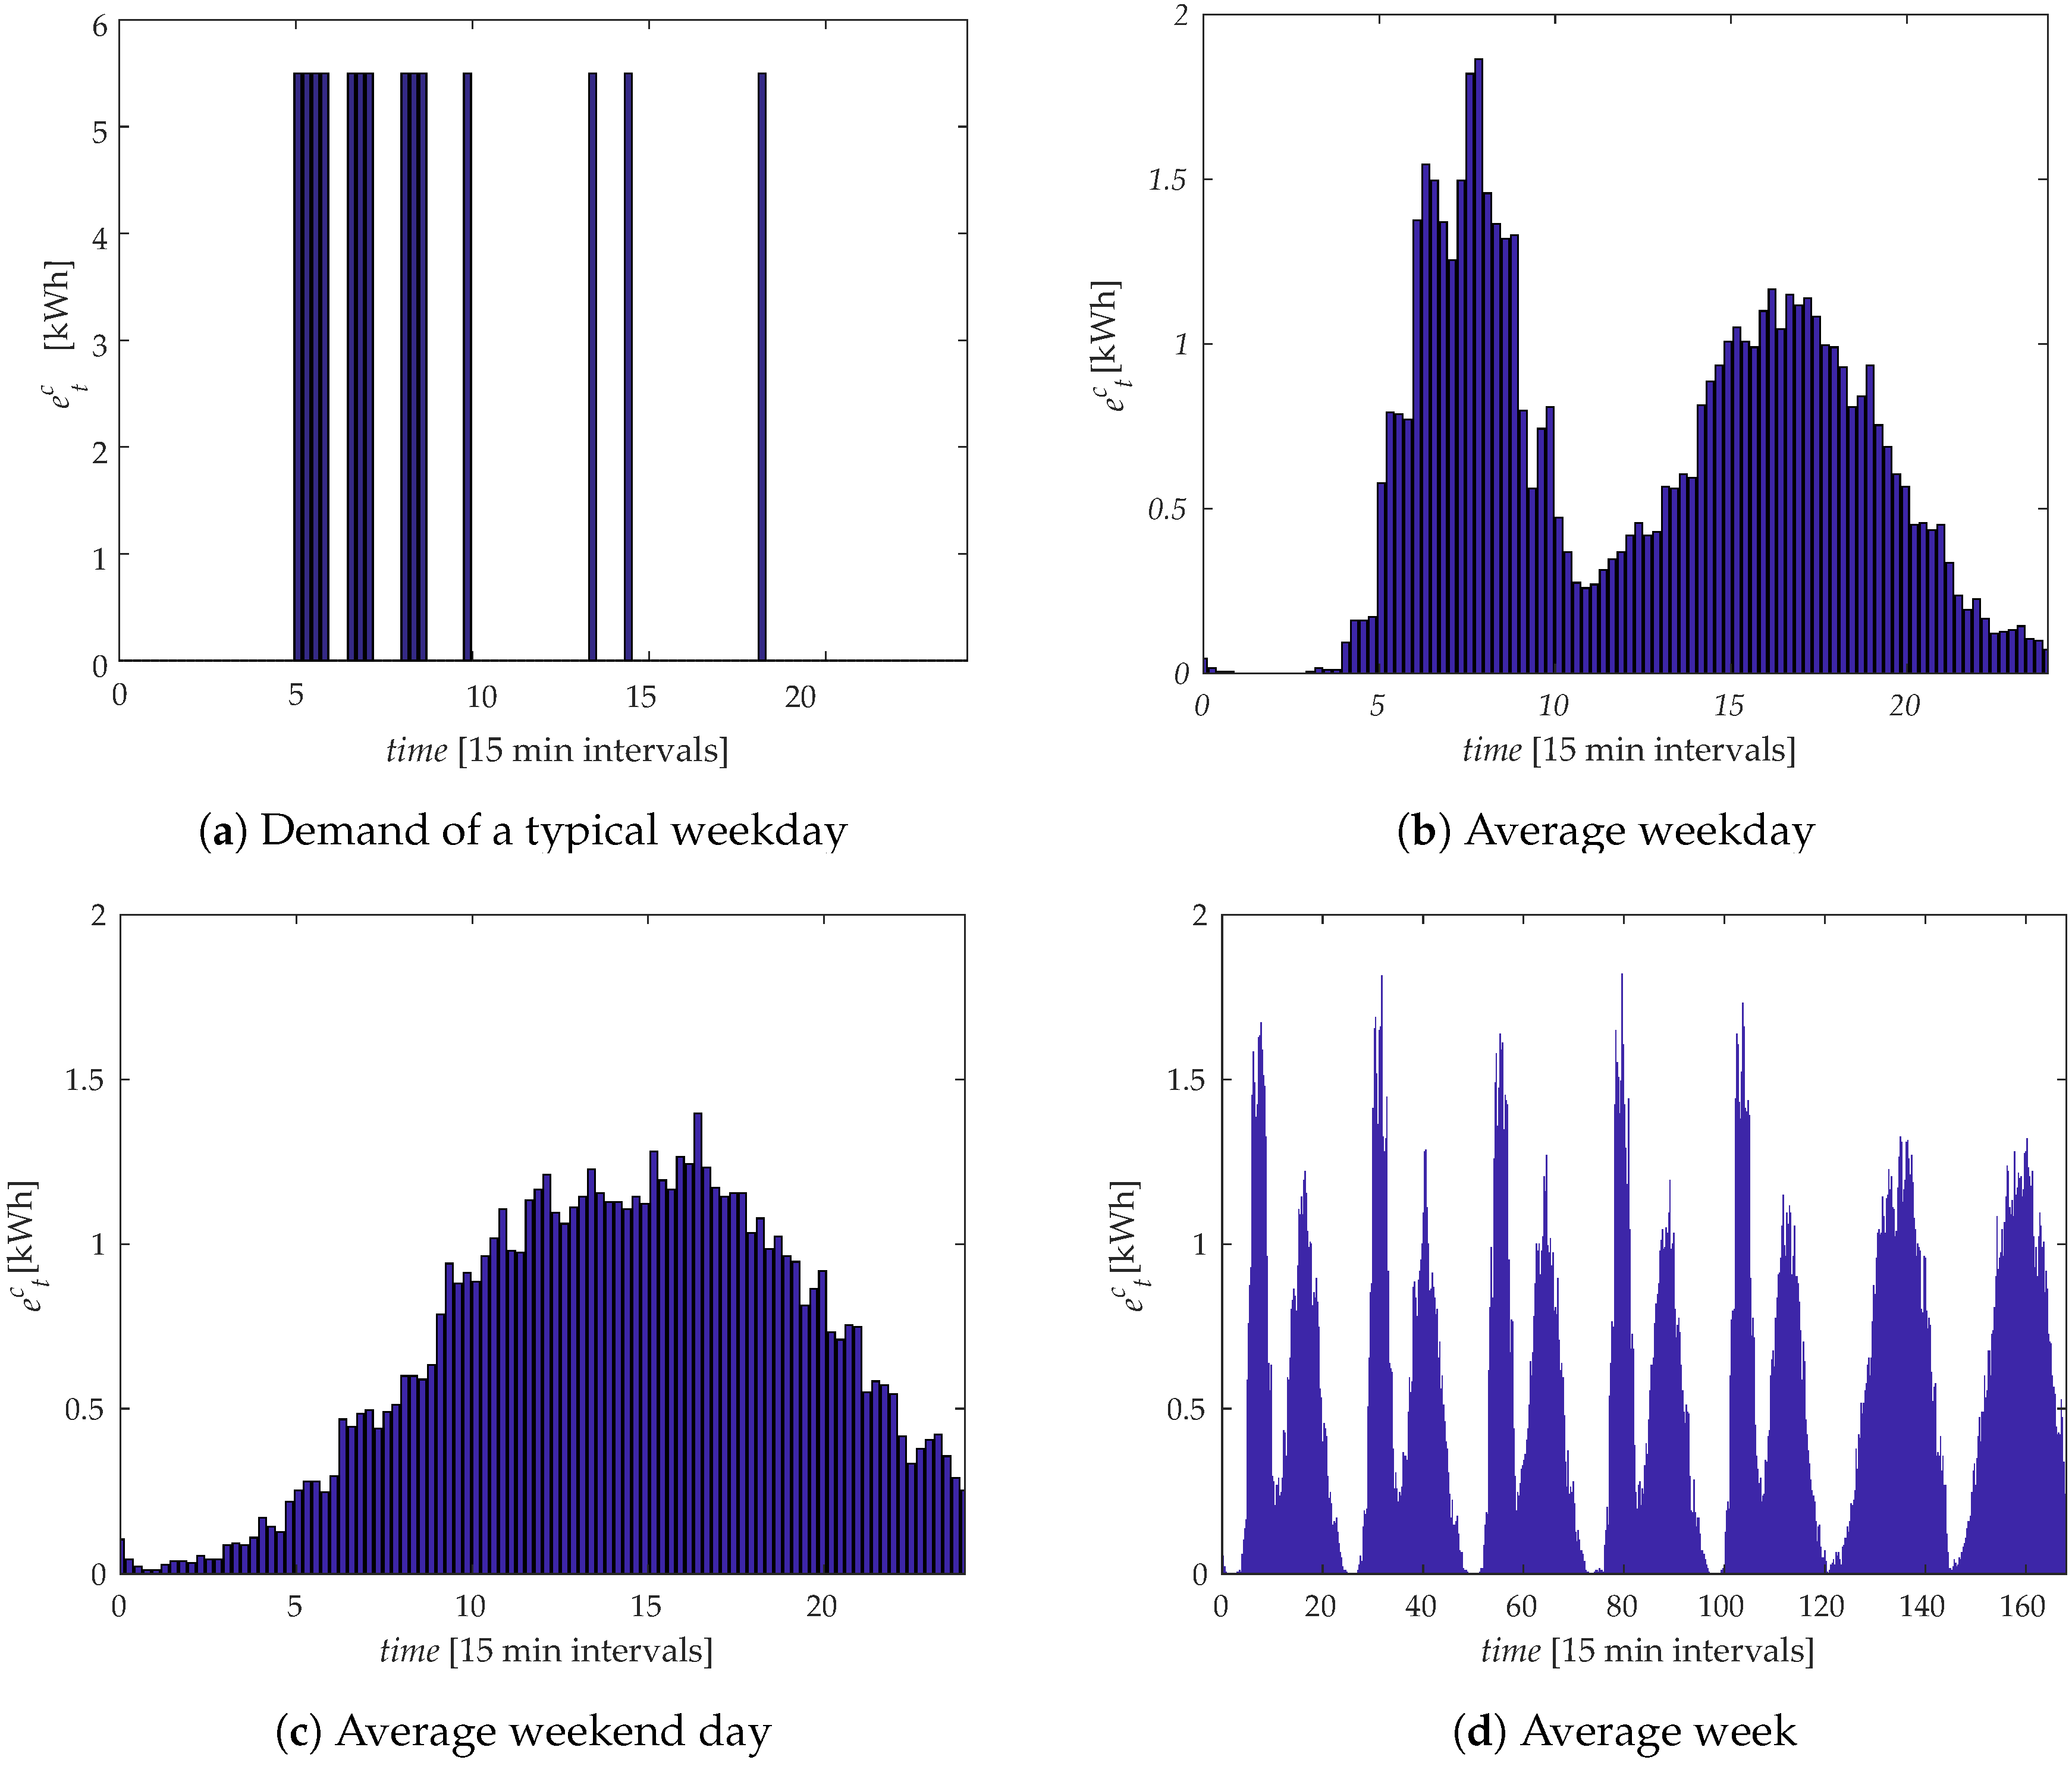
- A case study, simulating a 22 kW charging station in Vienna, Austria considering weekdays and weekends to show typical occupation together with load patterns is conducted.
- Finally, the charging pattern, the parameters’ variation, and the charging station operator’s (CSO) revenues are illustrated.
2. Methods
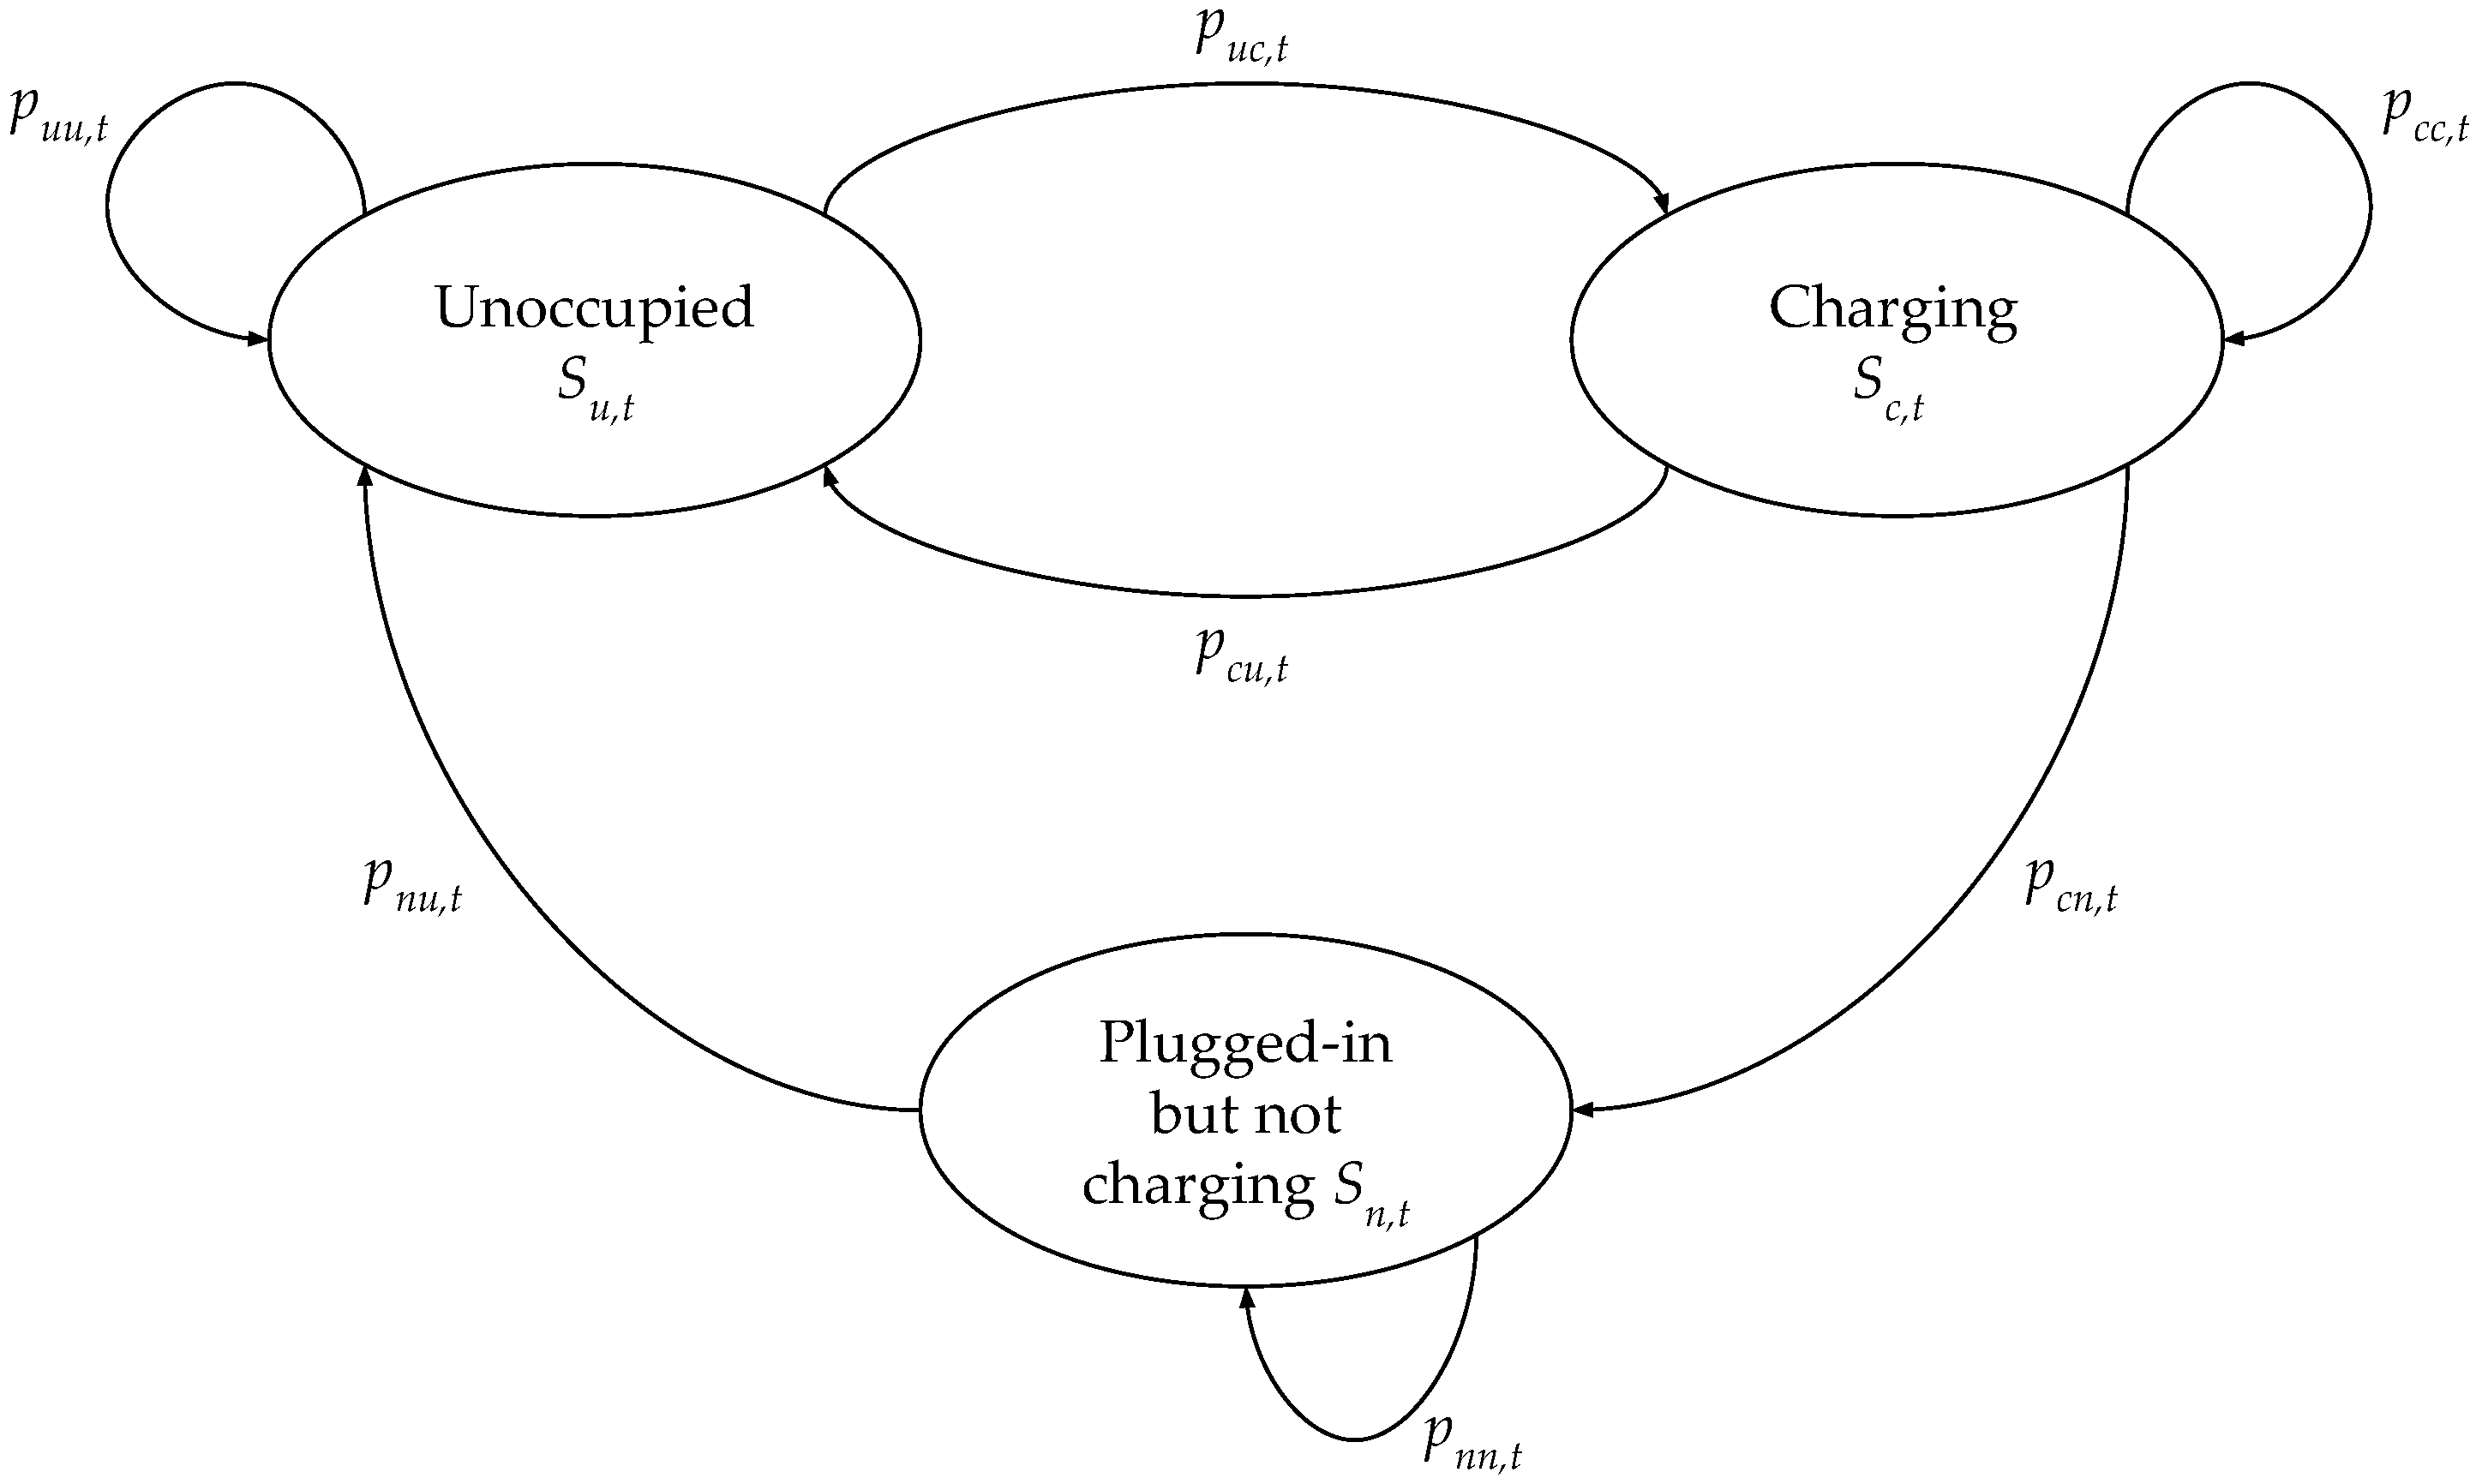
2.1. Markov Chain
- “Unoccupied” : No PEV is connected to the charger.
- “Charging” : A PEV is plugged-in to the station, and its battery is being charged (SOC < 100%).
- “Plugged-in but not charging” : A PEV is still plugged-in to the station, however, its battery has already been fully charged (SOC = 100%).
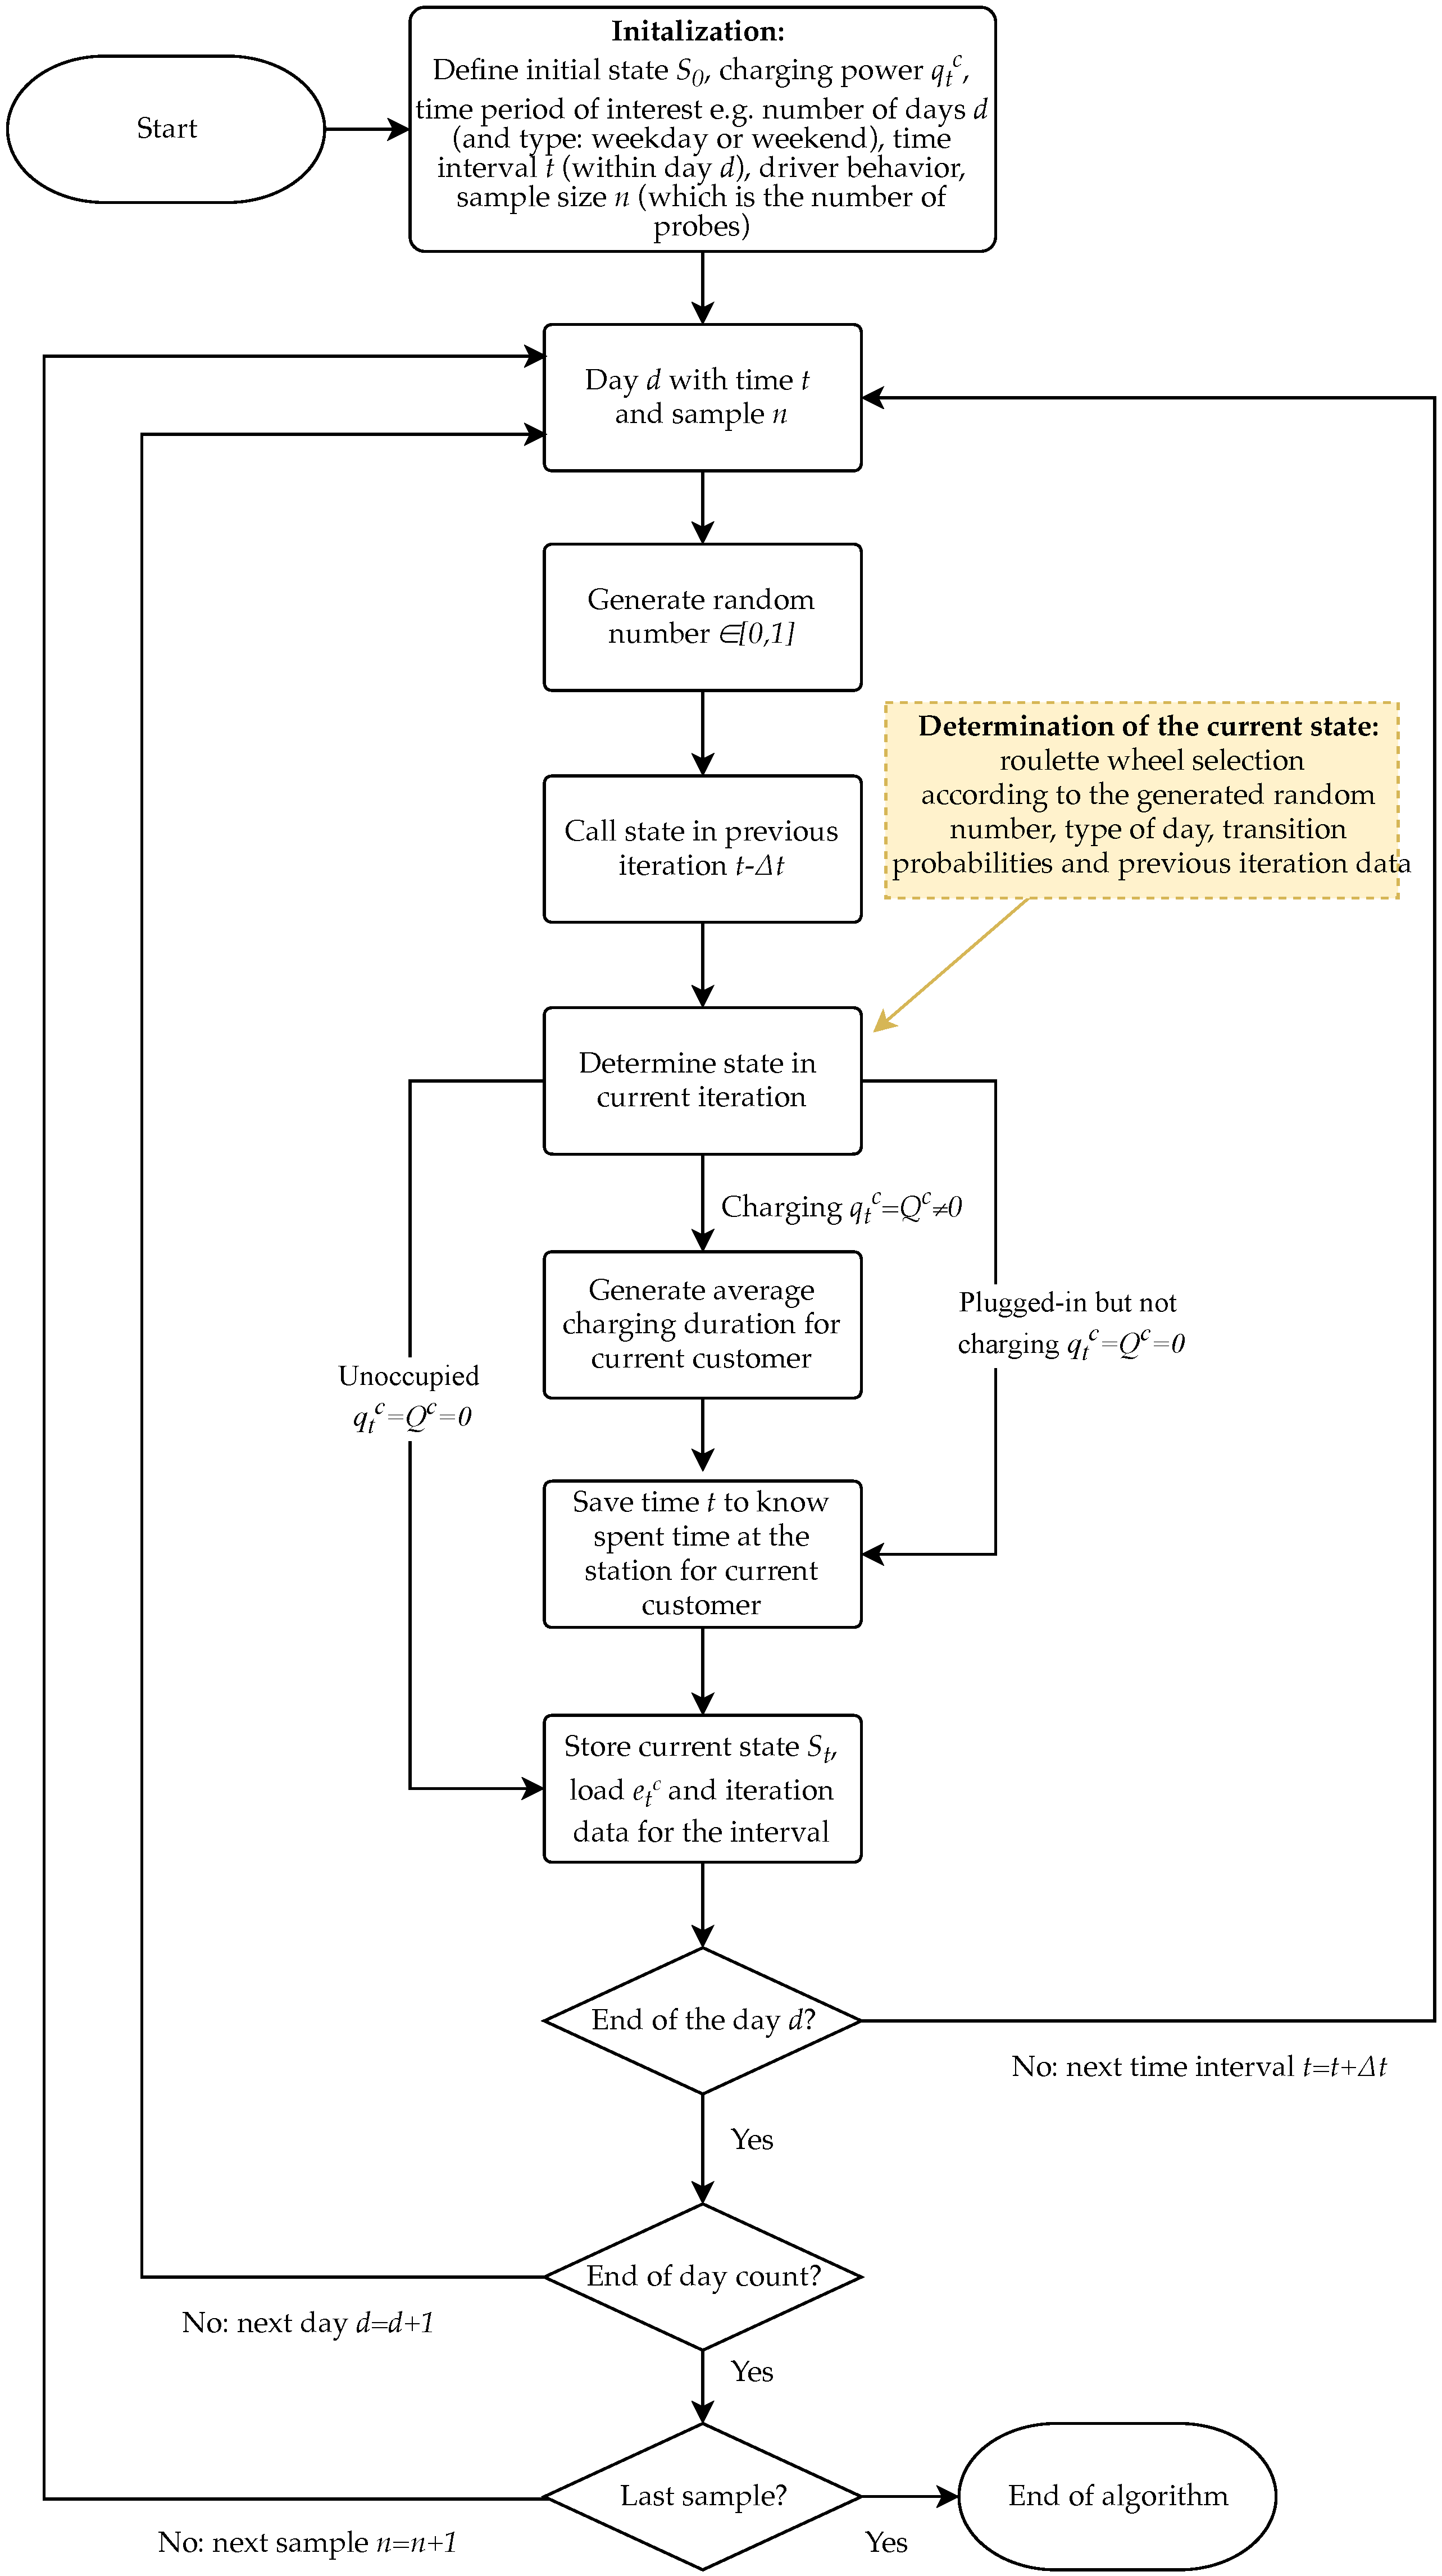
2.2. Algorithm for Describing the Charging Process
2.3. Revenues of the Charging Station Operator
3. Case Study
4. Results and Discussions
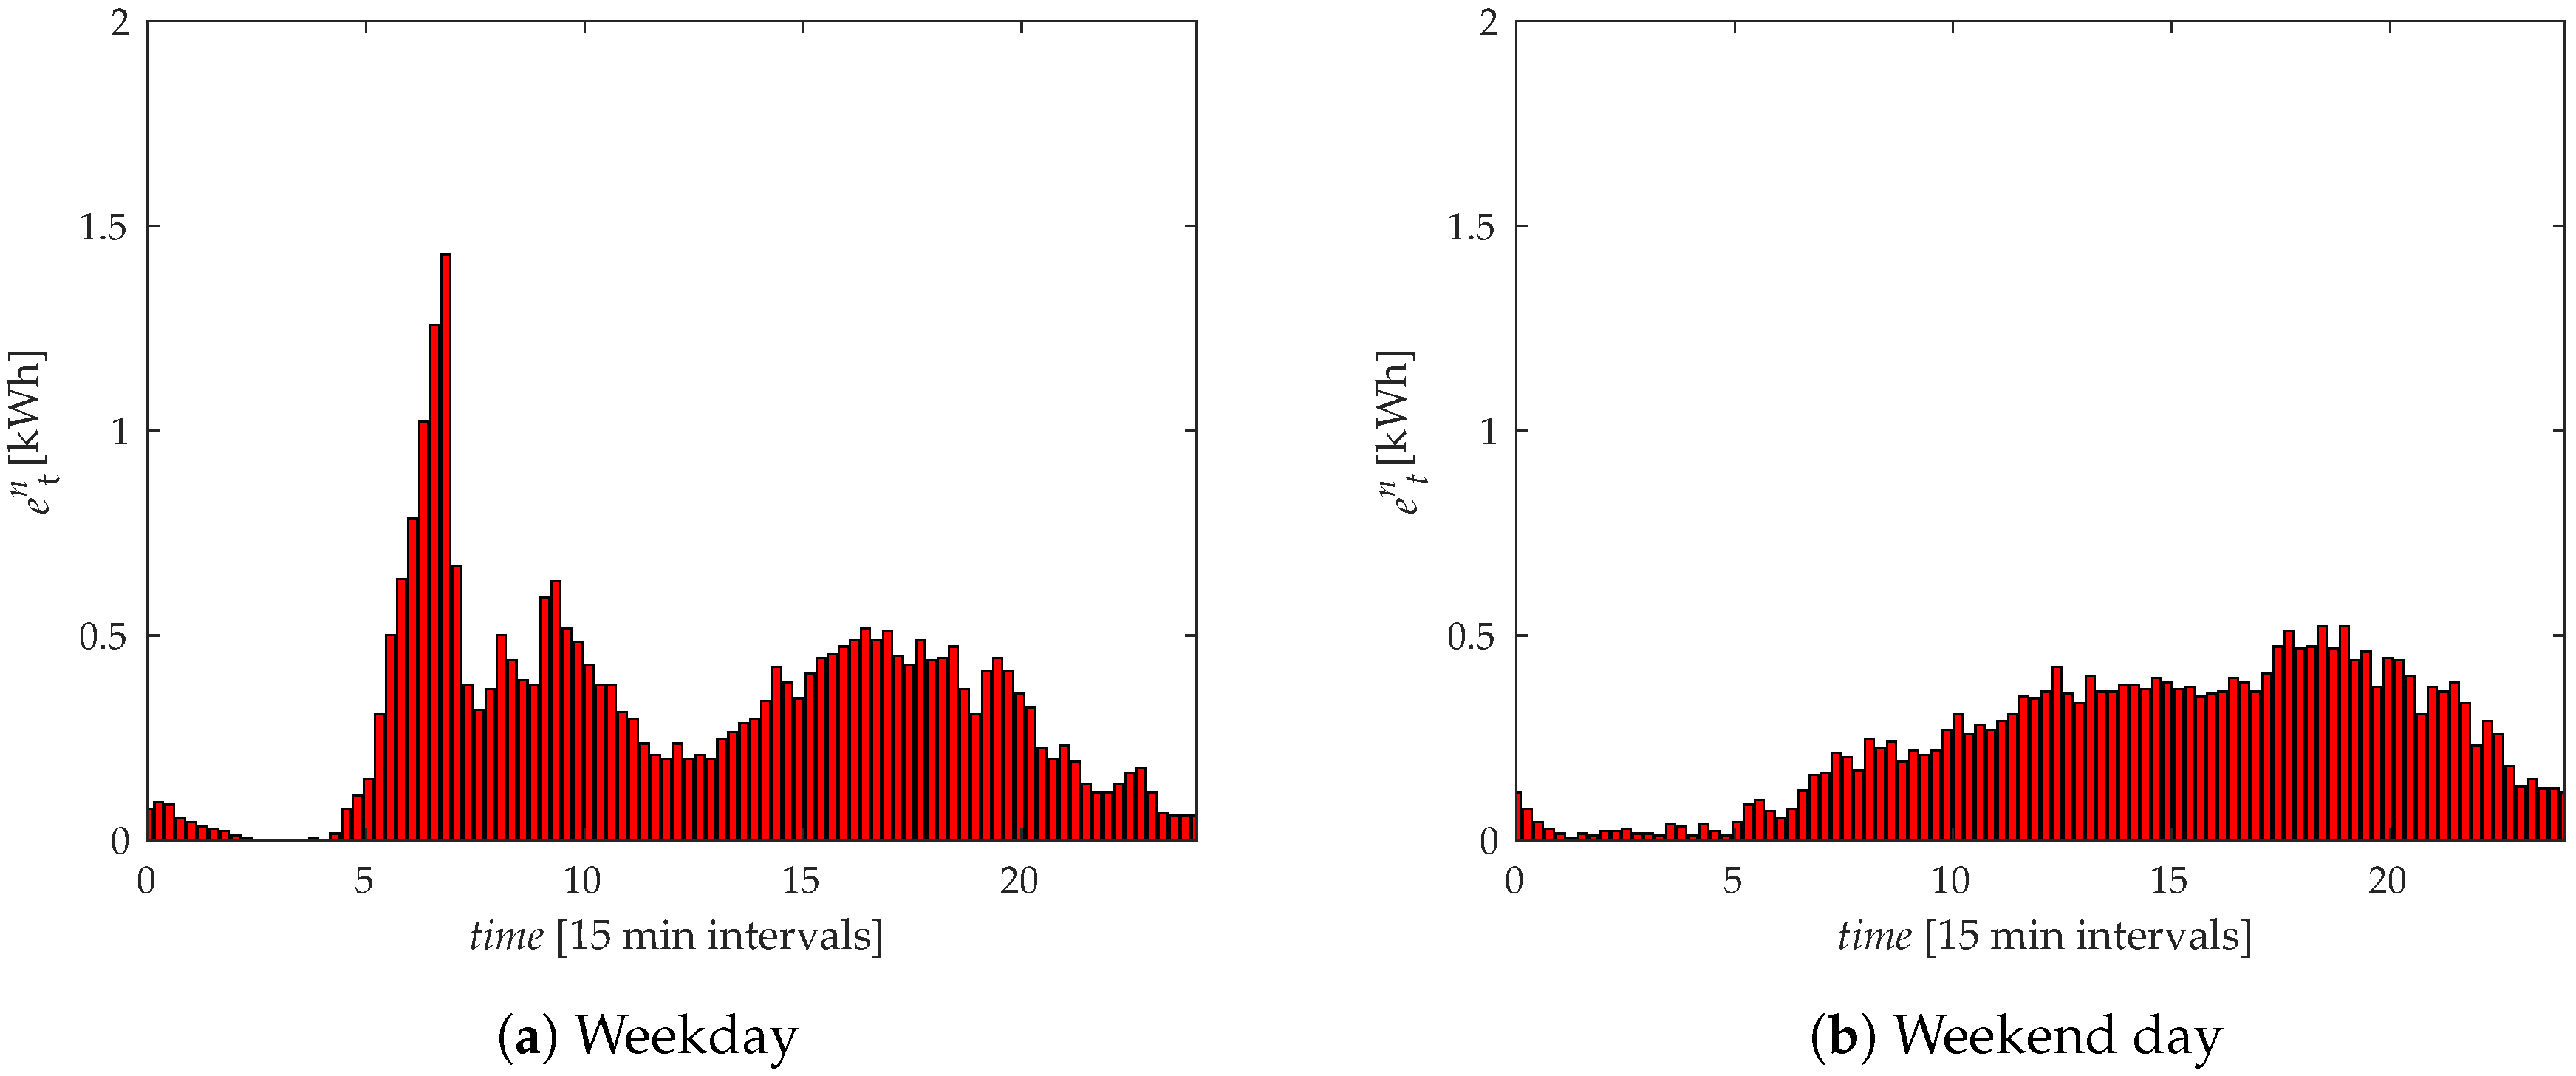
4.1. Verification of the Model
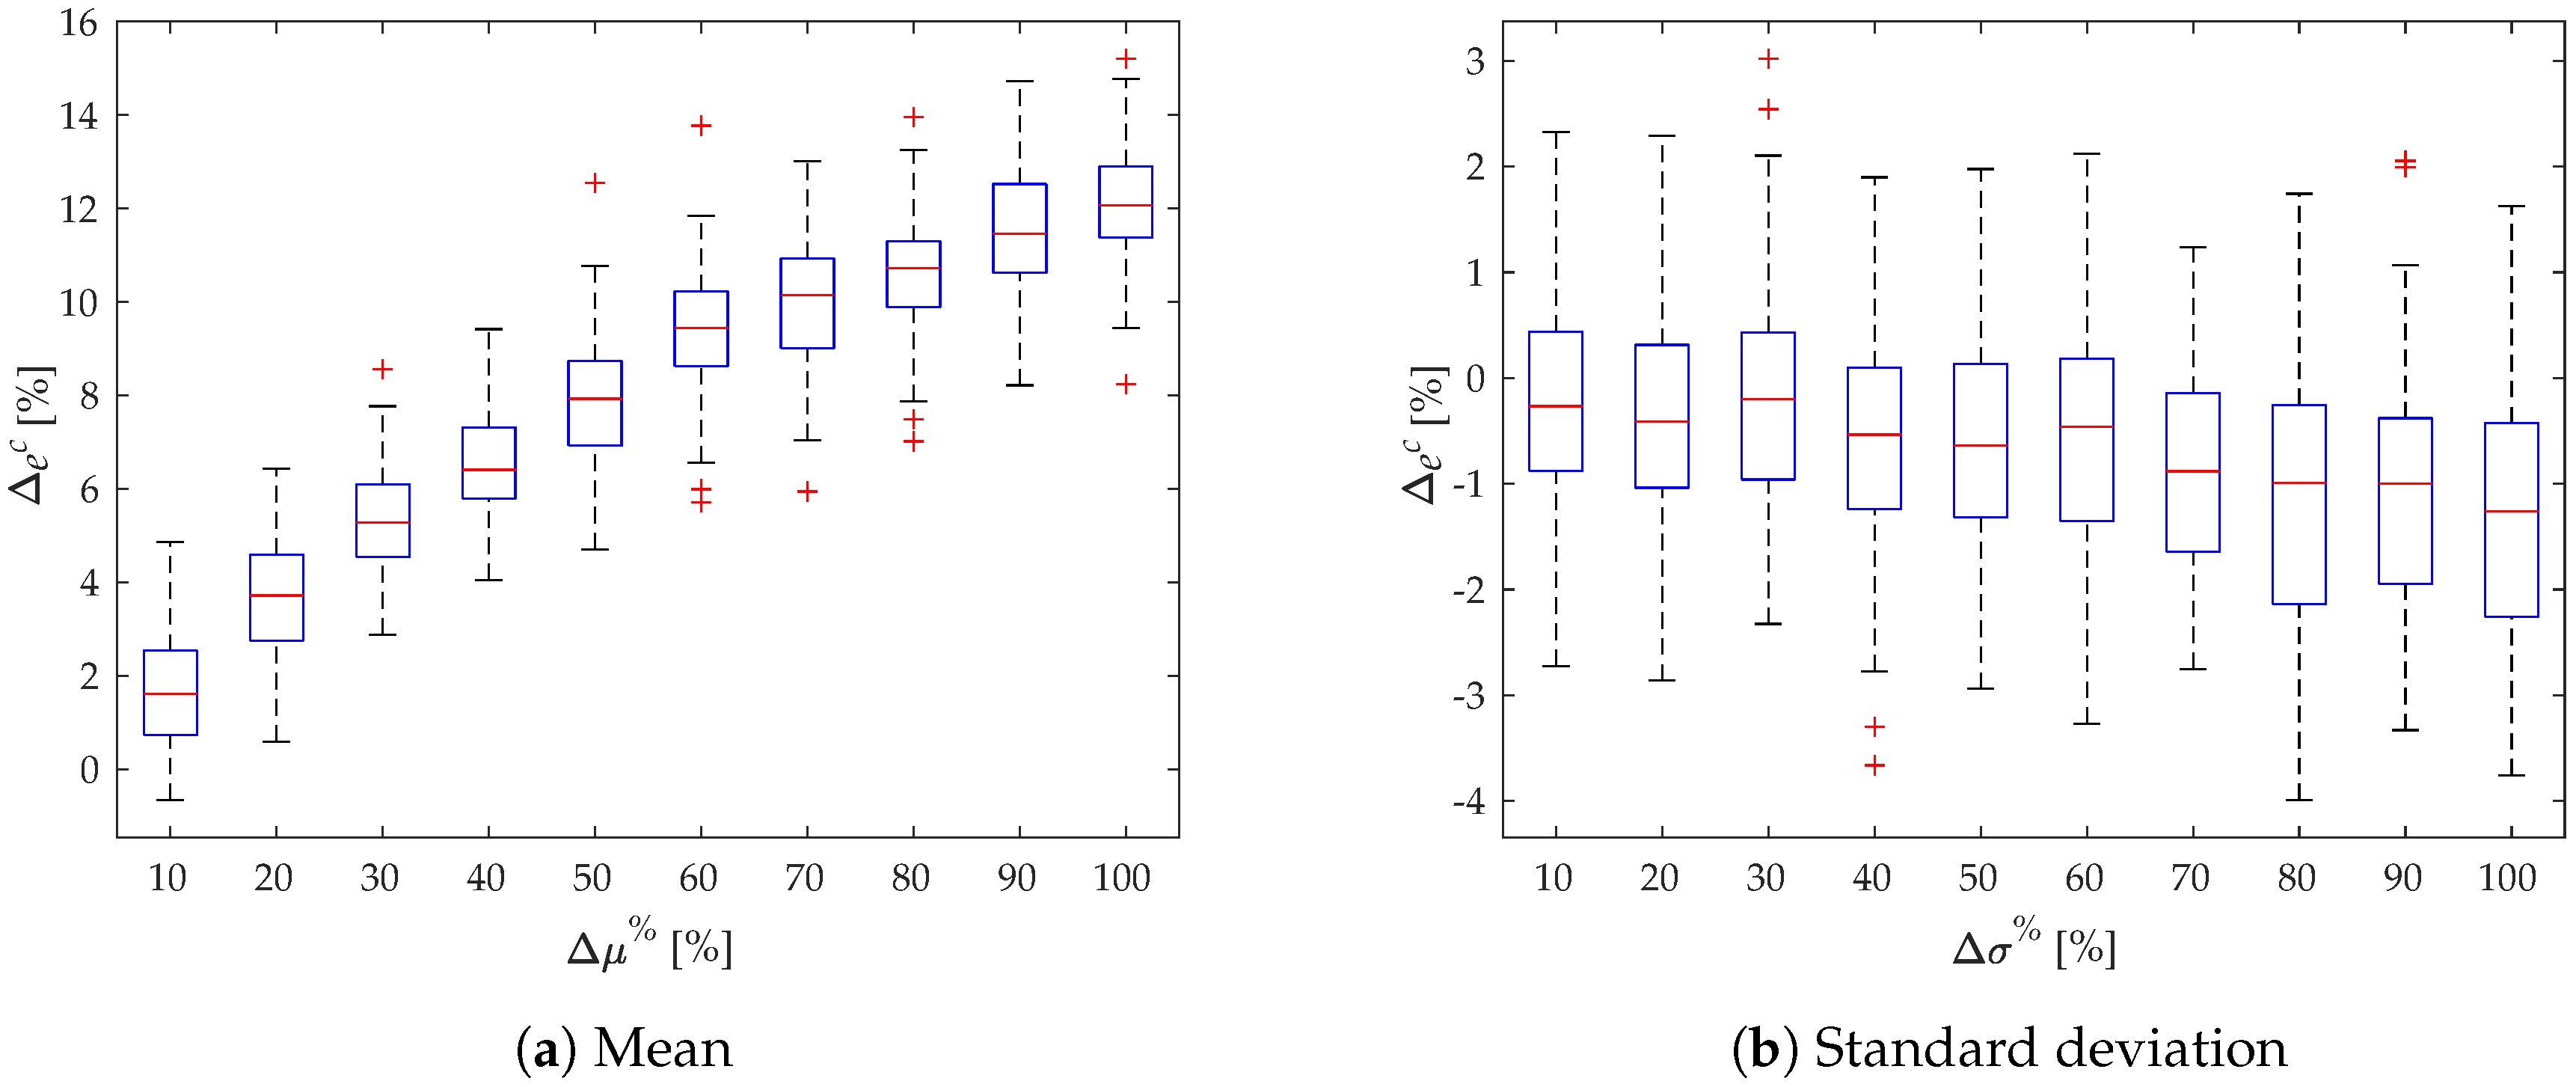
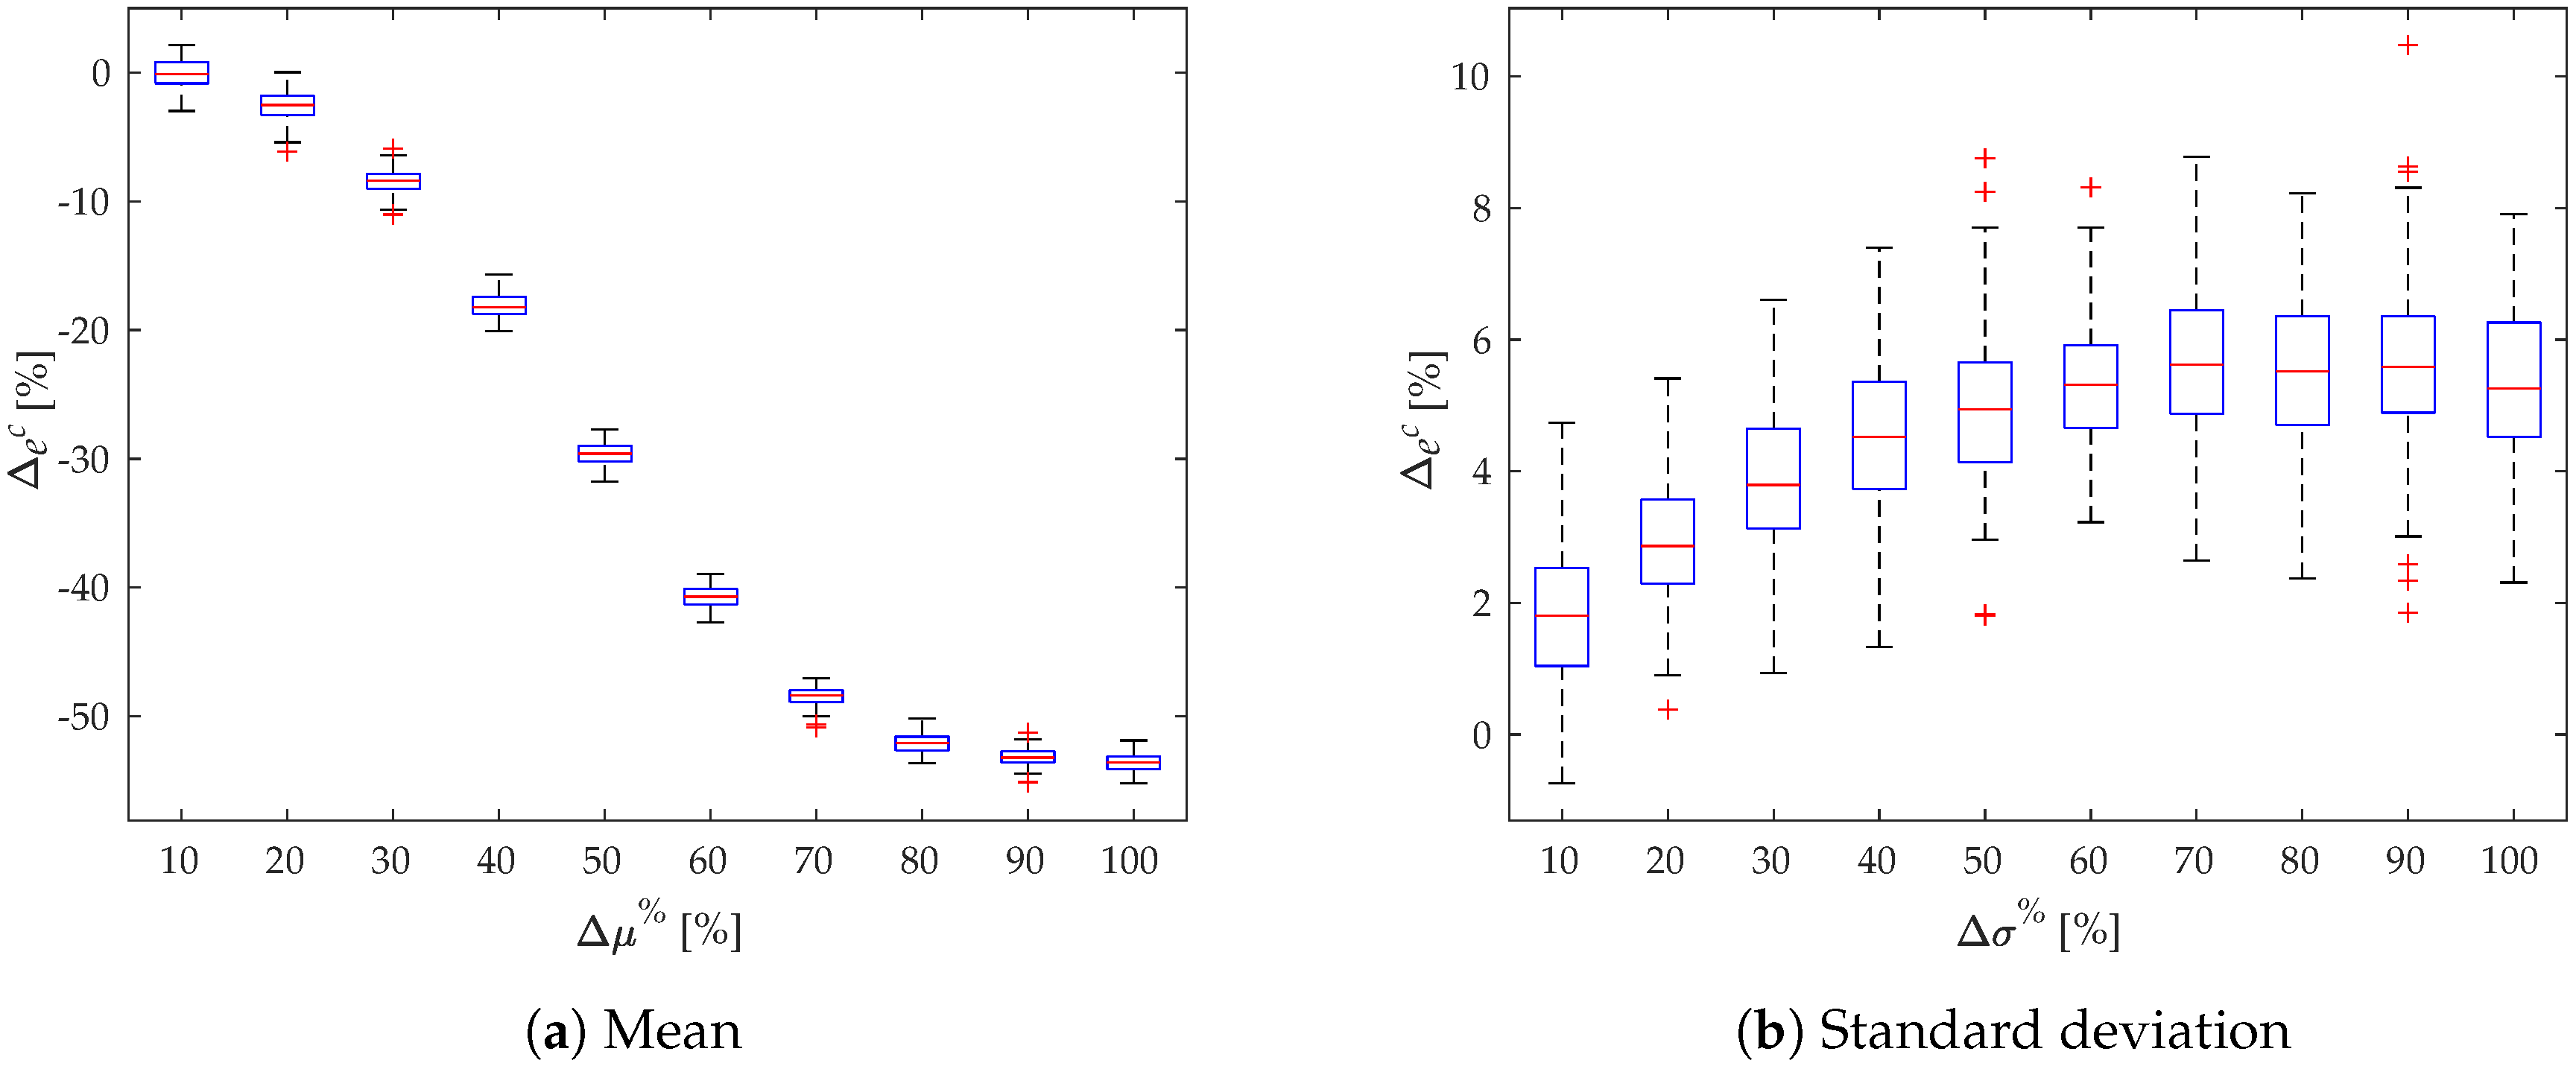
4.2. Sensitivity Analysis
- the mean and the deviation of the charging distribution;
- times of the PEV being plugged in; and
- the probabilities and within and beyond the average charging duration.
4.2.1. Sensitivity of the Charging Duration
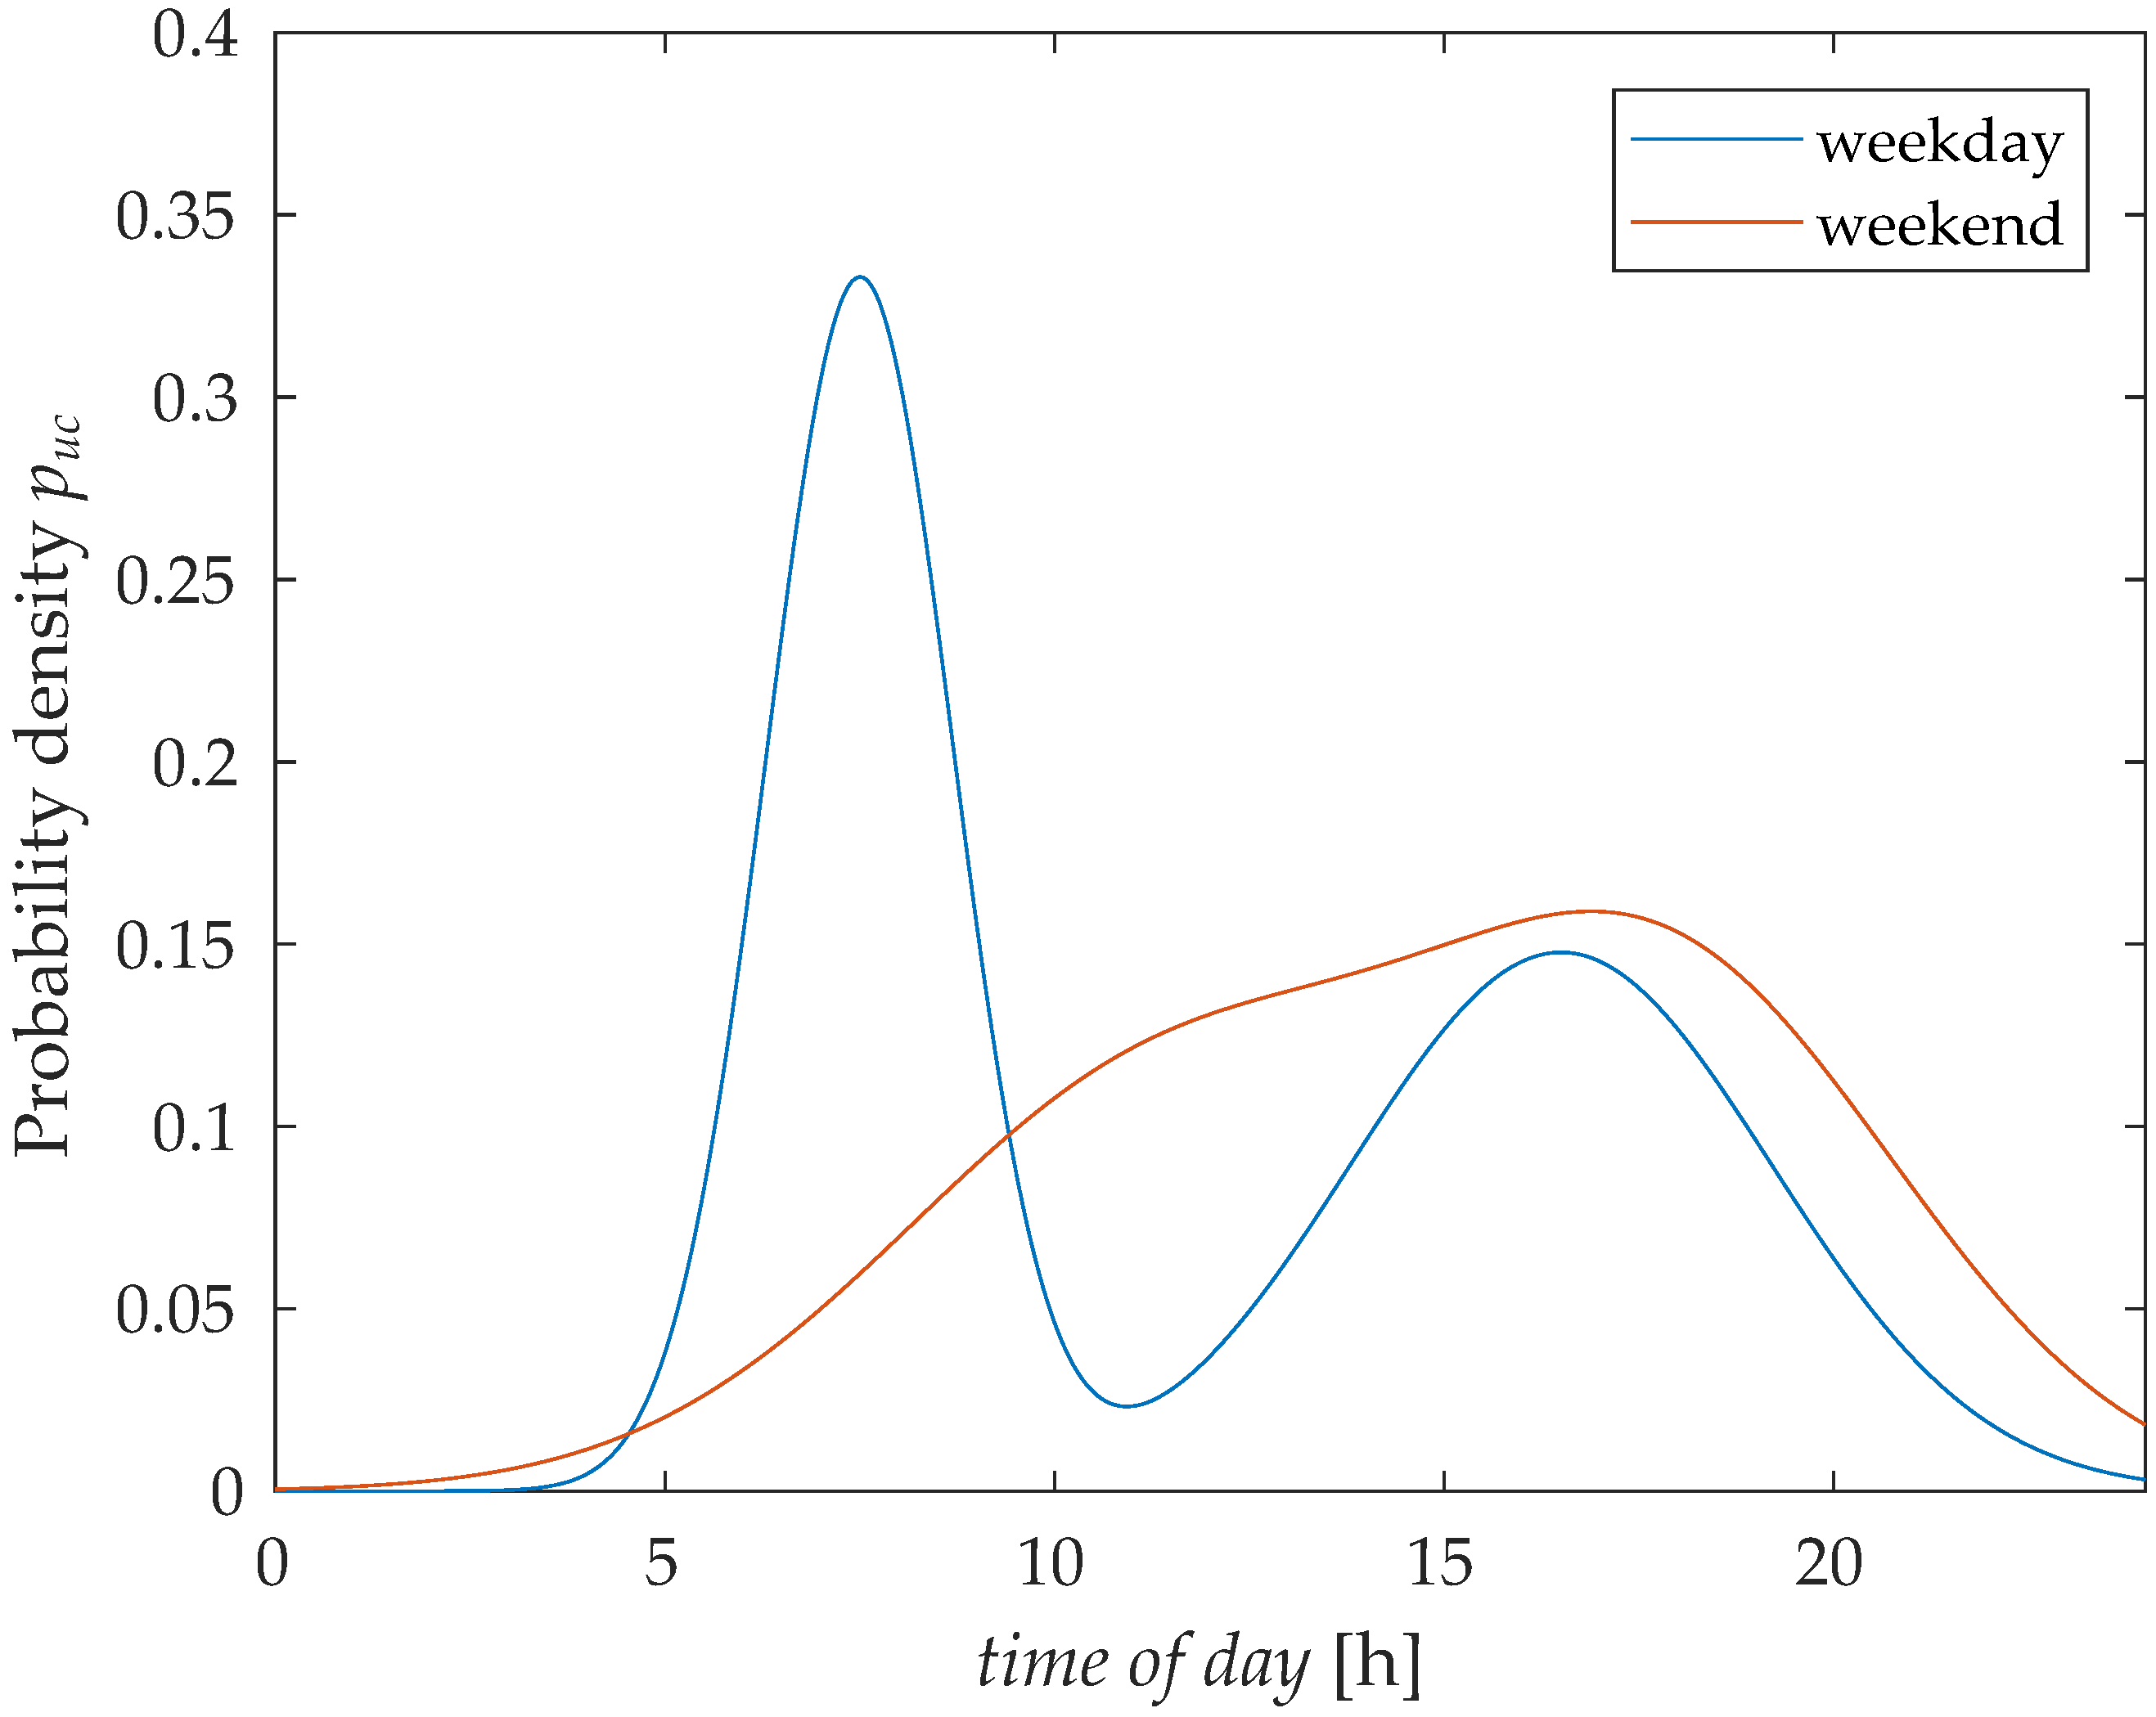
4.2.2. Sensitivity of the Plug-in Time
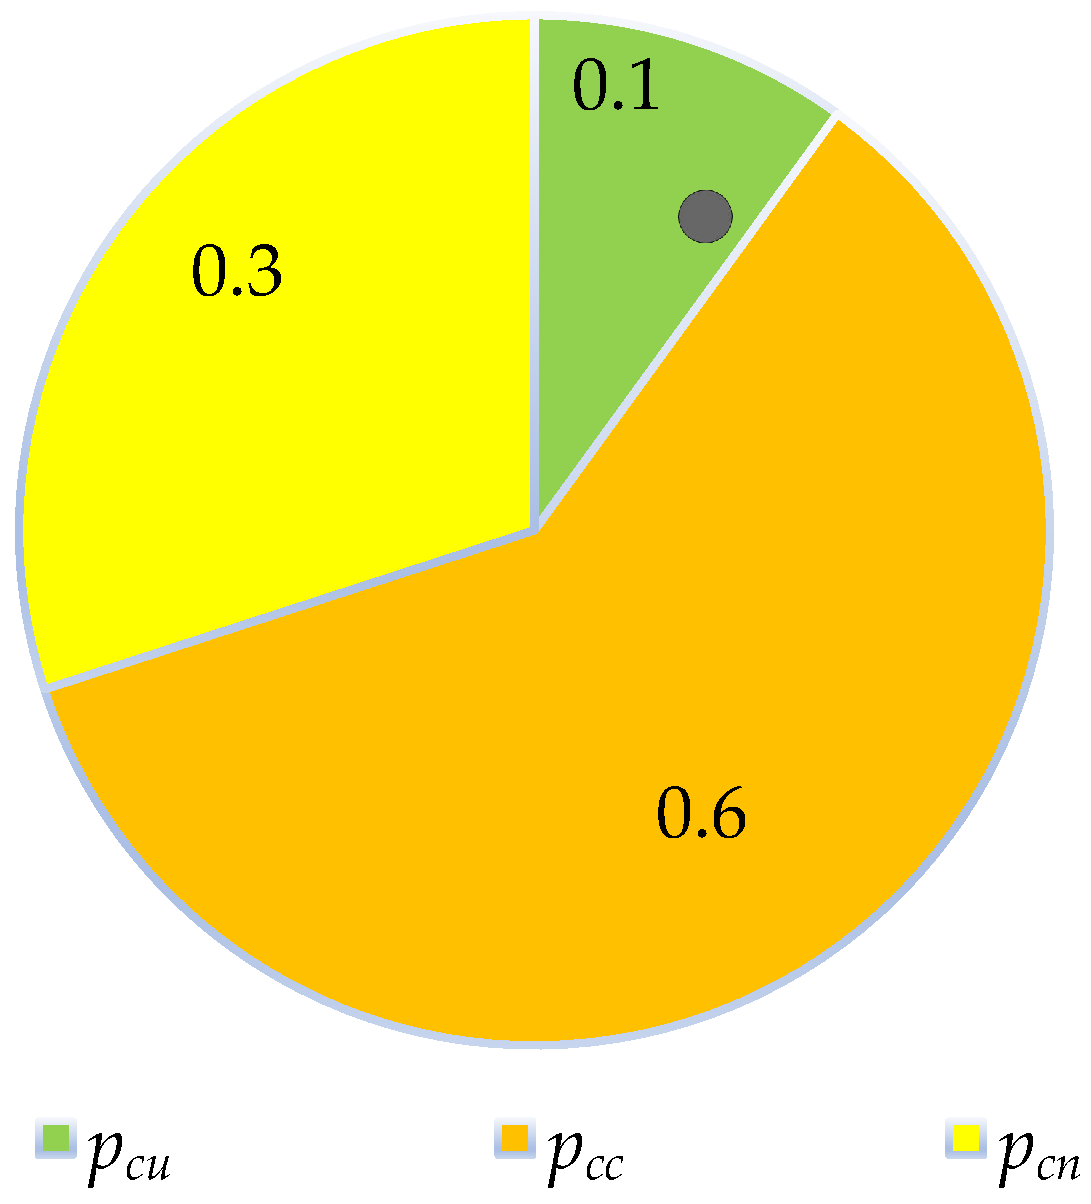
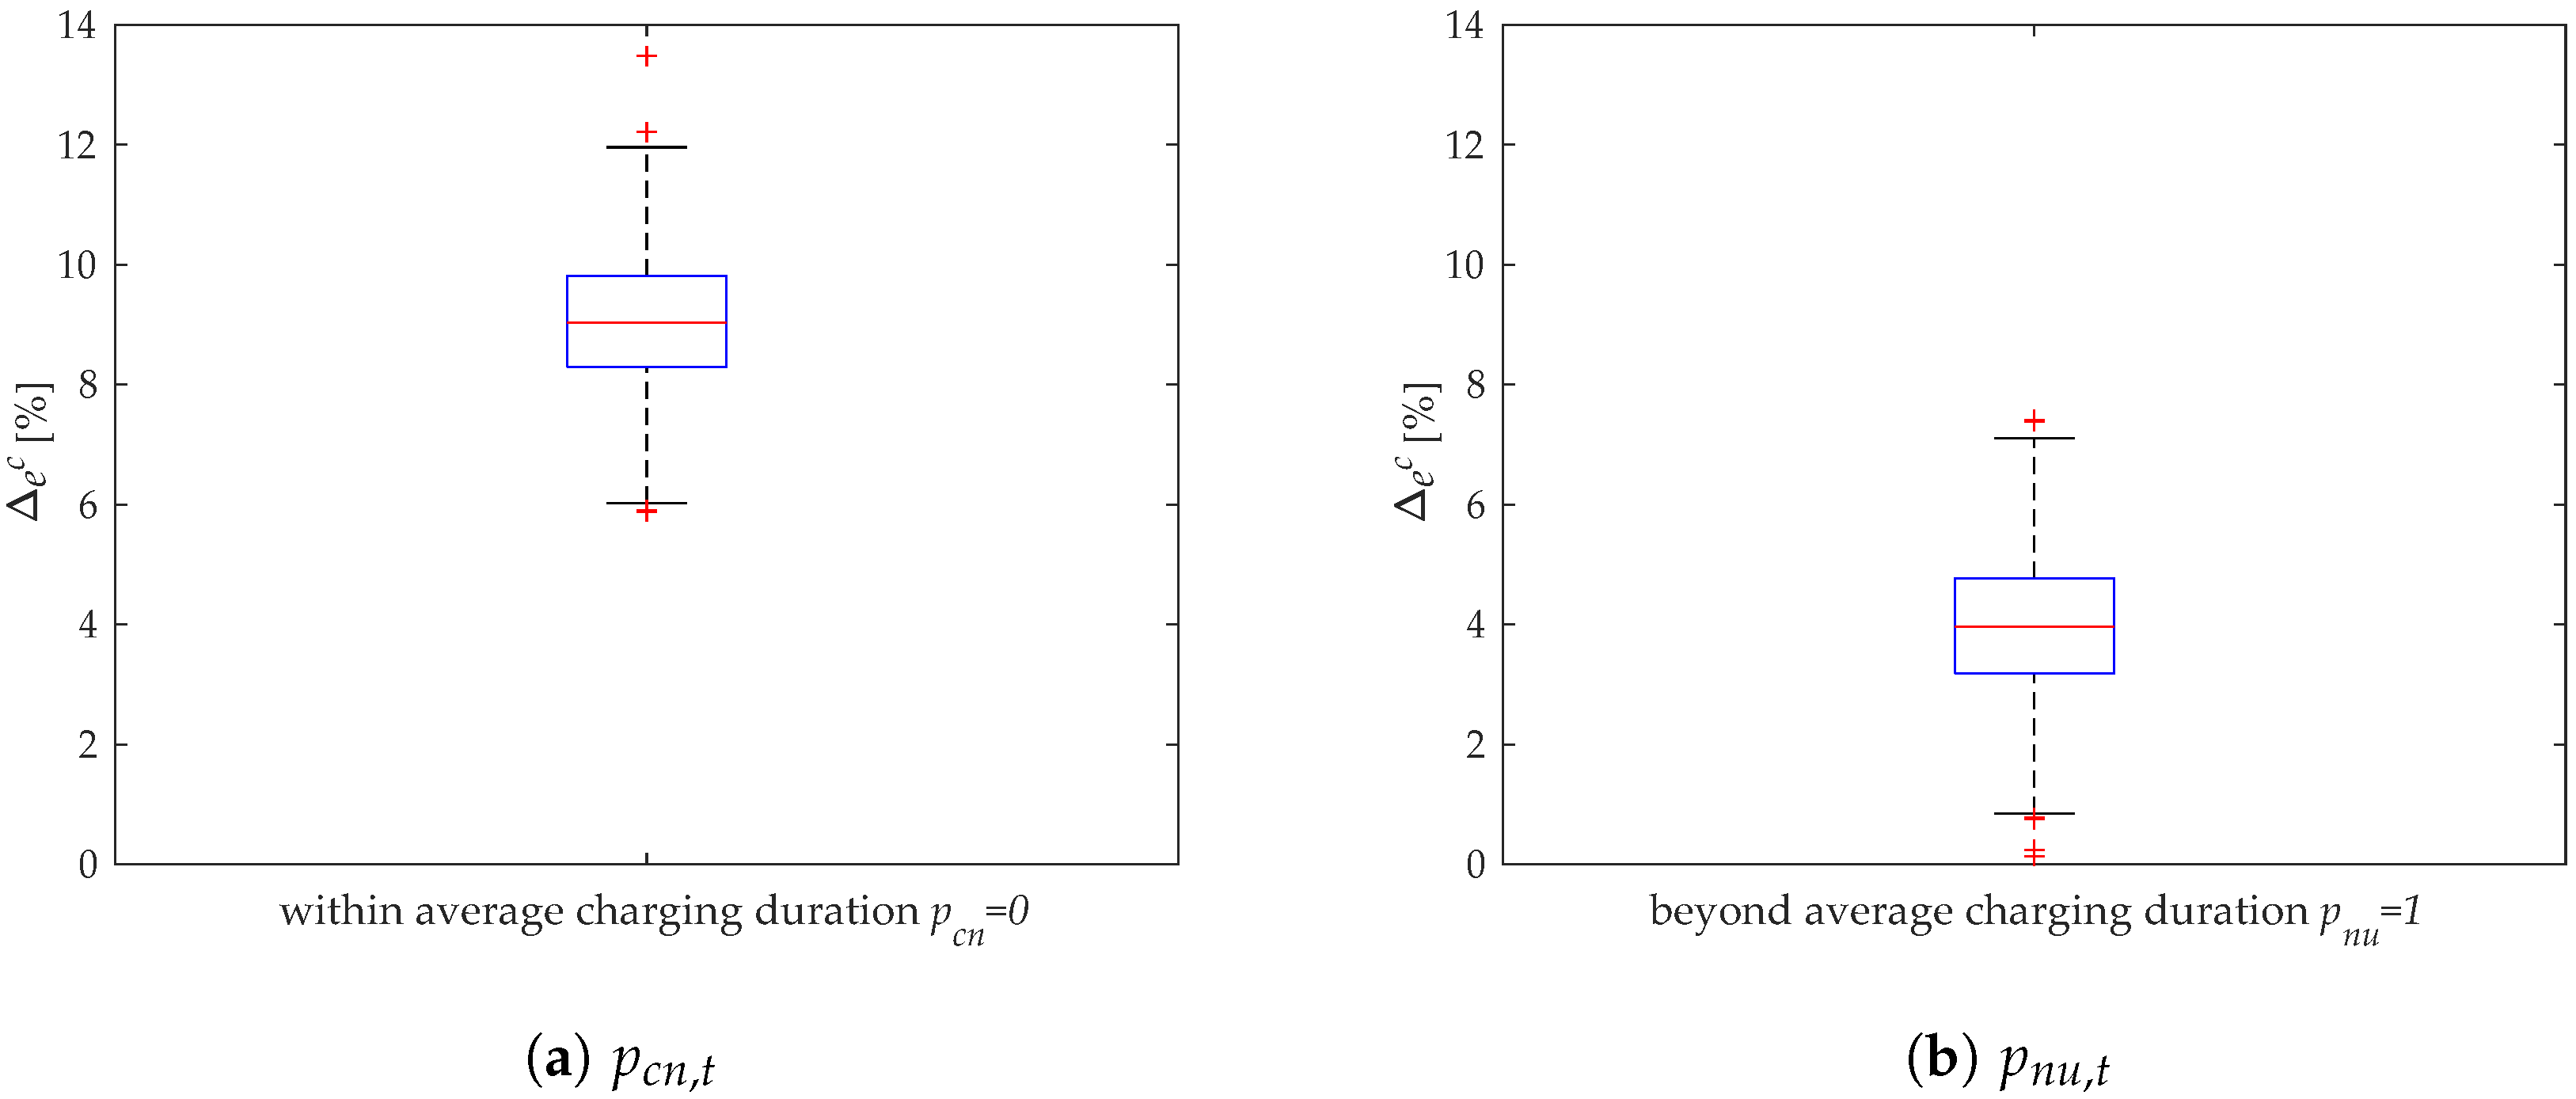
4.2.3. Sensitivity of the Probabilities ,
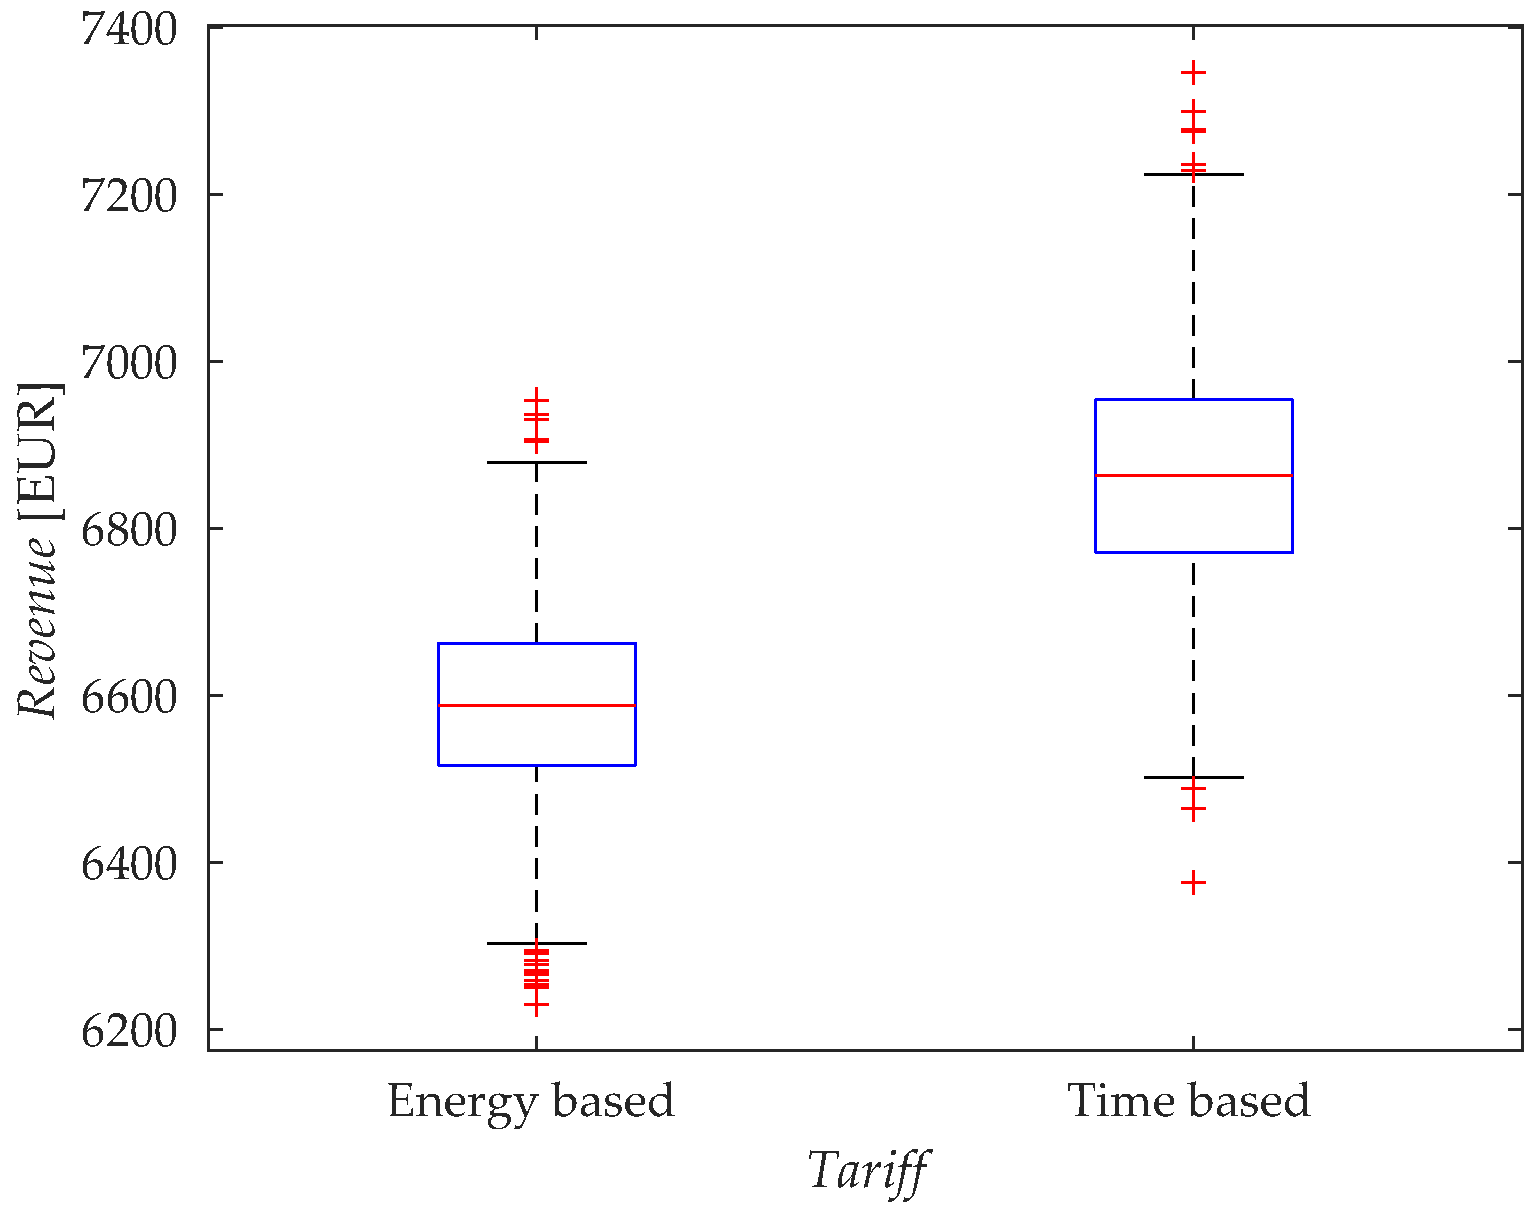
4.3. Monetary Impact of Different Tariff Designs to the Charging Station Operator
5. Conclusions
Author Contributions
Funding
Conflicts of Interest
Abbreviations
| AC | Alternating Current |
| CSO | Charging Station Operator |
| EV | Electric vehicle |
| PEV | Plug-in electric vehicles |
| PHEV | Plug-in hybrid electric vehicles |
| SOC | State of charge |
| ICE | Internal combustion engine |
| NHTS | National Household Travel Survey |
References
- European Commission. Electrification of the Transport System. Available online: ec.europa.eu/newsroom/horizon2020/document.cfm?doc_id=46368 (accessed on 21 July 2018).
- Yunus, K.; Parra, H.Z.D.L.; Reza, M. Distribution grid impact of Plug-In Electric Vehicles charging at fast charging stations using stochastic charging model. In Proceedings of the 2011 14th European Conference on Power Electronics and Applications, Birmingham, UK, 30 August–1 September 2011; pp. 1–11. [Google Scholar]
- MacDougall, W. Electromobility in Germany: Vision 2020 and Beyond; Technical Report; Germany Trade & Invest: Berlin, Germany, 2016. [Google Scholar]
- Bundesministerium für Verkehr, Innovation und Technologie. BMVIT—Gesamtverkehrsplan für Österreich. Available online: https://www.bmvit.gv.at/verkehr/gesamtverkehr/gvp/index.html (accessed on 21 July 2018).
- Wieland, T.; Reiter, M.; Schmautzer, E.; Fickert, L.; Fabian, J.; Schmied, R. Probabilistische Methode zur Modellierung des Ladeverhaltens von Elektroautos anhand gemessener Daten elektrischer Ladestationen—Auslastungsanalysen von Ladestationen unter Berücksichtigung des Standorts zur Planung von elektrischen Stromnetzen. e & i Elektrotechnik und Informationstechnik 2015, 132, 160–167. [Google Scholar] [CrossRef]
- Simer, A. Elektromobilität Österreich: Umweltargumente Stützen Investitionen ins Ladenetz. 2018. Available online: https://www.gtai.de/GTAI/Navigation/DE/Trade/Maerkte/suche,t=elektromobilitaet-oesterreich-umweltargumente-stuetzen-investitionen-ins-ladenetz,did=1887466.html (accessed on 20 July 2018).
- Litzlbauer, M. Erstellung und Modellierung von Stochastischen Ladeprofilen Mobiler Energiespeicher mit MATLAB; Technische Universität Wien: Vienna, Austria, 2009. [Google Scholar]
- Qian, K.; Zhou, C.; Allan, M.; Yuan, Y. Modeling of Load Demand Due to EV Battery Charging in Distribution Systems. IEEE Trans. Power Syst. 2011, 26, 802–810. [Google Scholar] [CrossRef]
- Pashajavid, E.; Golkar, M.A. Charging of plug-in electric vehicles: Stochastic modelling of load demand within domestic grids. In Proceedings of the 20th Iranian Conference on Electrical Engineering (ICEE 2012), Tehran, Iran, 15–17 May 2012; pp. 535–539. [Google Scholar]
- Yan, Q.; Qian, C.; Zhang, B.; Kezunovic, M. Statistical analysis and modeling of plug-in electric vehicle charging demand in distribution systems. In Proceedings of the 2017 19th International Conference on Intelligent System Application to Power Systems (ISAP), San Antonio, TX, USA, 17–20 September 2017; pp. 1–6. [Google Scholar]
- Grahn, P.; Alvehag, K.; Söder, L. Plug-in-vehicle mobility and charging flexibility Markov model based on driving behavior. In Proceedings of the 2012 9th International Conference on the European Energy Market, Florence, Italy, 10–12 May 2012; pp. 1–8. [Google Scholar]
- Grahn, P.; Munkhammar, J.; Widén, J.; Alvehag, K.; Söder, L. PHEV Home-Charging Model Based on Residential Activity Patterns. IEEE Trans. Power Syst. 2013, 28, 2507–2515. [Google Scholar] [CrossRef]
- Daina, N.; Sivakumar, A.; Polak, J.W. Modelling electric vehicles use: A survey on the methods. Renew. Sustain. Energy Rev. 2017, 68, 447–460. [Google Scholar] [CrossRef]
- Ligen, Y.; Vrubel, H.; Girault, H. Mobility from Renewable Electricity: Infrastructure Comparison for Battery and Hydrogen Fuel Cell Vehicles. World Electr. Veh. J. 2018, 9, 3. [Google Scholar] [CrossRef]
- Wang, S.; Meng, K.; Luo, F.; Xu, Z.; Zheng, Y. Stochastic collaborative planning method for electric vehicle charging stations. In Proceedings of the 2016 IEEE International Conference on Smart Grid Communications (SmartGridComm), Sydney, Australia, 6–9 November 2016; pp. 503–508. [Google Scholar]
- García-Villalobos, J.; Zamora, I.; San Martín, J.I.; Asensio, F.J.; Aperribay, V. Plug-in electric vehicles in electric distribution networks: A review of smart charging approaches. Renew. Sustain. Energy Rev. 2014, 38, 717–731. [Google Scholar] [CrossRef]
- Olivetti, E.A.; Ceder, G.; Gaustad, G.G.; Fu, X. Lithium-Ion Battery Supply Chain Considerations: Analysis of Potential Bottlenecks in Critical Metals. Joule 2017, 1, 229–243. [Google Scholar] [CrossRef]
- Moreira, C.; Lopes, J.P.; Almeida, P.R.; Seca, L.; Soares, F.J. A stochastic model to simulate electric vehicles motion and quantify the energy required from the grid. In Proceedings of the 17th Power Systems Computation Conference, Stockholm, Sweden, 22–26 August 2011. [Google Scholar]
- Kroese, D.P.; Rubinstein, R.Y. Monte Carlo methods. Wiley Interdiscip. Rev. Comput. Stat. 2012, 4, 48–58. [Google Scholar] [CrossRef]
- Leou, R.; Su, C.; Lu, C. Stochastic Analyses of Electric Vehicle Charging Impacts on Distribution Network. IEEE Trans. Power Syst. 2014, 29, 1055–1063. [Google Scholar] [CrossRef]
- Schroeder, A.; Traber, T. The economics of fast charging infrastructure for electric vehicles. Energy Policy 2012, 43, 136–144. [Google Scholar] [CrossRef]
- Wu, F.; Sioshansi, R. A stochastic flow-capturing model to optimize the location of fast-charging stations with uncertain electric vehicle flows. Transp. Res. Part D Transp. Environ. 2017, 53. [Google Scholar] [CrossRef]
- Varianten und Preise Der NISSAN LEAF 2018—Elektroauto. Available online: https://www.nissan.at/fahrzeuge/neuwagen/leaf/varianten-preise.html (accessed on 9 August 2018).
- Jiang, H.; Ren, H.; Sun, C.; Watts, D. The temporal-spatial stochastic model of plug-in hybrid electric vehicles. In Proceedings of the 2017 IEEE PES Innovative Smart Grid Technologies Conference Europe (ISGT-Europe), Torino, Italy, 26–29 September 2017; pp. 1–6. [Google Scholar]
- Fluhr, J.; Ahlert, K.; Weinhardt, C. A Stochastic Model for Simulating the Availability of Electric Vehicles for Services to the Power Grid. In Proceedings of the 2010 43rd Hawaii International Conference on System Sciences, Kauai, HI, USA, 5–8 January 2010; pp. 1–10. [Google Scholar]
- Tanke Wien Energie Tarifübersicht. Available online: https://www.tanke-wienenergie.at/tarifuebersicht/ (accessed on 28 August 2018).


| Witgin Average Duration | Overnight | Morning Rush | Working Hours | Evening Commute | Evening | Weekend |
| 0.6 | 0.45 | 0.5 | 0.6 | 0.6 | 0.6 | |
| 0.1 | 0.45 | 0.4 | 0.3 | 0.1 | 0.3 | |
| 0.3 | 0.1 | 0.1 | 0.1 | 0.3 | 0.1 | |
| 0.7 | 0.6 | 0.6 | 0.6 | 0.7 | 0.6 | |
| 0.3 | 0.4 | 0.4 | 0.4 | 0.3 | 0.4 | |
| Beyond Average Duration | Overnight | Morning Rush | Working Hours | Evening Commute | Evening | Weekend |
| 0.3 | 0.2 | 0.2 | 0.2 | 0.3 | 0.2 | |
| 0.1 | 0.5 | 0.3 | 0.3 | 0.1 | 0.3 | |
| 0.6 | 0.3 | 0.5 | 0.5 | 0.6 | 0.5 | |
| 0.7 | 0.3 | 0.7 | 0.4 | 0.4 | 0.4 | |
| 0.3 | 0.7 | 0.3 | 0.6 | 0.6 | 0.6 |
© 2018 by the authors. Licensee MDPI, Basel, Switzerland. This article is an open access article distributed under the terms and conditions of the Creative Commons Attribution (CC BY) license (http://creativecommons.org/licenses/by/4.0/).
Share and Cite
Sokorai, P.; Fleischhacker, A.; Lettner, G.; Auer, H. Stochastic Modeling of the Charging Behavior of Electromobility. World Electr. Veh. J. 2018, 9, 44. https://doi.org/10.3390/wevj9030044
Sokorai P, Fleischhacker A, Lettner G, Auer H. Stochastic Modeling of the Charging Behavior of Electromobility. World Electric Vehicle Journal. 2018; 9(3):44. https://doi.org/10.3390/wevj9030044
Chicago/Turabian StyleSokorai, Peter, Andreas Fleischhacker, Georg Lettner, and Hans Auer. 2018. "Stochastic Modeling of the Charging Behavior of Electromobility" World Electric Vehicle Journal 9, no. 3: 44. https://doi.org/10.3390/wevj9030044
APA StyleSokorai, P., Fleischhacker, A., Lettner, G., & Auer, H. (2018). Stochastic Modeling of the Charging Behavior of Electromobility. World Electric Vehicle Journal, 9(3), 44. https://doi.org/10.3390/wevj9030044